ORGANISATION MONDIALE DE LA SANTE · Ce document n 'est pas destine a etre distribue au grand...
24
OISTR. OISTR. LIMITED LIMITEE WORLD HEALTH ORGANIZATION ORGANISATION MONDIALE DE LA SANTE EXPERT COMMITTEE ON BIOLOGICAL STANDARDIZATION BS/95.1804 Geneva. 17 to 24 October 1995 ENGLISH ONL y REPORT ON AN INTERNATIONAL COLLABORATIVE STUDY TO CALIBRATE THE 1ST INTERNATIONAL STANDARD FOR PROTEIN S, PLASMA (93/590) " Anthony R Hubbard Division of Haematology National Institute for Biological Standards and Control Potters Bar, Hertfordshire, EN6 3QG, UK SUMMARY An international collaborative study, involving 16 laboratories, was organised to calibrate the proposed 1 st International Standard Protein S, plasma (93/590) for both total and free Protein S antigen and for Protein S function by assay against locally collected fresh normal plasma pools. A freeze-dried Protein S deficient plasma was also included in the assays, not as a candidate reference preparation, but to allow the assessment of inter-Iaboratory variability independently of the fresh normal plasma pools. The overall mean potencies for the proposed 1st International Standard Protein Sf plasma (93/590) were as follows: total Protein S antigen -0.891U per ampoule; free Protein S antigen -0.89 IU per ampoule; Protein S function -0.92 IU per ampoule. It is proposed that the 1st International Standard is assigned a single combined potency of 0.90 IU per ampoule to cover all three parameters. INTRODUCTION Protein S is a cofactor for the anticoagulant function of activated Protein C in plasma (1 ). Deficiency of plasma Protein S is associated with recurrent venous thrombosis and therefore measurement of plasma Protein S is routinely carried out in cases of unexplained thrombophilia. Protein S exists in two forms in plasma being either complexed with the C4b-binding protein (C4bBP) or in free solution (2); only free Protein S acts as a cofactor for activated Protein C (3). Laboratories routinely estimate both total Protein S antigen (C4bBP bound and free Protein S) as well as free Protein S antigen and Protein S function. Quantitation is mainly Ce document n 'est pas destine a etre distribue au grand public et tous les droits V afferents sont reserves par l'Organisation mondiale de la Sante (OMS). 11 ne peut etre commente, resume, cite, r~produit ou traduit, partiellement ou en totalite, sans une autorisation prealable ecrite de I'OMS. Aucune partie ne doit etre chargee dans un svsteme de recherche documentaire ou diffusee sous quelque forme ou par quelque moven que ce soit .electronique, mecanique, ou autre. sans une autorisation prealable ecrite de I'OMS. This document is not issued to the general public. and all rights are reserved by the World Health Organization (WH O) .The document may not be reviewed. abstracted. quoted. reproduced or translated, in part or in whole, without the prior written permission of WHO. No part of this document may be stored in a retrieval system or transmitted in any form or by any means. electronic, mechanical or other. without the prior written permission of WHO. Les opinions exprimees dans les documents par des auteurs cite! nommement n 'engagent que lesdits auteurs. The views expressed in documents by named authors are solely the responsibility of those authors.
Transcript of ORGANISATION MONDIALE DE LA SANTE · Ce document n 'est pas destine a etre distribue au grand...

OISTR.
OISTR.
LIMITED
LIMITEEWORLD HEALTH ORGANIZATION
ORGANISATION MONDIALE DE LA SANTE
EXPERT COMMITTEE ON BIOLOGICAL STANDARDIZATION BS/95.1804
Geneva. 17 to 24 October 1995 ENGLISH ONL y
REPORT ON AN INTERNATIONAL COLLABORATIVE STUDY TO CALIBRATETHE 1ST INTERNATIONAL STANDARD FOR PROTEIN S, PLASMA (93/590)
"
Anthony R HubbardDivision of Haematology
National Institute for Biological Standards and ControlPotters Bar, Hertfordshire, EN6 3QG, UK
SUMMARY
An international collaborative study, involving 16 laboratories, was organised tocalibrate the proposed 1 st International Standard Protein S, plasma (93/590) for bothtotal and free Protein S antigen and for Protein S function by assay against locallycollected fresh normal plasma pools. A freeze-dried Protein S deficient plasma wasalso included in the assays, not as a candidate reference preparation, but to allow theassessment of inter-Iaboratory variability independently of the fresh normal plasmapools.
The overall mean potencies for the proposed 1 st International Standard ProteinSf plasma (93/590) were as follows: total Protein S antigen -0.891U per ampoule; freeProtein S antigen -0.89 IU per ampoule; Protein S function -0.92 IU per ampoule.It is proposed that the 1 st International Standard is assigned a single combinedpotency of 0.90 IU per ampoule to cover all three parameters.
INTRODUCTION
Protein S is a cofactor for the anticoagulant function of activated Protein C inplasma (1 ). Deficiency of plasma Protein S is associated with recurrent venousthrombosis and therefore measurement of plasma Protein S is routinely carried out incases of unexplained thrombophilia. Protein S exists in two forms in plasma beingeither complexed with the C4b-binding protein (C4bBP) or in free solution (2); onlyfree Protein S acts as a cofactor for activated Protein C (3). Laboratories routinelyestimate both total Protein S antigen (C4bBP bound and free Protein S) as well asfree Protein S antigen and Protein S function. Quantitation is mainly
Ce document n 'est pas destine a etre distribue au grand public et tous
les droits V afferents sont reserves par l'Organisation mondiale de la
Sante (OMS). 11 ne peut etre commente, resume, cite, r~produit ou
traduit, partiellement ou en totalite, sans une autorisation prealable
ecrite de I'OMS. Aucune partie ne doit etre chargee dans un svsteme de
recherche documentaire ou diffusee sous quelque forme ou par quelque
moven que ce soit .electronique, mecanique, ou autre. sans une
autorisation prealable ecrite de I'OMS.
This document is not issued to the general public. and all rightsare reserved by the World Health Organization (WH O) .Thedocument may not be reviewed. abstracted. quoted. reproduced ortranslated, in part or in whole, without the prior written permissionof WHO. No part of this document may be stored in a retrievalsystem or transmitted in any form or by any means. electronic,
mechanical or other. without the prior written permission ofWHO.
Les opinions exprimees dans les documents par des auteurs cite!
nommement n 'engagent que lesdits auteurs.The views expressed in documents by named authors are solely the
responsibility of those authors.

BS/95.1804
Page 2
carried out relative to locally collected plasma pools. The need for a standard todefine the international unit of Protein S in plasma was expressed at t.he New Yorkmeeting of the ISTH/SSC Sub-committee on Plasma Coagulation Inhibitors in 1993and a candidate preparation of freeze-dried pooled normal plasma was prepared inOctober 1993.
PARTICIPANTS
Results were returned from sixteen of the twenty-one laboratories whichreceived the samples for assay. A list of the participating laboratories (from eightcountries) is given in Appendix 1 .
MA TERIAlS
Coded samples A and B were supplied by NIBSC; the fresh normal plasmapools (P) and local standards (L) were supplied by the participating laboratories.
Preoaration A
Proposed 1 st International Standard Protein S, plasma (93/590) consistingof sealed glass ampoules each containing 1 ml of pooled normal plasma (seventeendonors), buffered with 0.04M HEPES and freeze-dried under the conditions usedfor international biological standards (4).
PreQaration B
Protein S deficient plasma (93/774) consisting of sealed glass ampouleseach containing 1 ml of freeze-dried plasma from a single heterozygous donor .
Fresh. normal clasma cools p
Prepared locally according to Appendix 2.
Local Standards L
Four laboratories used Iyophilised plasma preparations and the remaininglaboratories used frozen normal plasma pools.
METHODS
The methods used to measure Protein S antigen and function are describedin Table 1 .Of the sixteen laboratories which measured Protein S antigen thirteenused ELISA techniques, three used Laurell electroimmunoassay techniques and onelaboratory used a radio-immunoassay. Several laboratories used more than oneassay method. The majority of laboratories which measured free Protein S antigenused ELISA methods which required the prior removal of the bound Protein S

BS/95.1804
Page 3
(Protein S-C4bBP complexes) by precipitation with polyethylene glycol (PEG). Thefinal concentrations of PEG used for precipitation are given in Table 1 .Threelaboratories measured free Protein S antigen using an ELISA which employedmonoclonal antibodies specific for free Protein S and hence did not require PEGprecipitation of the Protein S-C4bBP complex.
Free Protein S antigen in the proposed 1 st International Standard could beexpressed relative to both total antigen and free antigen in the fresh normal plasmapools. However, it was agreed with the participants that free Protein S antigen inthe proposed 1 st International Standard should only be calibrated relative to freeProtein S antigen in the fresh normal plasma pools. This approach, which is usedin the majority of laboratories, involves the comparison of "like" materials (eg PEGsupernatants) and leads to better inter-Iaboratory agreement than when "unlike"materials are compared (eg PEG supernatant vs whole plasma) (5). Laboratorieswhich persist in expressing free Protein S antigen relative to total Protein S antigenonly require a value for total Protein S antigen to be assigned to the proposed 1 stInternational Standard.
Determination of Protein S function was carried out with the Stago "Staclot"kit in four laboratories, the Instrumentation Laboratory kit in four laboratories andcommercial kits under development in two laboratories.
ASSA y DESIGN
Four ampoules of each coded preparation (A and B) were despatched to eachparticipating laboratory for the assay of Protein S antigen and a separate set ofcoded ampoules were despatched for the assay of Protein S function whereapplicable. The laboratories were asked to carry out four assays for Protein Santigen and four assays of Protein S function using fresh ampoules of A and B andwith a fresh normal plasma pool (P) and a fresh sample of local standard (l} foreach assay. It was also requested that three dilutions of each sample wereassayed in replicate according to a balanced order of assay.
STATISTICAL ANALYSIS
Methods
Raw data (eg optical density, peak height, clotting times etc) were returnedto NIBSC for analysis according to the principles of parallel line bioassay analysis(6). Analysis of variance was used to assess the statistical validity of an assay andall raw data were also plotted graphically to aid in the evaluation of the analysis.
Potency estimates of the samples A and B were calculated relative to thefresh normal plasma pools (P) which were arbitrarily assigned a potency of 1.0international unit per ml. (Potency estimates of the Protein S deficient plasma Bwere also calculated relative to the proposed 1 st International Standard A in order

BS/95.1804
Page 4
to estimate inter-Iaboratory variability independent of the variability of the freshnormal pools P) .
Potency estimates from the four assays carried out by the individuallaboratories were combined by calculating the unweighted geometric mean.Potency estimates from different laboratories were also combined by calculatingthe unweighted geometric mean. The intra-Iaboratory variability and inter-laboratory variability of the potency estimates was calculated as the standarddeviation of the individuallog potency estimates expressed anti-Iogarithmically asa percentage (geometric coefficient of variation, gcv%).
Assay validity and exclusions
All data submitted for analysis were accepted except for the following:Laboratory number 7 -estimates of Protein S function could not be calculated sinceonly one dilution of each test material was assayed .
Investigation of the graphical plot showed, in several cases, that it wasnecessary to exclude one dilution of a test material in order to obtain a linear dose-response relationship which was then accepted for potency estimation.
RESULTS
Potency estimates for Protein S antigen and function from individual laboratories
The estimates for Protein S antigen and function from the individuallaboratories for the proposed 1 st International Standard Protein Sf plasma (A) andthe Protein S deficient plasma (8) are shown in Figures 1 and 2 and also in
Appendix 3 (Tables 1-6).
Overall mean Qotencies
The overall mean potencies for total and free Protein S antigen and forProtein S function in the proposed 1 st International Standard Protein S, plasma (A)and the Protein S deficient plasma (8) are summarised in Tables 2 and 3.
Inter-Iaborator¥ variabilit¥
The inter-Iaboratory variability of potency estimates for the proposed 1 st
International Standard Protein S, plasma (A) calculated relative to the fresh, normalplasma pools (P) is summarised in Table 4 together with estimates of inter-laboratory variability of the Protein S deficient plasma (8) calculated relative to boththe fresh, normal plasma pools (P) and the proposed 1 st IS Protein S plasma (A).
Fresh normal pools
Estimates from the individual laboratories for total and free Protein S antigenin the fresh normal pools {P) have been calculated relative to the overall mean
BS/95.1804
Page 5
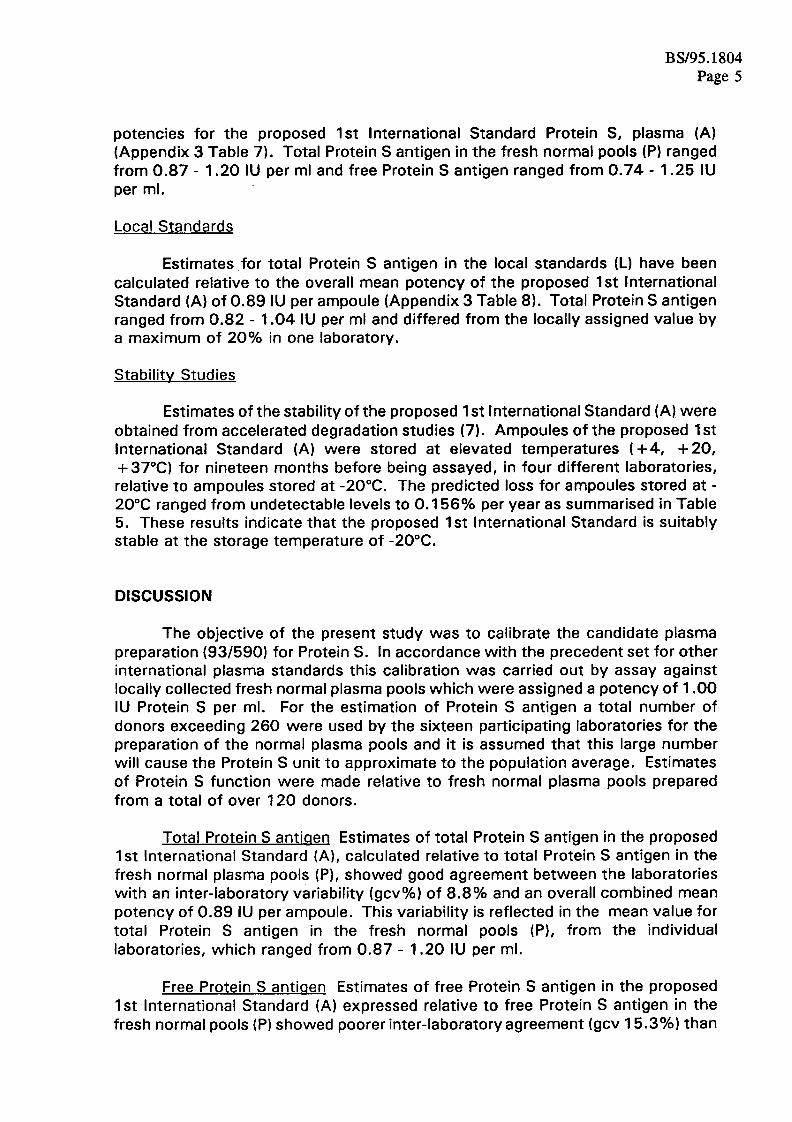
potencies for the proposed 1 st International Standard Protein S, plasma (A)(Appendix 3 Table 7) .Total Protein S antigen in the fresh normal pools (P) rangedfrom 0.87- 1.20 IU per ml and free Protein S antigen ranged from 0.74 -1.25 IUper ml.
Local Standards
Estimates for total Protein S antigen in the local standards (L) have beencalculated relative to the overall mean potency of the proposed 1 st InternationalStandard (A) of 0.89 IU per ampoule (Appendix 3 Table 8). Total Protein S antigenranged from 0.82 -1.04 IU per ml and differed from the locally assigned value bya maximum of 20% in one laboratory.
Stability Studies
Estimates of the stability of the proposed 1 st International Standard (A) wereobtained from accelerated degradation studies (7) .Ampoules of the proposed 1 stInternational Standard (A) were stored at elevated temperatures ( + 4, + 20,+ 37°C) for nineteen months before being assayed, in four different laboratories,relative to ampoules stored at -20°C. The predicted loss for ampoules stored at -
20°C ranged from undetectable levels to 0.156% per year as summarised in Table5. These results indicate that the proposed 1 st International Standard is suitablystable at the storage temperature of -20°C.
DISCUSSION
The objective of the present study was to calibrate the candidate plasmapreparation {93/590) for Protein S. In accordance with the precedent set for otherinternational plasma standards this calibration was carried out by assay againstlocally collected fresh normal plasma pools which were assigned a potency of 1.00IU Protein S per ml. For the estimation of Protein S antigen a total number ofdonors exceeding 260 were used by the sixteen participating laboratories for thepreparation of the normal plasma pools and it is assumed that this large numberwill cause the Protein S unit to approximate to the population average. Estimatesof Protein S function were made relative to fresh normal plasma pools preparedfrom a total of over 120 donors.
Total Protein S antigen Estimates of total Protein S antigen in the proposed1 st International Standard (A), calculated relative to total Protein S antigen in thefresh normal plasma pools (P), showed good agreement between the laboratorieswith an inter-Iaboratory variability (gcv%) of 8.8% and an overall combined meanpotency of 0.89 IU per ampoule. This variability is reflected in the mean value fortotal Protein S antigen in the fresh normal pools (P), from the individuallaboratories, which ranged from 0.87 -1.20 IU per ml.
Free Protein S antigen Estimates of free Protein S antigen in the proposed
1 st International Standard (A) expressed relative to free Protein S antigen in the
fresh normal pools (P) showed poorer inter-Iaboratory agreement (gcv 15.3%) than

BS/95.1804
Page 6
estimates of total Protein S antigen and gave an overall combined mean of 0.89IU free Protein S per ampoule. The increased inter-Iaboratory variability is probablythe result of both the variability of free Protein S antigen in the fresh normal pools(P) (0.74 -1.25 IU per ml) and the extra assay step (PEG precipitation) which isrequired to remove the bound Protein S.
Protein S Function Estimates of Protein S function in the proposed 1 stInternational Standard gave an overall mean of 0.92 IU per ampoule with inter-laboratory variability (gcv) of 14.0%. This mean potency estimate was obtainedafter excluding the result of laboratory 19 which although valid was an obviousoutlier. The decision to calibrate the proposed 1 st International Standard forProtein S function should take into account the recent discovery of the Factor Vleiden mutation which has been linked with venous thrombosis (8,9) and has beenfound to interfere with assay methods used to estimate Protein S function ( 10) .However, the similarity of the estimates for free Protein S antigen and Protein Sfunction for both the proposed 1 st International Standard (0.89 and 0.92 IU perampoule respectively) and the Protein S deficient plasma (0.23 and 0.25 IU perampoule respectively) indicates that neither the proposed 1 st International Standardnor the fresh normal pools contain a significant number of donors with the FactorV leiden mutation. Estimates of Protein S function in the present study thereforeappear to be a true reflection of the Protein C cofactor content of the proposed 1 stInternational Standard. Considering that assays of Protein S function are routinelycarried out it would be advantageous and in the interest of inter-Iaboratoryagreement to calibrate the proposed 1 st International Standard for this parameter .The standard would then be available for the calibration of reference plasmaswhich are included in commercial kits. The concern over possible interference inassays of Protein S function by the Factor V leiden mutation could be addressedin the memorandum which will describe how the standard should be used.
Protein S deficient olasma Inclusion of the Protein S deficient plasma (8) inthe assays provided valuable information on inter-Iaboratory variability. In all casesthe inter-Iaboratory variability (gcv%) of potency estimates for the Protein Sdeficient plasma was greater and sometimes twice the variability of estimates forthe proposed 1 st International Standard (A) .The reasons for this are unclear sincethe two plasma preparations (A and 8) were assayed relative to the same freshnormal plasma pools. Re-calculation of the potency estimates for the Protein Sdeficient plasma relative to the proposed 1 st International Standard (A) removedthe variability of the different fresh normal plasma pools but caused little or noreduction in the interlaboratory variability. It would appear from these results thatthe estimation of reduced levels of plasma Protein S is inherently associated with
increased inter-Iaboratory variability.
PARTICIPANTS' RESPONSES TO THE PROPOSED POTENCIES
The participants in the collaborative study were asked to comment on theproposal to assign potencies to the 1st International Standard. All participantsagreed that potencies for total and free Protein S antigen should be assigned andall but one laboratory agreed that the standard should also be calibrated for Protein

BS/95.1804
Page 7
S function. All of the participants, except three, preferred the 1 st InternationalStandard to be assigned with a single combined potency of 0.90 IU per ampoulefor total and free Protein S antigen and Protein S function.
REFERENCES
1. Walker F J. Regulation of activated Protein C by a new protein.Chem 1980, ~, 5521-5524.
J Bioi
2. Dahlback B. Interaction between vitamin K dependent protein S and the
complement protein, C4b-binding protein. Semin Thromb Hemost 1984, ..1Q,139-148.
3. Comp P C, Nixon R R, Cooper M R and Esmon C T. Familial Protein Sdeficiency is associated with recurrent thrombosis. J Clin Invest 1984, 24,2082-2088.
4. Campbell P J. International biological standards and reference preparations.II: Procedures used for the production of biological standards and reference
preparations. J Bioi Standardisation 1974, 2, 259-267.
5. Hubbard A R and Wong M Y. A collaborative study on the measurement ofProtein S antigen in plasma. Thromb Haemost 1992, ~, 115-118.
6. Finney D. Statistical method in biological assay. 3rd edition. Griffin and CoLtd, London 1978.
7 Kirkwood T B L and Tydeman M S. Design and analysis of accelerateddegradation tests for the stability of biological standards II. A flexiblecomputer program for data analysis. J Bioi Standardisation 1984,12, 207-214.
8. Bertina R M, Koeleman B p C, Koster T, Rosendaal F R, Dirven R J, deRonde H, van der Velden p A and Reitsma p H. Mutation in bloodcoagulation factor V associated with resistance to activated protein C.Nature 1994, ~, 64-67.
9. Zoller B and Dahlback B. Linkage between inherited resistance to activatedprotein C and factor V gene mutation in venous thrombosis. Lancet 1994,
~,1536-1538.
10. Faioni E M, Franchi F, Asti D, Sacchi E, Bernardi F and Mannucci p M.Resistance to activated protein C in nine thrombophilic families: interferencein a protein S functional assay. Thromb Haemost 1993, 1Q, 1067-1071.

BS/95.1804
Page 8
ACKNOWLEDGEMENTS
The co-operation of the members of the ISTH/SSC Plasma Coagulation InhibitorsSub-committee and the efforts of the participating laboratories are gratefully
acknowledged.
~

BS/95.1804
Page 9
Table 1Methods used for Protein S determination.
LABNO
ANTIGEN FUNCTION
Method PEG conc
(%w/v)
Method
1 a) E- Dako antibodiesb) E -Free PS specific
3.57N/A
Staclot kit
2 E -Asserachrom Protein S 3.75 Instrumentation Lab kit
3 Laurel' -Dako antibody 3.75 Kit under development
5 E -Dako antibody N/A
7 E -Asserachrom PS 3.6 Instrumentation Lab kit
8 E- Dako antibodies 3.75
9 laurell 3.57 Kit under development
10 a} laurel' -Asseraplateb) E -Asserachrom PSc) E- Asserachrom Total PSd) E -Asserachrom Free PS
3.573.573.57N/A
Staclot kit
11 E -Dako antibodies 3.5 Instrumentation Lab kit
14 E- Dako antibodies 3.75
15 Radio-immunoassay 5.0
16 a) E -Asserachrom Total PSb) E -Asserachrom Free PS
N/A
N/A
Staclot PS
18 E -Asserachrom PS 3.57 Staclot PS
19 E -Dako antibodies 3.75 Instrumentation Lab kit
20 E- Dako antibodies 3.75
21 E -Dako antibodies 3.75
E -ELISA technique

BS/95.1804
Page 10
Table 2Summary of potency estimates for the Proposed 1 st IS Protein S, plasma (A) calculatedrelative to the fresh normal plasma pools (P) .
95% conf lim
(IU/ampoule)Mean
Potency(IU/ampoule)
Range
(IU/ampoule)
Parameter n
0.85 -0.93Total antigen 18 0.89 0.74-1.02
0.83 -0.95Free antigen 19 0.89 6.71-1.20
8 0.74-1.10 0.82 -1.03Function * 0.92
* -excluding laboratory 19
Table 3Summary of potency estimates for the Protein S deficient plasma (8) calculated relativeto the fresh normal plasma pools (P) .
95% conf lim
(IU/ampoule)Mean
Potency(IU/ampoule)
Range
(IU/ampoule)
Parameter n
0.48 -0.5T otal antigen 18 0.51 0.39 -0.67
0.14 -0.38 0.20- 0.2619 0.23
0.19- 0.32
Free antigen
Function * 8 0.25 0.14- 0.39
* -excluding laboratory 3
Table 4Summary of interlaboratory variability of potency estimates for the proposed 1 st IS
Protein S plasma (A) and the Protein S deficient plasma (8)
* -excluding laboratory 19
+ -excluding laboratory 3

BS/95.1804
Page 11
Table 5
Accelerated degradation studies on the proposed 1 st International Standard Protein S,
plasma (A) .Potency estimates for the ampoules stored at elevated temperatures areexpressed as percentages of the potency of the ampoules stored at -20°C. Potencyestimates are the means of three separate assays using different ampoules. Methodsused by the four laboratories are described in Table 1.
Parameter LabNo
Potency of ampoules stored atelevated temperatures
(% of -20°C)+4 +20 +37
Predicted lossat -20°C
( % per year)
Total Protein S antigen 8
10
16
97.8101.6102.1
94.598.192.5
52.8
61.5
60.5
0.0000.0000.012
Free Protein S antigen 8
10
16
100.896.4100.2
86.470.062.1
0.0000.1560.012
Protein S function 10
11
90.5
96.4
88.789.6
58.855.7
0.1560.084
99.391.093.4

BS/95.1804
Page 12
APPENDIX ONE
liST OF PARTICIPATING LABORATORIES
Ms A M BurnThe Royal InfirmaryManchesterUK
Or B Woodhams lOr M Burgess-
Wilson
Oade Produktions AG
Oud ingen
Switzerland
Dr H LangImmuno AGViennaAustria
Dr F FranchiCentra Emafilia e TrambasiA Bianchi BanamiMilan
Italy
Prof B DahlbackGeneral HospitalMalmoSweden
Dr A TosettoS Bortolo HospitalVicenza
Italy
Prof R A MarlarVA Medical CenterDenverUSA
Prof R M Bertina
University HospitalleidenThe Netherlands
Prof D MeyerHopital Antoine BeclereClamartFrance
Dr J AmiralseRBlo LaboratoryGennevilliersFrance
Dr I Walker I Dr J Conkie
Royal InfirmaryGlasgowUK
Prof F E Preston / Dr P Cooper
Royal Hallamshire HospitalSheffieldUK
Dr A R HubbardNIBSCPotters BarUK
Dr J J Michiels/Dr H H D M van Vliet
University HospitalRotterdamThe Netherlands
Dr I Pabinger
University HospitalViennaAustria
Mr A LawrieSt Thomas' HospitalLondonUK

BS/95.1804Page 13
APPENDIX TWO
PREPARATION OF FRESH NORMAL PLASMA POOLS
Four separate plasma pools were required for the study with each pool preparedfrom at least four donors as follows:
taking oralnormal healthy volunteers,Donors -usecontraceptives .
excluding women
Anticoagulant -mix nine volumes of blood with one volume of 0.1 09M tri-sodiumcitrate .
Centrifugation -blood should be centrifuged as soon as possible after collectioneither at 50,000g for 5 minutes or at 2,000g for 20 minutes.
Storage -store during the assays in stoppered tubes on ice.

BS/95.1804
Page 14
APPENDIX THREE
REPORT ON AN INTERNATIONAL COLLABORATIVE STUDY TO CAliBRATETHE 1ST INTERNATIONAL STANDARD FOR PROTEIN S, PLASMA (93/590)
Tables of potency estimates from individual laboratories.

BS/95.1804
Page 15
T ABLE 1 Potency estimates (IU per ampoule) of total Protein S antigen in theproposed 1 st International Standard Protein S, plasma, (A) expressedrelative to total Protein S antigen in the fresh normal plasma pools (P)
PotencyLaboratory 95% Confidence Limits GCV%
1 0.92 0.87 -0.98 4.08
2 0.95 0.86- 1.04 6.16
3 0.74 0.71- 0.77 Single Assay
5 0.83 0.67- 1.03 14.78
7 0.87 0.76 -0.99 8.29
8 0.80 0.78- 0.82 1.27
9 0.99 0.90- 1.10 6.61
10a 0.93 0.77 -1 .12 12.47
1Ob 0.89 0.76 -1.04 10.47
10c 0.83 0.67-1.02 14.41
11 1.02 0.93-1.13 6.29
14 0.88 0.78 -0.99 7.77
15 0.93 0.80 -1.09 10.29
16 0.93 0.80 -1.09 10.13
18 0.78 0.58 -1.06 21.10
19 0.94 0.89 -0.99 2.87
20 0.92 0.80 -1.06 9.17
21 0.93 0.69 -1.26 20.85
Combined 0.89 0.85 -0.93 8.82
Key to methods used by Laboratory 10:
a -Laurel' electroimmunoassay (Asseraplate Protein S)
b -ELISA (Asserachrom Protein S)
c -ELISA (Asserachrom Total Protein S)

BS/95.1804Page 16
Potency estimates (IU per ampoule) of free Protein S antigen in the
proposed 1st International Standard Protein S, plasma, 93/590, (A)expressed relative to free Protein S antigen in the fresh normal plasma
pools (P)
T ABLE 2
GCV%95% Confidence LimitsPotencyLaboratory
14.240.78 0.63 -0.96
0.78 -1.04
'a9.291b 0.90
18.332 0.72 0.55 -0.94
0.52 -0.98 Single Assay3 0.71
6.170.96 0.87 -1.067
1.928 0.84
22.92
0.82 -0.87
0.56- 1.079 0.77
11.5010a 0.85 0.72 -1.01
0.76- 1.10 12.571Ob 0.92
23.6710c 0.80 0.57-1.13
15.6310d 0.96 0.76 -1.21
1.09-1.33 6.48
7.82
11 1.20
0.79 0.70 -0.89
0.86 -1.28
14
13.5915 1.05
6.3616 1.02 0.92 -1.12
15.9618 0.91 0.72-1.15
0.80 -0.88 1.1519 0.84
19.2120 1.11 0. 84 -1 .46
17.7621 0.91 0.70 -1.18
15.290.89 0.83 -0.95Combined
Key to methods used :
1 a ELISA -polyclonal antibodies with PEG precipitation
1 b ELISA -free PS specific monoclonal antibody without PEG precipitation
1Oa -Laurel' electroimmunoassay (Asseraplate Protein S)
1Ob -ELISA (Asserachrom Protein S)
1Oc -ELISA (Asserachrom Total Protein S)
1Od -ELISA (Asserachrom Free Protein S)

BS/95.1804Page 17
T ABLE 3 Potency estimates (IU per ampoule) of Protein S function in theproposed 1 st International Standard Protein S plasma (A) expressedrelative to the fresh normal plasma pools (P)
Laboratory 95% Confidence Limits GCV%Potency
1 0.86 0.79- 0.94 5.92
2 1.10 0.74-1.63 28.44
3 1.03 0.77 -1.37 19.9
9 0.89 0.68-1.16 18.49
10 0.74 0.62 -0.90 12.58
11 0.98 0.85-1.13 9.52
16 1.00 0.76 -1.31 18.52
18 0.81 0.69 -0.96 10.91
19 0.56 0.41-0.76 21.0
Combined 0.87 0.74 -1.02 22.74
Exc Lab 19 0.92 0.82 -1.03 13.96

BS/95.1804Page 18
T ABLE 4 Potency estimates (IU per ampoule) of total Protein S antigen inProtein S-deficient plasma (8) expressed relative to total Protein Santigen in the fresh normal plasma pools (P)
PotencyLaboratory 95% Confidence Limits GCV%
1 0.43 0.38 -0.48 7.44
2 0.53 0.48 -0.59 6.84
3 0.51 0.49 -0.53 Single Assay
5 0.54 0.46 -0.64 11.17
7 0.53 0.47 -0.59 7.28
8 0.44 0.40 -0.48 6.31
9 0.52 0.48 -0.55 4.06
10a 0.58 0.50- 0.68 9.95
1Ob 0.46 0.36 -0.59 16.73
10c 0.51 0.45 -0.59 9.10
11 0.67 0.59- 0.75 7.72
14 0.42 5.660.38 -0.46
15 0.58 0.47- 0.71 13.84
16 0.65 0.53- 0.79 12.87
18 0.39 6.530.35 -0.43
19 1.270.44 0.41 -0.46
20 0.57 0.45 -0.72 16.49
21 0.59 18.250.45 -0.77
Combined 0.51 0.48 -0.55 16.70
Key to methods used by Laboratory 10:
a -laurell electroimmunoassay (Asseraplate Protein S)
b -EliSA (Asserachrom Protein S)
c -ELISA (Asserachrom Total Protein S)

BSl95.1804Page 19
TABLE 5 Potency estimates (IU per ampoule) of free Protein S antigen inProtein S-deficient plasma (8) expressed relative to free Protein Santigen in the fresh normal plasma pools (P)
PotencyLaboratory 95% Confidence Limits GCV%
'a 0.19 0.17-0.21 4.13
1b 0.31 0.28 -0.34 4.21
2 0.38 0.32 -0.46 12.34
3 0.34 Single Assay
8.097 0.23
8 0.18 2.67
29.629 0.20
0.20 -0.47
0.20 -0.26
0.18- 0.19
0.13- 0.30
10a 0.17 0.12- 0.24 24.20
1Ob 0.20 0.16- 0.25 14.96
10.5310c 0.19 0.16- 0.23
10d 0.28 0.20 -0.37 21.20
11 0.38 0.30 -0.49 16.93
14 0.15
0.22
15.44
15 14.48
16 0.33
0.12- 0.19
0.18- 0.28
0.27 -0.39 12.42
18 0.20
0.14
0.17- 0.24 10.60
19 0.13- 0.15 9.08
20 0.21 0.15- 0.29
0.15- 0.29
23.43
21 0.21 23.65
Combined 0.23 0.20 -0.26 35.17
Key tg methods used :
1 a ELISA -polyclonal antibodies with PEG precipitation
1 b ELISA -free PS specific monoclonal antibody without PEG precipitation
1Oa -Laurell electroimmunoassay (Asseraplate Protein S)
1Ob -ELISA (Asserachrom Protein S)
1Oc -ELISA (Asserachrom Total Protein .S)
1Od -ELISA (Asserachrom Free Protein 5)

BS/95.1804
Page 20
T ABLE 6 Potency estimates (IU per ampoule) of Protein S function in theProtein S-deficient plasma (8) expressed relative to the fresh normal
plasma pools (P)
Potency 95% Confidence Limits GCV%laboratory
1 0.39 0.29 -0.52 20.02
2 0.26 0.18-0.36 23.89
3 0.75 0.58 -0.97 17.20
9 0.28 0.23 -0.35 15.05
10 0.20 0.18- 0.23 8.05
11 0.33 0.29 -0.38 8.25
16 0.27 0.26 -0.28 3.28
18 0.20 0.13- 0.29 27.03
19 0.14 16.990.11 -0.18
Combined 0.28 61.640.19- 0.41
Exc Lab 3 0.25 0.19-0.32 38.50

BS/95.1804
Page 21
T ABLE 7 Mean potency estimates (IU per ml) from the individual laboratoriesfor total Protein S antigen and free Protein S antigen in the freshnormal pools (P) relative to the proposed 1 st International StandardProtein S, plasma (A) assigned 0.89 IU per ampoule for total and freeProtein S antigen
Total Protein S antigen Free Protein S antigenlaboratory
'a 0.97 1.14
1b 0.99
2 0.94 1.24
3 1.20 1.25
5 1.07
7 1.02 0.93
1.068 1.11
9 0.90 1.16
10a 0.96 1.05
1Ob 1.00 0.97
10c 1.07 1.11
10d 0.93
11 0.87 0.74
14 1.01 1.13
15 0.96 0.85
16 0.96 0.87
18 1.14- 0.98
19 0.95 1.06
20 0.97 0.80
21 0.96 0.98
Key to methods used :
1 a ELISA -polyclonal antibodies with PEG precipitation
1 b ELISA -free PS specific monoclonal antibody without PEG precipitation
1Oa -Laurell electroimmunoassay (Asseraplate Protein S)
1Ob -ELISA (Asserachrom Protein S)
1Oc -ELISA (Asserachrom Total Protein S)
1Od -ELISA (Asserachrom Free Protein S)

BS/95.1804
Page 22
T ABLE 8 Potency estimates for total Protein S antigen in the local standards (L)relative to the proposed 1 st International Standard Protein S, plasma(A) assigned 0.89 IU per ampoule
Potency vs A
(IU per ml)Assignedpotency
(units per ml)
% differenceLaboratory
1.00 -21 1.02
+62 0.94 1.00
5 1.04 1.00 -4
7 0.94 1.00 +6
8 0.95
9 0.82 0.90 +10
108 0.90 0.94 +4
1Ob 0.94 +80.87
10c 0.88 0.94 +7
0.98 1.00 +211
1.00 +1814 0.85
0.97 1.16 +2015
16 1.01 1.00 -1
18 1.00
19 0.90
021 0.84 0.84
Key to methods used :
1Oa -laurell electroimmunoassay (Asseraplate Protein S)
1Ob -ELISA (Asserachrom Protein S)
1Oc -ELISA (Asserachrom Total Protein S)

BSl95.1804
Page 23
Figure one Potency estimates (IU per ampoule) from the individual laboratoriesfor the proposed 1 st International Standard Protein S, plasma (A)
T otal Protein S antigena)
IV-
9-
8-
(/) 7-.0O
--1 6--0
.
4.
3-
2-
1 -
rm
-2
r2O"" -;0 :
r; ;0
rrT~ '
rr1i" ,To;'-;;-
0 0.1 0.2 0.3 0.4 0.5 0.6 0.7 0.8 0.9
Potency (IU per ampoule)
1.0 1.1 1.2
Free Protein S antigenb)
Protein S Functionc)
10-
9-
B-
01 7-.0O
--1 6-
"-o 5-
4-
'1-
R2"'
,. .ril 1'.I'.I'I.J 1""TT2l
0 I I I I I I I I I I I
0 0.1 0.2 0.3 0.4 0.5 0.6 0.7 0.8 0.9 1.0 1.1 1.2
Potency (IU per ampoule)
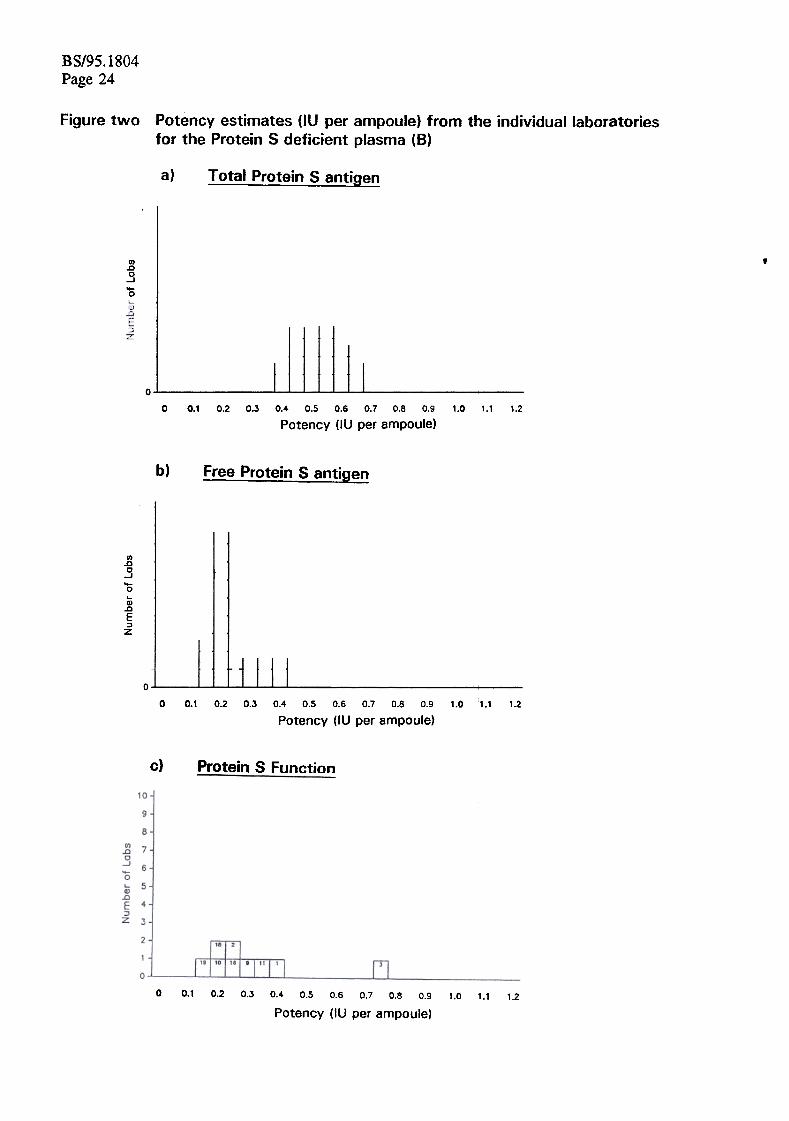
BS/95.1804Page 24
Figure two Potency estimates (IU per ampoule) from the individual laboratoriesfor the Protein S deficient plasma (8)
a) T otal Protein S antigen
10.,
9-
8-
1/) 7-.DO
-.J 6--o 5.
4.
3.
2.
1.
.
mmI
hi"O.-.;-'
r-.=-L---1ilII.I'~ ~ 20 I. \II
14 III.. 2 1.. 11
0 0.1 0.2 0.3 0.4 0.5 0.6 0.7 0.8 0.9
Potency (IU per ampoule)
1.0 1.1 1.2
b) Free Protein S antigen
10-
9-
8-
(1) 7-.0O
-J 6--O
..5-AI
.0
E 4-:J
Z 3-
2-
1 -
mL
I
~
'10"
Ef .1
15
~
~
no
14
100
I '.1 J , 2 I
11"
0 0.1 0.2 0.3 0.4 0.5 0.6 0.7 0.8 0.9
Potency (fU per ampoule)
1.0 1.1 1.2
c) Protein S Function
0 0.1 0.2 0.3 0.4 0.5 0.6 0.7 0.8 0.9
Potency (IU per ampoule)
1.0 1.1 1.2