Organic-Vapor-Liquid-Solid Deposition with an Impinging ...
10
Western Washington University Western CEDAR Chemistry Faculty and Staff Publications Chemistry 4-1-2012 Organic-Vapor-Liquid-Solid Deposition with an Impinging Gas Jet Daniel W. (Daniel Wainwright) Shaw Western Washington University Kevin A. (Kevin Anthony) Buin Western Washington University Alexandr A. Baronov Brad L. Johnson Western Washington University David L. Patrick Western Washington University, [email protected] Follow this and additional works at: hps://cedar.wwu.edu/chemistry_facpubs Part of the Chemistry Commons is Article is brought to you for free and open access by the Chemistry at Western CEDAR. It has been accepted for inclusion in Chemistry Faculty and Staff Publications by an authorized administrator of Western CEDAR. For more information, please contact [email protected]. Recommended Citation Shaw, Daniel W. (Daniel Wainwright); Buin, Kevin A. (Kevin Anthony); Baronov, Alexandr A.; Johnson, Brad L.; and Patrick, David L., "Organic-Vapor-Liquid-Solid Deposition with an Impinging Gas Jet" (2012). Chemistry Faculty and Staff Publications. 2. hps://cedar.wwu.edu/chemistry_facpubs/2
Transcript of Organic-Vapor-Liquid-Solid Deposition with an Impinging ...

Western Washington UniversityWestern CEDAR
Chemistry Faculty and Staff Publications Chemistry
4-1-2012
Organic-Vapor-Liquid-Solid Deposition with anImpinging Gas JetDaniel W. (Daniel Wainwright) ShawWestern Washington University
Kevin A. (Kevin Anthony) BufkinWestern Washington University
Alexandr A. Baronov
Brad L. JohnsonWestern Washington University
David L. PatrickWestern Washington University, [email protected]
Follow this and additional works at: https://cedar.wwu.edu/chemistry_facpubs
Part of the Chemistry Commons
This Article is brought to you for free and open access by the Chemistry at Western CEDAR. It has been accepted for inclusion in Chemistry Facultyand Staff Publications by an authorized administrator of Western CEDAR. For more information, please contact [email protected].
Recommended CitationShaw, Daniel W. (Daniel Wainwright); Bufkin, Kevin A. (Kevin Anthony); Baronov, Alexandr A.; Johnson, Brad L.; and Patrick, DavidL., "Organic-Vapor-Liquid-Solid Deposition with an Impinging Gas Jet" (2012). Chemistry Faculty and Staff Publications. 2.https://cedar.wwu.edu/chemistry_facpubs/2

Organic-vapor-liquid-solid deposition with an impinging gas jet
Daniel W. Shaw,1 Kevin Bufkin,1 Alexandr A. Baronov,1 Brad L. Johnson,2
and David L. Patrick1,a)
1Department of Chemistry, Western Washington University, 516 High St., Bellingham,Washington 98225, USA2Department of Physics, Western Washington University, 516 High St., Bellingham, Washington 98225, USA
(Received 20 October 2011; accepted 2 March 2012; published online 13 April 2012)
A method for rapid, mass-efficient deposition of highly crystalline organic films under near
ambient conditions of pressure and temperature is reported based on delivery of an organic
precursor via an impinging gas jet to a substrate coated by a thin liquid solvent layer. Films of the
organic semiconductor tetracene were deposited by sublimation into a flow of argon carrier gas
directed at an indium-tin-oxide/glass substrate coated by a thin layer of bis(2-ethylhexyl)sebecate,
and growth was followed in situ with optical microscopy. A fluid dynamics model is applied to
account for the gas phase transport and aggregation, and the results compared to experiment. The
combination of gas jet delivery with an organic-vapor-liquid-solid growth mechanism leads to
larger crystals and lower nucleation densities than on bare surfaces, with markedly different
nucleation and growth kinetics. An explanation based on enhanced solution-phase diffusivity and a
larger critical nucleus size in the liquid layer is proposed to account for the differences. VC 2012American Institute of Physics. [http://dx.doi.org/10.1063/1.3699367]
INTRODUCTION
Thin films of organic molecular crystals (OMCs) have
received steadily increasing attention over the last 30 years
as a result of their interesting and potentially useful elec-
tronic, optical, magnetic, and chemical properties.1 The
scope of application for these materials is remarkably broad:
organic crystalline films have been used in transistors, light
emitting diodes, and photovoltaics;2 as chemical sensors;3
and as conductors,4 semiconductors,5 superconductors,6 and
magnetic materials.7 While few of the properties required for
these applications are currently as well developed in organic
systems as in their inorganic counterparts, organic crystalline
films do offer other important advantages, such as the poten-
tial to be processed using relatively low-cost methods. In or-
ganic materials, charge transport and many other properties
of interest are governed by both the characteristics of the
individual molecules and their spatial arrangement.8 Crystal
structure, grain size and shape, and crystallographic orienta-
tion are all important.9–11 It is for this reason that relatively
few thin film devices have been produced approaching the
same level of performance as single crystals, demonstrating
how important it is to grow films of sufficiently high quality,
and that careful control over molecular order at nanometer to
micron length scales is essential.12–15
Many OMC compounds have poor solubility, so crystal-
line films are often prepared by physical vapor deposition
(PVD) or molecular beam epitaxy (OMBE).16 However, in
addition to their relatively high cost and low throughput, films
grown using these techniques often consist of small (<1 lm-
sized) crystals, and it is relatively difficult to control crystal
structure, orientation, or growth habit.17 In an effort to address
some of these limitations, recently, a hybrid thin film deposi-
tion technique combining elements of PVD with solution-
phase growth was proposed in which an organic vapor is
delivered to a substrate coated by a thin liquid layer.18 A
steady flux of new growth units to the solvent film maintains a
supersaturated state leading to crystal nucleation and growth
in a liquid environment, thus circumventing the challenge
posed by low solubility (Fig. 1). The method is similar to the
vapor-liquid-solid (VLS) technique of crystal growth intro-
duced by Wagner and Ellis for growing inorganic crystalline
whiskers in a liquid metal alloy droplet,19–22 but employs an
organic,18,23–25 ionic liquid,26 or liquid crystalline27 solvent
combined with an organic precursor. When applied to organic
systems, the technique has been called organic-VLS (OVLS).
In the OVLS technique, crystal formation takes place at
the gas-liquid or liquid-solid interface, or crystals may form
freely floating fully imbedded in the solvent, depending on
the wetting properties of the crystal/solvent system.18–27 If
confined to the liquid layer, quasi 2-dimensional growth
takes place, and in the case of liquid crystalline solvents,
films with controlled uniaxial in-plane crystallographic ori-
entation have been produced.27 Because molecular diffusion
occurs more readily in liquids than on bare surfaces, films
grown using OVLS tend to develop fewer, but larger crystals
than in films of the same compound deposited onto bare
surfaces. Crystallization in a liquid may also afford better
control over the concentration of incorporated impurities and
crystallite morphology through solvent chemical interac-
tions. Particularly for the preparation of OMC films for elec-
tronic and optoelectronic applications, where crystallite size,
orientation, and purity strongly affect performance,28,29 these
features of OVLS have the potential to make it a useful alter-
native to PVD and OMBE. Another advantage of OVLS dep-
osition is that it can in principle be performed under near
ambient conditions of pressure and temperature while still
a)Author to whom correspondence should be addressed. Electronic mail:
[email protected]. Fax 360-650-2826.
0021-8979/2012/111(7)/074907/9/$30.00 VC 2012 American Institute of Physics111, 074907-1
JOURNAL OF APPLIED PHYSICS 111, 074907 (2012)
[This article is copyrighted as indicated in the article. Reuse of AIP content is subject to the terms at: http://scitation.aip.org/termsconditions. Downloaded to ] IP:
140.160.178.168 On: Tue, 13 May 2014 20:33:12

producing highly crystalline films. The higher diffusivity in
liquids compared to bare surfaces allows the substrate tem-
perature to be kept low, and the tendency of small clusters to
dissolve in the liquid permits the use of vapor delivery condi-
tions in which some gas-phase aggregation of the growth
precursor can be tolerated. By contrast, during deposition
onto a bare surface the existence of small gas-phase aggre-
gates normally tends to produce amorphous films.30–32
The OVLS film growth technique was first reported by
Voigt and coworkers a few years ago18 and so far has only
been investigated in a few systems and under a limited range
of experimental conditions.19–27 To date most studies have
employed low or high vacuum conditions with the organic
precursor delivered as a monomeric flux from a sublimation
source. The reason for the use of low pressure conditions is
that, at ambient pressure, vapor molecules approaching the
substrate must cross a stagnant diffusive boundary layer ad-
jacent to the interface which has the effect of inhibiting
transport to the surface.37 The effect can be so large that dep-
osition rates and efficiencies become impractically small. If
OVLS deposition is to be performed near ambient condi-
tions, a method of increasing the deposition efficiency by
overcoming the hydrodynamic boundary condition is there-
fore required.
Here it is shown that by delivering vapor carried within
an impinging gas jet, relatively rapid deposition rates and
high mass deposition efficiencies can be achieved under am-
bient conditions while still providing for the growth of
highly crystalline films with large grain sizes. Through stud-
ies of film deposition and growth focusing on the model or-
ganic semiconductor tetracene, a fluid dynamics model is
applied to account for gas phase transport and aggregation,
and the results compared to experiment. The resulting films
are observed to display morphologies and growth kinetics
which differ significantly from those of similar films depos-
ited onto bare surfaces. Similar results were also found for
rubrene and a-sexithiophene film, suggesting these findings
should be applicable to a broad class of OMC materials.
Experimental methods
A sketch of the experimental apparatus is shown in Fig. 2.
A finely ground powder of an organic semiconductor (tetra-
cene, anthracene, rubrene, or a-sexithiophene) was placed in
an aluminum source cell held in a ceramic heater positioned at
the base of an airtight chamber. In the following we focus on
results from tetracene films, with a brief discussion of findings
from a-sexithiophene given at the end. The source cell was
sealed with a high temperature KalrezVR
o-ring, with vapor
allowed to escape through a 340 lm diameter hole in the top.
The use of a small hole was found to be important for achiev-
ing steady deposition rates and reproducible results under the
near atmospheric pressure conditions in the chamber. With
this configuration the flux was observed to be independent of
the mass loading in the source cell, varied approximately
exponentially with cell temperature, and was nearly constant
in time (over a periods as long as 10 h), thus approximating the
properties of an effusion cell. The temperature of the cell,
which was typically held at 175–200 �C, was measured with a
calibrated thermocouple positioned at its base.
Argon carrier gas was introduced through an inlet at the
bottom of the ceramic heater and passed through a network of
small channels, allowing the gas to be heated close to the
same temperature as the source cell. Tetracene vapor issuing
from the source cell was swept into the gas flow, exiting
through a 7 cm long circular nozzle whose flow was directed
onto the sample. For most experiments a nozzle with an inner
diameter of d¼ 3.81 mm was used, and the distance between
the sample and the end of the nozzle was z*¼ 13 mm. Meas-
urements with a small thermocouple placed at various loca-
tions above the source cell showed the temperature of the
carrier gas declined as it traveled up the nozzle, reaching
�75 �C by the position of the substrate. As shown in Fig.
FIG. 1. OVLS combines aspects of vapor-phase deposition with solution-
phase growth in a thin solvent layer. The organic precursor is supplied as a
vapor in the form of monomers and small particles, saturating the solvent
layer and causing crystals to grow, imbedded in the fluid.
FIG. 2. (a) Schematic of the experimental apparatus. Sublimate exited the
heated source cell through a pinhole opening and was carried by a stream of
Argon out the nozzle toward the substrate. A shutter between the nozzle and
substrate (not shown) was used to control deposition. Film growth was
monitored in situ through a transparent window with polarized optical mi-
croscopy. (b) The temperature of the gas stream decreased as it flowed
through the nozzle toward the sample. (c) The geometry of the impinging jet
produces axisymmetric stagnation point flow at the substrate.
074907-2 Shaw et al. J. Appl. Phys. 111, 074907 (2012)
[This article is copyrighted as indicated in the article. Reuse of AIP content is subject to the terms at: http://scitation.aip.org/termsconditions. Downloaded to ] IP:
140.160.178.168 On: Tue, 13 May 2014 20:33:12

2(b), the largest temperature change occurred within the first
1–2 cm above the source cell. Despite this however, only a
small amount of vapor was observed to condense on the inner
walls of the nozzle or elsewhere in the chamber, with most
undeposited material being captured instead inside a trap
downstream from the outlet of the chamber. The sample was
attached to the underside of a glass window on the lid of the
chamber and maintained close to room temperature through
thermal contact.
The pressure inside the chamber was fixed at 5 psi above
ambient by a regulator. After exiting the chamber through a
hole in the bottom, carrier gas was scrubbed of tetracene by
successive filter cartridges and passed through an oxygen an-
alyzer. The flow rate was controlled by a needle valve and
monitored with a flowmeter. The gas velocity in the nozzle
was calculated based on its diameter, the chamber pressure
and temperature, and the volumetric flow rate out the end of
the apparatus.
After the gas flow exited the nozzle it behaved like a
semi-free jet, impinging on the substrate. For moderately
large Reynolds numbers, but below the onset of instability
(Re<�2000), a circular jet injected into a stagnant fluid of
similar density develops into a steady slender flow.33 As the
jet entrains fluid from the surroundings it gradually expands
and the centerline velocity decreases, eventually becoming
unsteady.34,35 The Reynolds number for our apparatus based
on the nozzle diameter was Re¼Ud/� � 175 under typical
experimental conditions, where U � 1.0 m s�1 is the flow ve-
locity and v is the gas kinematic viscosity. The jet was thus
expected to remain laminar for distances z*/d> 10, which is
longer than the nozzle-sample separation distance.
The substrate consisted of a 1 cm� 1 cm indium-tin-ox-
ide-coated (ITO) glass slide to which a 1.9 6 0.3 lm thick
layer of bis(2-ethylhexyl)sebecate (BES) was applied by
spin coating. Samples were transparent, allowing film growth
to be monitored in situ using polarized optical microscopy
(Fig. 2(a)). BES was chosen because it fully wets both ITO
and tetracene, it is a moderately good solvent for tetracene,
and its low vapor pressure leads to slow evaporation. In addi-
tion, since tetracene film growth in a BES solvent layer was
previously reported under vacuum conditions,18 a direct
comparison reveals differences arising from the use of ambi-
ent pressure conditions.
Prior to deposition, the entire apparatus was repeatedly
evacuated and refilled with Ar until the oxygen concentration
in the exit flow was 50–100 ppm. As discussed below, a
small amount of tetracene oxidation was observed to occur
at this partial pressure of oxygen, which presumably could
be reduced further if desired by the use of more highly puri-
fied carrier gas. The source cell was then heated to the
desired temperature and allowed to equilibrate with the gas
flow turned on. Deposition was prevented from occurring
during the equilibration period by a shutter placed between
the nozzle and the sample. The shutter was withdrawn to ini-
tiate deposition and film growth was recorded though a series
of time-lapse micrographs.
After deposition samples were removed from the cham-
ber for further analysis. The total amount of deposited tetra-
cene was determined by dissolving films in hexane and
measuring the concentration of the resulting solution by UV-
vis spectroscopy.36 X-ray diffraction measurements were
performed on films that had been rinsed by briefly dipping in
hexane; this removed most of the BES solvent while leaving
the tetracene film largely undisturbed.
RESULTS AND DISCUSSION
Hydrodynamics, deposition, and gas-phaseaggregation
The impinging jet of carrier gas can be modeled as two-
dimensional axisymmetric stagnation point flow, a classical
problem in fluid mechanics characterized by a normally inci-
dent, radially-symmetric stream of fluid impinging on a sur-
face.37 Because the solvent layer coating the substrate was
very thin, we treat the flow as impinging on a flat, incom-
pressible surface. Experiments showed that the deposition
rates on bare and liquid-coated surfaces were indistinguish-
able, indicating that the presence of the liquid did not affect
deposition. Thus, the sticking coefficients on bare and liquid-
coated substrates were nearly the same.
Along the z-direction the flow field can be divided into
two regions: (i) a diffusive boundary layer immediately adja-
cent to the substrate, and (ii) an outer flow region. In the
outer flow region the streamlines are hyperbolic with the ve-
locity components of the gas approximately given by38
vr ¼ ar; (1a)
vz ¼ �2az; (1b)
where a is a constant which depends on the experimental ge-
ometry and flow velocity, and r is the radial distance from
the center of the impinging jet (Fig. 2(c)). Note from Eq.
(1b) that the vertical component of the gas velocity is inde-
pendent of radial position, and hence the amount of time
required for a fluid parcel exiting the nozzle to reach a given
height z depends only on z, and not on its radial position.
Therefore if vapor molecules aggregate in the gas phase,
there should be no radial variation in the size of deposited
particles. Since the Reynolds number under typical experi-
mental conditions was small, the flow conditions are
assumed to be laminar.
The transport of molecules or particles across the diffu-
sive boundary layer is subject to several influences, including
diffusive, thermophoretic, gravitational, and electrostatic
forces.38–40 As shown below, there is evidence that the major-
ity of particles reaching the liquid layer were less than 1 lm
in diameter. For such small particles, whose Stokes numbers
St ¼ 2qUr2p=ð9lRÞ � 1, where m, rp, and q are the particle
mass, radius, and density, respectively, and R is the radius of
the substrate, direct impaction due to particle momentum and
gravitational settling are both negligible.41 The contribution
of electrostatic forces was tested by comparing the deposition
rates of tetracene onto bare ITO-coated glass slides that
were electrically grounded, electrically isolated, or connected
to (þ) or (�) terminals of a 2 kV DC power supply. The
deposition rates in all cases were indistinguishable within
074907-3 Shaw et al. J. Appl. Phys. 111, 074907 (2012)
[This article is copyrighted as indicated in the article. Reuse of AIP content is subject to the terms at: http://scitation.aip.org/termsconditions. Downloaded to ] IP:
140.160.178.168 On: Tue, 13 May 2014 20:33:12

experimental error, demonstrating that electrostatic forces did
not significantly affect the deposition rate.
Because the temperature of the substrate was about
50 �C cooler than that of the impinging jet, the contribution
of thermophoresis to deposition should be also considered.
Thermophoretic motion results from gas molecules striking
the warm side of a particle or molecule with a larger average
momentum than those on the cold side, producing a net force
acting in the direction of decreasing temperature. If the parti-
cle is small enough to neglect its own internal thermal gradi-
ent, the flux due to thermophoresis can be written as42
Jt ¼�coK�
TgrT; (2)
where co is the tetracene concentration in the gas, Tg is the
temperature of the carrier gas, and K is the particle thermo-
phoretic coefficient. For small particles whose diffusive
motion is in the free molecular regime, K¼ 0.55.43 The aver-
age temperature gradient is given by
rT ¼ 1:05Pr r0:36 U
d�
� �1=2
ðTs � TgÞ; (3)
where the Prandtl number Pr ¼ �=j, j is the gas diffusivity,
and Ts is the temperature of the substrate. Under typical ex-
perimental conditions the thermophoretic contribution to the
total mass flux predicted by Eq. (2) is about an order of mag-
nitude smaller than that due to convection/diffusion. Thus,
although thermophoresis can be quite important for large
temperature gradient flows, in the near-ambient conditions
next to the substrate it is expected to be of only minor
importance.
Limiting the analysis therefore to just the combined
effects of convection/diffusion, the flux J of molecules cross-
ing the diffusive layer per unit area per unit time can be writ-
ten as
J � coBSc1=3Re 1=2D
d; (4)
where the Schmidt number Sc ¼ �=D, and D is the diffusion
coefficient which we compute using Epstein’s equation44
Di ¼3
8qr2pd
ffiffiffiffiffiffiffiffiffiffiffimkTg
2p
r; (5)
where d¼ 0.91 is the accommodation coefficient.45 Equation
(4) has been shown to provide a fairly accurate description
of particle flux near the stagnation point under a wide range
of experimental conditions.46 The constant B in Eq. (4)
depends on the experimental geometry and whether flow is
laminar or turbulent. For the conditions used here (nonuni-
form laminar flow from a circular jet at a reduced nozzle-
sample distance z*/d¼ 3.4), a value B¼ 19.9 is appropriate
near the stagnation point.47 Values applicable to other geo-
metries and flow conditions have been tabulated, for exam-
ple, by Chin and Tsang.39
The deposition efficiency e ¼ J=Uco, defined as the
fraction of gas-phase tetracene deposited on the sample,
was measured at a (radially averaged) jet velocity of
U¼ 0.82 m s�1 by attaching a glass wool cartridge to the end
of the nozzle and comparing the amount of tetracene captured
in the cartridge to that deposited on a 1 cm2 sample
under identical conditions without the cartridge. This gave
e ¼ 10 6 5%, which compares to the efficiency predicted by
Eq. (4) of 8.6% for an aerosol composed entirely of tetracene
monomers (i.e., if no gas-phase aggregation occurs). We note
that these deposition efficiencies are higher than typically
achieved in PVD or OMBE film growth, where omnidirec-
tional fluence from the source cell results in only a small frac-
tion of sublimate actually being deposited the substrate.
Because the temperature of the carrier gas was below
the sublimation temperature of tetracene, it is possible that
some aggregation took place as the vapor traveled from the
source cell to the sample. It is well established from studies
of soot formation in hydrocarbon flames that the aggregation
of gas-phase polycyclic aromatic hydrocarbons under
transport-limited conditions leads to aggregates with size
distributions that exhibit dynamic scaling.48–53 Using this as
a model for the aggregation of tetracene in OVLS deposition,
the average particle size would be expected to increase as hii� tz, where i is the number of molecules in the cluster and tis the flight time.54 The exponent z depends on the details of
the aggregation kinetics but for many diffusion-limited clus-
ter aggregation processes z¼ 1.55 The particle radius scales
with the number of molecules in the particle as rp � ix where
x¼ 1/3 for compact particles. If we approximate the full size
distribution with a d-function centered at hii and make use of
the fact that t � U�1, Eqs. (4) and (5) can be combined and
written in terms of the flow velocity as
J ¼ AUb; (6)
where A is a constant and b¼ (4xz – z)/3þ 1/2.
Equation (6) predicts that in the absence of aggregation
b¼ 0.5. This was the situation in the experimental system
employed in Ref. 30, where a heated flow tube was used to
prevent aggregation in an experiment studying carrier gas-
assisted deposition of aluminum tris-(8 hydroxyquinoline)
onto a solid film of N0-diphenyl-N,N0-bis(3-methylphenyl)1-
10biphenyl-4-40diamine and the value predicted here of
b¼ 0.5 was observed. Conversely, in the case of aggregation
the expected value is closer to b � 0.83. Figure 3 shows a
log-log plot of the deposition rate versus flow velocity meas-
ured over a 1 cm2 area centered above the nozzle. The depo-
sition rate obeys the expected power-law dependence on
flow velocity with a slope b¼ 0.89 6 0.08. This is signifi-
cantly larger than the value 0.5 observed in the absence of
aggregation, and agrees with the simple aggregation model
described above to within experimental uncertainty. These
observations suggest that some clustering of gas-phase tetra-
cene probably occurs during transport to the substrate.
Fully developed pipe flow generally occurs when the
length of the nozzle exceeds L> 0.057dRe � 3.4 cm.56 Since
L¼ 7 cm in the experimental apparatus, the radial velocity
profile should therefore more closely resemble fully devel-
oped (Poiseuille) flow than uniform flow. The partial pressure
of tetracene, and hence the flux of tetracene to the sample
074907-4 Shaw et al. J. Appl. Phys. 111, 074907 (2012)
[This article is copyrighted as indicated in the article. Reuse of AIP content is subject to the terms at: http://scitation.aip.org/termsconditions. Downloaded to ] IP:
140.160.178.168 On: Tue, 13 May 2014 20:33:12
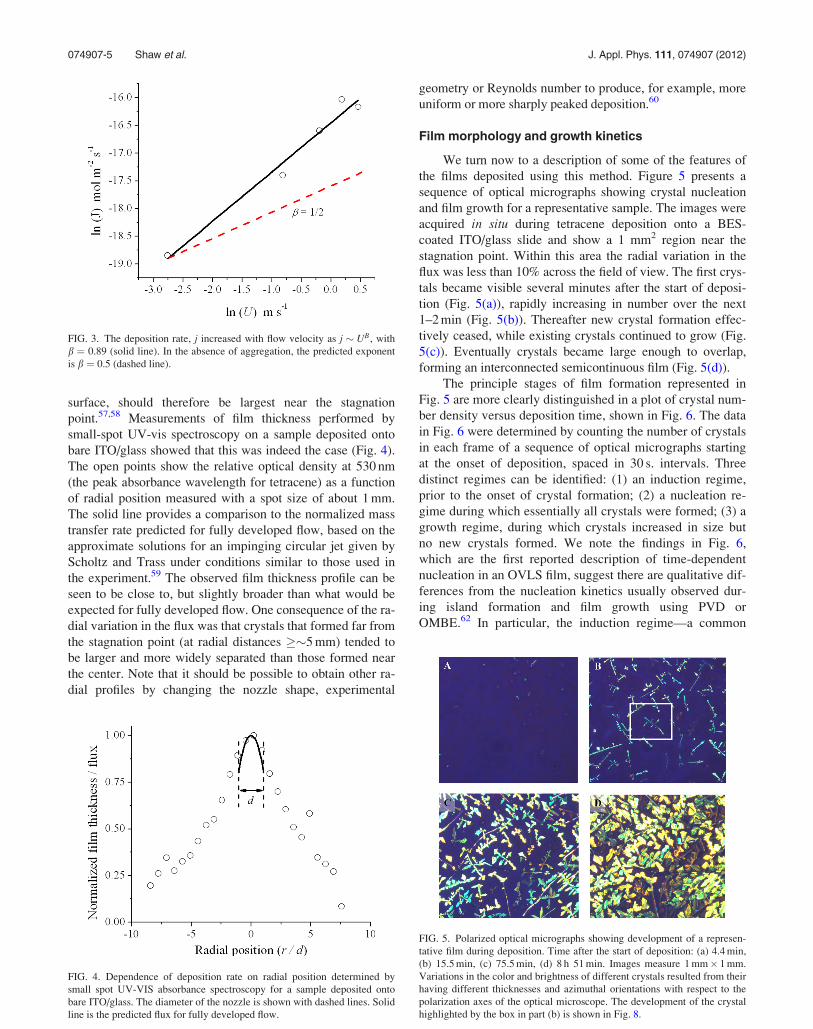
surface, should therefore be largest near the stagnation
point.57,58 Measurements of film thickness performed by
small-spot UV-vis spectroscopy on a sample deposited onto
bare ITO/glass showed that this was indeed the case (Fig. 4).
The open points show the relative optical density at 530 nm
(the peak absorbance wavelength for tetracene) as a function
of radial position measured with a spot size of about 1 mm.
The solid line provides a comparison to the normalized mass
transfer rate predicted for fully developed flow, based on the
approximate solutions for an impinging circular jet given by
Scholtz and Trass under conditions similar to those used in
the experiment.59 The observed film thickness profile can be
seen to be close to, but slightly broader than what would be
expected for fully developed flow. One consequence of the ra-
dial variation in the flux was that crystals that formed far from
the stagnation point (at radial distances ��5 mm) tended to
be larger and more widely separated than those formed near
the center. Note that it should be possible to obtain other ra-
dial profiles by changing the nozzle shape, experimental
geometry or Reynolds number to produce, for example, more
uniform or more sharply peaked deposition.60
Film morphology and growth kinetics
We turn now to a description of some of the features of
the films deposited using this method. Figure 5 presents a
sequence of optical micrographs showing crystal nucleation
and film growth for a representative sample. The images were
acquired in situ during tetracene deposition onto a BES-
coated ITO/glass slide and show a 1 mm2 region near the
stagnation point. Within this area the radial variation in the
flux was less than 10% across the field of view. The first crys-
tals became visible several minutes after the start of deposi-
tion (Fig. 5(a)), rapidly increasing in number over the next
1–2 min (Fig. 5(b)). Thereafter new crystal formation effec-
tively ceased, while existing crystals continued to grow (Fig.
5(c)). Eventually crystals became large enough to overlap,
forming an interconnected semicontinuous film (Fig. 5(d)).
The principle stages of film formation represented in
Fig. 5 are more clearly distinguished in a plot of crystal num-
ber density versus deposition time, shown in Fig. 6. The data
in Fig. 6 were determined by counting the number of crystals
in each frame of a sequence of optical micrographs starting
at the onset of deposition, spaced in 30 s. intervals. Three
distinct regimes can be identified: (1) an induction regime,
prior to the onset of crystal formation; (2) a nucleation re-
gime during which essentially all crystals were formed; (3) a
growth regime, during which crystals increased in size but
no new crystals formed. We note the findings in Fig. 6,
which are the first reported description of time-dependent
nucleation in an OVLS film, suggest there are qualitative dif-
ferences from the nucleation kinetics usually observed dur-
ing island formation and film growth using PVD or
OMBE.62 In particular, the induction regime—a common
FIG. 3. The deposition rate, j increased with flow velocity as j � UB, with
b ¼ 0.89 (solid line). In the absence of aggregation, the predicted exponent
is b ¼ 0.5 (dashed line).
FIG. 4. Dependence of deposition rate on radial position determined by
small spot UV-VIS absorbance spectroscopy for a sample deposited onto
bare ITO/glass. The diameter of the nozzle is shown with dashed lines. Solid
line is the predicted flux for fully developed flow.
FIG. 5. Polarized optical micrographs showing development of a represen-
tative film during deposition. Time after the start of deposition: (a) 4.4 min,
(b) 15.5 min, (c) 75.5 min, (d) 8 h 51 min. Images measure 1 mm� 1 mm.
Variations in the color and brightness of different crystals resulted from their
having different thicknesses and azimuthal orientations with respect to the
polarization axes of the optical microscope. The development of the crystal
highlighted by the box in part (b) is shown in Fig. 8.
074907-5 Shaw et al. J. Appl. Phys. 111, 074907 (2012)
[This article is copyrighted as indicated in the article. Reuse of AIP content is subject to the terms at: http://scitation.aip.org/termsconditions. Downloaded to ] IP:
140.160.178.168 On: Tue, 13 May 2014 20:33:12

feature in liquid-phase crystallization—is usually nonexis-
tent for growth on bare surfaces, and nucleation continues at
a reduced rate well into the growth regime. The induction re-
gime in OVLS deposition can be understood in terms of the
concentration of tetracene in the solvent layer, which stead-
ily increases until eventually reaching a sufficiently high
supersaturation C�C* to initiate nucleation. For the sample
in Fig. 6 this occurred about 4 min after the start of deposi-
tion. Based on the flux rate (J¼ 1016 molecules m�2 s�1)
and the solvent layer thickness (d¼ 1.9 lm), the critical
supersaturation concentration can be estimated to be
C*¼ 4 6 2 mM. This compares to the saturation concentra-
tion of tetracene in BES which was separately measured to
be 0.7 6 0.1 mM.
Also shown in Fig. 6, the formation of new crystals was
limited to a brief period of time (the nucleation regime) after
which all nucleation effectively ceased. This indicates either
a heterogeneous nucleation mechanism involving a finite
number of seeding sites, such as impurities, which eventually
become titrated, or an eventual reduction in the solution
phase concentration of tetracene to C<C* as a result of
uptake by growing crystals. The former is inconsistent with
our observation that the nucleation density generally tended
to increase with increasing deposition rate, suggesting the
latter is more likely. The lack of new crystal nucleation in
the growth regime also shows that the flux of vapor-phase
tetracene reaching the solvent layer contained no aerosol par-
ticles large enough to serve as critical nuclei. This indicates
that, despite the use of near ambient conditions, vapor-phase
aggregates must be small. We note that under typical experi-
mental conditions the arrival of tetracene from the vapor was
never directly observed by optical microscopy, even at the
highest magnification used (500�). This means that the larg-
est gas-phase clusters reaching the surface must be less than
about 1 lm in size.
Although the in-plane orientation of crystals in BES
appeared to be random, the out-of-plane (polar orientation)
was almost perfectly uniform, as can be inferred from the
x-ray diffractogram in Fig. 7. The data in Fig. 7 were
acquired from a �75 nm thick film that had been rinsed in
hexane to remove most BES. The peak positions agree with
the previously reported bulk crystal structure of tetracene,61
with all major reflections corresponding to the (00 l) family of
planes. This indicates that the ab-plane of the unit cell was
very nearly coplanar with the substrate. A small impurity
peak at 2h¼ 10� is assigned to 5,12-napthacenequinone, the
major oxidation product of tetracene. The same impurity was
also attributed to the appearance of needle-shaped crystals
(not shown) also observed on most samples. X-ray diffraction
measurements on films deposited onto bare surfaces (without
a solvent layer) were identical to the results in Fig. 7, indicat-
ing that the preferred planar orientation and crystal structure
of tetracene were not affected by the BES solvent layer.
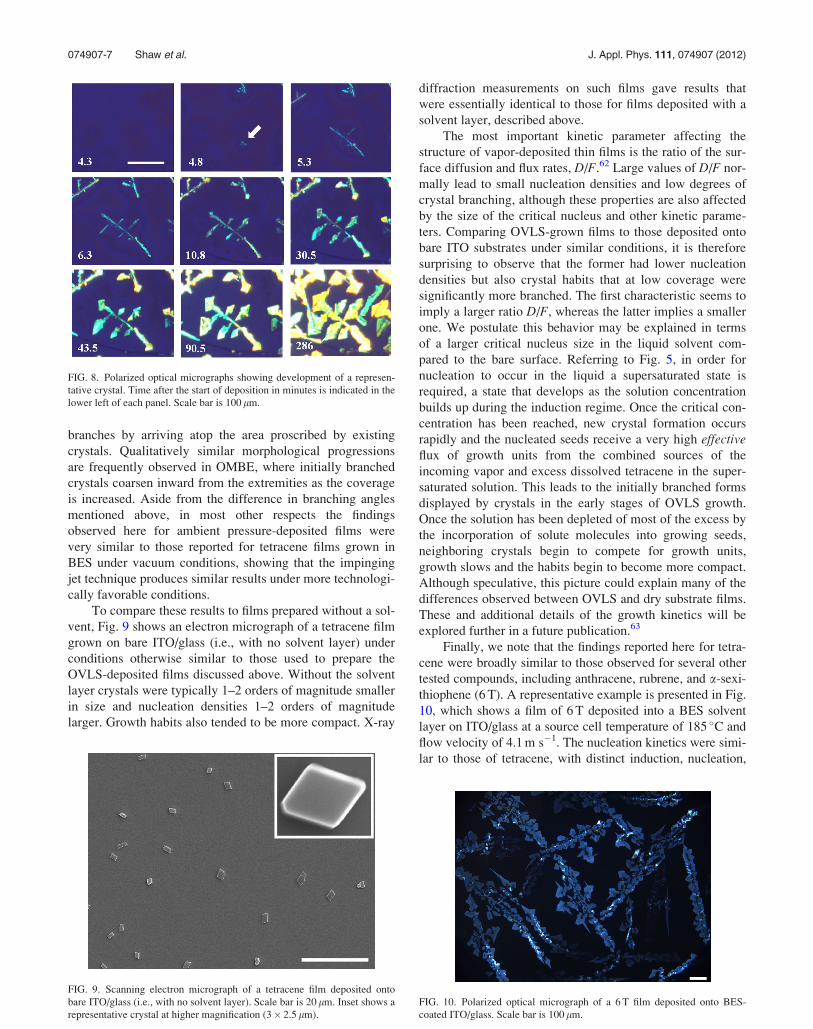
To illustrate some further aspects of the growth kinetics,
the growth of one representative crystal is followed in more
detail in Fig. 8. Nucleation occurred near the point indicated
by an arrow in the second panel. The primary axis of the
crystal developed first, with branches appearing soon after-
wards. Measurements of the branching angles from a number
of crystals showed that the majority made an angle of
90 6 5� with the primary axis, consistent with growth along
the [100] and [010] axes, which form an angle of 93.7� (see
inset, Fig. 7).61 This contrasts with the observations reported
in Ref. 18 for tetracene growth in BES under vacuum condi-
tions, where branching angles of approximately 35�–40�
were predominately observed, consistent with growth along
the [110] and [1�10] directions.
As shown in Fig. 8, once crystals reached a certain size
longitudinal growth slowed and the branch tips began to
coarsen, forming prismatic shapes with well-defined facets.
Coarsening progressed from branch extremities inwards,
with the primary crystal axis growing most slowly. These
characteristics are consistent with a diffusion-driven mecha-
nism in which crystals receive new growth units primarily
from the surrounding quasi-2D concentration field, but also
including growth units able to penetrate the crevices between
FIG. 6. Crystal formation and growth took place in three distinct stages: an
induction regime prior to crystal formation; a nucleation regime typified by
a large rate of new crystal formation; and a growth regime during which
existing crystals continued to grow but almost no new crystals formed.
FIG. 7. X-ray diffractogram of tetracene deposited onto BES-coated ITO/
glass after rinsing in hexane to remove excess solvent. Note reflections
exclusively from the (00 l) planes. The peak denoted with an asterisk is
assigned to 5,12-napthacenequinone, an oxidation impurity of tetracene.
Inset shows the unit cell viewed looking down on the substrate.
074907-6 Shaw et al. J. Appl. Phys. 111, 074907 (2012)
[This article is copyrighted as indicated in the article. Reuse of AIP content is subject to the terms at: http://scitation.aip.org/termsconditions. Downloaded to ] IP:
140.160.178.168 On: Tue, 13 May 2014 20:33:12
branches by arriving atop the area proscribed by existing
crystals. Qualitatively similar morphological progressions
are frequently observed in OMBE, where initially branched
crystals coarsen inward from the extremities as the coverage
is increased. Aside from the difference in branching angles
mentioned above, in most other respects the findings
observed here for ambient pressure-deposited films were
very similar to those reported for tetracene films grown in
BES under vacuum conditions, showing that the impinging
jet technique produces similar results under more technologi-
cally favorable conditions.
To compare these results to films prepared without a sol-
vent, Fig. 9 shows an electron micrograph of a tetracene film
grown on bare ITO/glass (i.e., with no solvent layer) under
conditions otherwise similar to those used to prepare the
OVLS-deposited films discussed above. Without the solvent
layer crystals were typically 1–2 orders of magnitude smaller
in size and nucleation densities 1–2 orders of magnitude
larger. Growth habits also tended to be more compact. X-ray
diffraction measurements on such films gave results that
were essentially identical to those for films deposited with a
solvent layer, described above.
The most important kinetic parameter affecting the
structure of vapor-deposited thin films is the ratio of the sur-
face diffusion and flux rates, D/F.62 Large values of D/F nor-
mally lead to small nucleation densities and low degrees of
crystal branching, although these properties are also affected
by the size of the critical nucleus and other kinetic parame-
ters. Comparing OVLS-grown films to those deposited onto
bare ITO substrates under similar conditions, it is therefore
surprising to observe that the former had lower nucleation
densities but also crystal habits that at low coverage were
significantly more branched. The first characteristic seems to
imply a larger ratio D/F, whereas the latter implies a smaller
one. We postulate this behavior may be explained in terms
of a larger critical nucleus size in the liquid solvent com-
pared to the bare surface. Referring to Fig. 5, in order for
nucleation to occur in the liquid a supersaturated state is
required, a state that develops as the solution concentration
builds up during the induction regime. Once the critical con-
centration has been reached, new crystal formation occurs
rapidly and the nucleated seeds receive a very high effectiveflux of growth units from the combined sources of the
incoming vapor and excess dissolved tetracene in the super-
saturated solution. This leads to the initially branched forms
displayed by crystals in the early stages of OVLS growth.
Once the solution has been depleted of most of the excess by
the incorporation of solute molecules into growing seeds,
neighboring crystals begin to compete for growth units,
growth slows and the habits begin to become more compact.
Although speculative, this picture could explain many of the
differences observed between OVLS and dry substrate films.
These and additional details of the growth kinetics will be
explored further in a future publication.63
Finally, we note that the findings reported here for tetra-
cene were broadly similar to those observed for several other
tested compounds, including anthracene, rubrene, and a-sexi-
thiophene (6 T). A representative example is presented in Fig.
10, which shows a film of 6 T deposited into a BES solvent
layer on ITO/glass at a source cell temperature of 185 �C and
flow velocity of 4.1 m s�1. The nucleation kinetics were simi-
lar to those of tetracene, with distinct induction, nucleation,
FIG. 8. Polarized optical micrographs showing development of a represen-
tative crystal. Time after the start of deposition in minutes is indicated in the
lower left of each panel. Scale bar is 100 lm.
FIG. 9. Scanning electron micrograph of a tetracene film deposited onto
bare ITO/glass (i.e., with no solvent layer). Scale bar is 20 lm. Inset shows a
representative crystal at higher magnification (3� 2.5 lm).
FIG. 10. Polarized optical micrograph of a 6 T film deposited onto BES-
coated ITO/glass. Scale bar is 100 lm.
074907-7 Shaw et al. J. Appl. Phys. 111, 074907 (2012)
[This article is copyrighted as indicated in the article. Reuse of AIP content is subject to the terms at: http://scitation.aip.org/termsconditions. Downloaded to ] IP:
140.160.178.168 On: Tue, 13 May 2014 20:33:12

and growth regimes. Also similar to tetracene, 6 T deposited
onto BES-coated substrates resulted in much larger crystals
(up to �1 mm in size) than on bare surfaces, and crystals dis-
played similar planar, branched growth habits. These obser-
vations suggest that the findings reported above for tetracene
should be applicable to a range of other OMC-forming
compounds.
CONCLUSIONS
A method for comparatively rapid and mass-efficient
deposition of highly crystalline organic films under near am-
bient conditions of pressure and temperature has been
reported. By delivering an organic precursor via an imping-
ing gas jet to a solvent-coated substrate, transport across the
diffusive boundary layer near the substrate is enhanced, per-
mitting flux rates comparable to those achieved in vacuum
and producing very similar crystalline films. Although there
is evidence for some solid aerosol formation during vapor
delivery, gas phase clusters appear to be small enough to dis-
solve in the solvent layer. Combining gas jet delivery with
OVLS growth leads to larger crystals and lower nucleation
densities than on bare surfaces, with nucleation and growth
kinetics that reflect characteristics of both surface and liquid-
phase growth. Preliminary results from related compounds
suggest that these findings should be broadly applicable to a
range of organic materials.
ACKNOWLEDGMENTS
This work was supported by the National Science Foun-
dation (DMR-0705908). The authors thank C. Lund and B.
Ricker for their contributions.
1G. R. Desiraju, Crystal Engineering – The Design of Organic Solids(Elsevier, New York, 1989); M. Pope and C. E. Swenberg, ElectronicProperties in Organic Crystals and Polymers, 2nd ed. (Oxford University
Press, Oxford, 1999).2R. F. Service, Science 278, 383 (1997); F. Garnier, R. Hajlaoui, A. Yasser,
and P. Srivastava, Science 265, 1684 (1994); C. J. Drury, C. M. J. Mut-
saers, C. M. Hart, M. Matters, and D. W. de Leeuw, Appl. Phys. Lett. 73,
108 (1998).3M. C. Petty, Biosens. Bioelectron. 10, 129 (1995).4N. Greenham and R. H. Friend, Solid State Physics: Advances in Researchand Applications, 49, edited by H. Ehrenreich and F. Spaepen (Academic,
San Diego, 1995), pp. 1–149.5A. J. Lovinger and L. J. Rothberg, J. Mater. Res. 11, 1581 (1996); H. E.
Katz, J. Mater. Chem. 7, 369 (1997); F. Garnier, Chem. Phys. 227, 253
(1998); G. Horowitz, Adv. Mater. 10, 365 (1998).6J. Singleton and C. Mielke, Contemp. Phys. 43, 63 (2002).7J. S. Miller and A. J. Epstein, Angew. Chem. Int. Ed. 33, 385 (1994).8M. Mas-Torrent, P. Hadley, S. T. Bromley, X. Ribas, J. Tarres, M. Mas, E.
Molins, J. Veciana, and C. Rovira, J. Am. Chem. Soc. 126, 8546 (2004).9J. H. Schon, C. Kloc, R. A. Laudise, and B. Batlogg, Phys. Rev. B 58,
12952 (2002).10R. W. I. de Boer, T. M. Klapwijk, and A. F. Morpurgo, Appl. Phys. Lett.
83, 4345 (2003).11D. J. Gundlach, J. A. Nichols, L. Zhou, and T. N. Jackson, Appl. Phys.
Lett. 80, 2925 (2002).12Crystal and Solid State Physics, edited by O. Madelung (Springer-Verlag,
New York, 1985).13J. G. Laquindanum, H. E. Katz, A. J. Lovinger, and A. Dodabalapur,
Chem. Mater. 8, 2542 (1996); T. Minakata, H. Imai, and M. Ozaki, J.
Appl. Phys. 72, 5220 (1992); A. J. Lovinger, H. E. Katz, and A. Dodabala-
pur, Chem. Mater. 10, 3275 (1998); A. J. Makinen, A. R. Melnyk, S.
Schoemann, R. L. Headrick, and Y. Gao, Phys. Rev. B 60, 14683 (1999).
14E. A. Silinsh and V. Eapek, Organic Molecular Crystals Interaction,Localization, and Transport Phenomena (AIP, New York, 1994).
15N. Karl, in Crystals – Growth, Properties and Applications, edited by H.
C. Freyhard (Springer, New York, 2001).16A. Afzali, C. D. Dimitrakopoulos, and T. L. Breen, J. Am. Chem. Soc.
124, 8812 (2002).17S. R. Forrest, Chem. Rev. 97, 1793 (1997).18M. Voigt, S. Dorsfeld, A. Volz, and M. Sokolowski, Phys. Rev. Lett. 91,
026103–1 (2003).19R. S. Wagner and W. C. Ellis, Appl. Phys. Lett. 4, 89 (1964).20R. S. Wagner, Whisker Technology, Chap. 3, edited by A. P. Levitt (Wiley,
New York, 1970).21T. J. Trentler, K. M. Hickman, S. C. Goel, A. M. Viano, P. C. Gibbons,
and W. E. Buhro, Science 270, 1791 (1995).22A. M. Morales and C. M. Lieber, Science 279, 208 (1998).23X. Liu and M. Wuttig, Phys. Rev. B 73, 033405–1 (2006).24T. Shimada, Y. Ishii, K. Ueno, and T. Hasegawa, J. Cryst. Growth 311,
163 (2008).25Y. Ishii, T. Shimada, N. Okazaki, and T. Hasegawa, Langmuir 23, 6864
(2007).26Y. Takeyama, S. Maruyama, and Y. Matsumoto, Cryst. Gr. Design 11,
2273 (2011).27F. S. Wilkinson, R. F. Norwood, J. M. McLellan, L. R. Lawson, and D. L.
Patrick, J. Am. Chem. Soc. 128, 16468 (2006).28R. R. Lunt, J. B. Benziger, and S. R. Forrest, Adv. Mat. 22, 1233 (2010).29S. S. Lee, C. S. Kim, E. D. Gomez, B. Purushothaman, M. F. Toney, C. Wang,
A. Hexemer, J. E. Anthony, and Y.-L. Loo, Adv. Mat. 21, 3605 (2009).30M. A. Baldo, M. Deutsch, P. E. Burrows, H. Gossenberger, M. Gersten-
berg, V. S. Ban, and S. R. Forrest, Adv. Mater. 10, 1505 (2009).31M. Shtein, H. F. Gossenberger, J. B. Benziger, and S. R. Forrest, J. Appl.
Phys. 89, 1470 (2001).32M. A. Baldo, V. G. Kozlov, P. E. Burrows, S. R. Forrest, V. S. Ban, B.
Koene, and M. E. Thompson, Appl. Phys. Lett. 71, 3033 (1997).33S. J. Kwon and I. W. Seo, Exp. Fluids 38, 801 (2005).34A. J. Reynolds, J. Fluid Mech. 14, 552 (1962).35H. Schlichting, Z. Angew. Math. Mech. 13, 260 (1933).36The extinction coefficient of tetracene in mixed hexanes was determined
to be 321,000 cm�1 M�1 at 274 nm.37H. Schlichting, Boundary Layer Theory (McGraw-Hill, New York, 1960).38D. F. Rogers, Laminar Flow Analysis (Cambridge University Press, Cam-
bridge, 1992).39D.-T. Chin and C.-H. Tsang, J. Electrochem. Soc.: Electrochem. Sci. Tech-
nol. 125, 1461 (1978).40D. W. Cooper, M. H. Peters, and R. J. Miller, Aerosol. Sci. & Technol. 11,
133 (1989).41M. H. Peters, D. W. Cooper, and R. J. Miller, J. Aerosol. Sci. 20, 123
(1989).42G.-W. Bae, C. S. Lee, and S. O. Park, Aerosol. Sci. Technol. 23, 231
(1995).43L. Z. Waldmann and K. H. Schmitt, Aerosol Science, edited by C. N. Da-
vies (Academic, London, 1966).44J. Cai and V. M. Sorensen, Phys. Rev. E 50, 3397 (1994).45K. J. Duan, G. J. Smallwood, and F. Liu, J. Heat Transf. 130, 121201–1
(2008).46See for example: Y. Otani, H. Emi, C. Kanaoka, and K. Kato, J. Aerosol
Sci. 20, 787 (1989); B. Y. H. Liu and K. Ahn, Aersol. Sci. Technol. 6, 215
(1987).47The parameter B was calculated from Equation III-1 given in Ref. 39,
which is based on a least-squares curve fitting to the theoretical predictions
in M. T. Scholtz and O. Trass, AlChE J. 16, 82 (1970).48W. Kim, C. M. Sorensen, D. Fry, and A. Chakrabarti, Aerosol Sci. 37, 386
(2006).49K. A. Jensen, J. M. Suo-Antilla, and L. G. Blevins, Combust. Sci. Technol.
179, 2453 (2007).50U. O. Koylu, G. M. Faeth, T. L. Farias, and M. G. Carvalho, Combust.
Flame 100, 621 (1995).51R. K. Chakrabarty, H. Moosmuller, W. P. Arnott, M. A. Garro, G. Tian, J.
G. Slowik, E. S. Cross, J.-H. Han, P. Davidovits, T. B. Onasch, and D. R.
Worsnop, Phys. Rev. Lett. 102, 235504 (2009) and references therein.52X. Li and B. E. Logan, Environ. Sci. Technol. 31, 1237 (1997).53D. A. Weitz and M. Y. Lin, Phys. Rev. Lett. 57, 2037 (1986).54G. Sposito, Coll. Surf. A: Phys. Eng. Aspects 120, 101 (1997).55M. H. Lin, H. M. Lindsay, D. A. Weitz, R. C. Ball, R. Klein, and P. Mea-
kin, Proc. R. Soc. Lond. A 423, 71 (1989).
074907-8 Shaw et al. J. Appl. Phys. 111, 074907 (2012)
[This article is copyrighted as indicated in the article. Reuse of AIP content is subject to the terms at: http://scitation.aip.org/termsconditions. Downloaded to ] IP:
140.160.178.168 On: Tue, 13 May 2014 20:33:12

56H. L. Langhaar, J. Appl. Mech. 9, 55 (1942).57H. Martin, Adv. Heat Transfer 13, 1 (1977).58F. Giralt, C.-J. Chia, and O. Trass, Ind. Eng. Chem., Fundam. 16, 21 (1977).59M. T. Scholtz and Trass, AlChE J. 16, 90 (1970). Equation 23 along with
values from Table I for H/R¼ 1 was used in the calculation of the profile
for fully developed flow. The calculation was performed using Sc¼ 1.98
and Re¼ 216 with the resulting Sherwood number normalized to the radial
position x/R¼ 0 for comparison to the experimental data.
60D. J. Phares, G. R. Smedley, and R. C. Flagan, Phys. Fluids 12, 2046
(2000).61J. M. Robertson, V. C. Sinclair, and J. Trotter, Acta Cryst. 14, 697 (1961);
R. B. Campbell, J. M. Robertson, and J. Trotter, Acta Cryst. 15, 289
(1962).62J. W. Evans, P. A. Thiel, and M. C. Bartelt, Surf. Sci. Rep. 61, 1 (2006).63A. Baronov, D. Shaw, K. Bufkin, C. Lund, B. L. Johnson, and D. L. Pat-
rick (to be submitted).
074907-9 Shaw et al. J. Appl. Phys. 111, 074907 (2012)
[This article is copyrighted as indicated in the article. Reuse of AIP content is subject to the terms at: http://scitation.aip.org/termsconditions. Downloaded to ] IP:
140.160.178.168 On: Tue, 13 May 2014 20:33:12