Orf 467 – Transportation Systems Analysis Fall 2007/8 11/9/2007Week 8 16 1 1 1 2 2 2 3 3 3 4 3 55...
73
11/9/2007 Week 8 f 467 – Transportation Systems Analysis ll 2007/8 1 6 1 1 1 2 2 2 3 3 3 4 3 5 5 6 6 8 8 9 6 PROBLEM: How to get from A to B •Many Paths •Each with a Different Value to the Decision Maker •Each Segment Changing with Uncertainty over Time Addressing the Real-time Aspects In Turn-by-turn Navigation 4
-
date post
20-Dec-2015 -
Category
Documents
-
view
215 -
download
1
Transcript of Orf 467 – Transportation Systems Analysis Fall 2007/8 11/9/2007Week 8 16 1 1 1 2 2 2 3 3 3 4 3 55...

11/9/2007 Week 8
Orf 467 – Transportation Systems Analysis Fall 2007/8
1 6
1
1 1
2
2
2
3
3
3
4
3
5 5
6
6
8
8
9
6
PROBLEM: How to get from A to B•Many Paths
•Each with a Different Value to the Decision Maker
•Each Segment Changing with Uncertainty over Time
Addressing the Real-time Aspects In Turn-by-turn Navigation
4

11/9/2007 Week 8
Orf 467 – Transportation Systems Analysis Fall 2007/8
Link Travel TimesHistoric, Actual & Forecast During Day One week-day on one link
Things change!

11/9/2007 Week 8
Orf 467 – Transportation Systems Analysis Fall 2007/8
The Measurement Problem
• How to collect the real time Speed Data?– Incremental Infrastructure
• In pavement loop detectors (single point)
• radar/laser/video signpost systems (single point)
• EZ Pass readers (2 point span measurement, Excellent)
– Processing “Existing” Data• Wireless Location Technology (Cellular Probes, see Fontaine, et al)
– Cell-tower trilateration
» Yet to demonstrate sufficient accuracy
– Cell-handoff processing
» maybe OK for simple networks
• Floating Car (Vehicle Probe) data processing (see Demers et al)
11/9/2007 Week 8
Orf 467 – Transportation Systems Analysis Fall 2007/8
Cell Probe Technology• Practical success requires more than cell phones• Cell phone movement based on cell location and “hand-offs”
from one cell to another• Pattern recognition techniques filter out data from those not
on the highway• Then traffic algorithms generate travel times and speeds on
roadway links• Cell phones need to be turned on, but not necessarily in use• Full regional systems in place in Baltimore, Antwerp, and Tel
Aviv = 4,600 miles, Shanghai

11/9/2007 Week 8
Orf 467 – Transportation Systems Analysis Fall 2007/8
Cell Probe Technology
GSM
SampleObserverSampleSample
ObserverObserver
Cell
Cell
Cell
Directionof travel
GSMGSM
SampleObserverSampleSample
ObserverObserver
Cell
Cell
Cell
Directionof travel

11/9/2007 Week 8
Orf 467 – Transportation Systems Analysis Fall 2007/8
Cell Probe Privacy
Speeds on road links
Personal cellular
position data
Estimotion sample
observer
Estimotion traffic
situation
ITIS publishing systems
Cellular network operator
Cellular network operator ITISITIS
Firewall
Speeds on road links
Personal cellular
position data
Estimotion sample
observer
Estimotion traffic
situation
ITIS publishing systems
Cellular network operator
Cellular network operator ITISITIS
Firewall

11/9/2007 Week 8
Orf 467 – Transportation Systems Analysis Fall 2007/8Handset 49, part 1

11/9/2007 Week 8
Orf 467 – Transportation Systems Analysis Fall 2007/8Handset 49, part 2
11/9/2007 Week 8
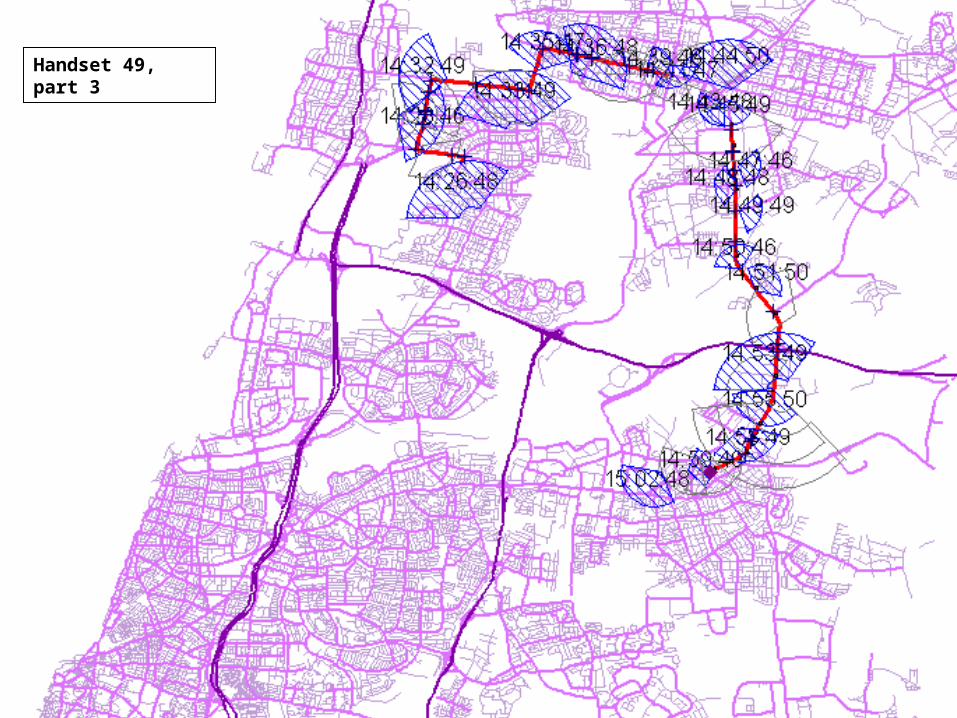
Orf 467 – Transportation Systems Analysis Fall 2007/8Handset 49, part 3

11/9/2007 Week 8
Orf 467 – Transportation Systems Analysis Fall 2007/8Handset 49, part 4
11/9/2007 Week 8
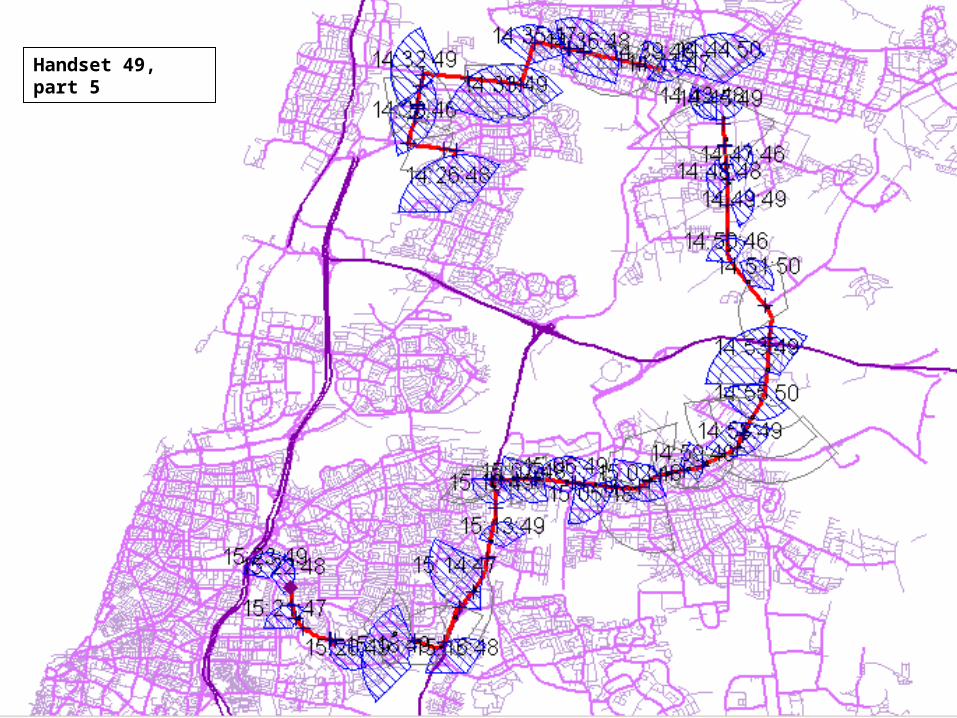
Orf 467 – Transportation Systems Analysis Fall 2007/8Handset 49, part 5

11/9/2007 Week 8
Orf 467 – Transportation Systems Analysis Fall 2007/8Handset 49, part6

11/9/2007 Week 8
Orf 467 – Transportation Systems Analysis Fall 2007/8Handset 49, full trip

11/9/2007 Week 8
Orf 467 – Transportation Systems Analysis Fall 2007/8Handset 49, full trip

11/9/2007 Week 8
Orf 467 – Transportation Systems Analysis Fall 2007/8
Path-Finding Drive Tests
Handset 47Handset 47 Handset 52Handset 52
Handset 49Handset 49 GPS TrackGPS Track
(b)(a)
(c) (d)

11/9/2007 Week 8
Orf 467 – Transportation Systems Analysis Fall 2007/8
Baltimore MMTIS• Provides first regional deployment of commercial-
quality cellular traffic probes in North America• Mutually profitable public-private partnership
– Test commercial markets during project– Integrate with existing public data – including transit and E-911– Encourage public applications beyond traditional ITS
• Contract signed September 2004; data flow to Maryland DOT began April 2005

11/9/2007 Week 8
Orf 467 – Transportation Systems Analysis Fall 2007/8
Baltimore MMTIS – Private Firms• Delcan-NET
– Transportation and technology consultants– Fifty plus years in business– Profitable every year; staff = 500 plus
• ITIS Holdings– Leader in traffic probes; staff = 100– Commercial customers – 16 automobile firms, for-profit 511– Profitable!– Publicly traded on London exchange
• National cellular firms

11/9/2007 Week 8
Orf 467 – Transportation Systems Analysis Fall 2007/8

11/9/2007 Week 8
Orf 467 – Transportation Systems Analysis Fall 2007/8
MARYLAND DOT CAMERAS SHOW ACCURACY OF TRAFFIC INFORMATION BEING CAPTURED USING CELL PROBES
I-695 at HARTFORD ROADMonday, June 6th 2005
9:02:18 am
11/9/2007 Week 8
Orf 467 – Transportation Systems Analysis Fall 2007/8
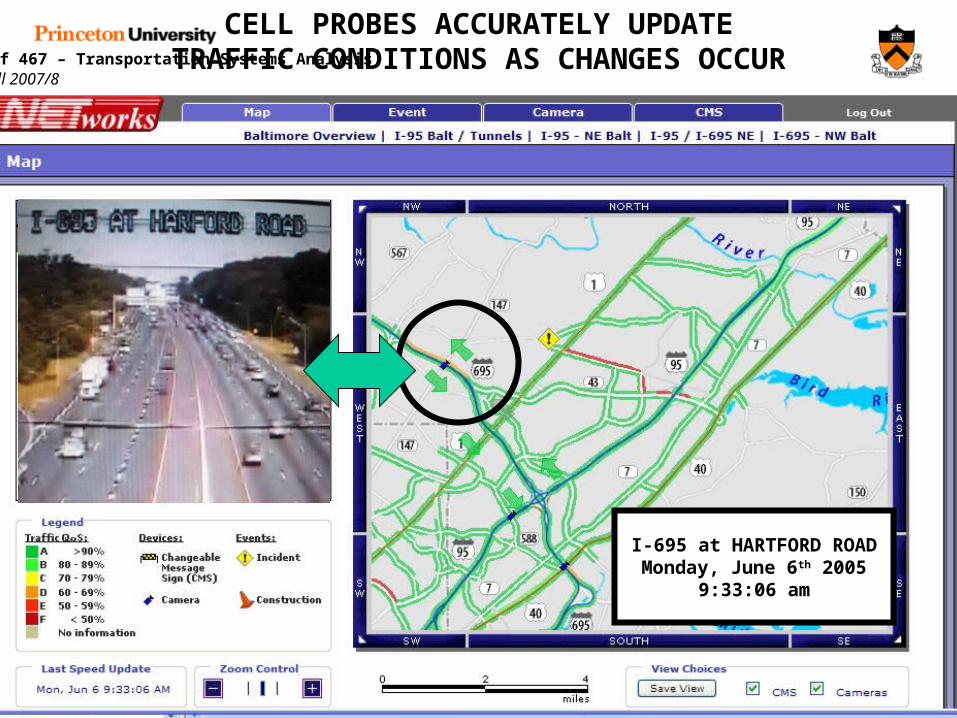
I-695 at HARTFORD ROADMonday, June 6th 2005
9:33:06 am
CELL PROBES ACCURATELY UPDATETRAFFIC CONDITIONS AS CHANGES OCCUR
11/9/2007 Week 8
Orf 467 – Transportation Systems Analysis Fall 2007/8
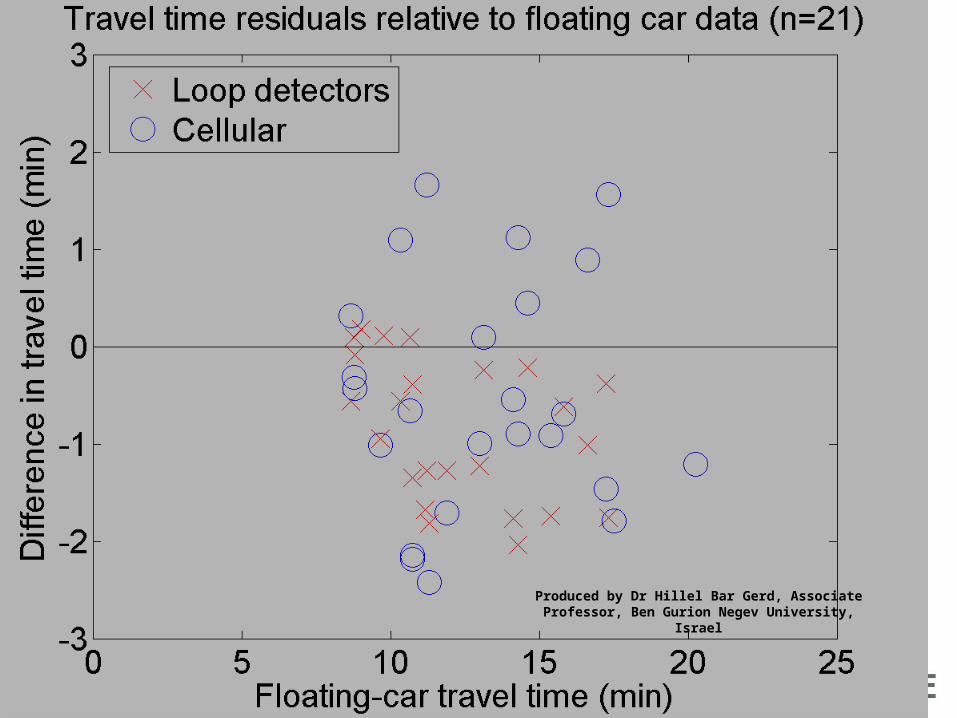
Produced by Dr Hillel Bar Gerd, Associate Professor, Ben Gurion Negev University, Israel

11/9/2007 Week 8
Orf 467 – Transportation Systems Analysis Fall 2007/8
Baltimore Comparison with RTMS DataTraffic Situation reported by ITIS CFVD™ Technology and RTMS equipment
Baltimore I-695 @ I-70 Inner loop - Friday, August 12
0
10
20
30
40
50
60
70
80
01:
00
02:
00
03:
00
04:
00
05:
00
06:
00
07:
00
08:
00
09:
00
10:
00
11:
00
12:
00
13:
00
14:
00
15:
00
16:
00
17:
00
18:
00
19:
00
Local Time (EDT)
Reported Speed (MPH)
ITIS CFVD™ data RTMS data

11/9/2007 Week 8
Orf 467 – Transportation Systems Analysis Fall 2007/8
Analysis Route Overview
alon
This slide gives an overview of the Baltimore ring, and the north-western part which was analysed for this presentation

11/9/2007 Week 8
Orf 467 – Transportation Systems Analysis Fall 2007/8
Performance data I-695 – July 2005

11/9/2007 Week 8
Orf 467 – Transportation Systems Analysis Fall 2007/8
Baltimore I-695 Weekday Patterns
DistanceTime
CongestionStatus
06:00
12:00
19:00
24:00

11/9/2007 Week 8
Orf 467 – Transportation Systems Analysis Fall 2007/8
Baltimore I-695 Saturday Patterns
Distance
CongestionStatus
06:00
12:00
Time

11/9/2007 Week 8
Orf 467 – Transportation Systems Analysis Fall 2007/8
Baltimore I-695 Route Travel Time
Journey Time (sec)
Time
Day of week
08:00
18:00May
June
July
11/9/2007 Week 8
Orf 467 – Transportation Systems Analysis Fall 2007/8
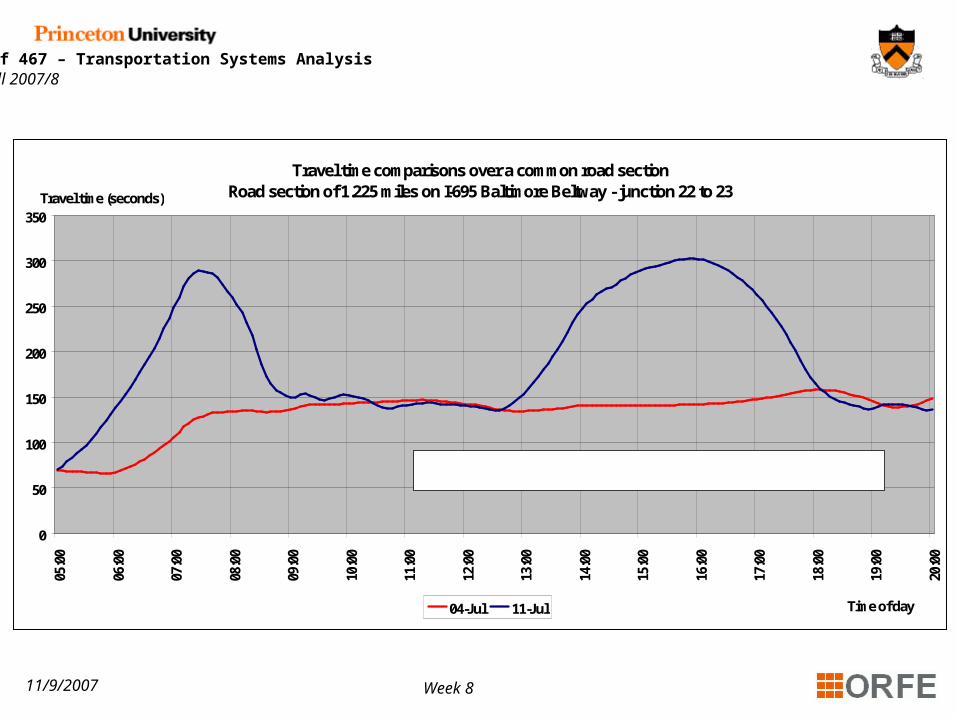
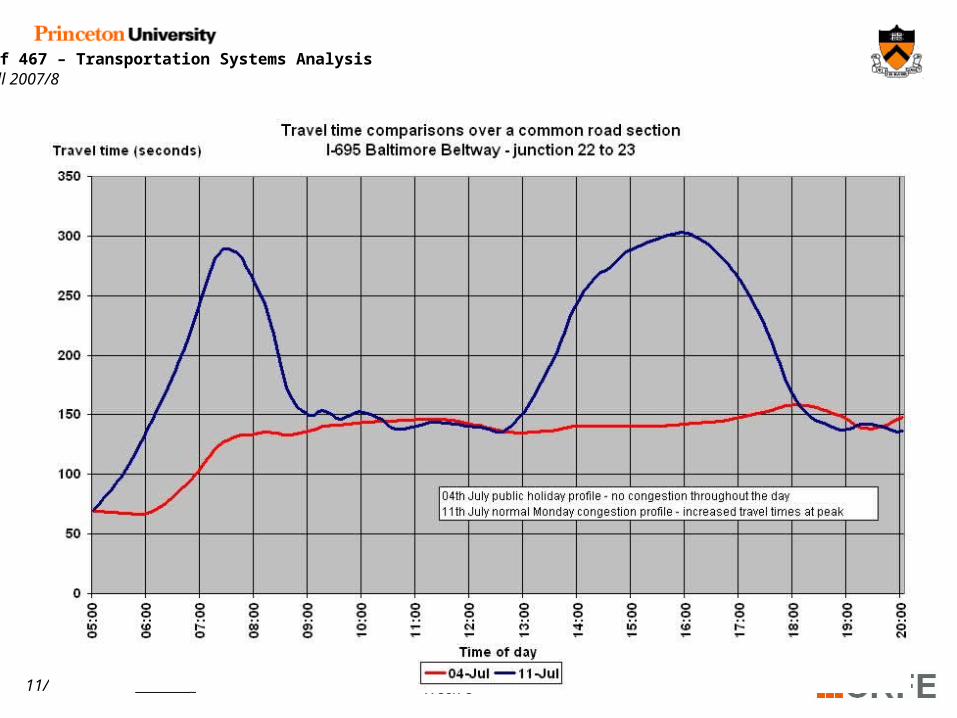
Travel time comparisons over a common road sectionRoad section of 1.225 miles on I-695 Baltimore Beltway - junction 22 to 23
0
50
100
150
200
250
300
350
05:0
0
06:0
0
07:0
0
08:0
0
09:0
0
10:0
0
11:0
0
12:0
0
13:0
0
14:0
0
15:0
0
16:0
0
17:0
0
18:0
0
19:0
0
20:0
0
Time of day
Travel time (seconds)
04-Jul 11-Jul
04th July public holiday profile - no congestion throughout the day11th July normal Monday congestion profile - increased travel times at peak times
11/9/2007 Week 8
Orf 467 – Transportation Systems Analysis Fall 2007/8
11/9/2007 Week 8
Orf 467 – Transportation Systems Analysis Fall 2007/8

11/9/2007 Week 8
Orf 467 – Transportation Systems Analysis Fall 2007/8
Vehicle Probes
• Assign Speed data to network segments of Digital Map database, or
• Maintain travel times between strategically located virtual monuments

11/9/2007 Week 8
Orf 467 – Transportation Systems Analysis Fall 2007/8 North American Monument Network
• ~125,000 North American “Monuments”• ~106 (mi, mj)• Can create Median travel Tims by Time-of-Day
– For Example: AM Peak, Midday, PM Peak, Night, Weekend day
(mi, mj) near Troy (mi, mj) larger area

11/9/2007 Week 8
Orf 467 – Transportation Systems Analysis Fall 2007/8
Median Speed (by direction) on National Highway Network 1:30pm 11/14/07
> 40 mph < 40 mph 1:30pm
11/14/07
height ~ speed
11/9/2007 Week 8
Orf 467 – Transportation Systems Analysis Fall 2007/8
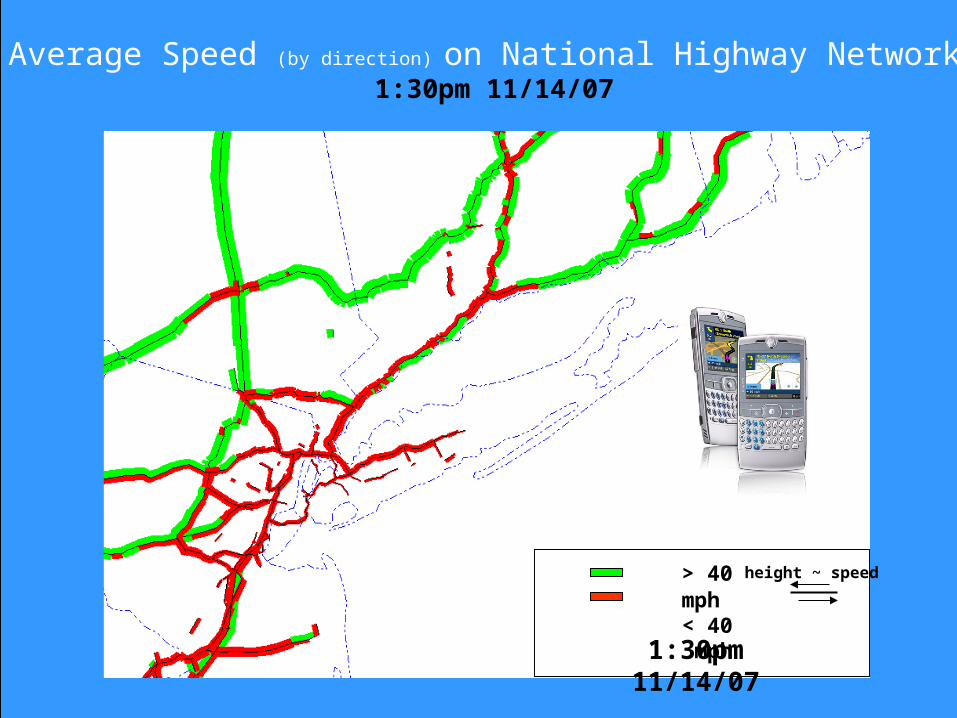
Average Speed (by direction) on National Highway Network 1:30pm 11/14/07
> 40 mph < 40 mph
1:30pm 11/14/07
height ~ speed

11/9/2007 Week 8
Orf 467 – Transportation Systems Analysis Fall 2007/8
Real-Time Dynamic Minimum ETA Sat/Nav
•250 Volunteers using CoPilot|Live commuting to/from RPI
• CoPilot continuously shares real-time probe-based traffic data
• CoPilot continuously seeks a minimum ETA route
“Advance” project Illinois Universities
Transportation Research Consortium
The late 90s
Conducted its version of the abandoned “ADVANCE” (Advanced Driver and Vehicle Advisory Navigation ConcEpt )project
&
Won ITS America’s 2007“Best Innovative Research” Award
11/9/2007 Week 8
Orf 467 – Transportation Systems Analysis Fall 2007/8
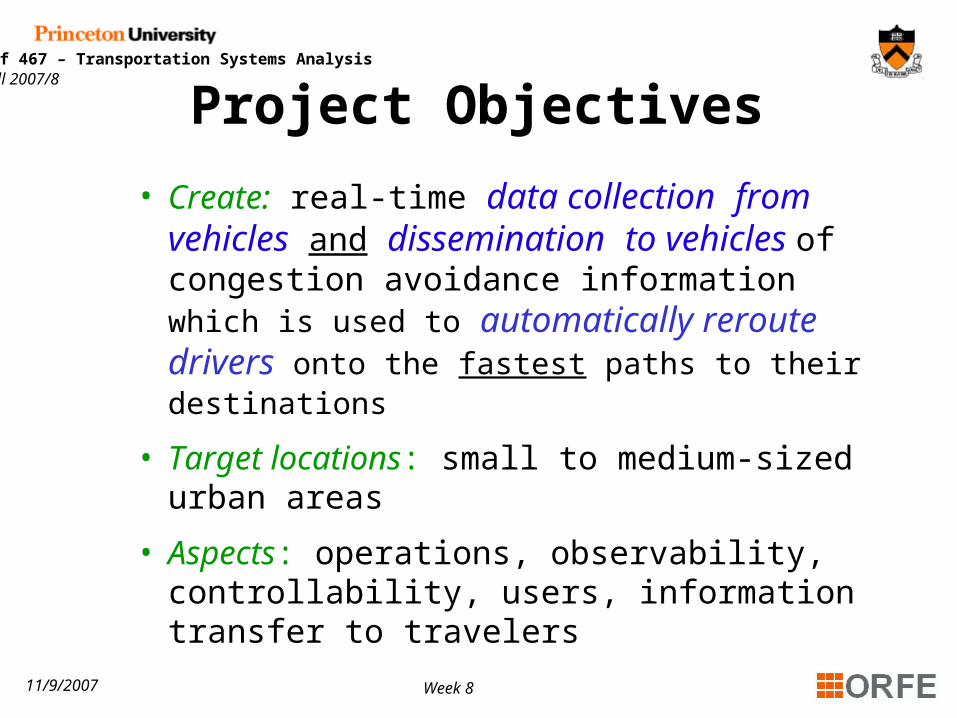
Project Objectives
• Create: real-time data collection from vehicles and dissemination to vehicles of congestion avoidance information which is used to automatically reroute drivers onto the fastest paths to their destinations
• Target locations: small to medium-sized urban areas
• Aspects: operations, observability, controllability, users, information transfer to travelers

11/9/2007 Week 8
Orf 467 – Transportation Systems Analysis Fall 2007/8
3-month field test
Capital District (Albany), NY, USA
Journey-to-work
200 participants80 Tech Park employees120 HVCC staff & students“Techy” travelers
Network:Freeways & signalized arterialsCongested linksPath choices exist
I 90
I 787
US
HW
Y 4
STATE
HW
Y 32
STATE HWY 2
STATE HWY 151US HW
Y 9
STATE HWY 378
2ND
ST
STATE HWY 155
WASHINGTON AVE
WINTER ST
15T
H S
T
STATE HWY 43
8TH
ST
STA
TE
HW
Y 3
77B
RO
AD
WAY
AV
E
CAMPBELL AVE
ACCESS RD
1ST ST
STATE HWY 136
COUNTY HWY 130
TIBBITS AVE
LIN
CO
LN A
VE
RA
MP
LOU
DO
N R
D
STATE HWY 43
RAMP
RA
MP
RA
MP
RAMP
RA
MP
HVCC
Rensselaer Technology
Park
TroyColonie
North Greenbush
Albany
Experiment Details
11/9/2007 Week 8
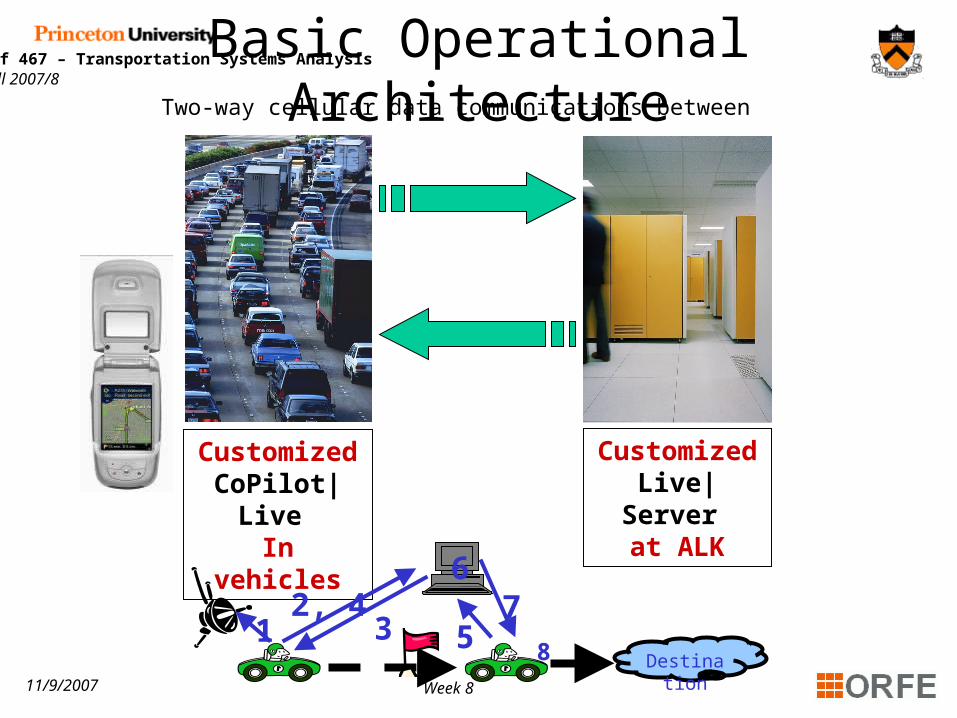
Orf 467 – Transportation Systems Analysis Fall 2007/8 Basic Operational Architecture
Two-way cellular data communications between
Customized Live|Server
at ALK
Customized CoPilot|Live
In vehicles
6
Destination
12, 4
3 57
8

11/9/2007 Week 8
Orf 467 – Transportation Systems Analysis Fall 2007/8 Every Second
CoPilot|Live Determines “Where am I”, Then…
CoPilot|Live “Where Am I”,
Then…
ALK Server Updates:
TT(mi, mj )
If Momument, mj , is passed
Send mi , mj , ttk(mi, mj )= t(mi) - t(mi)
(52 bytes)
Set i=j

11/9/2007 Week 8
Orf 467 – Transportation Systems Analysis Fall 2007/8 Every “n” Minutes
ALK Server Builds: set Uk
Sends: TT(mi, mj ) for every (i,j) in Uk
CoPilot|Live … Send… Current Location & Destination,
Last update time (42 bytes)
ALK Server …Send… New TT(mi, mj ) for every (i,j) in Uk
(280 bytes/100arcs)
CoPilot|Live …Updates TT(mi, mj ) in Uk , ETA on current route, Finds new
MinETA route, if MinETA “substantially” better then… Adopt new route
ALK Server …Determines Uk : set of TT(mi, mj ) within “bounding polygon”
of (Location;Destination)k that have changed more than “y%” since last update.
CoPilot|Live Sends: “Where am I”, Dest., Last update Receives/Posts: updatesComputes: MinETA Updates route, if better
11/9/2007 Week 8
Orf 467 – Transportation Systems Analysis Fall 2007/8
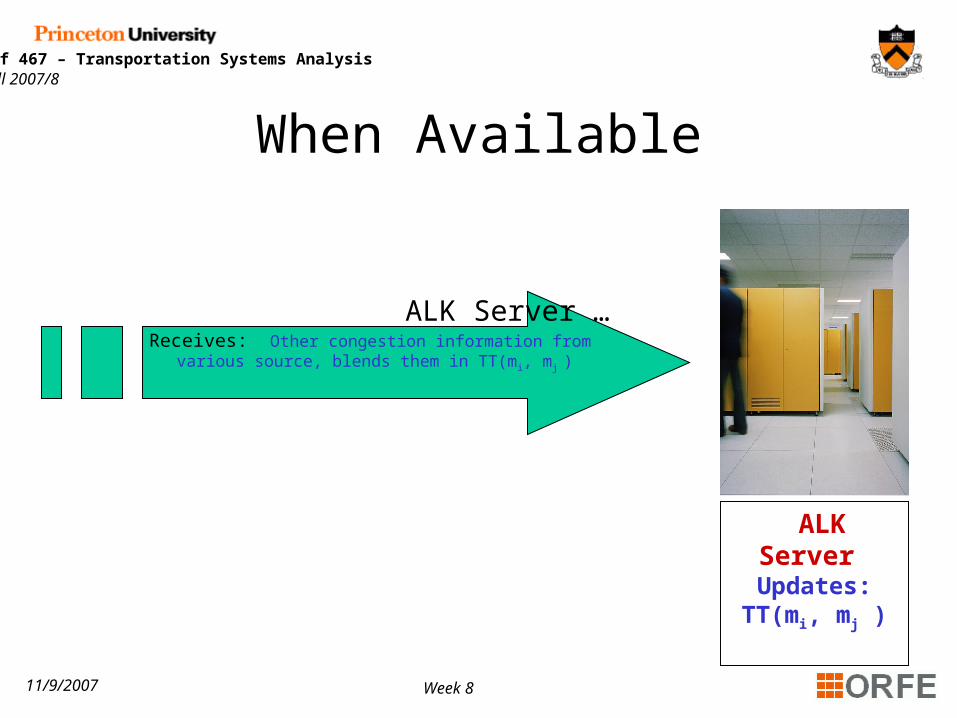
When Available
ALK Server …Receives: Other congestion information from various
source, blends them in TT(mi, mj )
ALK Server Updates:
TT(mi, mj )

11/9/2007 Week 8
Orf 467 – Transportation Systems Analysis Fall 2007/8 What We Heard
I find it interesting how willing I am to listen to a machine tell me
which route to take
I like using it for when I have no idea on how to get somewhere, and it is good for my normal
route because it keeps me out of traffic on route 4.
It is great, it took a while to trust it telling me where to go, but i like it because i
cant get lost! Thanks.
This thing is awesome. I was a little skeptical at first but once i got the hang
of it I don’t know how I went along without it. I think any student commuting
to school will benefit from this.
I'm very impressed with the CoPilot program thus far. The
directions are accurate and it adapts quickly to route changes.
11/9/2007 Week 8
Orf 467 – Transportation Systems Analysis Fall 2007/8
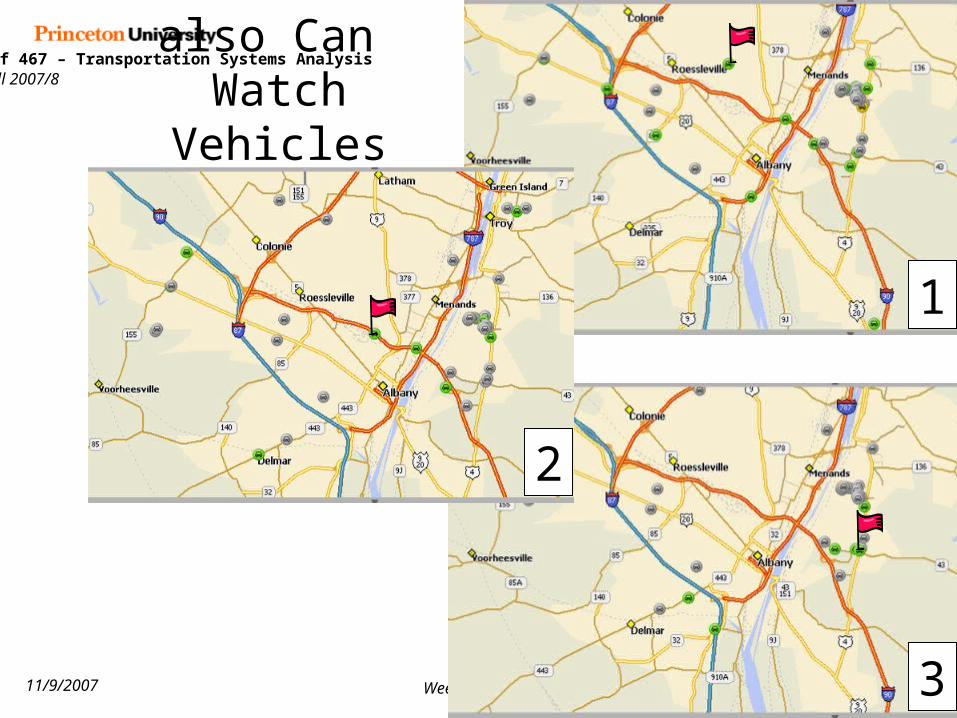
1
2
3
also Can Watch Vehicles
11/9/2007 Week 8
Orf 467 – Transportation Systems Analysis Fall 2007/8
Forecasting Travel Times Using Exponential Smoothig

11/9/2007 Week 8
Orf 467 – Transportation Systems Analysis Fall 2007/8
Historical Expectation: Concepts
•Patterns Differ over Days & Time of Day
•Most Significant Difference is Between Weekdays and Weekends
Zoo Interchange – Hale Interchange (All Days)

11/9/2007 Week 8
Orf 467 – Transportation Systems Analysis Fall 2007/8
Historical Expectation: Concepts
•Two Peak Periods
•Each appears to be Bell Shaped
•Afternoon Peak Period Appears to have “Extra Hump”

11/9/2007 Week 8
Orf 467 – Transportation Systems Analysis Fall 2007/8
Historical Expectation: Solution
estimatedbetoparametersareCKand
Where
CCCKtfTT
TimeTravelWeekday
iii
te
,,,2
1),(
:
),(),(),()(
22/2)(
2
333222111
11/9/2007 Week 8
Orf 467 – Transportation Systems Analysis Fall 2007/8
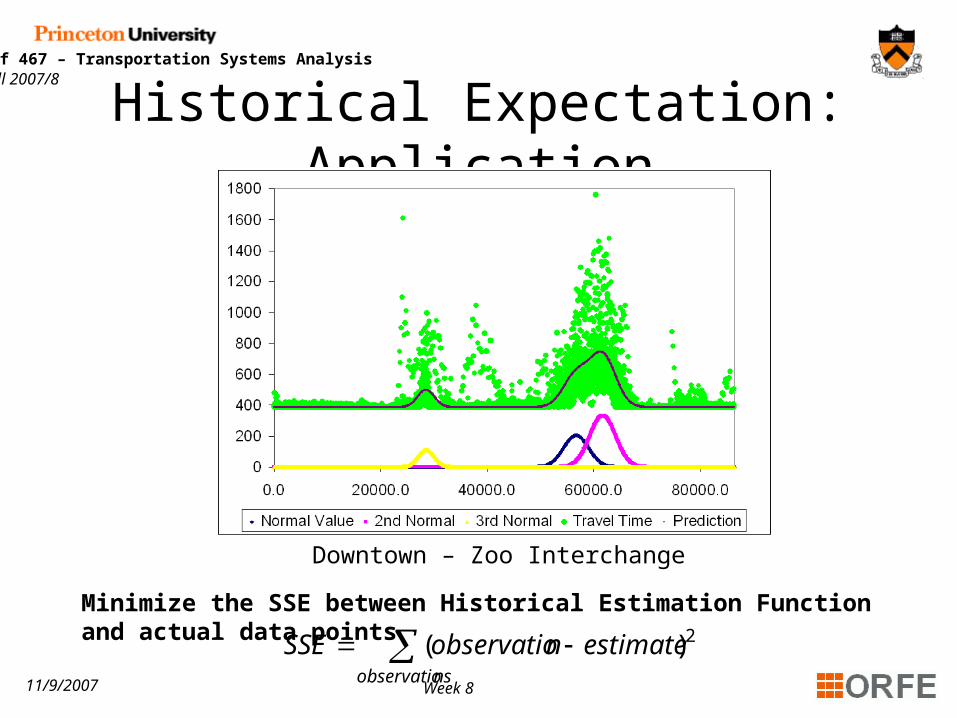
Historical Expectation: Application
Minimize the SSE between Historical Estimation Function and actual data points
nsobservatio
estimatenobservatioSSE 2)(
Downtown – Zoo Interchange
11/9/2007 Week 8
Orf 467 – Transportation Systems Analysis Fall 2007/8
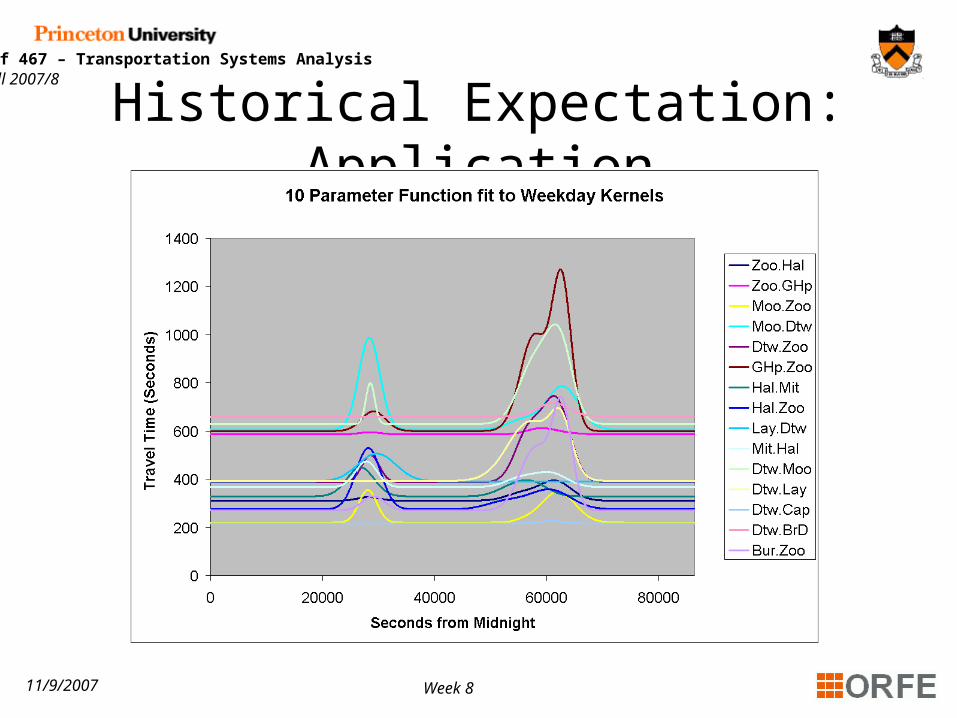
Historical Expectation: Application
11/9/2007 Week 8
Orf 467 – Transportation Systems Analysis Fall 2007/8
Using Real-Time Information to Improve our Estimate

11/9/2007 Week 8
Orf 467 – Transportation Systems Analysis Fall 2007/8
Including Real-Time Information: Concepts
Real-Time Information
“Since a desirable route needs to be given when the driver asks for it, but the computation of such a route requires travel times which occur later, we need to be able to forecast such travel times.”DEFINITION: A real-time travel time is a data
point that can be received or constructed and measures the time it takes to traverse a specific route from one location to another location ending now.

11/9/2007 Week 8
Orf 467 – Transportation Systems Analysis Fall 2007/8
Including Real-Time Information: Concepts
Peak Hour Characteristics & Return to
Normalcy250
350
450
550
650
750
850
950
1050
0 10000 20000 30000 40000 50000 60000 70000 80000
Function
Real Data
580
680
780
880
980
1080
1180
1280
0 10000 20000 30000 40000 50000 60000 70000 80000
Series2
Series1
During Peak Hours, Traffic Patterns Remain at a relatively constant distance to Historical Estimate
There will be a time at which traffic patterns will return to free flow conditions
Moorland - Downtown
Burleigh - Zoo

11/9/2007 Week 8
Orf 467 – Transportation Systems Analysis Fall 2007/8
•Method of “smoothing” a time series of observations•Most recent observations are given a high weight and previous observations are given lower weights that decrease exponentially with the age of the observation
Including Real-Time Information: Concepts
Exponential Smoothing
310)1(11
tSyS ttt
10)1(
10)1(
11
111
bSSbbSyStttt
tttt
10)1(
10)1(
10)1(
11
111
ISy
I
bSSb
bSIy
S
Ltt
tt
tttt
ttLt
tt
Single
Double
Triple

11/9/2007 Week 8
Orf 467 – Transportation Systems Analysis Fall 2007/8
Including Real-Time Information: Solution
•During Peak Periods:
•Adaptation of Double Exponential Smoothing
•Trend is the Trend of the Historical Estimate
•Observation weighted with Most Recent Estimate + Slope for Smoothed Estimate
•Forecast done by adding trend to most recent estimate
}1,0{ parameters smoothing ~ }{
functionparameter 10 Estimated)(
:
)()(
:
)()()1(
:
11
111
n
nnnn
nnnnn
t
where
tt
Forecast
tt
Smoothing
SS
SXS
11/9/2007 Week 8
Orf 467 – Transportation Systems Analysis Fall 2007/8
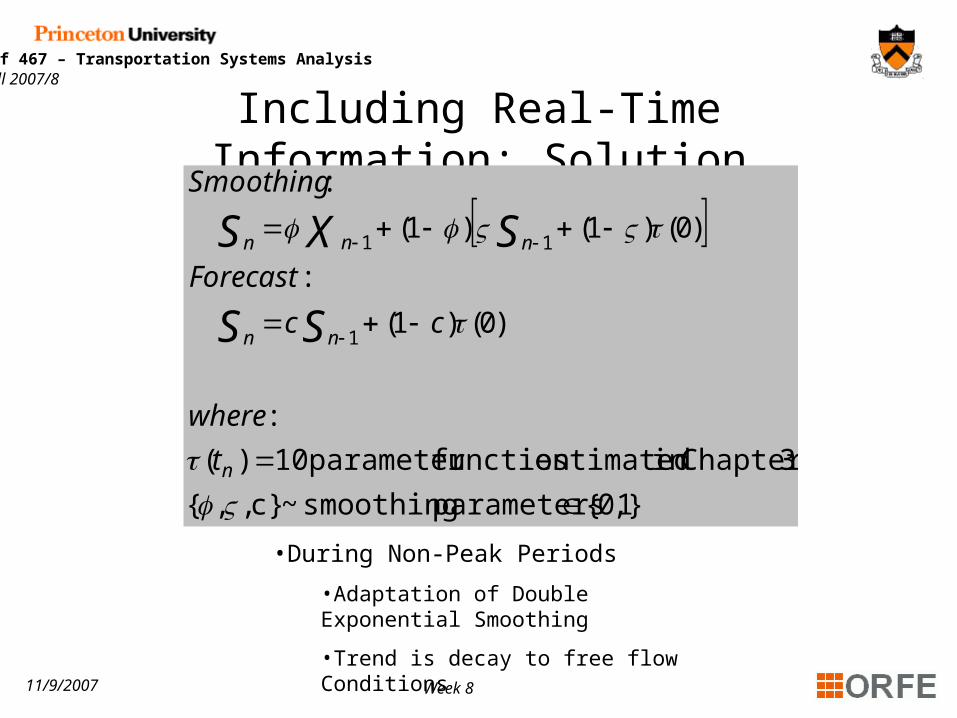
Including Real-Time Information: Solution
•During Non-Peak Periods
•Adaptation of Double Exponential Smoothing
•Trend is decay to free flow Conditions
}1,0{ parameters smoothing ~ c},,{
3Chapter in estimatedfunction parameter 10)(
:
)0()1(
:
)0()1()1(
:
1
11
n
nn
nnn
t
where
cc
Forecast
Smoothing
SS
SXS

11/9/2007 Week 8
Orf 467 – Transportation Systems Analysis Fall 2007/8
250
450
650
850
1050
1250
1450
0 10000 20000 30000 40000 50000 60000 70000 80000
Smoothing
Function
Real Data
250
450
650
850
1050
1250
1450
0 10000 20000 30000 40000 50000 60000 70000 80000
Smoothing
Function
Real Data
0.0
0.2
0.4
0.6
0.8
1.0
0 10000 20000 30000 40000 50000 60000 70000 80000
Weights
Including Real-Time Information: Solution
Burleigh – Zoo (June 14)

11/9/2007 Week 8
Orf 467 – Transportation Systems Analysis Fall 2007/8 Including Real-Time Information:
Application

11/9/2007 Week 8
Orf 467 – Transportation Systems Analysis Fall 2007/8
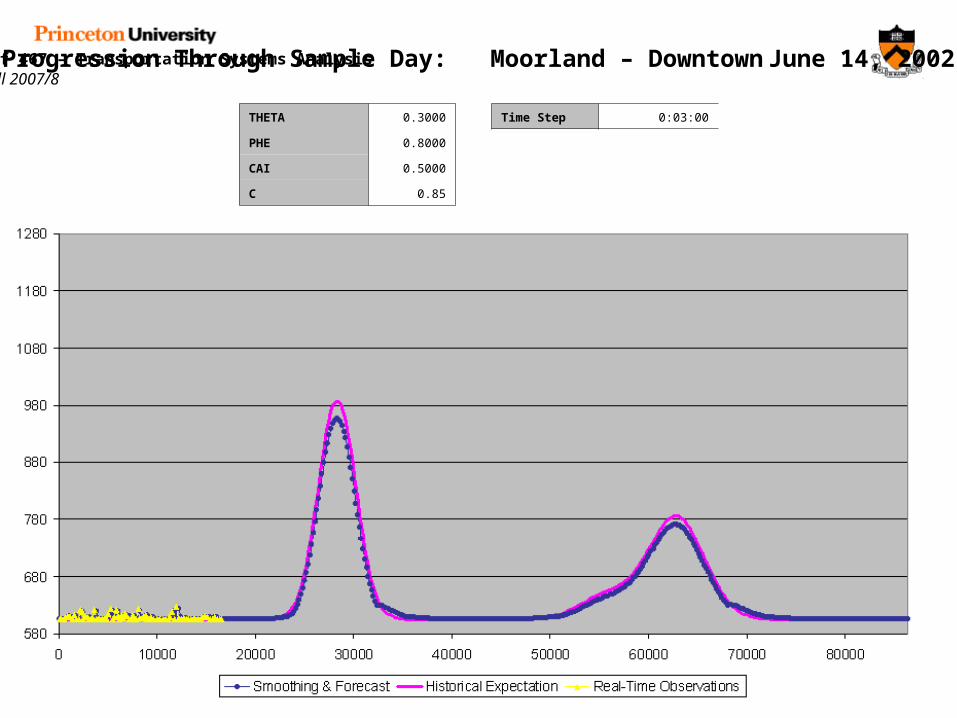
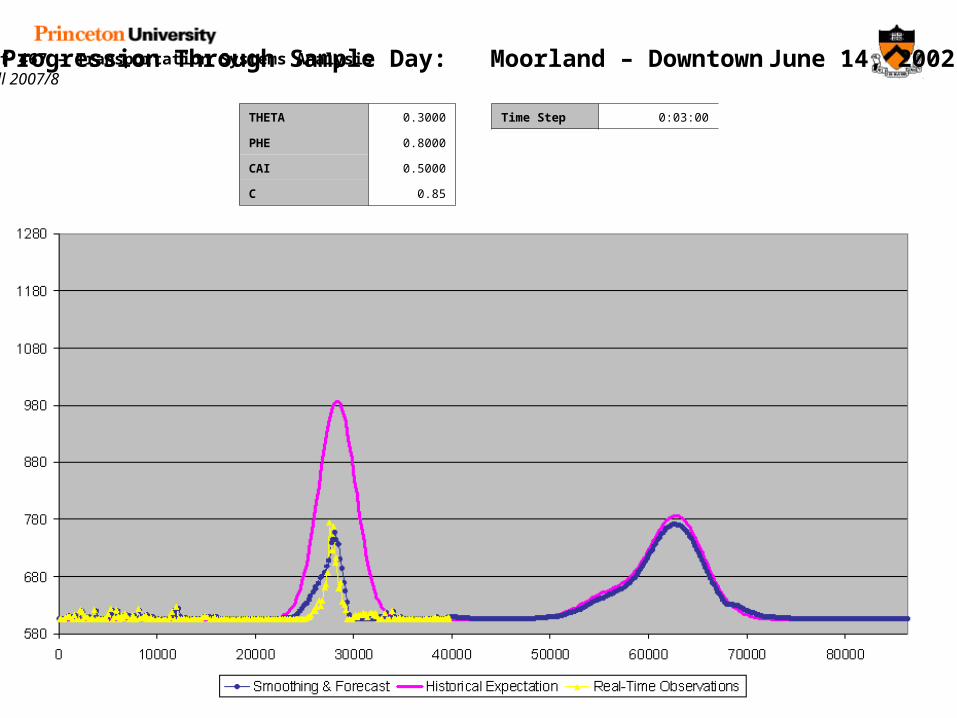
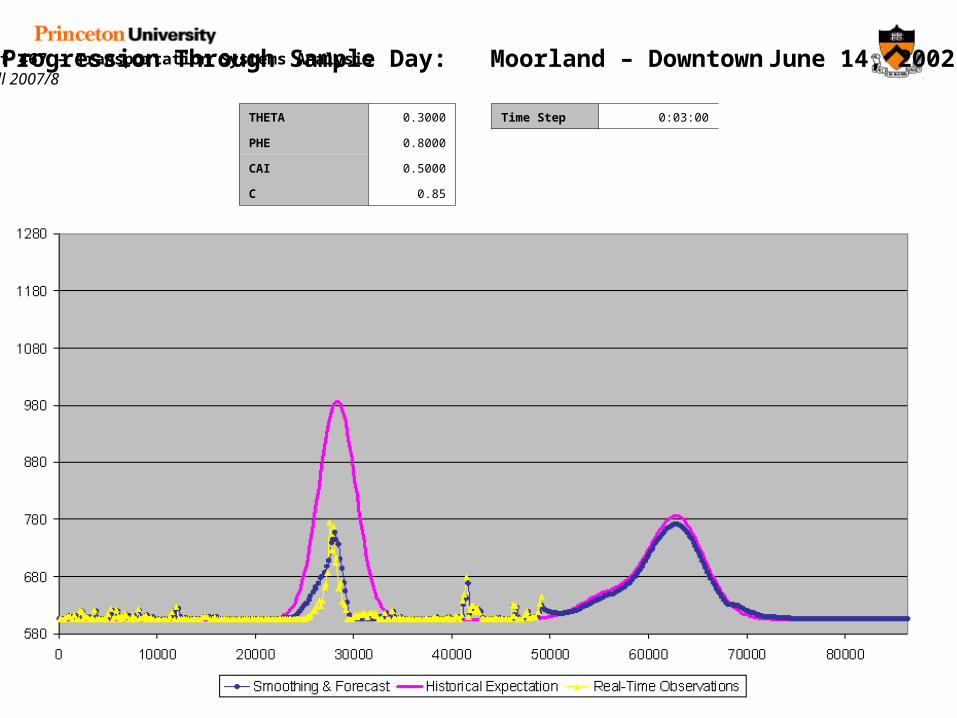
THETA 0.3000 Time Step 0:03:00
PHE 0.8000
CAI 0.5000
C 0.85
Progression Through Sample Day: Moorland – DowntownJune 14, 2002
11/9/2007 Week 8
Orf 467 – Transportation Systems Analysis Fall 2007/8
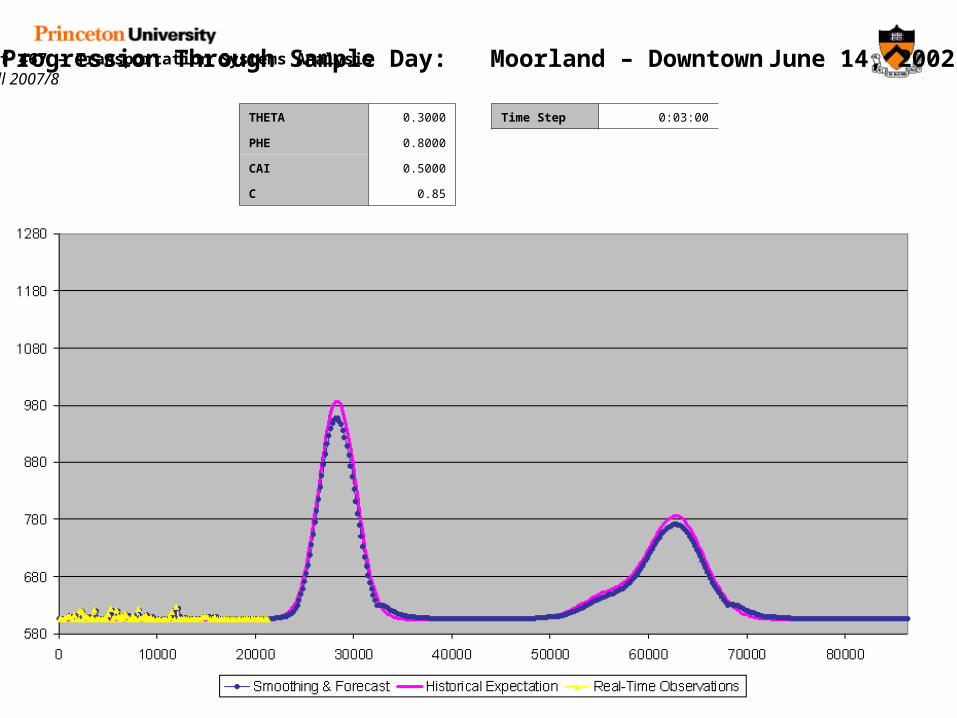
THETA 0.3000 Time Step 0:03:00
PHE 0.8000
CAI 0.5000
C 0.85
Progression Through Sample Day: Moorland – DowntownJune 14, 2002
11/9/2007 Week 8
Orf 467 – Transportation Systems Analysis Fall 2007/8
THETA 0.3000 Time Step 0:03:00
PHE 0.8000
CAI 0.5000
C 0.85
Progression Through Sample Day: Moorland – DowntownJune 14, 2002

11/9/2007 Week 8
Orf 467 – Transportation Systems Analysis Fall 2007/8
THETA 0.3000 Time Step 0:03:00
PHE 0.8000
CAI 0.5000
C 0.85
Progression Through Sample Day: Moorland – DowntownJune 14, 2002

11/9/2007 Week 8
Orf 467 – Transportation Systems Analysis Fall 2007/8
THETA 0.3000 Time Step 0:03:00
PHE 0.8000
CAI 0.5000
C 0.85
Progression Through Sample Day: Moorland – DowntownJune 14, 2002
11/9/2007 Week 8
Orf 467 – Transportation Systems Analysis Fall 2007/8
THETA 0.3000 Time Step 0:03:00
PHE 0.8000
CAI 0.5000
C 0.85
Progression Through Sample Day: Moorland – DowntownJune 14, 2002

11/9/2007 Week 8
Orf 467 – Transportation Systems Analysis Fall 2007/8
THETA 0.3000 Time Step 0:03:00
PHE 0.8000
CAI 0.5000
C 0.85
Progression Through Sample Day: Moorland – DowntownJune 14, 2002
11/9/2007 Week 8
Orf 467 – Transportation Systems Analysis Fall 2007/8
THETA 0.3000 Time Step 0:03:00
PHE 0.8000
CAI 0.5000
C 0.85
Progression Through Sample Day: Moorland – DowntownJune 14, 2002

11/9/2007 Week 8
Orf 467 – Transportation Systems Analysis Fall 2007/8
THETA 0.3000 Time Step 0:03:00
PHE 0.8000
CAI 0.5000
C 0.85
Progression Through Sample Day: Moorland – DowntownJune 14, 2002

11/9/2007 Week 8
Orf 467 – Transportation Systems Analysis Fall 2007/8
THETA 0.3000 Time Step 0:03:00
PHE 0.8000
CAI 0.5000
C 0.85
Progression Through Sample Day: Moorland – DowntownJune 14, 2002

11/9/2007 Week 8
Orf 467 – Transportation Systems Analysis Fall 2007/8
THETA 0.3000 Time Step 0:03:00
PHE 0.8000
CAI 0.5000
C 0.85
Progression Through Sample Day: Moorland – DowntownJune 14, 2002

11/9/2007 Week 8
Orf 467 – Transportation Systems Analysis Fall 2007/8
THETA 0.3000 Time Step 0:03:00
PHE 0.8000
CAI 0.5000
C 0.85
Progression Through Sample Day: Moorland – DowntownJune 14, 2002

11/9/2007 Week 8
Orf 467 – Transportation Systems Analysis Fall 2007/8
THETA 0.3000 Time Step 0:03:00
PHE 0.8000
CAI 0.5000
C 0.85
Progression Through Sample Day: Moorland – DowntownJune 14, 2002

11/9/2007 Week 8
Orf 467 – Transportation Systems Analysis Fall 2007/8
THETA 0.3000 Time Step 0:03:00
PHE 0.8000
CAI 0.5000
C 0.85
Progression Through Sample Day: Moorland – DowntownJune 14, 2002

11/9/2007 Week 8
Orf 467 – Transportation Systems Analysis Fall 2007/8
THETA 0.3000 Time Step 0:03:00
PHE 0.8000
CAI 0.5000
C 0.85
Progression Through Sample Day: Moorland – DowntownJune 14, 2002

11/9/2007 Week 8
Orf 467 – Transportation Systems Analysis Fall 2007/8
THETA 0.3000 Time Step 0:03:00
PHE 0.8000
CAI 0.5000
C 0.85
Progression Through Sample Day: Moorland – DowntownJune 14, 2002


![Z Blh]b ] h^Z€¦ · 5-8 3-6 6-7 4-5 5-8 3-6](https://static.fdocuments.in/doc/165x107/5ec3fa142607d20808061ae8/z-blhb-hz-5-8-3-6-6-7-4-5-5-8-3-6-.jpg)