Oregon Wasted Food Study: Institutional and Commercial ... · interview questions were asked of...
18
Oregon Wasted Food Study: Institutional and Commercial Sector Case Studies Case 5 Tracking, adjusting PARs, and firing-as-needed to reduce wasted food in a hospital cafeteria
Transcript of Oregon Wasted Food Study: Institutional and Commercial ... · interview questions were asked of...

Oregon Wasted Food Study: Institutional and Commercial Sector Case Studies
Case 5 Tracking, adjusting PARs, and firing-as-needed to reduce
wasted food in a hospital cafeteria
2
This report was prepared for Oregon Department of Environmental Quality, Ashley Zanolli, Project Lead
Submitted November 20, 2018
By Reed Brodersen, MURP Christa McDermott, PhD Jennifer Stefanick Graduate Research Assistant Director Research Assistant
Community Environmental Services Portland State University P.O. Box 751 Portland, OR 97207-0751 1600 SW 4th Avenue, Suite 128 Portland, OR 97201 503-725-5949 [email protected]
3
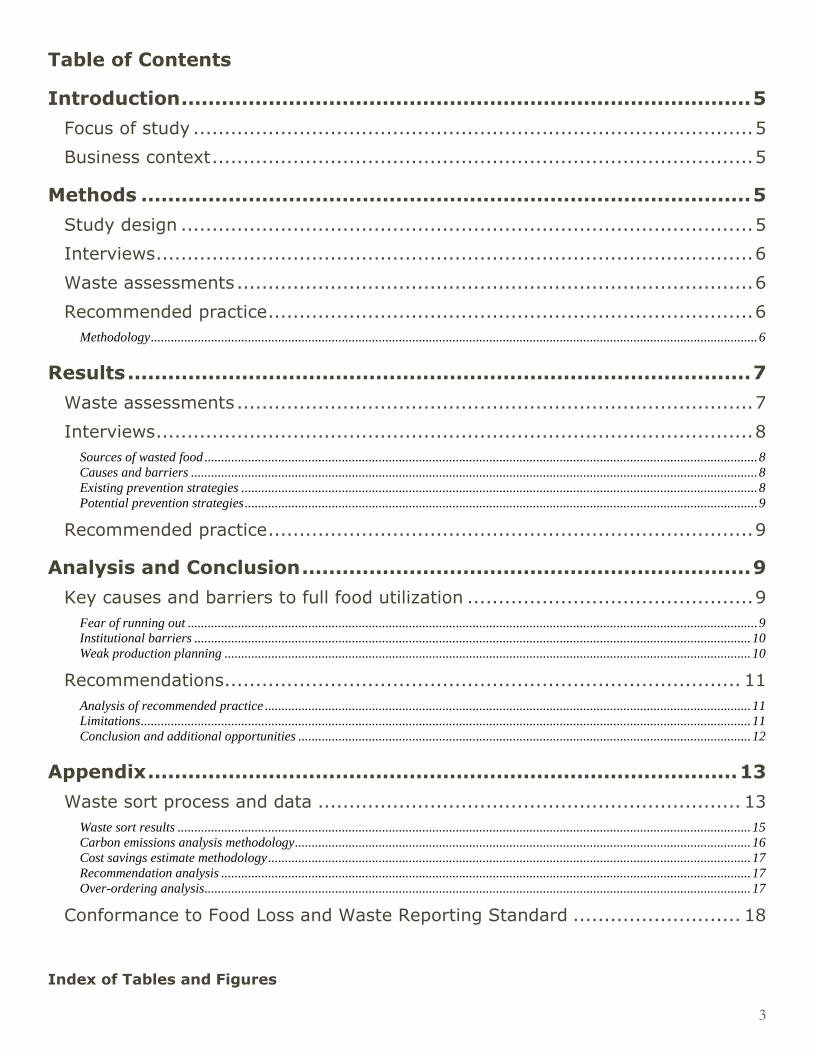
Table of Contents
Introduction ..................................................................................... 5
Focus of study .......................................................................................... 5
Business context ....................................................................................... 5
Methods ........................................................................................... 5
Study design ............................................................................................ 5
Interviews ................................................................................................ 6
Waste assessments ................................................................................... 6
Recommended practice .............................................................................. 6
Methodology ..................................................................................................................................................................................... 6
Results ............................................................................................. 7
Waste assessments ................................................................................... 7
Interviews ................................................................................................ 8
Sources of wasted food ..................................................................................................................................................................... 8 Causes and barriers ......................................................................................................................................................................... 8 Existing prevention strategies .......................................................................................................................................................... 8 Potential prevention strategies ......................................................................................................................................................... 9
Recommended practice .............................................................................. 9
Analysis and Conclusion ................................................................... 9
Key causes and barriers to full food utilization .............................................. 9
Fear of running out .......................................................................................................................................................................... 9 Institutional barriers ...................................................................................................................................................................... 10 Weak production planning ............................................................................................................................................................. 10
Recommendations................................................................................... 11
Analysis of recommended practice ................................................................................................................................................. 11 Limitations ...................................................................................................................................................................................... 11 Conclusion and additional opportunities ....................................................................................................................................... 12
Appendix ........................................................................................ 13
Waste sort process and data .................................................................... 13
Waste sort results ........................................................................................................................................................................... 15 Carbon emissions analysis methodology ........................................................................................................................................ 16 Cost savings estimate methodology ................................................................................................................................................ 17 Recommendation analysis .............................................................................................................................................................. 17 Over-ordering analysis ................................................................................................................................................................... 17
Conformance to Food Loss and Waste Reporting Standard ........................... 18
Index of Tables and Figures

4
Figure 1: Components of kitchen food scrap waste found in the waste assessment. . 7
Table 1: Food cost and life cycle greenhouse gas estimates from over-ordered ham. 10
Table 2: Food cost estimates for over-ordered coffee creamer .................................. 10
Table 3: Food cost savings from entree waste reduction ........................................... 11
Table A1: Waste sort categories and definitions........................................................ 14
Table A2: Food scrap weights, front- and back-of-house ........................................... 15
Figure A1: Blueberries found in the business’ back-of-house food waste .................. 15
Table A3: Entree and source reduction assumptions used for the WARM carbon impact analysis ......................................................................................... 16
Table A4: Estimated annual emissions reductions and energy use reductions (compared to composting) associated with the waste prevention observed in the recommended practices of PARs reduction and firing pans as needed
................................................................................................................. 16
Table A5: Costs per pound of retail and wholesale food groups, drawn from ReFED’s
Technical Appendix to the Roadmap to Reduce US Food Waste by 20%. .. 17
Figure A2: Scope of Case Study 5 as relates to the Food Loss and Waste Reporting Standard ................................................................................................... 18

5
Introduction
This is a report on the methods and results of one of 15 food service business case studies, as part of the institutional and commercial (IC) sector portion of the Oregon Wasted Food Study. This study is funded by the Oregon Department of Environmental Quality and conducted by Community Environmental Services (CES) at Portland State University. The research objectives for the IC portion of this study are to:
Understand components of wasted food in IC sector
Highlight causes of commercial wasted food and key opportunities for waste prevention
Test wasted food reduction best practices and quantify their effectiveness
Promote wasted food reduction best practices for application at commercial food service institutions
Focus of study This study explores the major types and causes of wasted food in a cafeteria, a-la-carte setting and evaluates how tracking of wasted food can be used to more accurately plan production and reducing periodic automatic replenishment (PARs).1 The recommended change of practice was to implement a system of wasted food tracking, using it for more accurate production planning, PAR setting, and shifting from cooking (or ‘firing’) all pans at the start of the night to fire-as-needed. These practices resulted in a 45.5% reduction in entree waste.
Business context This case study is of a hospital cafeteria in the Portland, Oregon metropolitan area. It serves between 500 and 550 meals per day, including breakfast, lunch and dinner to hospital patients, staff and visitors. The particular aspect of the business explored here is the staff and visitor cafeteria. Menu items are served a-la-carte and portioned by cafeteria staff from a buffet-style serving counter.
Methods
Study design The study was conducted over a six-month period from October 2017 through March 2018. It included employee interviews, a waste assessment, a wasted food tracking practice and a cost/benefit and environmental impact analysis. The intent of these analyses was to (1) identify types of wasted food and key causes of waste, (2) develop and implement a best practice for wasted food reduction, and (3) analyze the effectiveness of the practice.
1 PARs, or periodic automatic replenishment, are set production amounts that are generally set by management and followed by preparation staff. Some businesses have standard PARs across days or menu items, while others adjust their PARs according to anticipated customer demand.
6
Interviews A total of six employees were interviewed for this study: the executive chef, a regional purchasing manager, a kitchen manager, a line cook, the dinner cook and a dining host/delivery receiver. Initial interviews were all conducted on the same day in October 2017. The kitchen manager was also interviewed after the practice was implemented in April 2018. Employees voluntarily participated in one-on-one interviews on-site but in a private location. Interviews were recorded and took between 15 and 25 minutes each. The interviews were semi-structured; standard interview questions were asked of each employee with additional questions asked that either responded to employee answers or pertained to their specific role.
Waste assessments Wasted food representing a 24-hour period of normal business was sorted in October 2017, including 100% of back-of-house and front-of-house food waste. A representative sample of front-of-house waste was also pulled out of the landfill bound bin; this was prorated to calculate an estimated daily total. The hospital currently composts back-of-house food waste.
Recommended practice The recommendation was to implement a system of wasted food tracking to support more accurate production planning and the prevention of overproduction. It had three components: waste tracking, PAR reductions, and fire-as-needed practices. Based on the results of an initial waste assessment and interviews, this case study focused on overproduction tracking, planned production reductions and small batch size cooking because of the results of the waste assessment and interviews. Researchers also recommended cooking to order at the end of meal times, but the business preferred to focus on the aforementioned practices because they were more aligned with their limited staff capacity during the dinner shift. Ordering issues, caused by a lack of options from their institutional supplier because of company-wide supplier contracts, were another prominent problem. However, kitchen management as well as regional purchasing staff indicated an unwillingness or inability to change purchasing processes, especially on the short timeline necessary for this case study.
Methodology
For each day of the study period, the closing staff member recorded the date, product names, and leftover amounts in pounds (lb) and ounces for both buffet waste and prepared, unserved food. This meant that only wasted food at dinner was recorded, along with leftover soup from the entire day. Researchers later coded these products into categories (entree, side, vegetable and soup). Three tracking periods were conducted: two baseline periods where no practices were changed, and one trial period during which practice changes were implemented (discussed below). The two baseline trial periods included eight days between December 19 and December 31, and 16 days between January 23 and February 8. The third period, when practices were tested, was for 14 days between March 14 and March 28. Waste was only recorded for the cafeteria portion of the business, and did not include preparation waste for patients’ meals. Staff indicated limited capacity to enter paper tracking sheets into a computer program, so researchers entered recorded data into a spreadsheet and sent the compiled data back to managers for use. During the baseline period, no kitchen practices were changed except the introduction of the tracking system. During the trial period, the kitchen manager and executive chef used the baseline data to make targeted PAR

7
reductions for entrees, reducing the set production amounts for these items for the dinner meal. They also reinforced a shift in kitchen practices away from firing all of the food prepared for dinner at the beginning of the meal period towards firing pans as needed, allowing some unfired pans to be kept in the refrigerator for use on subsequent days.
Results
Waste assessments An audit of the combined back-of-house and front-of-house bins for source separated food scraps revealed that fruits and vegetables were the top category of wasted food, followed by prepared foods, inedible parts of food, and meat and fish (Figure 1). Fruits and vegetables (41.13 pounds; 26.30% of total food discarded) were primarily fruit salad, grapefruit, baby carrots and green beans, from plate waste, as well as whole bananas and a sizeable amount of blueberries (see, Figure A1). Prepared foods (37.72 pounds; 24.12%) consisted of deli salads, sandwiches, pizza slices and mac n’ cheese. Inedibles (28.03 pounds; 17.92%) were vegetable and fruit scraps, peels, cores, stems and stalks. Meat and fish (22.39 pounds; 14.32%) was comprised of raw salmon, beef and bacon. Front-of-house and back-of-house wastes were not sorted separately.
Figure 1: Components of kitchen food scrap waste found in the waste assessment.
In the sort of wasted food in landfill-bound bins, 55.05 pounds or 24.04% of all the landfill-bound waste assessed, was discovered and largely comprised of fruits and vegetables such as broccoli, cauliflower and whole bananas. The other predominant category in the landfill-bound waste stream was prepared foods, mainly consisting of mac n’ cheese and breakfast burritos. Sources for this waste could be attributed to visitor meals consumed in areas where food scrap collection was unavailable.

8
Interviews
Sources of wasted food
Employees identified three main sources of wasted food: spoilage, overproduction and buffet waste. Spoilage occurred, in part, because of over-ordering or large package sizes, and also because of limited flexibility with the menu. Overproduction was caused, employees thought, by poor production planning. Buffet waste was thought to be due to full pans of product being served even towards the end of meals, leading to disposal of excess food at the end of a meal shift.
Causes and barriers
One critical cause of waste noted in interviews was the kitchen’s institutional ordering practices. The kitchen, as part of a regional hospital system, needed to use the mandated ordering system, contracted vendor, and contracted offerings. The hospital system, according to the regional purchasing manager, prioritized cost savings and pushed for bulk purchases. This system worked for large hospitals, but for this smaller kitchen, it meant inevitable over-ordering. For example, the only option for ham was a 10 pound package, of which they could only go through 3 or 4 pounds in the week before having to dispose of it. The hospital is throwing out approximately $9.72 along with about 6 pounds of ham every time a package of ham is purchased. Another regional policy that contributed to wasting was the hospital’s stringent understanding of health codes, which meant any food item must be discarded six days after opening, regardless of product or expiration date. This was a day shorter than the local health department’s rules for perishable products. Employees indicated this policy was in place to protect patient health, and since some food was shared between patient meals and cafeteria meals the standard was applied to all products. Staff identified a broader issue that caused waste: that the kitchen was viewed by regional and internal management as a food service institution rather than a culinary institution. Though subtle, this difference in identity, one employee thought, influenced how management treated food, allowing them to think waste was inevitable and acceptable. It also influenced their policies on menu and recipe inflexibility that limited the chef’s ability to repurpose food. This inability to repurpose was also understood as a problem of a lack of equipment (like a large stock pot for making soup stock) and space (both refrigerator space and preparation space). The kitchen manager and executive chef also shared one particularly salient cause of wasted food: a fear of running out in the middle of meal time. This fear was founded in one particular experience. Occasionally, a large family from the neighborhood would come to dinner at the cafeteria because the meals were inexpensive and clear out the dinner buffet almost entirely. This event, then, encouraged the kitchen manager to plan extra in case the family arrived, causing waste most of the time. Finally, employees identified over-portioning as a cause of waste. Some cited a lack of reinforced expectations while others acknowledged over-portioning was intentional to account for the stressful hospital environment. They wanted to treat hospital staff and visitors well because they empathized with their situation.
Existing prevention strategies
Employees highlighted a few strategies that were working to prevent wasted food. They said that products were allowed to run out towards the end of meal times. This was supplemented by the ability for the kitchen

9
to cook to order, if necessary, though it appeared that the practice was not utilized often. Furthermore, employees were encouraged to eat for free from leftover buffet trays after lunch, though it was unclear if this may have lessened their motivation to avoid over-production.
Potential prevention strategies
Employees identified a few potential wasted food prevention strategies. First, the executive chef suggested the use of a commissary kitchen system to deliver pre-portioned products to smaller hospitals. For example, the commissary kitchen could re-package a 10 pound ham into 3 pound ham portions. This could save the hospital cafeteria $1,179.36 annually and 0.9494 metric tons of carbon dioxide equivalent (MTCO2E), the equivalent of not driving 2,304 miles in a passenger car. The commissary kitchen, the chef said, could also take back items for repurposing, like product for soup stock. The dinner cook advocated for a few practice changes that would help them avoid wasting food. First, they said, lunch staff should stop firing all of the prepared dinner food at the end of their shift. While these staff did this to assist the dinner cook, it meant all of the food either had to be eaten or tossed. In addition, the dinner cook suggested food be prepared in smaller pans so they could fire and serve smaller batches towards the end of meal time.
Recommended practice The overproduction waste tracking practice was successfully deployed for roughly six weeks, four representing a baseline measurement and two accompanied with changes to preparation practices and reductions in PARs, i.e. production planning. The recommendation focused on entree production, though all production waste was recorded. A total of 51 entree waste measurements were recorded, 33 from the baseline period and 18 from the trial period. Results suggest a statistically significant reduction in entree waste (t = 2.57; p = 0.013) of 31.24 ounces per day (or 1.95 pounds). This amounts to a 45.5% reduction in entree waste. Interviews with the kitchen manager confirmed this result. He said they were seeing significant reductions in leftovers. He said they may have overcorrected, however, with a few instances where they ran out of an item towards the end of a meal. In response, he adjusted PARs up slightly. This process of dynamic PAR setting was not readily utilized before the recommendation was deployed.
Analysis and Conclusion
Key causes and barriers to full food utilization Fear of running out
As previously discussed, the kitchen operated out of a fear of running out, in part due to very specific and infrequent circumstances. This likely led to daily wasted food, which was confirmed by both the waste sort (where prepared food accounted for 24% of compost waste) and the overproduction tracking (which found over 6 pounds of overproduction per day, for entree waste alone).

10
Institutional barriers
The kitchen’s context as being part of a larger institutional system influences its practices and creates some barriers to wasted food prevention. First, the kitchens purchasing options are limited because of the hospital systems’ purchasing contracts. This means the kitchen over-buys product, which inevitably goes to waste. The kitchen also must comply with strict internal food safety standards (more strict than health department standards) that promote wasting. Two analyses were run to quantify the impact of over-ordering (due to institutional barriers) on food costs. Two items are highlighted here because they were documented in employee interviews. While this data is anecdotal, it suggests there are likely significant costs associated with over-ordering, even if these particular examples may be overestimated. The full methodology and results are included in the Appendix. The first item discussed is ham. The employee who assists with refrigerator clean outs at the end of the week said that they have to order ham in 10 pound packages, only to use 3-4 pounds per week. Analysis suggests that up to $1,179.36 in food costs could be avoided by purchasing only the amount of ham necessary. Even if less waste is produced each week, the results suggests over-ordering has an impact on the businesses food costs (Table 1).
Table 1: Food cost and life cycle greenhouse gas estimates from over-ordered ham.
Pounds per
week Cost per week
Pounds per
year Cost per year
Associated lifecycle GHG
emissions (MTCO2E)
1 $3.24 52 $168.48 0.1344
3 $9.72 156 $505.44 0.4033
5 $16.20 260 $842.40 0.6722
7 $22.68 364 $1,179.36 0.9411
The second item discussed is single serve coffee creamer, which the kitchen has to purchase a case at a time. An employee estimated that they throw away a case worth of these creamers every two weeks because of their use-by dates. They said this occurs with both dairy and non-dairy creamer. Table 2 shows the cost impact of this wasted food, estimated to be $285.48 per year.
Table 2: Food cost estimates for over-ordered coffee creamer
Cost per case Cases per year Cost per year
Dairy 12.87 12 $154.44
Non-dairy 10.92 12 $131.04
Total $285.48
Weak production planning
The waste sort, recommendation data and interviews suggest overproduction is a significant cause of wasted food. This appears to occur both because of variable consumer demand and inflexible PARs. While some of this product is repurposed, the waste sort and interviews suggest much of it still goes to waste. Another

11
problem is that PARs are set bluntly (e.g. one or two pans of chicken breasts) rather than precisely (e.g. 36 portions of chicken breasts).
Recommendations
Analysis of recommended practice
This study finds that overproduction waste tracking, PAR reductions and small-batch firing can significantly reduce overproduction waste. It supports the conclusion that waste data can be a valuable tool for chefs to better match PARs to customer demand, generally and for specific menu items. The study also demonstrates that preparation practices, like smaller batch sizes and fire-as-needed practices, may also be important in reducing overproduction waste. The carbon emissions impact of entree source prevention was calculated, using methods described in the Appendix. Preventing the waste of 1.95 pounds of entree waste per day represents avoiding 4.05 metric tons of carbon dioxide equivalent (MTCO2e) emissions over a year, compared to composting that amount of entree waste. This is almost the equivalent of tailpipe emissions a one passenger vehicle driven for one year.2 The source reduction observed also represents an avoided 12.68 million BTUs of energy use per year, equivalent to conserving two barrels of oil or 102 gallons of gasoline per year.3 Cost savings associated with entree waste reduction were calculated using the methodology outlined in the Appendix. The results suggest the business will save $1,975 per year in food costs alone (Table 3). While this may appear relatively small, this only represents cost savings for the dinner meal (the smallest service of the day), only considers entree waste, and does not consider how entree waste reduction supports lower demands on employee time, especially relevant since dinner is staffed by one employee. If these practices are deployed across all meals, cost savings would likely be higher than these estimates and labor savings could increase cost savings to the business.
Table 3: Food cost savings from entree waste reduction
Weight (lb) Costs
Grain 142.53 $138.26
Meat 534.50 $1,731.77
Fruit/Veg 142.53 $105.47
Limitations
Data was collected for six weeks, two weeks of which was for the practice trial period. As such, we cannot speak to the long-term effectiveness of this practice. That said, we hypothesize that the iterative PAR setting practice, as well as the small-batch firing, has long term viability. Another study limitation is that researchers relied on business staff to collect data, and had no way to authenticate records. Finally, the study observed
2 U.S. Environmental Protection Agency. (September 2017). Greenhouse Gas Equivalencies Calculator. Retrieved from
https://www.epa.gov/energy/greenhouse-gas-equivalencies-calculator 3 U.S. Environmental Protection Agency. (February 2016). Documentation for Greenhouse Gas Emission and Energy Factors Used in the
Waste Reduction Model (WARM) Organic Materials Chapters. Retrieved from https://www.epa.gov/sites/production/files/2016-03/documents/warm_v14_organic_materials.pdf

12
the impacts of both PAR reduction and small-batch firing, and is unable to separate the impacts of each practice individually.
Conclusion and additional opportunities
This study tested the effectiveness of smaller batch preparation alongside informed PAR reductions at preventing wasted food and promoting source reduction. This study found a 45.5% reduction in entree waste using these practices, and confirms that they can be an important part of a comprehensive food utilization plan. Additional strategies may be effective at reducing this business’ wasted food. First, to address the concern of running out, researchers recommend shifting towards a cook-to-order strategy at the end of meal times, perhaps offering a limited menu to support a more labor-intensive process. Along the same lines, reserve food options could be maintained that could be quickly cooked to order, to limit the need for entree overproduction. Second, the hospital purchasing coordinators should work with smaller hospital kitchens, like this one, to expand purchasing flexibility and find product sizes that work for them. This could mean adding products to the contract or allowing for kitchens to order outside of the contract if their needs are not met. Along the same lines, a large hospital system could also explore developing a commissary kitchen system whereby products are packaged or prepared at a central location and delivered to individual hospital kitchens. This system would allow for a more tailored purchasing process and open up expanded opportunities for re-utilization, such as making soup stock, that are not currently possible for smaller kitchens. Finally, the business could benefit from a more in-depth and routine analysis of sales data in order to better forecast hourly, daily and weekly customer trends. This data could better inform the dynamic PAR setting process used by chefs.

13
Appendix
Waste sort process and data
Wasted food for the study was collected in the business’ food scrap roll carts and tagged by a manager to facilitate the waste assessment in representing a 24-hour period. In October 2017, researchers sorted one roll cart of waste, which included both back-of-house and front-of-house waste making it difficult to separate the two sources. Front-of-house food scraps were those collected from a single compost bin located in the cafeteria. One hundred percent of the business’ food scrap collections and an estimated 20 percent of landfill-bound waste (estimate based on visual observations) was sorted and weighed. Recycling streams were not sorted, except for recyclables discovered in either the food waste or landfill waste streams. Two researchers using two folding tables adjacent to one another lengthwise with two large low-rimmed black bins on either table conducted the sort on-site. Entire bags were dumped into black bins to facilitate sorting the contents, though on a couple of occasions, single category items were the only contents of each bag and therefore weighed and recorded immediately. Numerous yellow bins were placed around the perimeter of the sorting area and labeled with each specific food category for collecting all foods items separately. Once all foods were sorted and categorized, photos are taken of the food items in each yellow bin. All of the yellow bins were then weighed with amounts recorded. In addition, tare weights of yellow bins were recorded to capture accurate amounts of wasted foods. Landfill and recycling streams were also separated into yellow bins during sorting process, weighed and photographed. No post-intervention sort was conducted for this case study.

14
Table A1: Waste sort categories and definitions
Categories Definitions Examples
1 Inedible
Items not intended for human
consumption (small amounts of edible
material associated with the inedible
material are permitted to be included)
Egg shells, banana peels,
pits/seeds, bones
2 Meat & Fish
Uncooked or cooked meat (with mostly
edible components) unmixed with other
types of food
Chicken drumstick, salmon fillet
3 Dairy Solid dairy products unmixed with other
food types or in original form Cheese, yogurt
4 Eggs Egg products unmixed with other food
types or in original form
Fried egg, whole eggs, liquid egg
whites
5 Fruits &
Vegetables
Solid uncooked or cooked vegetables
and fruits (with mostly edible
components) unmixed with other types
of food
Potatoes, spinach, berries, salad
with only vegetables
6 Baked Goods
Baked goods and bread-like products
unmixed with other food types or in
original form, including pastries
Bread, tortillas, pastries
7 Dry Foods
Cooked or uncooked grains, pastas,
legumes, nuts, or cereals unmixed with
other food types or in original form
Rice, cereal, pasta
8
Snacks,
Condiments,
Sauces
Includes confections, processed snacks,
condiments, and other miscellaneous
items
Condiments, candy, granola bars,
sauces, jellies
9 Liquids, Oils,
Grease
Items that are liquid, including
beverages Sodas, milk, oil, juice
10 Cooked or
Prepared Food
Items that have many food types mixed
together as part of cooking or
preparation
Lasagna, sandwiches, burritos
11 Unidentifiable Used only if necessary
Edited and used with permission of NRDC (Hoover, 2017)

15
Waste sort results
Table A2: Food scrap weights, front- and back-of-house
Categories Weight (lb)
Inedible 28.03
Meat & Fish 22.39
Dairy 4.88
Vegetables & Fruits 41.13
Baked Goods 6.67
Dry Foods (Grains, Pasta, Cereals) 15.08
Snacks, Condiments, & Other <.01
Liquids, Oils, Grease 0.5
Cooked, Prepared, Leftovers 37.72
Unidentifiable <.01
Edible wasted food (lb) 128.37
Edible wasted food (% of total food) 82.08%
Total food scrap waste (lb) 156.4
Figure A1: Blueberries found in the business’ back-of-house food waste
(The bag is approximately 12 inches by 18 inches and 3 inches deep)

16
Carbon emissions analysis methodology
Carbon emissions and energy use reductions were calculated using version 14 of the EPA’s Waste Reduction Model (WARM).4 Reductions in entree overproduction were considered source reduction and calculated using researcher estimates of entree composition based on the overproduction data provided by the business. The composition and reduction estimates can be seen in Table A2. Entree composition was estimated based on the entree types included in the overproduction data. Of the entrees, 27 were chicken, pork or fish entrees and 23 were beef entrees. Entrees were considered in either two groups: beef or chicken, with percentages calculated using the aforementioned entree types. The WARM tool does not have estimates for pork or fish so these were considered with chicken (as general consensus is that fish and pork have emissions profiles more similar to chicken than to beef). Of the entrees, 25 were entirely meat (e.g. chicken breasts and carne asada) and 25 were mixed meat and vegetables/grains (e.g. beef and broccoli or Shepard’s pie). Meat only dishes were considered 100% meat, while mixed dishes were considered 50% meat. An average composition of 75% meat was used, accordingly.
Table A3: Entree and source reduction assumptions used for the WARM carbon impact analysis
Percent of Entree Reduction per meal
(lb) Reduction per year
(lb) Reduction per year
(ton)
Beef 34.50% 0.67 245.87 0.12
Chicken 40.50% 0.79 288.63 0.14
Vegetables 20.00% 0.39 142.53 0.07
Grains 20.00% 0.39 142.53 0.07
Table A4: Estimated annual emissions reductions and energy use reductions (compared to composting) associated with the waste prevention observed in the
recommended practices of PARs reduction and firing pans as needed
Tons source reduced/year
Change in MTCO2E* (from composting)
Change in Million BTU** (from composting)
Beef 0.12 -3.67 -7.92
Poultry 0.14 -0.33 -3.91
Grains 0.07 -0.03 -0.44
Fruits and Vegetables
0.07 -0.02 -0.4
Total 0.41 -4.05 -12.68
*MTCO2E = Metric tons of carbon dioxide equivalent **BTU = British thermal units
4 U.S. Environmental Protection Agency. (2016, March). Waste Reduction Model (WARM) version 14. Retrieved from https://www.epa.gov/warm
17
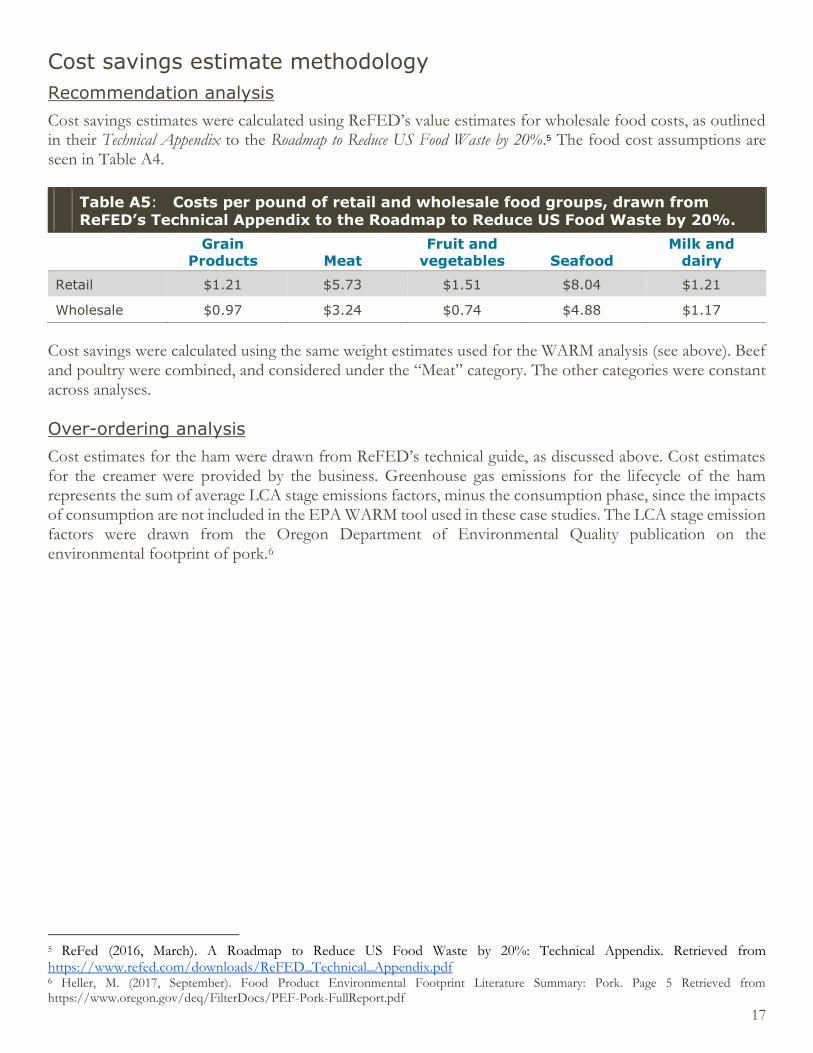
Cost savings estimate methodology
Recommendation analysis
Cost savings estimates were calculated using ReFED’s value estimates for wholesale food costs, as outlined in their Technical Appendix to the Roadmap to Reduce US Food Waste by 20%.5 The food cost assumptions are seen in Table A4.
Table A5: Costs per pound of retail and wholesale food groups, drawn from ReFED’s Technical Appendix to the Roadmap to Reduce US Food Waste by 20%.
Grain
Products Meat Fruit and
vegetables Seafood Milk and
dairy
Retail $1.21 $5.73 $1.51 $8.04 $1.21
Wholesale $0.97 $3.24 $0.74 $4.88 $1.17
Cost savings were calculated using the same weight estimates used for the WARM analysis (see above). Beef and poultry were combined, and considered under the “Meat” category. The other categories were constant across analyses.
Over-ordering analysis
Cost estimates for the ham were drawn from ReFED’s technical guide, as discussed above. Cost estimates for the creamer were provided by the business. Greenhouse gas emissions for the lifecycle of the ham represents the sum of average LCA stage emissions factors, minus the consumption phase, since the impacts of consumption are not included in the EPA WARM tool used in these case studies. The LCA stage emission factors were drawn from the Oregon Department of Environmental Quality publication on the environmental footprint of pork.6
5 ReFed (2016, March). A Roadmap to Reduce US Food Waste by 20%: Technical Appendix. Retrieved from https://www.refed.com/downloads/ReFED_Technical_Appendix.pdf 6 Heller, M. (2017, September). Food Product Environmental Footprint Literature Summary: Pork. Page 5 Retrieved from https://www.oregon.gov/deq/FilterDocs/PEF-Pork-FullReport.pdf

18
Conformance to Food Loss and Waste Reporting
Standard The Food Loss & Waste Protocol7 is a multi-stakeholder partnership, which has developed the global Food Loss and Waste Accounting and Reporting Standard – also known simply as the FLW Standard. Launched in 2013, the Food Loss & Waste Protocol’s mission is to ensure wide adoption of the FLW Standard so companies, governments, cities and others are better informed about food loss and waste and motivated to curb this inefficiency.” The graphic below describes the scope of Case Study 5 of the institutional and commercial sector assessment of the Oregon Wasted Food Study using the FLW Standard.
Figure A2: Scope of Case Study 5 as relates to the Food Loss and Waste Reporting Standard
7 See, http://flwprotocol.org
24 hour period of normal
business day
Food
Inedible parts
Animal Feed
Biomaterial/
processing
Co/anaerobic
digestion
Compost/aerobic
Controlled combustion
Land application
Landfill
Not harvested
Refuse/discards
Sewer
Food loss and waste was
analyzed for all
lifecycle stages from purchase
by the cafeteria until disposal by cafeteria staff or
consumer.
Back-of-house FLW for all operations
assessed + front-of-house
FLW for the cafeteria portion of the business
(excluding patient FLW)
Food loss + waste protocol
Food category = All
Lifecycle stage = Food preparation
for retail sale;
cafeteria serving; post-consumer
cafeteria waste
Geography =
Business located in Portland, OR
area
Organization = Hospital food
service
organization