Oregon Income Trends
24
OFFICE OF ECONOMIC ANALYSIS Oregon Income Trends October 2015 Oregon Office of Economic Analysis Josh Lehner
-
Upload
oregon-office-of-economic-analysis -
Category
Economy & Finance
-
view
4.245 -
download
0
Transcript of Oregon Income Trends

OFFICE OF ECONOMIC ANALYSIS
Oregon Income Trends
October 2015 Oregon Office of Economic Analysis
Josh Lehner
2Oregon Office of Economic Analysis
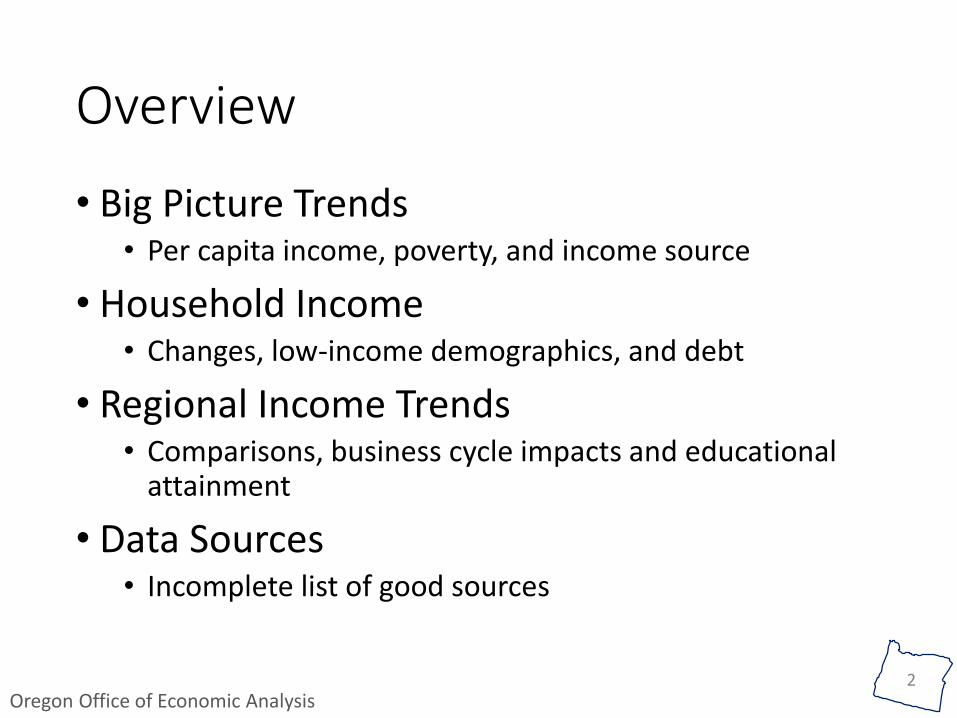
Overview
• Big Picture Trends• Per capita income, poverty, and income source
• Household Income• Changes, low-income demographics, and debt
• Regional Income Trends• Comparisons, business cycle impacts and educational
attainment
• Data Sources• Incomplete list of good sources

OFFICE OF ECONOMIC ANALYSIS
Big Picture Trends
4Oregon Office of Economic Analysis
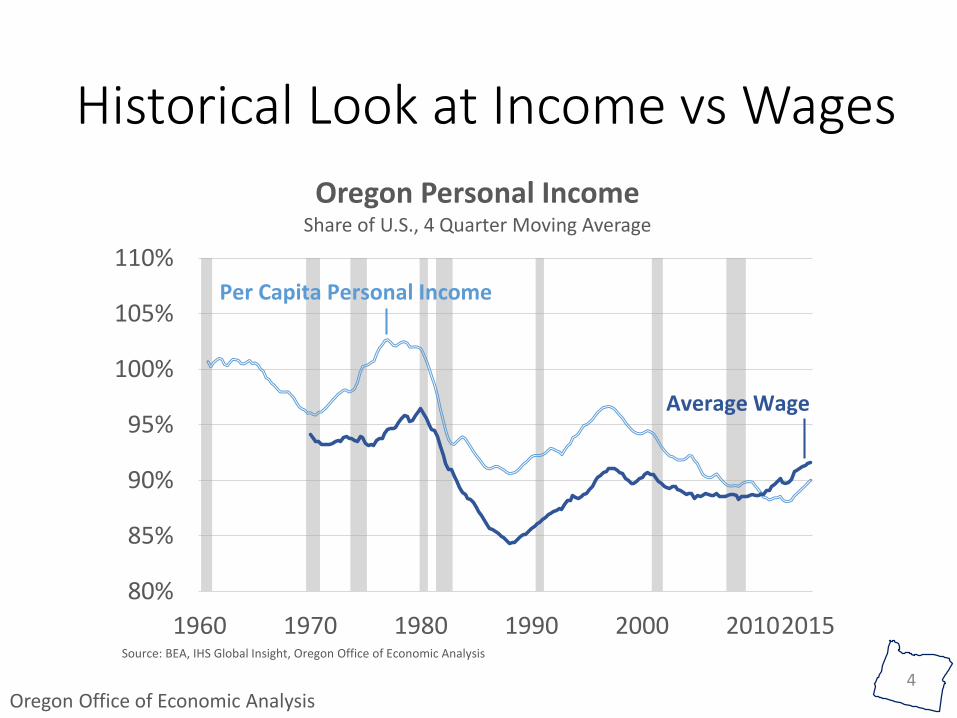
Historical Look at Income vs Wages
80%
85%
90%
95%
100%
105%
110%
1960 1970 1980 1990 2000 20102015
Oregon Personal IncomeShare of U.S., 4 Quarter Moving Average
Source: BEA, IHS Global Insight, Oregon Office of Economic Analysis
Per Capita Personal Income
Average Wage
5Oregon Office of Economic Analysis
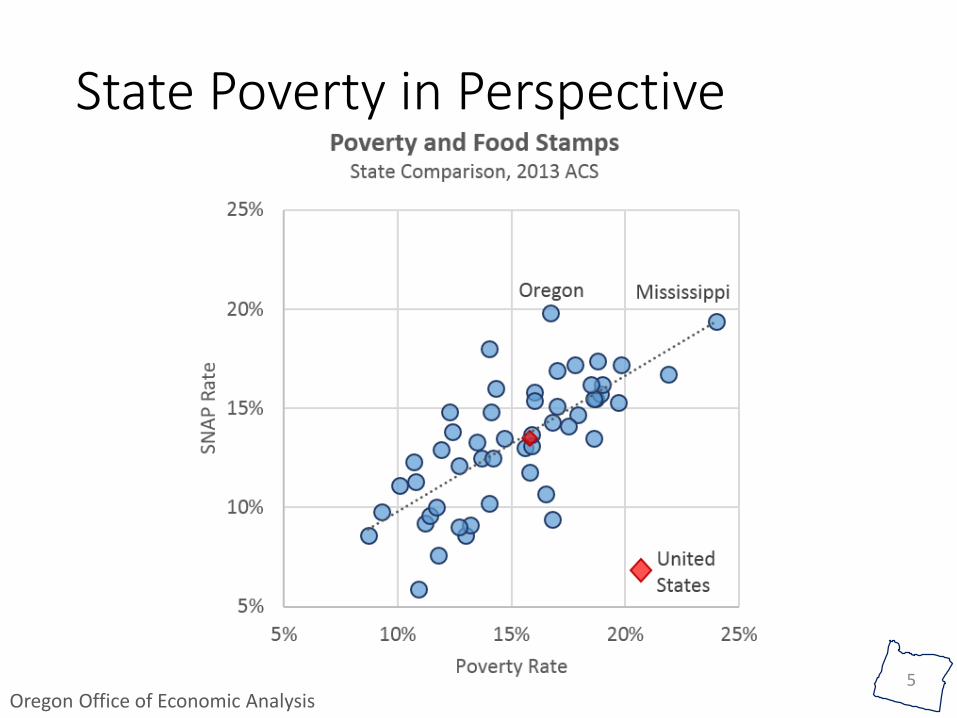
State Poverty in Perspective
6Oregon Office of Economic Analysis
0
5,000
10,000
15,000
20,000
25,000
30,000
35,000
40,000
45,000
50,000
15-19 20-24 25-29 30-34 35-39 40-44 45-49 50-54 55-59 60-64 65-69 70-74 75-79 80+
Av
erag
e in
com
e
Age
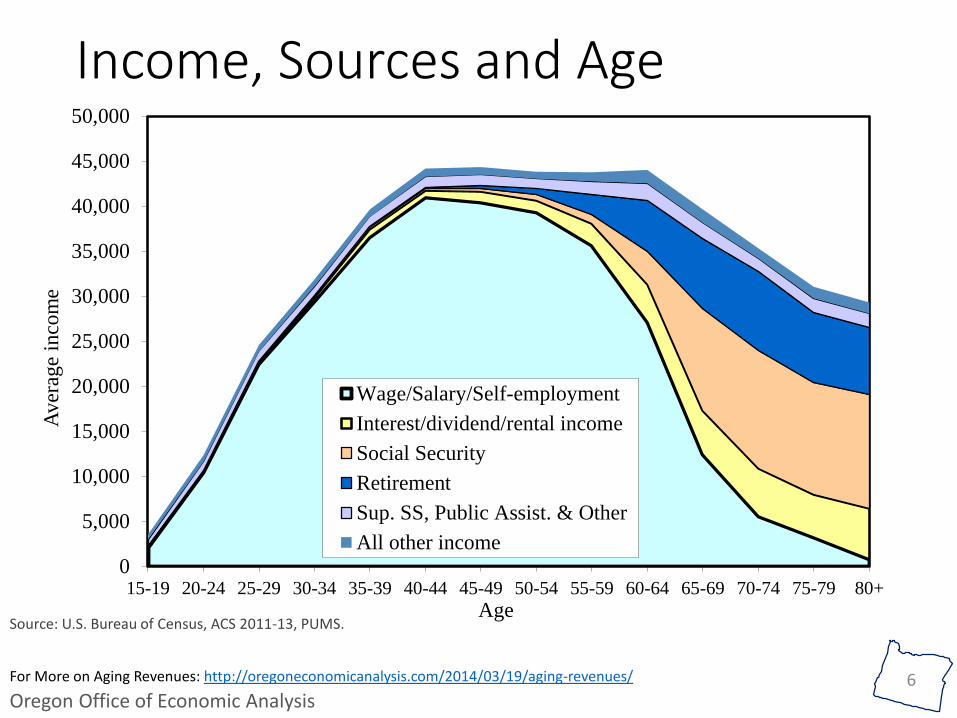
Wage/Salary/Self-employment
Interest/dividend/rental income
Social Security
Retirement
Sup. SS, Public Assist. & Other
All other income
Income, Sources and Age
Source: U.S. Bureau of Census, ACS 2011-13, PUMS.
For More on Aging Revenues: http://oregoneconomicanalysis.com/2014/03/19/aging-revenues/

OFFICE OF ECONOMIC ANALYSIS
Household Income

8Oregon Office of Economic Analysis
0%
2%
4%
6%
8%
10%
12%
14%
16%
18%
20%
Oregon Household Income Distribution2014 American Community Survey
Rural
Urban

9Oregon Office of Economic Analysis
-15%
-10%
-5%
0%
5%
10%
U.S
.
Po
rtla
nd
MSA
Ore
gon
Po
rtla
nd
Lake
Osw
ego
Hill
sbo
ro
Tual
atin
Ore
gon
Cit
y
Milw
auki
e
Bea
vert
on
Van
cou
ver
Tiga
rd
Gre
sham
Region City
Median Family Income, 2008-2013
Inflation (Core PCE)

10Oregon Office of Economic Analysis
-10%
-8%
-6%
-4%
-2%
0%
2%
4%
6%
8%
10%
U.S
.
Ore
gon
Sale
m M
SA
Spri
ngf
ield
Co
rval
lis
Sale
m
Euge
ne
Kei
zer
Alb
any
Wo
od
bu
rn
Region City
Median Family Income, 2008-2013
Inflation (Core PCE)

11Oregon Office of Economic Analysis
-15 -10 -5 0 5 10 15 20 25 30
< $25k
$25-50k
$50-75k
$75-100k
$100-150k
> $150k
Thousands
Portland MSA Households by IncomeChange from 2007 to 2014
Housing Affordability*
Rent
$450
$625+
$1,250+
$1,875+
$2,500+
$3,750+
Home Price
$80k
$120k+
$240k+
$360k+
$480k+
$730k+
*Monthly housing costs equal to 30% of income. Home price assumes 20% down payment, 4% 30 year fixed mortgage, average property taxes and homeowners insurance. | Source: Census, Oregon Office of Economic Analysis
More High Income Households Today
12
5,000
10,000
15,000
20,000
25,000
30,000
35,000
0 5 10 15 20 25 30 35 40 45 50 55 60 65 70
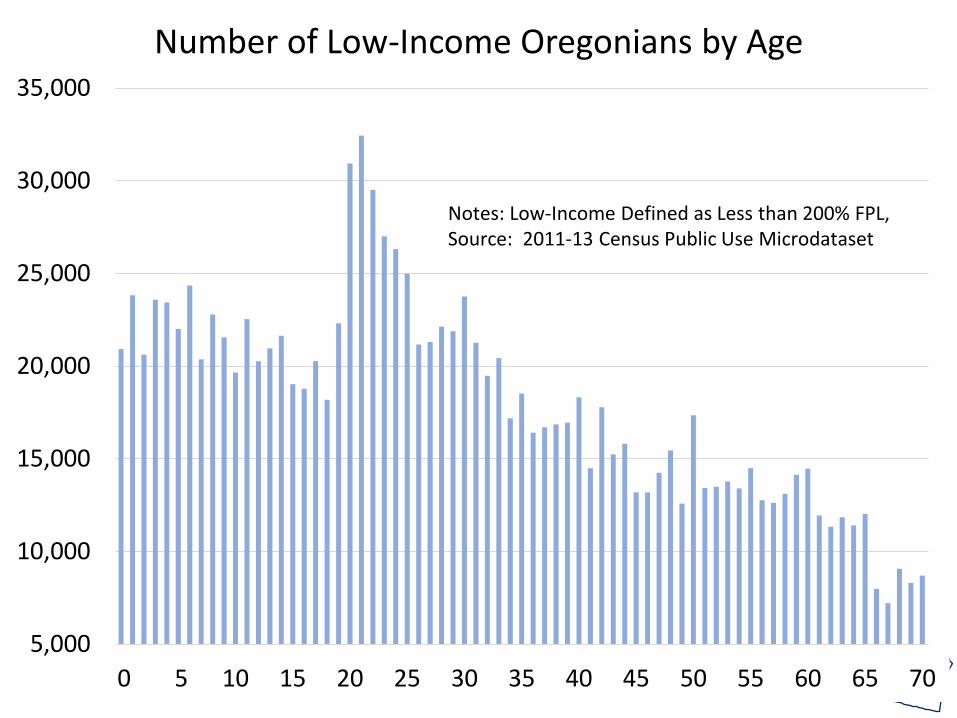
Number of Low-Income Oregonians by Age
Notes: Low-Income Defined as Less than 200% FPL,Source: 2011-13 Census Public Use Microdataset

13
Single Adult, 1 Child, 22,686 Single Adult, 2
Children, 31,816
Single Adult, 3 Children, 21,410
Single Adult, 4 Children, 7,897
Single Adult, 5+ Children, 2,784
Multiple Adults, 1 Child, 51,620
Multiple Adults, 2 Children,
100,707
Multiple Adults, 3 Children,
83,951
Multiple Adults, 4 Children,
37,576
Multiple Adults, 5+ Children,
32,966
All Children Below 200% of Federal Poverty Level

14Oregon Office of Economic Analysis
Household Debt Stabilizing

OFFICE OF ECONOMIC ANALYSIS
Regional Income Trends

16Oregon Office of Economic Analysis
Real Income Trends
$20
$25
$30
$35
$40
$45
$50
1970 1980 1990 2000 2010
Tho
usa
nd
s
Oregon Real Per Capita Personal Income
Portland MSA
Other Urban
Rural
Latest Data: 2013 | Source: BEA, BLS, Oregon Office of Economic Analysis
17Oregon Office of Economic Analysis
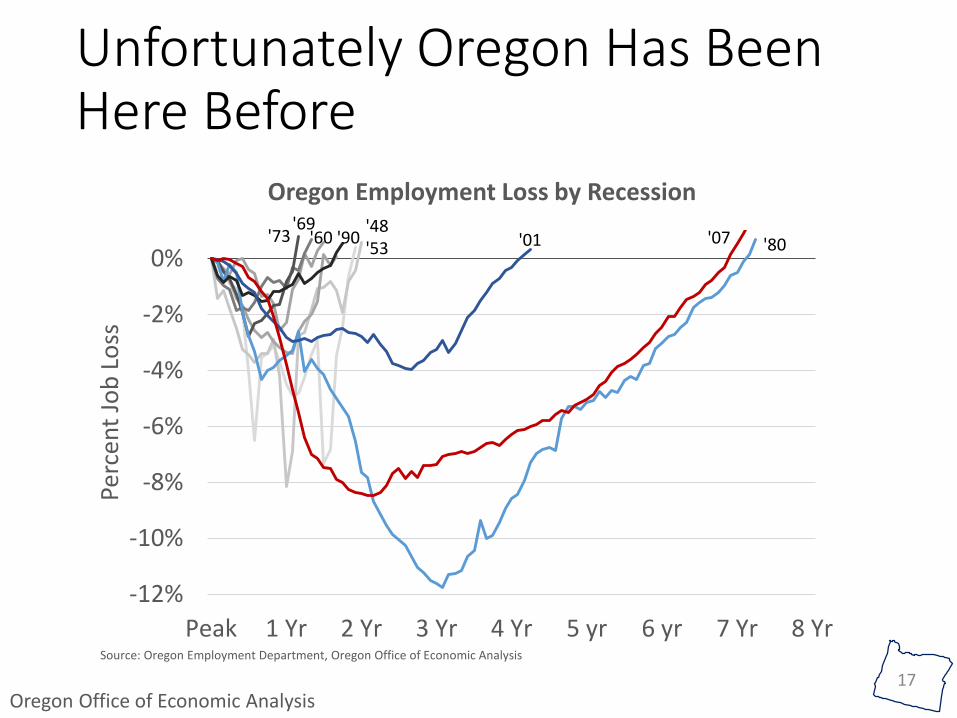
Unfortunately Oregon Has Been Here Before
-12%
-10%
-8%
-6%
-4%
-2%
0%
Peak 1 Yr 2 Yr 3 Yr 4 Yr 5 yr 6 yr 7 Yr 8 Yr
Perc
ent
Job
Lo
ss
Oregon Employment Loss by Recession
'73 '01 '80'07'48'53
'69'60 '90
Source: Oregon Employment Department, Oregon Office of Economic Analysis

18Oregon Office of Economic Analysis
-20%
-15%
-10%
-5%
0%
Peak 5 Years 10 Years
Recessionary Income Losses in OregonReal Personal Income less Transfer Payments
South Coast ('78) Southern ('06) Central ('08)
Latest Data: 2013 | Source: BEA, BLS, Oregon Office of Economic Analysis

19Oregon Office of Economic Analysis
Shifting Income Composition
$-
$2
$4
$6
$8
$10
$12
$14
$16
1970 1980 1990 2000 2010
South Coast Per Capita Personal Income, 000s 2013$
Wages
Transfers
Other
$-
$5
$10
$15
$20
$25
$30
$35
$40
1970 1980 1990 2000 2010
South Coast Per Capita Personal Income, 000s 2013$

20Oregon Office of Economic Analysis
Labor Market Changes

21Oregon Office of Economic Analysis
Local Comparative Advantage?
- 1,000 2,000 3,000 4,000 5,000
ManagementHealthcare…
LegalEngineer/Arch
Computer /…Business,…ScientistsTeachers
ConstructionArts, Design, Ent
Protective…Install, Maint,…
Community…Sales
ProductionAdmin SupportTransportation
Heathcare…Agriculture
Bldg Cleaning…Personal Care
Food Prep
Coast Workers with High School or Less
Actual Worker Distribution Statewide Average Equiv.
- 1,000 2,000 3,000 4,000
ManagementHealthcare…
LegalEngineer/Arch
Computer /…Business,…ScientistsTeachers
ConstructionArts, Design, Ent
Protective…Install, Maint,…
Community…Sales
ProductionAdmin SupportTransportation
Heathcare…Agriculture
Bldg Cleaning…Personal Care
Food Prep
Coast Workers with Bachelor's or More
Actual Worker Distribution Statewide Average Equiv.

22Oregon Office of Economic Analysis
Local Comparative Advantage
-7%
-6%
-5%
-4%
-3%
-2%
-1%
0%
1%
2%
3%
Bend Corvallis Eugene Salem Portland S.Oregon
Medford Gorge NEOregon
N. Coast SEOregon
Transportation

23Oregon Office of Economic Analysis
Data Sources
• Census and Fact Finder
• U.S. Bureau of Economic Analysis• County/MSA income by source since 1969
• Oregon Employment Department and U.S. Bureau of Labor Statistics• Wages by industry, occupation, county• BLS: Consumer Expenditure Survey
• Federal Reserve • Board of Governors (Survey of Consumer Finance)• Bank of New York (Household Debt)

OFFICE OF ECONOMIC ANALYSIS
24
For More Information
Josh Lehner
(503) 378-4052
Social Media:
www.OregonEconomicAnalysis.com
@OR_EconAnalysis