Agenda : Update master tracers Update validation vs pathology

Oregon Statewide Assessment
Bookmark Standard Setting Technical Report
2006
for
Reading/Literature and Mathematics Grades 3, 5, 8, and CIM
and
Science
Grades 5, 8, and CIM
Submitted to Oregon Department of Education
March 2007

Developed and published under contract with the Oregon Department of Education by CTB/McGraw-Hill LLC, a subsidiary of The McGraw-Hill Companies, Inc., 20 Ryan Ranch Road, Monterey, California 93940-5703. Copyright © 2007 by the Oregon Department of Education. No part of this publication may be reproduced or distributed in any form or by any means, or stored in a database or retrieval system, without the prior written permission of the Oregon Department of Education and the publisher. This work is based on the Bookmark Standard Setting Procedure, copyright © 2004 by CTB/McGraw-Hill LLC. All rights reserved. Bookmark Standard Setting Procedure is a trademark of The McGraw-Hill Companies, Inc.
2

Table of Contents
Section Page A. Executive Summary.................................................................... 4-7 B. Oregon Standard Setting: Day-by-Day Overview ..................... 8-30 C. Master Agenda ....................................................................... 31-39 D. Training Materials ................................................................... 40-60 E. Training Overheads ................................................................ 61-75 F. Detailed Bookmark Judgments ............................................. 76-241 G. Participant Judgments
Plus/Minus 1, 2, and 3 Standard Errors .............................. 242-277 H. Graphical Representations of Participants’ Judgments ...... 278-422 I. Participant Evaluation of the Oregon Standard Setting ...... 423-446 J. The Bookmark Standard Setting Procedure:
Methodology and Recent Implementations ........................ 447-467
3

SECTION A
Executive Summary
4

Executive Summary
Staff from CTB/McGraw-Hill conducted the Oregon Standard Setting in Portland, Oregon, on December 11–13, 2006. The Bookmark Standard Setting Procedure (BSSP) was used to set standards for 16 grade and content areas: Grades 3–8 and CIM for Reading/Literature and Mathematics; Grades 5, 8, and CIM for Science; and Kindergarten and Grades 2, 5, 7, and 11 for the English Language Proficiency Assessments (ELPA). In Oregon, the high school level is referred to as the Certificate of Initial Mastery (CIM) level. This document reports the results of the standard setting for the Oregon Statewide Assessments in Mathematics, Reading/Literature, and Science. The results of the standard setting for ELPA will be reported in the Oregon English Language Proficiency Assessments Bookmark Standard Setting Technical Report 2006. The Oregon Standard Setting consisted of training, orientation, three rounds of judgments, cross-grade discussions, and descriptor writing. This document describes the implementation of the BSSP to establish cut scores at selected grades, the interpolation of cut scores for the off-grades, the cross-grade articulation discussion, and the development of achievement-level descriptors. The Oregon Standard Setting gathered participants from across Oregon to set achievement standards for the Mathematics, Reading/Literature, and Science assessments. Each grade and content area had approximately 18 participants. Within each grade and content area, the Oregon Department of Education (ODE) divided participants into three tables that were balanced in terms of relevant demographic characteristics (e.g., gender, geographic location). Participants in each grade/content area participated in three rounds of activities in which they recommended three cut scores that defined four performance levels: Does Not Yet Meet, Nearly Meets, Meets, and Exceeds. Following this, participants recommended changes to the existing achievement-level descriptors. Table leaders participated in the cross-grade articulation. Table 1 summarizes the cut scores and associated impact data recommended by participants in each grade and content area in the final round (Round 3) of discussion and voting. The impact data in Table 1 were shown to the participants at the workshop and were based on the Fall 2006 test administration. Interpolation Once all grade panels for each content area in Mathematics and Reading/Literature completed Round 3, CTB interpolated the cut scores for the off-grades (Grades 4, 6, and 7) using the quadratic curve of best fit as the interpolation method. This policy model was specified a priori by the ODE. Table 2 shows the interpolated cut scores and impact data for Grades 4, 6, and 7. Also shown in the table are the participant-recommended cut scores and associated impact data from Round 3.
5

Table 1. Participant-recommended Cut Scores and Associated Impact Data Based on Round 3
Cut Scores Impact Data
Content Area Grade
Nearly Meets Meets Exceeds
Does Not Yet
Meet Nearly Meets Meets Exceeds
Meets &
Above 3 201 204 215 11.4% 8.2% 45.2% 35.2% 80.4% 5 214 218 230 13.1% 14.4% 48.9% 23.6% 72.5% 8 225 230 241 19.2% 13.1% 40.3% 27.4% 67.7% Mathematics
CIM 231 236 246 29.8% 15.9% 37.7% 16.6% 54.3% 3 199 203 216 8.5% 7.1% 42.4% 42.0% 84.4% 5 209 218 230 7.7% 20.9% 45.8% 25.6% 71.4% 8 224 230 241 15.9% 15.2% 47.4% 21.5% 68.9%
Reading/ Literature
CIM 231 236 248 21.3% 14.2% 47.6% 16.9% 64.5% 5 216 225 238 8.0% 19.1% 50.5% 22.4% 72.9% 8 229 234 246 21.3% 14.3% 44.2% 20.2% 64.4% Science
CIM 235 240 249 26.6% 17.4% 35.3% 20.7% 56.0% Table 2. Interpolated Cut Scores and Impact Data for Grades 4, 6, and 7 Based on the Participant-recommended Cut Scores and Associated Impact Data from Round 3
Cut Scores Impact Data
Content Area Grade
Nearly Meets Meets Exceeds
Does Not Yet
Meet Nearly Meets Meets Exceeds
Meets &
Above 3 201 204 215 11.4% 8.2% 45.2% 35.2% 80.4% 4* 208 212 224 10.7% 13.2% 44.8% 31.3% 76.1% 5 214 218 230 13.1% 14.4% 48.9% 23.6% 72.5% 6* 215 220 233 13.2% 12.6% 49.1% 25.1% 74.3% 7* 221 226 239 17.0% 12.2% 45.5% 25.3% 70.8% 8 225 230 241 19.2% 13.1% 40.3% 27.4% 67.7%
Mathematics
CIM 231 236 246 29.8% 15.9% 37.7% 16.6% 54.3% 3 199 203 216 8.5% 7.1% 42.4% 42.0% 84.4% 4* 205 211 223 7.7% 12.7% 45.6% 34.0% 79.6% 5 209 218 230 7.7% 20.9% 45.8% 25.6% 71.4% 6* 214 222 234 10.4% 19.2% 45.1% 25.3% 70.4% 7* 219 227 241 11.4% 19.3% 49.7% 19.6% 69.3% 8 224 230 241 15.9% 15.2% 47.4% 21.5% 68.9%
Reading/ Literature
CIM 231 236 248 21.3% 14.2% 47.6% 16.9% 64.5% 5 216 225 238 8.0% 19.1% 50.5% 22.4% 72.9% 8 229 234 246 21.3% 14.3% 44.2% 20.2% 64.4% Science
CIM 235 240 249 26.6% 17.4% 35.3% 20.7% 56.0% * Interpolated data
6

Cross-grade Articulation (Smoothing) The cut scores and associated impact data determined for the off-grades by interpolation were examined by table leaders during the cross-grade articulation discussion on Day 3. The purpose of this smoothing discussion was to establish a system of cut scores that was well-articulated and, at the same time, considerate of the participants’ original recommendations. A representative from the ODE was present during these discussions to answer policy-related questions. Table leaders recommended minor changes to the cut scores (in most cases only a one-point change) so that the cross-grade impact data formed a cohesive whole when viewed from a policy perspective. Table 3 shows the cut scores developed during the smoothing discussions, as well as the associated impact data.
Table 3. Cut Scores and Associated Impact Data after Cross-grade Smoothing Cut Scores Impact Data
Content Area Grade
Meets Nearly Meets Exceeds
Does Not Yet
Meet Nearly Meets Meets Exceeds
Meets &
Above 3 201 205 217 11.4% 11.8% 49.7% 27.1% 76.7% 4* 208 212 225 10.7% 13.2% 48.1% 28.0% 76.1% 5 214 218 229 13.1% 14.4% 46.1% 26.4% 72.6% 6* 216 221 232 15.2% 14.5% 42.2% 28.1% 70.3% 7* 221 226 238 17.0% 12.2% 42.5% 28.3% 70.8% 8 225 230 241 19.2% 13.1% 40.3% 27.4% 67.7%
Mathematics
CIM 231 236 246 29.8% 15.9% 37.7% 16.7% 54.4% 3 199 204 218 8.5% 9.8% 47.5% 34.2% 81.7% 4* 205 211 223 7.7% 12.7% 45.6% 34.0% 79.6% 5 209 218 230 7.7% 20.9% 45.8% 25.6% 71.4% 6* 214 222 234 10.4% 19.2% 45.1% 25.3% 70.4% 7* 219 227 239 11.4% 19.3% 44.1% 25.2% 69.3% 8 224 231 241 15.9% 18.6% 43.9% 21.6% 65.5%
Reading/ Literature
CIM 231 236 248 21.3% 14.2% 47.6% 16.9% 64.6% 5 216 225 238 8.0% 19.1% 50.5% 22.4% 72.9% 8 229 234 246 21.3% 14.3% 44.2% 20.2% 64.4% Science
CIM 235 240 249 26.6% 17.4% 35.3% 20.7% 56.0% * Interpolated data This report summarizes the results of the Oregon Standard Setting. A round-by-round synopsis is included in Section B. The Master Agenda is included in Section C. All training materials given to participants are provided in Section D. The overheads presented to participants during training and orientation are included in Section E. Section F presents details of the participants’ Bookmark judgments for each grade and content area. In Section G, estimates are given of the percentages of students in each achievement level at plus/minus one, two, and three standard errors of the participants’ recommended final round cut scores for each grade and content area. Section H contains graphical representations of participants' final round judgments and standard errors. Section I contains the results of the participant evaluation of the Oregon Standard Setting. As a reference for the reader, Section J presents The Bookmark Standard Setting Procedure: Methodology & Recent Implementations (Lewis, Green, Mitzel, Baum, & Patz, 1998).
7

SECTION B
Oregon Standard Setting:
Day-by-Day Overview
8

Oregon Standard Setting: Day-by-Day Overview Oregon’s Statewide Assessments are administered in multiple formats: the paper-and-pencil format and the Technology Enhanced Student Assessment (TESA) web-based format. TESA is an adaptive, web-based approach, which is the required method of testing for all schools in the state of Oregon unless a waiver is granted. On TESA, students have multiple opportunities to participate in the fully-adaptive testing. Oregon has two options for the TESA administration: a short form or a long form. For the short form, students receive only a scale score, whereas for the long form, students also receive subscores. In Oregon, the high school level is referred to as the Certificate of Initial Mastery (CIM) level. The Oregon Department of Education (ODE) contracted with CTB/McGraw-Hill (CTB) to conduct standard setting to establish cut scores for the Oregon Statewide Assessments in Mathematics, Reading/Literature, and Science, and for the English Language Proficiency Assessments (ELPA). This document reports the results of the standard setting for the Oregon Statewide Assessments in Mathematics, Reading/Literature, and Science. The results of the standard setting for ELPA will be reported in the Oregon English Language Proficiency Assessments Bookmark Standard Setting Technical Report 2006. CTB/McGraw-Hill staff conducted the Oregon Standard Setting December 11–13, 2006, in Portland, Oregon. The Bookmark Standard Setting Procedure (BSSP; Lewis, Mitzel & Green, 1996; Mitzel, Lewis, Patz, & Green, 2001) was implemented to set standards for eleven grade and content areas: Grades 3–8 and CIM for Mathematics and Reading/Literature and Grades 5, 8, and CIM for Science. Participants in each grade and content area recommended three cut scores which define four achievement levels: Does Not Yet Meet, Nearly Meets, Meets, and Exceeds. CTB interpolated cut scores for Grades 4, 6, and 7 in Mathematics and Reading/Literature based on participants’ recommended cut scores for Grades 3, 5, 8, and CIM. The Oregon Standard Setting gathered participants from across Oregon to set achievement standards for the Mathematics, Reading/Literature, and Science assessments. Each grade and content area had approximately 18 participants. Within each grade and content area, the Oregon Department of Education (ODE) divided participants into three tables that were balanced in terms of the relevant demographic characteristics (e.g., gender, geographic location). The Oregon Standard Setting consisted of training, orientation, three rounds of judgments, cross-grade discussions, and descriptor writing. The workshop lasted three days. The ODE and CTB conducted the opening session and training on the first morning, and the remaining time was used for standard setting and achievement-level descriptor writing. This document describes the implementation of the BSSP to establish cut scores at selected grades, the interpolation of cut scores for the off-grades, the cross-grade articulation discussion, and the development of achievement-level descriptors.
9

Bookmark Roles CTB Staff The CTB Standard Setting Team worked with staff from the ODE to design, organize, and conduct the Oregon Standard Setting. The CTB Standard Setting Team was composed of Ricardo Mercado, Research Project Manager; Christina Schneider, Research Scientist; Michaela Gelin, Research Scientist; Adele Brandstrom, Standard Setting Specialist; and Dorothy Tele’a, Standard Setting Specialist. Prior to the Oregon Standard Setting, this team prepared all materials for the workshop. During the workshop, this team was responsible for facilitating the workshop, training participants, entering participant results into a database, and tracking secure materials. Following the workshop, this team prepared the standard setting technical report. At the standard setting workshop, the CTB Standard Setting Team was assisted by Denise Truskosky, CTB Research Manager, who helped facilitate the workshop. Ms. Brandstrom and Ms. Tele’a were assisted by CTB Research Associates Hillory White, Tracy Podrabsky, and Kristina Kelley. Caroline McNeely was the CTB Program Manager attending the Oregon Standard Setting. Nancy Holt was the CTB Program Office Coordinator who arranged the logistics for the workshop and helped recruit participants. Ms. Holt was unable to attend the standard setting. Michelle Paregian, CTB Program Office Coordinator, and Theresa Lancione-Beccaria, from CTB Program Management, attended the standard setting and helped with on-site logistics. In addition, Agneta Lenberg, CTB National Accounts Manager, and Cindi Jensen, Senior Evaluation Consultant, attended the standard setting. Margie Tully, CTB Development Director, also attended the standard setting. Group Leaders In each grade and content area, the group leader served as a facilitator and was in charge of time management, focusing the participants on the task at hand, and interacting with the participants. The group leader also facilitated cross-table discussions and was in charge of security and data management. The group leader collected the rating forms from participants and communicated with CTB Research and the ODE staff. Group leaders were nonvoting members of the standard setting staff. The group leaders were content specialists from CTB Development and are listed in Table 1.
10

Table 1. Group Leaders for Each Grade and Content Area Content Area Grade Group Leader
3 Holly Beckstead 5 Shelley Vlasak 8 Andrew Jones Mathematics
CIM Stacey Libby 3 Cara Davis-Jacobson 5 Becky Fisher 8 Pat Stevens Reading
CIM Cathy Upham 5 Kristina Summers 8 Gabe Martinez Science
CIM Michael Frontz Participants Participants were recruited from across Oregon. For the Mathematics and Reading assessments, participants recommended standards for Grades 3, 5, 8 and 10. For the Science assessment, participants recommended standards for Grades 5, 8, and 10. A total of eleven standard setting panels were recruited to participate in the recommendation of achievement standards. Each grade and content area panel worked in a separate breakout room during the standard setting. All participants were selected by the ODE. Each grade and content area panel comprised approximately 18 participants, of which three participants also served as table leaders. As shown in Table 2, the complete standard setting committee comprised 210 participants, including a total of 33 table leaders. The ODE also included stakeholders as members of the standard setting panel.
Table 2. Number of Participants in Each Grade and Content Area Content Area Grade Number of Participants
3 19 5 18 8 20 Mathematics
CIM 19 3 19 5 22 8 20 Reading
CIM 17 5 20 8 20 Science
CIM 16 Total 210
11

Configuration of Standard Setting Panels Each grade and content area panel was subdivided into three tables of approximately six persons each. The ODE selected a table leader for each table. A description of the table leader’s role follows. The ODE assigned participants so that each table was as representative and balanced as possible in regard to the relevant demographics (e.g., gender, geographic location). For each grade and content area, one group leader helped implement the BSSP.
Table leaders. Table leaders were experienced educators within their grade and content area and were chosen from among the participants. Some table leaders had a previous role with the assessment, such as serving as item-writers. The primary role of the table leader was to monitor the group discourse, keep the group focused on the task at hand, and keep time for the group. As needed, table leaders found a diplomatic middle ground between participants or requested assistance from CTB and the ODE. Table leaders were voting members of the standard setting panels.
Following the standard setting, 209 participants completed evaluations from which self-reported demographic information about the participants was summarized. Table 3 shows the educational background of the participants in each grade and content area. Table 4 shows the primary role of participants at the standard setting. Overall, 94% of the participants were educators. Some committees had a greater proportion of community or business members. Approximately 13% of the CIM Reading/Literature panel was composed of community members, and approximately 13% of the CIM Science panel was composed of parents. Tables 5 and 6 show the occupation and work experience in years of the participants. Most participants were educators or administrators who had significant experience in their content area. Table 7 shows participant experience teaching English language learners and students with disabilities. Overall 18% had experience with Special Education, 17% with ESL/ELD, 4% with Vocational Education, 15% with Alternative Education, and 27% with Adult Education. Section I contains the complete results of the participant evaluation.
Table 3. Educational Background of Participants in Each Grade and Content Area
Content Area Grade N HSD or GED Bachelor's Master's Doctorate Overall 209 1.0% 23.4% 69.4% 6.2%
Mathematics 3 19 0.0% 47.4% 47.4% 5.3% 5 18 0.0% 33.3% 66.7% 0.0% 8 20 0.0% 25.0% 75.0% 0.0% CIM 19 0.0% 21.1% 73.7% 5.3%
Reading/Literature 3 19 0.0% 26.3% 68.4% 5.3% 5 22 0.0% 13.6% 72.7% 13.6% 8 20 5.0% 20.0% 75.0% 0.0% CIM 16 6.3% 25.0% 62.5% 6.3%
Science 5 20 0.0% 20.0% 70.0% 10.0% 8 20 0.0% 0.0% 85.0% 15.0% CIM 16 0.0% 31.3% 62.5% 6.3%
12

Table 4. Primary Role at Standard Setting of Participants in Each Grade and Content Area
Content Area Grade N Educator Parent Community
Member Business Member
Overall 209 93.8% 3.3% 2.4% 0.5% Mathematics 3 19 94.7% 0.0% 5.3% 0.0%
5 18 94.4% 5.6% 0.0% 0.0% 8 20 100.0% 0.0% 0.0% 0.0% CIM 19 94.7% 0.0% 5.3% 0.0%
Reading/Literature 3 19 94.7% 0.0% 5.3% 0.0% 5 22 95.5% 0.0% 0.0% 4.5% 8 20 95.0% 5.0% 0.0% 0.0% CIM 16 87.5% 0.0% 12.5% 0.0%
Science 5 20 95.0% 5.0% 0.0% 0.0% 8 20 90.0% 10.0% 0.0% 0.0% CIM 16 87.5% 12.5% 0.0% 0.0%
Table 5. Occupation of Participants in Each Grade and Content Area
Content Area Grade N Teacher Administrator Other Overall 207 74.4% 14.0% 11.6%
Mathematics 3 18 94.4% 5.6% 0.0% 5 18 83.3% 0.0% 16.7% 8 20 90.0% 5.0% 5.0% CIM 19 78.9% 10.5% 10.5%
Reading/Literature 3 19 68.4% 21.1% 10.5% 5 22 45.5% 36.4% 18.2% 8 20 75.0% 20.0% 5.0% CIM 16 56.3% 18.8% 25.0%
Science 5 20 80.0% 10.0% 10.0% 8 19 73.7% 10.5% 15.8% CIM 16 75.0% 12.5% 12.5%
13

Table 6. Work Experience in Years of Participants in Each Grade and Content Area
Content Area Grade N 1-5 6-10 11-15 16-20 21+ Overall 209 8.1% 19.1% 15.8% 21.5% 35.4%
Mathematics 3 19 5.3% 26.3% 5.3% 21.1% 42.1% 5 18 5.6% 16.7% 16.7% 22.2% 38.9% 8 20 10.0% 25.0% 10.0% 35.0% 20.0% CIM 19 5.3% 21.1% 5.3% 15.8% 52.6%
Reading/Literature 3 19 0.0% 15.8% 21.1% 21.1% 42.1% 5 22 4.5% 22.7% 13.6% 22.7% 36.4% 8 20 20.0% 20.0% 30.0% 5.0% 25.0% CIM 16 18.8% 0.0% 12.5% 31.3% 37.5%
Science 5 20 5.0% 20.0% 20.0% 25.0% 30.0% 8 20 15.0% 30.0% 5.0% 10.0% 40.0% CIM 16 0.0% 6.3% 37.5% 31.3% 25.0%
Table 7. Experience of Participants in Each Grade and Content Area Teaching English Language Learners and Students with Disabilities
Content Area Grade N
Special Ed. N
ESL/ ELD N
Vocational Ed.
Alternative Ed.
Adult Ed.
Overall 208 17.8% 208 16.8% 209 3.8% 15.3% 27.3%
3 19 21.1% 19 26.3% 19 0.0% 5.3% 10.5%5 17 5.9% 18 11.1% 18 5.6% 11.1% 38.9%8 20 10.0% 20 20.0% 20 0.0% 20.0% 20.0%
Mathematics
10 19 10.5% 19 5.3% 19 15.8% 26.3% 42.1%3 19 21.1% 19 10.5% 19 0.0% 5.3% 21.1%5 22 22.7% 22 27.3% 22 4.5% 18.2% 31.8%8 20 20.0% 20 25.0% 20 10.0% 25.0% 30.0%
Reading/ Literature
10 16 12.5% 16 12.5% 16 0.0% 25.0% 18.8%5 20 20.0% 19 15.8% 20 0.0% 0.0% 30.0%8 20 30.0% 20 10.0% 20 5.0% 10.0% 35.0%Science
10 16 18.8% 16 18.8% 16 0.0% 25.0% 18.8%
14

Bookmark Materials Ordered Item Booklets The ordered item booklet (OIB) for each grade and content area was made up of 70 multiple-choice items that the ODE selected from TESA. The items for each grade and content area were ordered according to their scale location (scaled with the Rasch model) using a response probability of 0.67 (see Beretvas, 2004). Each form used for standard setting was an augmented version of TESA. The TESA augmented forms closely match the content area test blueprints, as shown in Tables 8, 9, and 10. Each table shows the difference between the observed percentages of coverage on the augmented form and the required percentages from the test blueprints. No augmented form differed from a test blueprint cell by more than 9%. For more information about the construction of the ordered item booklets, see Lewis, Green, Mitzel, Baum, & Patz (1998), which is included in Section J.
Table 8. Differences between Augmented Form and Test Blueprints for Mathematics Grade 3 Grade 4 Grade 5 Grade 6 Grade 7 Grade 8 CIM Calculations & Estimations 2% -3% 1% 2% 1% 2% 1%
Measurement 0% 1% -1% 1% 1% 1% 1% Statistics & Probability -1% 6% 0% 0% 0% 0% -1%
Algebraic Relationships -4% -4% 4% -2% 0% 0% -2%
Geometry 3% 0% -4% -1% -1% -3% 1%
Table 9. Differences between Augmented Form and Test Blueprints for Reading/Literature Grade 3 Grade 4 Grade 5 Grade 6 Grade 7 Grade 8 CIM Vocabulary 1% 4% 3% 1% -4% 3% -1% Read to Perform a Task -6% -2% -2% 2% -2% -2% -1%
Demonstrate General Understanding
1% -5% -4% -3% 1% 1% 5%
Develop an Interpretation 5% 6% -1% -3% 6% 9% 0%
Informational Text - -3% 2% -1% 0% -5% 0%
Literary Text - - 1% 3% -1% -5% -3%
15

Table 10. Differences between Augmented Form and Test Blueprints for Science Grade 5 Grade 8 CIM Physical Science 0% 0% 1% Life Science 1% 0% 1% Earth & Space Science 0% 1% -2% Item Maps The item map for each grade and content area summarized information about each item in the OIB: each item’s order of difficulty, scoring key (correct response), and the objective that the item measured. For Reading/Literature and Science, the item map also included a column indicating the passage or stimulus, respectively. Participants filled in the final two columns as they studied the items in the OIB. The first of these columns asks, “What does this item measure? That is, what do you know about a student who can respond successfully to this item?” The second of these columns asks “Why is this item more difficult than the preceding items?” The item maps did not include the locations of the items; however, after Round 1, table leaders were given item maps that included the locations of the items. Table leaders shared these item maps with participants. At the suggestion of the ODE's technical advisory committee, this procedure was used to prevent standard setting participants from developing pre-conceived notions of where the bookmarks should be placed based solely on knowledge of the existing cut scores. Participants were given an opportunity in Round 1 to set bookmarks based solely on their study and discussion of the test items, and then were given information about each item’s scale location following their Round 1 bookmark placements.
Bookmark Standard Setting Procedure: Day 1 The implementation of the BSSP consisted of training, orientation, and three rounds of judgments. This was followed by descriptor writing and cross-grade articulation. Opening Session Douglas Kosty, Assistant Superintendent for Assessment & Information Systems, introduced Ed Dennis, Deputy Superintendent, ODE. Mr. Dennis gave the welcoming address and described the purpose of the standard setting. Doug Kosty then introduced Tony Alpert, Director of Assessment, who provided a short overview of the assessment program. The ODE described the expectations for the type of cut scores that the state anticipated from the process in terms of rigor. Susan Castillo, Superintendent of Public Instruction, also addressed participants at lunch on Day 1 of the workshop. During this address, Superintendent Castillo thanked participants for being part of this process and reinforced the importance of their work.
16

Training Following the presentation by the ODE, Ricardo Mercado, a member of the CTB Standard Setting Team provided an overview of the purpose of standard setting and described the implementation of the BSSP. Participants were introduced to key concepts and key materials of the BSSP, including the OIB and the item map. During this training, it was explained that table leaders would facilitate discussion at their tables and help participants complete tasks in a timely manner. Participants were given a synopsis of each day’s activities. The Master Agenda is included in Section C, and the training overheads are included in Section E. Participants engaged in a brief, mock standard setting using released Grade 4 Mathematics items from the National Assessment of Educational Progress. During this mock standard setting, participants reviewed and used the tools of the BSSP, including a sample OIB and item map. The sample OIB and item map are included in Section D. Following the mock standard setting, participants were directed to their preassigned, breakout rooms and tables. Each grade and content area was in a separate breakout area. Target Student Descriptors Prior to the standard setting, the ODE developed achievement-level descriptors for the average student within each of the following achievement levels: Does Not Yet Meet, Nearly Meets, Meets, and Exceeds. Once participants were in their preassigned, breakout rooms, the group leader within each grade and content area facilitated the target student discussion to help participants articulate the achievement levels, with one exception: the Grade 5 Mathematics group leader had participants review the OIB prior to facilitating the discussion of target student descriptors. A target student is defined as a student whose performance minimally meets the criteria for entry into a particular achievement level, for example, the “just” Meets student. For each grade and content area there were three target student descriptors, one for each cut score (Nearly Meets, Meets, and Exceeds). Participants created descriptors of the target students using the appropriate Oregon standards, the previously developed achievement-level descriptors, and the expectations the participants have of students in the achievement levels. These definitions served as a basis for establishing a common understanding of the type of student that should be considered when setting each cut score on the test. Participants were encouraged to take notes during the target student discussion and were referred to the target student descriptors throughout the standard setting. Examine the Test Participants examined an operational paper-pencil test for their grade and content area to experience the test from the student’s perspective. Study Items in the Ordered Item Booklet Participants at each table studied each of the 70 items in the OIB in terms of what each item measures and why it is more difficult than the items preceding it. At each table, one participant, denoted as the scribe, recorded the group’s comments about what each item measured. The locations for each item were not included on the item maps during Round 1.
17

Bookmark Standard Setting Procedure: Day 2 Complete Study of Items in the Ordered Item Booklet Participants completed their examination of each of the items in the OIB and took notes on their item maps. Bookmark Training Prior to setting their Round 1 bookmarks, participants received supplemental training on bookmark placement for the minimally competent student in each achievement level. This training was presented by Christina Schneider, a member of the CTB Standard Setting Team. Participants were instructed to use four tools when placing their bookmarks: the Oregon content standards, the target student descriptors, the achievement-level descriptors, and the content as represented by the items on the test. Participants were given training materials and three explanations of bookmark placement. The training materials titled “Bookmark Placement” and “Frequently Asked Questions about Bookmark Placement” were read aloud. The first explanation of bookmark placement demonstrated the mechanics: participants were instructed that all items preceding the bookmark define the knowledge, skills, and abilities that a “just” Meets student, for example, is expected to know. The second explanation of bookmark placement was more conceptual in that participants were instructed to examine each item in terms of its content and to make a judgment about the type of content that a student would need to know in order to be considered “just” Meets. The final explanation discussed the relationship between the bookmarks and the scale scores. The bookmark training materials are included in Section D. The participants were tested on their understanding of bookmark placement with a short check set. The check set questions and the results are presented in Tables 11 and 12, respectively. The responses to the check set indicated that participants understood how to place their bookmarks with one exception. Item 3 was difficult for the science panelists. Participants were provided with the correct answers for the check set, as well as explanations of those answers to address gaps in understanding. The check set (and the graphic that appears with it) is included in Section D. Table 11. Questions in the Check Set that Followed Bookmark Training Question 1 Which items does a student need to master to just make it into the Meets achievement
level? 2 If a student mastered only items 1 through 5, in which achievement level would this
student be? 3 Suppose a student mastered items 1 through 13. Which achievement level is this
student in? 4 For students who are classified as Meets, with at least what likelihood will they be able
to answer item 10? 5 Will the items BEFORE the Meets bookmark be more or less difficult to answer than the
items AFTER the bookmark or about the same?
18

Table 12. Results of the Check Set
Question Mathematics (N = 66) Reading (N = 69) Science (N = 69)
Count Correct
Percent Correct
Count Correct
Percent Correct
Count Correct
Percent Correct
1 61 92.4% 59 85.5% 57 82.6% 2 60 90.9% 59 85.5% 61 88.4% 3 47 71.2% 47 68.1% 35 50.7% 4 66 100% 65 94.2% 68 98.6% 5 65 98.5% 62 89.9% 62 89.9%
Round 1 Bookmark Placement Once participants demonstrated that they understood how to place their bookmarks through the check set, they placed bookmarks in the following order: Meets, Exceeds, and Nearly Meets. Participants were instructed that bookmark placement is always an individual activity. Prior to placement of the Round 1 bookmarks, the group leaders displayed an overhead transparency of the bookmarks that represented the existing cut scores for the Oregon Statewide Assessments. Participants were asked whether the existing cut scores reasonably represented the break in skills among the achievement levels that participants determined in their review of the items. If the existing cut scores reasonably represented the break of skills, participants were instructed that they could keep the existing bookmarks. If the current bookmarks did not reasonably represent the change in skills, participants were instructed to place their bookmarks on new pages in their OIBs. Participants placed their Round 1 bookmarks for Nearly Meets, Meets, and Exceeds, while keeping in mind the Oregon content standards, the target student descriptors, the achievement-level descriptors, and the content as represented by the items on the test. Round 2 Bookmark Placement In each grade and content area, the table leader at each table facilitated a discussion of all the bookmark placements for the table. Participants were encouraged to focus on the differences among their bookmarks by discussing the items between the lowest and highest bookmarks at their table. Participants were then directed back to their OIBs and item maps to continue content-based discussions. At this point, table leaders were each given a copy of the item map that included the location of each item in the OIB. After discussion, participants were reminded to place their bookmarks independently.
19

Round 3 Bookmark Placement Participants received feedback based on their Round 2 bookmark placements from a member of the CTB Standard Setting Team in collaboration with an ODE representative. On an overhead transparency, participants were shown the median bookmark placement for each achievement level for each table as well as the medians for their grade and content area. In addition, participants were shown impact data based on the median Round 2 bookmarks. Impact data was defined for participants as the percentages of students who would be classified in each achievement level based on the median bookmarks. CTB staff answered process-related questions, and the ODE staff answered all policy-related questions concerning the impact data. It was emphasized to the participants that the impact data were being presented as a “reality check.” During this portion of the standard setting, a fire alarm went off in the hotel in which the workshop was located. After a brief evacuation, the workshop resumed. After the presentation of Round 2 results, participants discussed the rationale of their bookmark placement across tables within their grade and content area. The group leader facilitated the discussion among all participants. After the discussion, participants were instructed to place their bookmarks independently for the final time. Round 3 Results Participants received feedback based on their final bookmark placements from a member of the CTB Standard Setting Team in collaboration with an ODE representative. On an overhead transparency, participants were shown the median bookmarks for each table as well as the medians for their grade and content area and the impact data based on the median Round 3 (final) bookmarks. In addition, participants were shown the impact data for all grades within their content areas as an introduction to the cross-grade discussion. Table 13 shows the participant-recommended cut scores and associated impact data based on the final round. The impact data in Table 13 were shown to the participants at the workshop and are based on the Fall 2006 test administration. Some Round 3 results were presented to grade and content areas on Day 2, the rest on Day 3.
20

Table 13. Participant-recommended Cut Scores and Associated Impact Data Based on Round 3
Cut Scores Impact Data
Content Area Grade Nearly Meets Meets Exceeds
Does Not Yet
Meet Nearly Meets Meets Exceeds
Meets &
Above 3 201 204 215 11.4% 8.2% 45.2% 35.2% 80.4% 5 214 218 230 13.1% 14.4% 48.9% 23.6% 72.5% 8 225 230 241 19.2% 13.1% 40.3% 27.4% 67.7% Mathematics
CIM 231 236 246 29.8% 15.9% 37.7% 16.6% 54.3% 3 199 203 216 8.5% 7.1% 42.4% 42.0% 84.4% 5 209 218 230 7.7% 20.9% 45.8% 25.6% 71.4% 8 224 230 241 15.9% 15.2% 47.4% 21.5% 68.9%
Reading/ Literature
CIM 231 236 248 21.3% 14.2% 47.6% 16.9% 64.5% 5 216 225 238 8.0% 19.1% 50.5% 22.4% 72.9% 8 229 234 246 21.3% 14.3% 44.2% 20.2% 64.4% Science
CIM 235 240 249 26.6% 17.4% 35.3% 20.7% 56.0% Section F presents details of the participants’ Bookmark judgments for each grade and content area. In Section G, estimates are given of the percentages of students in each achievement level at plus/minus one, two, and three standard errors of the participants’ recommended final round cut scores for each grade and content area. Section H contains graphical representations of participants' final round judgments and standard errors.
Bookmark Standard Setting Procedure: Day 3 Evaluations Following the presentation of final results, participants were asked to complete an evaluation of the Oregon Standard Setting. The results of the evaluation are included in Section I. Interpolation Once all grade panels for each content area in Mathematics and Reading/Literature completed Round 3, CTB interpolated the cut scores for the off-grades (Grades 4, 6, and 7) using the quadratic curve of best fit as the interpolation method. This policy model was specified a priori by the ODE. Historically, the percentage of students classified as Meets or above on the Oregon Statewide Assessments has followed a declining quadratic trend when tracked across grades. Table 14 shows the interpolated cut scores and impact data for Grades 4, 6, and 7. Also shown in the table are the participant-recommended cut scores and associated impact data from Round 3.
21
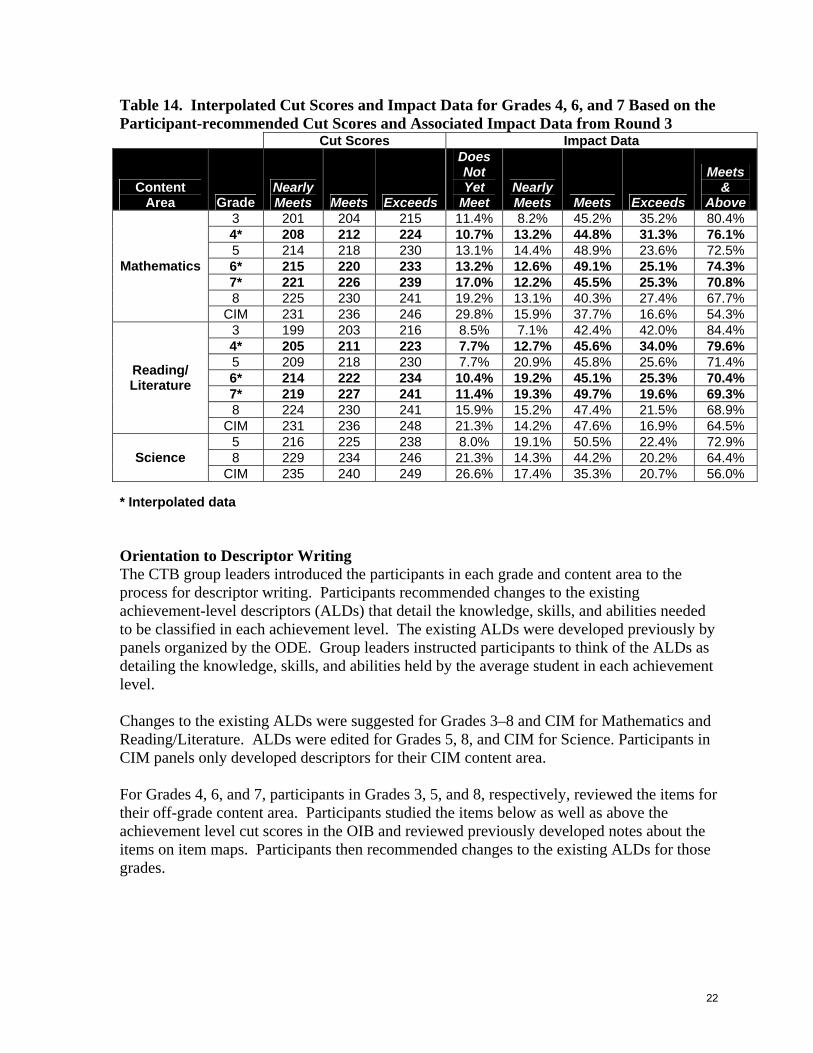
Table 14. Interpolated Cut Scores and Impact Data for Grades 4, 6, and 7 Based on the Participant-recommended Cut Scores and Associated Impact Data from Round 3
Cut Scores Impact Data
Content Area Grade
Nearly Meets Meets Exceeds
Does Not Yet
Meet Nearly Meets Meets Exceeds
Meets &
Above 3 201 204 215 11.4% 8.2% 45.2% 35.2% 80.4% 4* 208 212 224 10.7% 13.2% 44.8% 31.3% 76.1% 5 214 218 230 13.1% 14.4% 48.9% 23.6% 72.5% 6* 215 220 233 13.2% 12.6% 49.1% 25.1% 74.3% 7* 221 226 239 17.0% 12.2% 45.5% 25.3% 70.8% 8 225 230 241 19.2% 13.1% 40.3% 27.4% 67.7%
Mathematics
CIM 231 236 246 29.8% 15.9% 37.7% 16.6% 54.3% 3 199 203 216 8.5% 7.1% 42.4% 42.0% 84.4% 4* 205 211 223 7.7% 12.7% 45.6% 34.0% 79.6% 5 209 218 230 7.7% 20.9% 45.8% 25.6% 71.4% 6* 214 222 234 10.4% 19.2% 45.1% 25.3% 70.4% 7* 219 227 241 11.4% 19.3% 49.7% 19.6% 69.3% 8 224 230 241 15.9% 15.2% 47.4% 21.5% 68.9%
Reading/ Literature
CIM 231 236 248 21.3% 14.2% 47.6% 16.9% 64.5% 5 216 225 238 8.0% 19.1% 50.5% 22.4% 72.9% 8 229 234 246 21.3% 14.3% 44.2% 20.2% 64.4% Science
CIM 235 240 249 26.6% 17.4% 35.3% 20.7% 56.0% * Interpolated data Orientation to Descriptor Writing The CTB group leaders introduced the participants in each grade and content area to the process for descriptor writing. Participants recommended changes to the existing achievement-level descriptors (ALDs) that detail the knowledge, skills, and abilities needed to be classified in each achievement level. The existing ALDs were developed previously by panels organized by the ODE. Group leaders instructed participants to think of the ALDs as detailing the knowledge, skills, and abilities held by the average student in each achievement level. Changes to the existing ALDs were suggested for Grades 3–8 and CIM for Mathematics and Reading/Literature. ALDs were edited for Grades 5, 8, and CIM for Science. Participants in CIM panels only developed descriptors for their CIM content area. For Grades 4, 6, and 7, participants in Grades 3, 5, and 8, respectively, reviewed the items for their off-grade content area. Participants studied the items below as well as above the achievement level cut scores in the OIB and reviewed previously developed notes about the items on item maps. Participants then recommended changes to the existing ALDs for those grades.
22

Cross-grade Articulation (Smoothing) While participants continued the descriptor writing activities, table leaders examined the cut scores and associated impact data determined for the off-grades by interpolation. The purpose of this smoothing discussion was to establish a system of cut scores that was well-articulated and, at the same time, considerate of the participants’ original recommendations. A representative from the ODE was present during these discussions to answer policy-related questions. Table leaders made various adjustments to the cut scores to promote cross-grade articulation. These changes were all small (two scale score points or less). In Grade 3 Reading, table leaders recommended increasing the Exceeds cut score by two scale score points to bring the percentage of students classified as Exceeds in that grade more consistent with the percentages in Grades 4 and 5. Table leaders in Grades 5 and 8 Reading recommended decreasing the Exceeds cut score by two scale score points in Grade 7, using similar reasoning. Table leaders in Grade 3 recommended a one-point increase in the Meets cut score, after informal consultation with their participants, to bring the percentage of students classified as Meets in that grade more in line with the percentages of the other grades, and to increase the number of students classified as Nearly Meets in that grade. Grade 8 table leaders recommended a one-point increase in the Meets cut score at that grade for similar reasons. Table leaders in Reading did not recommend any changes to the Nearly Meets cut scores. In Mathematics, table leaders in Grade 3 recommended a two-point increase in the Exceeds cut score in that grade, as well as a one-point increase in the Exceeds cut score for Grade 4, in order to make the percentage of students classified as Exceeds more consistent with the percentages in other grades. Table leaders in Grade 5 concurred and recommended a one-point reduction in the Exceeds cut score of that grade, and they recommended, in collaboration with Grade 8, a one-point decrease in the Exceeds cut scores of Grades 6 and 7. Grade 3 table leaders also recommended a one-point increase in the Meets cut score for that grade to promote better articulation with Grades 4 and 5. Table leaders in Grade 5 recommended a one-point increase in the Meets cut score for Grade 6 to promote better articulation with surrounding grades. Grade 5 table leaders also recommended a one-point increase in the Nearly Meets cut score for Grade 6 for the same reason. At the time of the cross-grade articulation discussion, Science table leaders reported that they and their participants were satisfied with their recommended cut scores, and that the impact data associated with their cut scores were reasonable. Science table leaders recommended no changes to their cut scores. At the conclusion of the cross-grade articulation discussion, all table leaders were asked to review their recommended cut scores in their ordered item booklets and item maps. Specifically, table leaders were asked to verify that the changes that they recommended during the cross-grade articulation discussion were reasonable when compared to the content of the assessments. All table leaders reported that their recommended cut scores were reasonable when compared to the content of the assessments.
23

Thus, table leaders recommended minor changes to the cut scores so that the cross-grade impact data formed a cohesive whole when viewed from a policy perspective. Table 15 shows the cut scores developed during the smoothing discussions, as well as the associated impact data. Table 15. Cut Scores and Associated Impact Data after Cross-grade Articulation
Cut Scores Impact Data
Content Area Grade
Meets Nearly Meets Exceeds
Does Not Yet
Meet Nearly Meets Meets Exceeds
Meets &
Above 3 201 205 217 11.4% 11.8% 49.7% 27.1% 76.7% 4* 208 212 225 10.7% 13.2% 48.1% 28.0% 76.1% 5 214 218 229 13.1% 14.4% 46.1% 26.4% 72.6% 6* 216 221 232 15.2% 14.5% 42.2% 28.1% 70.3% 7* 221 226 238 17.0% 12.2% 42.5% 28.3% 70.8% 8 225 230 241 19.2% 13.1% 40.3% 27.4% 67.7%
Mathematics
CIM 231 236 246 29.8% 15.9% 37.7% 16.7% 54.4% 3 199 204 218 8.5% 9.8% 47.5% 34.2% 81.7% 4* 205 211 223 7.7% 12.7% 45.6% 34.0% 79.6% 5 209 218 230 7.7% 20.9% 45.8% 25.6% 71.4% 6* 214 222 234 10.4% 19.2% 45.1% 25.3% 70.4% 7* 219 227 239 11.4% 19.3% 44.1% 25.2% 69.3% 8 224 231 241 15.9% 18.6% 43.9% 21.6% 65.5%
Reading/ Literature
CIM 231 236 248 21.3% 14.2% 47.6% 16.9% 64.6% 5 216 225 238 8.0% 19.1% 50.5% 22.4% 72.9% 8 229 234 246 21.3% 14.3% 44.2% 20.2% 64.4% Science
CIM 235 240 249 26.6% 17.4% 35.3% 20.7% 56.0% * Interpolated data Evaluation of Training An indication of the effectiveness of training may be found in the participants’ answers to statements and questions on the evaluations. Table 16 shows that most participants agreed or strongly agreed that they understood how to place their bookmarks. Table 17 summarizes that most participants agreed or strongly agreed that the task of bookmark placement was clear. Table 18 shows that most participants agreed or strongly agreed that the training materials were helpful. Table 19 indicates that most participants agreed or strongly agreed that the Bookmark Procedure was well described. As Table 20 demonstrates, most participants agreed or strongly agreed that the goals of the process were clear.
24

Table 16. Participants' Agreement/Disagreement with the Statement, “I understood how to place my bookmarks.
Content Area Grade N Strongly Disagree Disagree Neutral Agree
Strongly Agree
Agree + Strongly
Agree Overall 209 0.0% 1.9% 1.4% 52.2% 44.5% 96.7%
Mathematics 3 19 0.0% 5.3% 0.0% 57.9% 36.8% 94.7% 5 18 0.0% 0.0% 0.0% 72.2% 27.8% 100.0% 8 20 0.0% 0.0% 0.0% 50.0% 50.0% 100.0% CIM 19 0.0% 0.0% 0.0% 57.9% 42.1% 100.0%
Reading/Literature 3 19 0.0% 0.0% 0.0% 42.1% 57.9% 100.0% 5 22 0.0% 4.5% 4.5% 45.5% 45.5% 91.0% 8 20 0.0% 5.0% 0.0% 40.0% 55.0% 95.0% CIM 16 0.0% 0.0% 6.3% 56.3% 37.5% 93.8%
Science 5 20 0.0% 0.0% 0.0% 35.0% 65.0% 100.0% 8 20 0.0% 0.0% 5.0% 65.0% 30.0% 95.0% CIM 16 0.0% 6.3% 0.0% 56.3% 37.5% 93.8%
Table 17. Participants' Agreement/Disagreement with the Statement, “The training on Bookmark placement made the task clear to me.”
Content Area Grade N Strongly Disagree Disagree Neutral Agree
Strongly Agree
Agree + Strongly
Agree Overall 209 0.0% 3.3% 9.6% 61.7% 25.4% 87.1%
Mathematics 3 19 0.0% 0.0% 10.5% 63.2% 26.3% 89.5% 5 18 0.0% 11.1% 16.7% 55.6% 16.7% 72.3% 8 20 0.0% 0.0% 5.0% 75.0% 20.0% 95.0% CIM 19 0.0% 0.0% 10.5% 57.9% 31.6% 89.5%
Reading/Literature 3 19 0.0% 0.0% 5.3% 52.6% 42.1% 94.7% 5 22 0.0% 4.5% 9.1% 50.0% 36.4% 86.4% 8 20 0.0% 10.0% 15.0% 50.0% 25.0% 75.0% CIM 16 0.0% 0.0% 6.3% 68.8% 25.0% 93.8%
Science 5 20 0.0% 10.0% 5.0% 50.0% 35.0% 85.0% 8 20 0.0% 0.0% 15.0% 80.0% 5.0% 85.0% CIM 16 0.0% 0.0% 6.3% 81.3% 12.5% 93.8%
25

Table 18. Participants' Agreement/Disagreement with the Statement, “The training materials were helpful.”
Content Area Grade N Strongly Disagree Disagree Neutral Agree
Strongly Agree
Agree + Strongly
Agree Overall 209 0.0% 1.0% 11.5% 66.5% 21.1% 87.6%
3 19 0.0% 0.0% 5.3% 68.4% 26.3% 94.7% 5 18 0.0% 0.0% 16.7% 72.2% 11.1% 83.3% 8 20 0.0% 0.0% 10.0% 70.0% 20.0% 90.0%
Mathematics
CIM 19 0.0% 5.3% 5.3% 57.9% 31.6% 89.5% 3 19 0.0% 0.0% 5.3% 78.9% 15.8% 94.7% 5 22 0.0% 0.0% 9.1% 63.6% 27.3% 90.9% 8 20 0.0% 5.0% 25.0% 60.0% 10.0% 70.0%
Reading/Literature
CIM 16 0.0% 0.0% 18.8% 56.3% 25.0% 81.3% 5 20 0.0% 0.0% 5.0% 60.0% 35.0% 95.0% 8 20 0.0% 0.0% 20.0% 75.0% 5.0% 80.0% Science
CIM 16 0.0% 0.0% 6.3% 68.8% 25.0% 93.8%
Table 19. Participants' Agreement/Disagreement with the Statement, “The Bookmark Procedure was well described.”
Content Area Grade N Strongly Disagree Disagree Neutral Agree
Strongly Agree
Agree + Strongly
Agree Overall 209 0.0% 1.9% 7.2% 61.7% 29.2% 90.9%
3 19 0.0% 0.0% 10.5% 57.9% 31.6% 89.5% 5 18 0.0% 11.1% 16.7% 44.4% 27.8% 72.2% 8 20 0.0% 5.0% 0.0% 65.0% 30.0% 95.0%
Mathematics
CIM 19 0.0% 0.0% 0.0% 68.4% 31.6% 100.0% 3 19 0.0% 0.0% 0.0% 57.9% 42.1% 100.0% 5 22 0.0% 0.0% 4.5% 68.2% 27.3% 95.5% 8 20 0.0% 5.0% 15.0% 55.0% 25.0% 80.0%
Reading/Literature
CIM 16 0.0% 0.0% 18.8% 50.0% 31.3% 81.3% 5 20 0.0% 0.0% 10.0% 50.0% 40.0% 90.0% 8 20 0.0% 0.0% 5.0% 80.0% 15.0% 95.0% Science
CIM 16 0.0% 0.0% 0.0% 81.3% 18.8% 100.0%
26

Table 20. Participants' Agreement/Disagreement with the Statement, “The goals for the Bookmark Procedure were clear.”
Content Area Grade N Strongly Disagree Disagree Neutral Agree
Strongly Agree
Agree + Strongly
Agree Overall 208 0.0% 7.2% 9.1% 57.7% 26.0% 83.7%
3 19 0.0% 5.3% 10.5% 63.2% 21.1% 84.3% 5 18 0.0% 11.1% 16.7% 55.6% 16.7% 72.3% 8 20 0.0% 0.0% 10.0% 60.0% 30.0% 90.0%
Mathematics
CIM 19 0.0% 0.0% 15.8% 63.2% 21.1% 84.3% 3 19 0.0% 5.3% 0.0% 52.6% 42.1% 94.7% 5 21 0.0% 4.8% 0.0% 61.9% 33.3% 95.2% 8 20 0.0% 20.0% 5.0% 65.0% 10.0% 75.0%
Reading/Literature
CIM 16 0.0% 12.5% 6.3% 43.8% 37.5% 81.3% 5 20 0.0% 5.0% 0.0% 55.0% 40.0% 95.0% 8 20 0.0% 15.0% 25.0% 40.0% 20.0% 60.0% Science
CIM 16 0.0% 0.0% 12.5% 75.0% 12.5% 87.5% Quality Control Procedures The CTB Standard Setting Team adhered to many quality control procedures to foster the accuracy of the materials used and the results presented during the standard setting. Prior to the workshop, the Standard Setting Team cross-checked the ordering of items in the Ordered Item Booklets, the accuracy of the information in the Item Maps, and the accuracy of the Microsoft Excel macros and Bookmark Pro software used to generate results and impact data. During the workshop, all data were scanned. The CTB Standard Setting Team checked the reasonableness of the data presented to participants.
27

Graphical Representation of Participants’ Judgments This document includes several presentations of participants’ judgments throughout the Bookmark Procedure. Section H includes graphical representations of participants’ judgments. Among other uses, the graphical representations of participants’ judgments can be used to show the convergence of the recommended cut scores across the three rounds of the Bookmark Procedure. An example of this representation is shown in Figure 1. Figure 1. Graphical representation of participants’ judgments in Grade 3 Mathematics for the Nearly Meets cut point.
In Figure 1, each participant’s cut score recommendation is shown for the Nearly Meets cut point for Grade 3 Mathematics, by round. Lines connect the cut score recommendations for a single participant across rounds. Different symbols are used for participants at each table: the judgments made at each table are shown in similar graphs in Section H. Above the legend for the graph in Figure 1, two values are given. The first value, SEbk, is the standard error of the bookmark, as calculated from participants’ judgments at Round 2. A discussion of this standard error is shown on Page 243. The second value, r, is used in the calculation of SEbk and is an intra-class correlation of participants’ judgments. Figure 1 also illustrates SEbk with a symbol to the right of the graph. The symbol is centered at the median judgment, and illustrates a band of ±2 SEbk around this value.
28

Standard Errors Associated with the Recommended Cut Scores Two types of standard errors are associated with the recommended cut scores: the standard error of the bookmark (SEbk), and the standard error of measurement (SEM). SEbk quantifies how much one might expect the cut scores to vary if they were recommended by a different set of participants, drawn from the same pool of such qualified participants. The SEM quantifies the error associated with the test itself at the given cut score: it quantifies how much one might expect a student’s score to vary if he or she were tested repeatedly without a change in underlying ability. These two sources of error can be combined (SEcombined) using the following formula:
( ) ( )22 SEMSESE bkmkcombined += In Section G, SEbk, SEM, and SEcombined values are associated with each cut score. For each cut score, the participants’ median recommendation is shown, ±0, 1, 2, and 3 standard errors (bookmark, measurement, and combined). The percentages of students that would be classified in each performance level for each adjusted cut score are also shown in Section G. Note that the impact data associated with the adjusted cut scores sometimes are markedly different than the impact data associated with the participant-recommended cut scores. Many of these differences are associated with the underlying distribution of student scores: when a cut score lies in an interval of the test scale where many students have scored, even small adjustments in the cut score can lead to large differences in the associated impact data. The practice of adjusting cut scores by standard errors is a long-standing one (Cizek & Bunch, 2007). Adjustments to cut scores may be made with SEbk to account for variance in the cut score recommendations associated with the standard setting process, with SEM to account for variance in test score estimates, or with SEcombined to account for both.
29

References
Beretvas, S.N. (2004). Comparison of Bookmark difficulty locations under different item response models. Applied Psychological Measurement, 28, 25-47. Cizek, G.J. & Bunch, M.B. (2007). Standard setting: A guide to establishing performance standards on tests. Thousand Oaks, CA: Sage Publications.
Lewis, D.M., Mitzel, H.C., & Green, D.R. (1996). Standard Setting: A bookmark approach. In D.R. Green (Chair), IRT-based standard-setting procedures utilizing behavioral anchoring. Symposium conducted at the Council of Chief State School Officers National Conference on Large-Scale Assessment, Phoenix, AZ.
Lewis, D. M., Green, D. R., Mitzel, H. C., Baum, K., & Patz, R. J., (1998, April). The Bookmark Standard Setting Procedure: Methodology and Recent Implementations. Paper presented at the 1998 annual meeting of the National Council of Measurement in Education annual meeting, San Diego, CA.
Mitzel, H.C., Lewis, D.M., Patz, R.J., & Green, D.R. (2001). The Bookmark procedure: Psychological perspectives. In G. J. Cizek (Ed.), Setting performance standards: Concepts, methods, and perspectives (pp. 249–281). Mahwah, NJ: Lawrence Erlbaum Associates.
30

SECTION C
Master Agenda
31

Master Agenda
Oregon Department of Education
Grades 3, 5, 8, and CIM
Reading/Literature and Mathematics
Grades 5, 8, and CIM Science
Kindergarten and Grades 2, 5, 7, and 11
ELPA
Bookmark Standard Setting Workshop December 11 – 13, 2006
Portland, Oregon
32

Welcome to the Bookmark Standard Setting Workshop for the Oregon Statewide Assessment! The Oregon Department of Education and CTB/McGraw-Hill thank you for your time and expertise during this important process. Please use this agenda to orient yourself during the workshop. If you have any questions or concerns, please do not hesitate to contact a member of the CTB Standard Setting Team.
Monday, December 11 Welcome!
7:30 AM Participant Registration and Continental Breakfast
Please check in at the reception area to sign the nondisclosure agreement, get your nametag, and collect any other necessary information.
8:30 AM Opening Session and Bookmark Overview
The Oregon Department of Education welcomes participants to the standard setting and overviews the testing program and standard setting. CTB introduces the Bookmark Standard Setting Procedure and discusses your role and responsibilities during the workshop.
10:00 AM Break (15 minutes) and Direct Participants to Preassigned Breakout Rooms The Group Leader welcomes participants. After brief introductions, the Group Leader distributes secure materials. Secure materials are printed on colored paper.
• Table Leaders ensure that all participants at their tables write their names on each of their secure materials.
10:30 AM Target Student Discussion
Participants engage in structured discussions about the knowledge, skills, and abilities they expect to be demonstrated by students just entering each achievement/proficiency level.
12:00-1:00 PM Lunch for the 5 ELPA Groups 12:15-1:15 PM Lunch for Mathematics Grades 3, 5, 8, and CIM and Science Grades 5 and 8 12:30-1:30 PM Lunch for Reading Grades 3, 5, 8, and CIM and Science CIM After lunch Examine the Test Items
Participants examine the test items to see what students experience. • Although some discussion about individual test items is normal, Table
Leaders focus their participants away from prolonged debate and toward taking the test.
• Table Leaders encourage participants to use provided index cards to record comments about the test items.
33
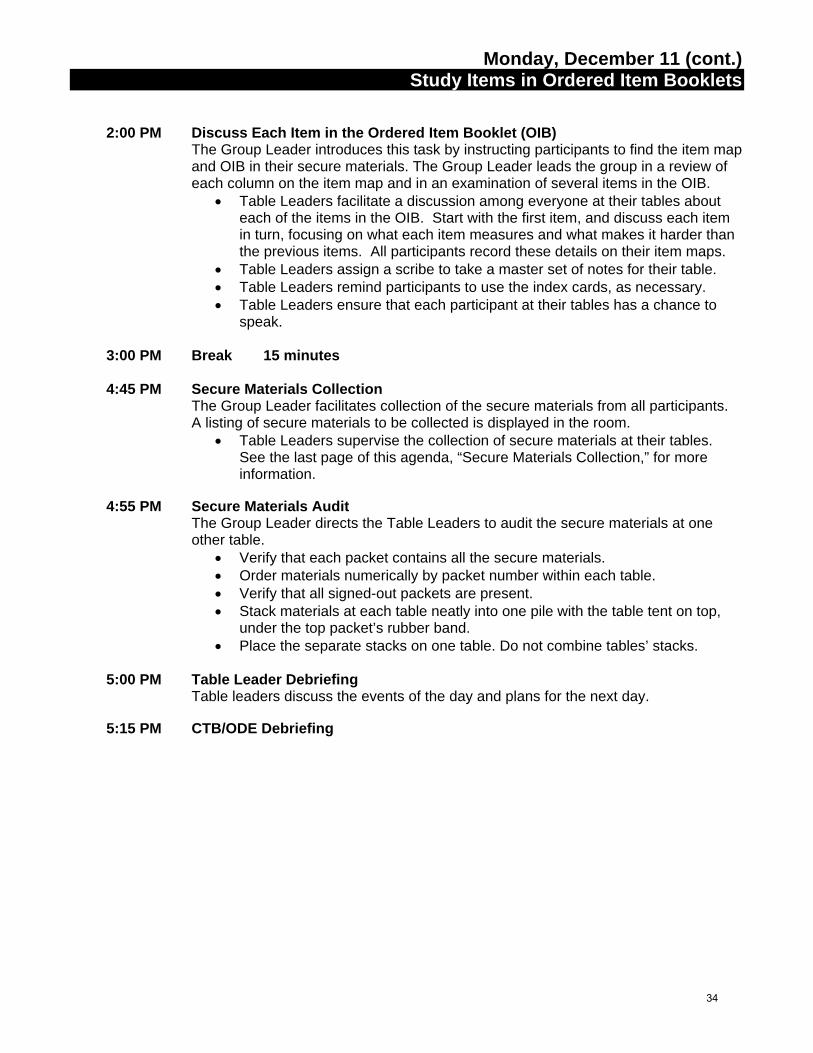
Monday, December 11 (cont.) Study Items in Ordered Item Booklets
2:00 PM Discuss Each Item in the Ordered Item Booklet (OIB)
The Group Leader introduces this task by instructing participants to find the item map and OIB in their secure materials. The Group Leader leads the group in a review of each column on the item map and in an examination of several items in the OIB.
• Table Leaders facilitate a discussion among everyone at their tables about each of the items in the OIB. Start with the first item, and discuss each item in turn, focusing on what each item measures and what makes it harder than the previous items. All participants record these details on their item maps.
• Table Leaders assign a scribe to take a master set of notes for their table. • Table Leaders remind participants to use the index cards, as necessary. • Table Leaders ensure that each participant at their tables has a chance to
speak. 3:00 PM Break 15 minutes 4:45 PM Secure Materials Collection
The Group Leader facilitates collection of the secure materials from all participants. A listing of secure materials to be collected is displayed in the room.
• Table Leaders supervise the collection of secure materials at their tables. See the last page of this agenda, “Secure Materials Collection,” for more information.
4:55 PM Secure Materials Audit
The Group Leader directs the Table Leaders to audit the secure materials at one other table.
• Verify that each packet contains all the secure materials. • Order materials numerically by packet number within each table. • Verify that all signed-out packets are present. • Stack materials at each table neatly into one pile with the table tent on top,
under the top packet’s rubber band. • Place the separate stacks on one table. Do not combine tables’ stacks.
5:00 PM Table Leader Debriefing Table leaders discuss the events of the day and plans for the next day.
5:15 PM CTB/ODE Debriefing
34
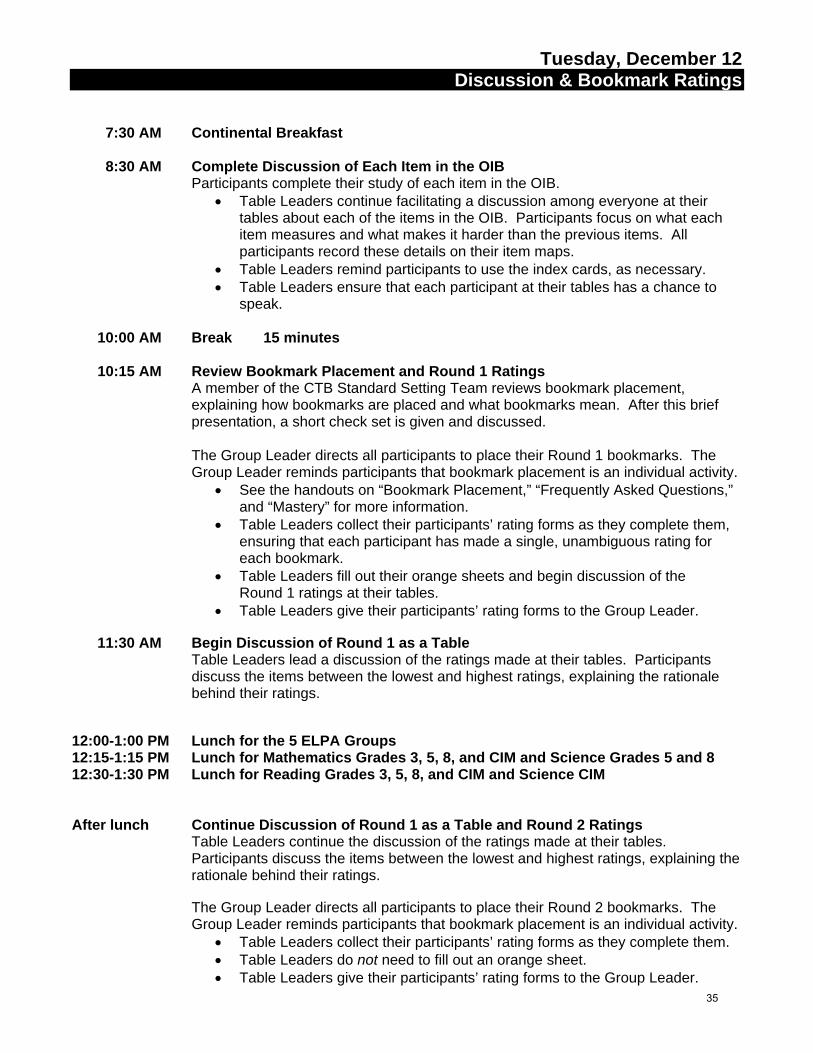
Tuesday, December 12 Discussion & Bookmark Ratings
7:30 AM Continental Breakfast 8:30 AM Complete Discussion of Each Item in the OIB
Participants complete their study of each item in the OIB. • Table Leaders continue facilitating a discussion among everyone at their
tables about each of the items in the OIB. Participants focus on what each item measures and what makes it harder than the previous items. All participants record these details on their item maps.
• Table Leaders remind participants to use the index cards, as necessary. • Table Leaders ensure that each participant at their tables has a chance to
speak. 10:00 AM Break 15 minutes 10:15 AM Review Bookmark Placement and Round 1 Ratings
A member of the CTB Standard Setting Team reviews bookmark placement, explaining how bookmarks are placed and what bookmarks mean. After this brief presentation, a short check set is given and discussed. The Group Leader directs all participants to place their Round 1 bookmarks. The Group Leader reminds participants that bookmark placement is an individual activity.
• See the handouts on “Bookmark Placement,” “Frequently Asked Questions,” and “Mastery” for more information.
• Table Leaders collect their participants’ rating forms as they complete them, ensuring that each participant has made a single, unambiguous rating for each bookmark.
• Table Leaders fill out their orange sheets and begin discussion of the Round 1 ratings at their tables.
• Table Leaders give their participants’ rating forms to the Group Leader. 11:30 AM Begin Discussion of Round 1 as a Table
Table Leaders lead a discussion of the ratings made at their tables. Participants discuss the items between the lowest and highest ratings, explaining the rationale behind their ratings.
12:00-1:00 PM Lunch for the 5 ELPA Groups 12:15-1:15 PM Lunch for Mathematics Grades 3, 5, 8, and CIM and Science Grades 5 and 8 12:30-1:30 PM Lunch for Reading Grades 3, 5, 8, and CIM and Science CIM
After lunch Continue Discussion of Round 1 as a Table and Round 2 Ratings Table Leaders continue the discussion of the ratings made at their tables. Participants discuss the items between the lowest and highest ratings, explaining the rationale behind their ratings.
The Group Leader directs all participants to place their Round 2 bookmarks. The Group Leader reminds participants that bookmark placement is an individual activity.
• Table Leaders collect their participants’ rating forms as they complete them. • Table Leaders do not need to fill out an orange sheet. • Table Leaders give their participants’ rating forms to the Group Leader.
35

Tuesday, December 12 (cont.) Discussion & Bookmark Ratings
2:00 PM Discussion of Round 2 as a Large Group
A member of the CTB Standard Setting Team presents a summary of the voting from each table to the entire group. Impact data are presented. Impact data are the percentages of students in each achievement/proficiency level based on the current median bookmarks. Then, the Group Leader leads a discussion with the entire group about each bookmark, similar to the table-level discussion after Round 1.
3:00 PM Break 15 minutes 3:30 PM Round 3 Ratings
The Group Leader directs all participants to place their Round 3 bookmarks. The Group Leader reminds participants that bookmark placement is an individual activity.
• Table Leaders collect their participants’ rating forms as they complete them. • Table Leaders do not need to fill out an orange sheet. • Table Leaders give their participants’ rating forms to the Group Leader.
4:45 PM Secure Materials Collection
The Group Leader facilitates collection of the secure materials from all participants. A listing of secure materials to be collected is displayed in the room.
• Table Leaders supervise the collection of secure materials at their tables. See the last page of this agenda, “Secure Materials Collection,” for more information.
4:55 PM Secure Materials Audit
The Group Leader directs the Table Leaders to audit the secure materials at one other table.
• Verify that each packet contains all the secure materials. • Order materials numerically by packet number within each table. • Verify that all signed-out packets are present. • Stack materials at each table neatly into one pile with the table tent on top,
under the top packet’s rubber band. • Place the separate stacks on one table. Do not combine tables’ stacks.
5:00 PM Table Leader Debriefing Table leaders discuss the events of the day and plans for the next day.
5:15 PM CTB/ODE Debriefing
36

Wednesday, December 13 Description Writing
7:30 AM Continental Breakfast
8:30 AM Presentation of Round 3 Recommendations
A member of the CTB Standard Setting Team presents the group with a summary of the Round 3 recommendations.
9:00 AM Evaluations Each participant completes an evaluation of the BSSP. 9:15 AM Descriptor Writing Activities CTB Group Leaders will introduce the descriptor writing activity. ELPA groups will write descriptors for their grade level. Participants in CIM groups
will only write descriptors for their CIM content area. Participants in Science will only write descriptors for their grade level.
For Reading/Literature and Mathematics, descriptors will be written for Grades 3, 5,
and 8 and for the off-grades, Grades 4, 6, and 7. Participants will be divided into two groups. For example, participants in Grade 3 Math will be divided into two groups, one for Grade 3 Math and the other for Grade 4 Math. In a similar manner, Grade 5 participants will be divided into Grades 5 and 6, and Grade 8 participants will be divided into Grades 7 and 8.
Description Writing Activities for Grades 4, 6, and 7 Participants for Grades 4, 6, and 7 will examine each item in the OIB. They will then
write the descriptors. 10:00 AM Break 15 minutes 12:00-1:00 PM Lunch for the 5 ELPA Groups 12:15-1:15 PM Lunch for Mathematics Grades 3, 5, 8, and CIM and Science Grades 5 and 8 12:30-1:30 PM Lunch for Reading Grades 3, 5, 8, and CIM and Science CIM After lunch Continue Descriptor Writing Activities After lunch Table Leader Smoothing for Academic Groups After lunch Table Leader Smoothing for ELPA Groups Presentation of Smoothed Recommendations
After the Table Leader Smoothing discussions, cut scores and associated impact data are shared with the group, including recommendations from Table Leaders during the cross-grade articulation discussion. All participants are invited to engage in this presentation.
37

Wednesday, December 13 (cont.) Description Writing
2:55 PM Secure Materials Collection
The Group Leader facilitates collection of the secure materials from all participants. A listing of secure materials to be collected is displayed in the room.
• Table Leaders supervise the collection of secure materials at their tables. See the last page of this agenda, “Secure Materials Collection,” for more information.
3:00 PM Secure Materials Audit
The Group Leader directs the Table Leaders to audit the secure materials at one other table.
• Verify that each packet contains all the secure materials. • Order materials numerically by packet number within each table. • Verify that all signed-out packets are present. • Stack materials at each table neatly into one pile with the table tent on top,
under the top packet’s rubber band. • Place the separate stacks on one table. Do not combine tables’ stacks.
3:00 PM Participant Dismissal 4:00 PM Table Leader Dismissal
38

Secure Materials Collection
Why do we do Secure Materials Collection?
A thorough collection of secure test materials protects both the reliability of the testing program and the substantial monetary investment in the assessment. A structured method of collection has been established to gather effectively all of the secure material at the workshop. Each day as you facilitate secure materials collection at your table, refer to this guide for instructions and suggestions. During the collection, participants should place each secure item, one at a time, in a pile on the table in front of them. After the process, each participant will have a single stack of materials, each stacked in the same way as everyone else in the room. Please follow these steps to facilitate the process.
How do I do Secure Materials Collection?
1. Get the attention of all the participants at your table. Discourage any side conversations or inattention.
2. Using the list provided, call out each item, one at a time, and watch participants place that item on their stack. Discourage participants from moving ahead. Ensure that each participant has placed the item in their stack before moving on.
3. Proceed through the list until each piece of secure material has been collected. Direct participants to place a rubber band around their stack when completed.
4. If any participants wish to leave additional items with their materials, encourage them to place it beneath their stack, inside the rubber band.
5. Table Leaders will audit the secure materials at one other table.
6. Once you have supervised the collection of secure materials and are satisfied that all items have been collected, inform the Group Leader.
7. The collected materials are stored overnight and will be available in the morning.
What should I expect from Secure Materials Collection?
Generally, secure materials collection goes smoothly. If you have any questions about the collection process, or if you have a concern about test security at the standard setting workshop, please contact your Group Leader or a member of the CTB Standard Setting Team.
CTB Standard Setting Handbook Copyright © 2005 by CTB/McGraw-Hill, LLC.
39

SECTION D
Training Materials
40

CTB Standard Setting Handbook Copyright © 2005 by CTB/McGraw-Hill LLC
Ordered Item
Booklet
Students who are Meets are expected to
demonstrate mastery of the set of items in front
of the bookmark
These items measure skills beyond the minimumthat students must be able to do to qualify as Meets
These items define the
minimum that students
should know and be able to do to qualify
as Meets
1
2
3
19
10
9
8
7
6
5 4
18
17
16
15
14
13
12
11
22
21
20
M
Some Meets
students may be able to do some
of these items
E
NM
41

CTB Standard Setting Handbook Copyright © 2005 by CTB/McGraw-Hill LLC
Bookmark Placement
These directions are written for placing the Meets bookmark and apply analogously to the Nearly Meets and Exceeds bookmarks. For whom am I placing this bookmark? The Target Student When you place your Meets bookmark, you are separating the highest ability Nearly Meets students from the lowest ability Meets students. In other words, you are keeping in mind the Target Student who will just make it into the Meets level. How do I place my bookmark? The Mechanics The bookmark is exactly that: a bookmark. It separates the content students are expected to master from the content they are not expected to master. In the example below, a participant has placed the Meets bookmark on page 7. With this bookmark placement, the participant says that a student must master the content represented by items 1 through 6 to be Meets. To place your bookmark, start at page 1 in the Ordered Item Booklet (OIB). Page through the OIB looking at the content covered until you find the first page where you think a student has demonstrated a sufficient body of evidence to indicate that the student is Meets relative to the content standards. This is the content you are saying a Meets Target Student needs to master to just make it into the Meets level. Hold the pages that contain the content you expect the student to master in your left hand. Place your bookmark on the page AFTER the last item you expect the student to master. This page number is your bookmark. Write it on your Rating Form.
Hint: It may be helpful to first identify the interval of items in which you are reasonably certain the bookmark should be placed; then you can place the bookmark within that interval. If you are uncertain about where to place your bookmark, make your best decision; you will have two more rounds of voting to reconsider your bookmark. What does my Meets Bookmark mean? Some Answers • You expect Meets students to master the knowledge, skills, and abilities contained in the items before your
bookmark. • Meets students should know and be able to do the items before the bookmark. For multiple-choice items,
Meets students should know the correct response. Is my bookmark the same as a raw score? NO It is very important to remember that your bookmark placement is not equal to a raw score. In the example above, the Meets bookmark was placed on page 7. The participant was not saying that a student must get six items correct to be classified as Meets. This participant is saying that a barely Meets student must master the content measured by the items on pages 1 through 6. The numbers in the OIB correspond to the rank order of difficulty of each item. The order of difficulty numbers do not correspond to raw scores.
Example of a bookmark placed on page 7.
5 6
7 8
9 10
1
2 3
4
42

CTB Standard Setting Handbook Copyright © 2005 by CTB/McGraw-Hill LLC
Frequently Asked Questions about Bookmark Placement
These questions are written in reference to the Meets bookmark and apply analogously to the Nearly Meets and Exceeds bookmarks. How do I know if I placed my bookmark in the “right” place?
The “right” place is a matter of judgment, your judgment. You are placing your bookmark based on the content you expect students to know and be able to do.
I set my bookmark based on the content I expect students to know and be able to do, that is, the content I expect students to master. What is the definition of mastery?
We look at mastery by considering the likelihood with which students will respond correctly to the items. This question is answered in more depth in the handout “Mastery.”
If a student misses some items before the Meets bookmark and gets some correct after the bookmark, is that student still Meets?
A student does not have to get every item before the bookmark correct to be Meets. Meets students can miss some items before the bookmark and correctly respond to some items after the bookmark.
Does the page number on which I place my bookmark correspond to the raw score a student must get on the test?
No. Remember, you are placing your bookmark based on the content you expect students to know and be able to do. You are not making your decision based on the number of items students must answer correctly. The bookmark is placed on a page in the Ordered Item Booklet. This page number corresponds to the difficulty ordering of the item, not to the raw score.
Should I place my bookmark in the first place in the Ordered Item Booklet where all the content standards have occurred?
Not necessarily. The test only samples the content domain. In some cases, some content standards will only be represented by difficult items that would be hard for most students to master.
How many bookmarks do I set?
You set one less bookmark than the number of achievement levels. In Oregon, you will set 3 bookmarks to separate students into 4 achievement levels.
Test Scale
Meets Students
Exceeds Cut
Score
Exceeds Students
Meets Cut
Score
Nearly Meets Students
Nearly Meets Cut
Score
Does Not Yet Meet Students
43

MA
STER
Y
CTB
Sta
ndar
d Se
tting
Han
dboo
k C
opyr
ight
© 2
005
by C
TB/M
cGra
w-H
ill L
LC
Page
1
H
ow P
artic
ipan
ts’ B
ookm
ark
Judg
men
ts R
elat
e to
E
xpec
ted
Stud
ent P
erfo
rman
ce w
ithin
Eac
h A
chie
vem
ent L
evel
Y
ou a
re p
artic
ipat
ing
in th
is st
anda
rd se
tting
bec
ause
of y
our e
xper
ienc
e w
ith st
uden
ts a
nd y
our k
now
ledg
e of
the
stat
e co
nten
t sta
ndar
ds,
curr
icul
um, a
nd c
urre
nt in
stru
ctio
nal p
ract
ices
. Y
ou w
ill b
e m
akin
g ju
dgm
ents
that
will
ope
ratio
naliz
e yo
ur e
xpec
tatio
ns fo
r the
leve
l of
achi
evem
ent s
tude
nts m
ust d
emon
stra
te in
ord
er to
pla
ce in
eac
h ac
hiev
emen
t lev
el.
To u
nder
stan
d ho
w y
our j
udgm
ents
rela
te to
ex
pect
ed st
uden
t ach
ieve
men
t with
in e
ach
achi
evem
ent l
evel
, con
side
r the
follo
win
g ex
ampl
es.
Con
side
r how
stud
ents
at v
ario
us sc
ale
loca
tions
mig
ht p
erfo
rm o
n an
imag
inar
y as
sess
men
t tha
t con
sist
s of a
tota
l of 5
0 sc
ore
poin
ts.
In
parti
cula
r, w
e w
ill c
onsi
der t
he p
erfo
rman
ce o
f gro
ups o
f stu
dent
s who
are
at t
hree
spec
ific
poin
ts o
n th
e te
st sc
ale.
Gro
up A
con
sist
s of
100
low
-ach
ievi
ng st
uden
ts, G
roup
B c
onsi
sts o
f 100
ave
rage
-ach
ievi
ng st
uden
ts, a
nd G
roup
C c
onsi
sts o
f 100
hig
h-ac
hiev
ing
stud
ents
. A
ssum
e th
at th
e st
uden
ts h
ave
all t
aken
the
asse
ssm
ent a
nd th
at th
e 10
0 st
uden
ts w
ithin
eac
h gr
oup
have
all
obta
ined
the
exac
t sam
e sc
ale
scor
e. N
ote
the
loca
tion
of th
e ob
tain
ed sc
ale
scor
e fo
r eac
h of
the
thre
e gr
oups
on
the
test
scal
e be
low
.
Tes
t Sca
le
G
roup
A
Gro
up B
G
roup
C
Low
-Ach
ievi
ng S
tude
nts
A
vera
ge-A
chie
ving
Stu
dent
s
H
igh-
Ach
ievi
ng S
tude
nts
The
follo
win
g th
ree
figur
es sh
ow h
ow st
uden
ts in
eac
h of
the
thre
e gr
oups
mig
ht p
erfo
rm o
n th
e as
sess
men
t.
44

CTB
Sta
ndar
d Se
tting
Han
dboo
k C
opyr
ight
© 2
005
by C
TB/M
cGra
w-H
ill L
LC
Figu
re A
show
s how
man
y st
uden
ts in
Gro
up A
resp
onde
d co
rrec
tly to
eac
h ite
m in
the
orde
red
item
boo
klet
. O
bser
ve th
at th
e st
uden
ts in
Gro
up A
pe
rfor
med
wel
l on
the
item
s tha
t app
ear e
arly
in th
e or
dere
d ite
m b
ookl
et b
ut p
erfo
rmed
poo
rly o
n th
e ite
ms t
hat a
ppea
r lat
er in
the
orde
red
item
bo
okle
t. T
his m
akes
sens
e, b
ecau
se th
e ite
ms a
ppea
r in
orde
r of d
iffic
ulty
, with
the
easi
est i
tem
firs
t and
the
hard
est i
tem
last
. Fo
r exa
mpl
e, 9
9 of
th
e 10
0 G
roup
A st
uden
ts re
spon
ded
corr
ectly
to it
em 1
, 67
of th
e G
roup
A st
uden
ts re
spon
ded
corr
ectly
to it
em 1
0, b
ut o
nly
1 of
the
Gro
up A
st
uden
ts re
spon
ded
corr
ectly
to it
em 5
0.
We
say
that
a g
roup
of l
ike
stud
ents
hav
e de
mon
stra
ted
mas
tery
of t
he c
onte
nt re
pres
ente
d by
an
item
if a
t lea
st 2
/3 o
f the
stud
ents
(abo
ut 6
7 ou
t of
100)
in th
e gr
oup
can
be e
xpec
ted
to re
spon
d su
cces
sful
ly to
the
item
. A
ccor
ding
to F
igur
e A
, Gro
up A
stud
ents
hav
e de
mon
stra
ted
mas
tery
of i
tem
s 1
thro
ugh
10, b
ut h
ave
not d
emon
stra
ted
mas
tery
of i
tem
s 11
thro
ugh
50.
Fi
gure
A.
The
num
ber
(or
perc
ent)
of G
roup
A st
uden
ts w
ho r
espo
nded
cor
rect
ly to
eac
h ite
m in
the
orde
red
item
boo
klet
. it
em
1 ite
m
2 ite
m
3 ite
m
4 ite
m
5 ite
m
6 ite
m
7 ite
m
8 ite
m
9 ite
m
10
99
95
93
87
83
82
78
74
69
67
100
100
100
100
100
100
100
100
100
100
item
11
ite
m
12
item
13
ite
m
14
item
15
ite
m
16
item
17
ite
m
18
item
19
ite
m
20
item
21
ite
m
22
item
23
ite
m
24
item
25
ite
m
26
item
27
ite
m
28
item
29
ite
m
30
63
60
59
58
57
53
52
50
50
49
49
48
47
43
41
39
37
35
34
31
100
100
100
100
100
100
100
100
100
100
100
100
100
100
100
100
100
100
100
100
item
31
ite
m
32
item
33
ite
m
34
item
35
ite
m
36
item
37
ite
m
38
item
39
ite
m
40
item
41
ite
m
42
item
43
ite
m
44
item
45
ite
m
46
item
47
ite
m
48
item
49
ite
m
50
30
29
25
22
20
18
17
14
11
10
9 7
5 5
4 3
2 2
1 1
100
100
100
100
100
100
100
100
100
100
100
100
100
100
100
100
100
100
100
100
45

CTB
Sta
ndar
d Se
tting
Han
dboo
k C
opyr
ight
© 2
005
by C
TB/M
cGra
w-H
ill L
LC
Def
initi
on o
f Mas
tery
W
e sa
y th
at a
gro
up o
f lik
e st
uden
ts h
ave
dem
onst
rate
d m
aste
ry o
f the
con
tent
repr
esen
ted
by a
n ite
m
if at
leas
t 2/3
(67/
100)
of t
he st
uden
ts in
the
grou
p ca
n be
exp
ecte
d to
resp
ond
succ
essf
ully
to th
e ite
m.
Fi
gure
B sh
ows h
ow m
any
stud
ents
in G
roup
B re
spon
ded
corr
ectly
to e
ach
item
in th
e or
dere
d ite
m b
ookl
et.
Obs
erve
that
the
stud
ents
in G
roup
B
perf
orm
ed m
uch
bette
r tha
n st
uden
ts in
Gro
up A
. Th
at m
akes
sens
e be
caus
e G
roup
B st
uden
ts a
re a
vera
ge-a
chie
ving
stud
ents
whi
le G
roup
A
stud
ents
are
low
-ach
ievi
ng st
uden
ts.
B
efor
e yo
u re
ad fu
rther
, use
Fig
ure
B a
nd th
e de
finiti
on o
f mas
tery
stat
ed in
the
box
abov
e to
det
erm
ine
whi
ch it
ems G
roup
B h
as m
aste
red.
G
roup
B st
uden
ts h
ave
dem
onst
rate
d m
aste
ry o
f the
con
tent
refle
cted
in it
ems 1
thro
ugh
30 o
f the
ord
ered
item
boo
klet
, but
hav
e no
t dem
onst
rate
d m
aste
ry o
f the
con
tent
refle
cted
by
item
s 31
thro
ugh
50.
This
is tr
ue a
ccor
ding
to th
e de
finiti
on, b
ecau
se a
t lea
st 6
7 of
the
100
Gro
up B
stud
ents
re
spon
ded
succ
essf
ully
to e
ach
of it
ems 1
thro
ugh
30, b
ut fe
wer
than
67
of th
em re
spon
ded
corr
ectly
to it
ems 3
1 th
roug
h 50
. Fi
gure
B.
The
num
ber
(or
perc
ent)
of G
roup
B st
uden
ts w
ho r
espo
nded
cor
rect
ly to
eac
h ite
m in
the
orde
red
item
boo
klet
.
item
1
item
2
item
3
item
4
item
5
item
6
item
7
item
8
item
9
item
10
99
99
99
99
99
98
98
98
97
97
10
0 10
0 10
0 10
0 10
0 10
0 10
010
010
010
0 ite
m
11
item
12
ite
m
13
item
14
ite
m
15
item
16
ite
m
17
item
18
ite
m
19
item
20
ite
m
21
item
22
ite
m
23
item
24
ite
m
25
item
26
ite
m
27
item
28
ite
m
29
item
30
96
96
95
93
89
85
84
83
83
81
79
79
78
73
72
72
71
70
69
67
10
0 10
0 10
0 10
0 10
0 10
0 10
010
010
010
010
010
010
0 10
010
010
010
010
010
010
0 ite
m
31
item
32
ite
m
33
item
34
ite
m
35
item
36
ite
m
37
item
38
ite
m
39
item
40
ite
m
41
item
42
ite
m
43
item
44
ite
m
45
item
46
ite
m
47
item
48
ite
m
49
item
50
65
63
63
61
58
57
57
55
55
54
53
53
52
51
44
41
39
37
35
33
10
0 10
0 10
0 10
0 10
0 10
0 10
010
010
010
010
010
010
0 10
010
010
010
010
010
010
0
46

CTB
Sta
ndar
d Se
tting
Han
dboo
k C
opyr
ight
© 2
005
by C
TB/M
cGra
w-H
ill L
LC
Def
initi
on o
f Mas
tery
W
e sa
y th
at a
gro
up o
f lik
e st
uden
ts h
ave
dem
onst
rate
d m
aste
ry o
f the
con
tent
repr
esen
ted
by a
n ite
m
if at
leas
t 2/3
(67/
100)
of t
he st
uden
ts in
the
grou
p ca
n be
exp
ecte
d to
resp
ond
succ
essf
ully
to th
e ite
m.
Fi
gure
C sh
ows h
ow m
any
stud
ents
in G
roup
C re
spon
ded
corr
ectly
to e
ach
item
in th
e or
dere
d ite
m b
ookl
et.
Obs
erve
that
Gro
up C
per
form
ed m
uch
bette
r tha
n G
roup
s A o
r B.
That
mak
es se
nse
beca
use
Gro
up C
con
sist
s of h
igh-
achi
evin
g st
uden
ts w
hile
Gro
ups A
and
B c
onsi
st o
f low
-and
av
erag
e-ac
hiev
ing
stud
ents
, res
pect
ivel
y.
Bef
ore
you
read
furth
er, u
se F
igur
e C
and
the
defin
ition
of m
aste
ry st
ated
in th
e bo
x ab
ove
to d
eter
min
e w
hich
item
s Gro
up C
has
mas
tere
d. G
roup
C
stud
ents
hav
e de
mon
stra
ted
mas
tery
of t
he c
onte
nt re
flect
ed in
item
s 1 th
roug
h 45
of t
he o
rder
ed it
em b
ookl
et, b
ut h
ave
not d
emon
stra
ted
mas
tery
of
the
cont
ent r
efle
cted
by
item
s 46
thro
ugh
50.
This
is tr
ue a
ccor
ding
to th
e de
finiti
on, b
ecau
se a
t lea
st 6
7 of
the
100
Gro
up C
stud
ents
resp
onde
d su
cces
sful
ly to
eac
h of
item
s 1 th
roug
h 45
, but
few
er th
an 6
7 of
them
resp
onde
d co
rrec
tly to
item
s 46
thro
ugh
50.
Figu
re C
. T
he n
umbe
r (o
r pe
rcen
t) o
f Gro
up C
stud
ents
who
res
pond
ed c
orre
ctly
to e
ach
item
in th
e or
dere
d ite
m b
ookl
et.
item
1
item
2
item
3
item
4
item
5
item
6
item
7
item
8
item
9
item
10
99
99
99
99
99
99
99
99
97
97
10
0 10
0 10
0 10
0 10
0 10
0 10
010
010
010
0 ite
m
11
item
12
ite
m
13
item
14
ite
m
15
item
16
ite
m
17
item
18
ite
m
19
item
20
ite
m
21
item
22
ite
m
23
item
24
ite
m
25
item
26
ite
m
27
item
28
ite
m
29
item
30
97
97
95
95
94
93
92
92
91
89
89
89
88
88
88
87
87
86
85
84
10
0 10
0 10
0 10
0 10
0 10
0 10
010
010
010
010
010
010
0 10
010
010
010
010
010
010
0 ite
m
31
item
32
ite
m
33
item
34
ite
m
35
item
36
ite
m
37
item
38
ite
m
39
item
40
ite
m
41
item
42
ite
m
43
item
44
ite
m
45
item
46
ite
m
47
item
48
ite
m
49
item
50
83
81
81
81
80
80
79
78
77
75
74
72
70
68
67
64
58
53
49
46
10
0 10
0 10
0 10
0 10
0 10
0 10
010
010
010
010
010
010
0 10
010
010
010
010
010
010
0
47
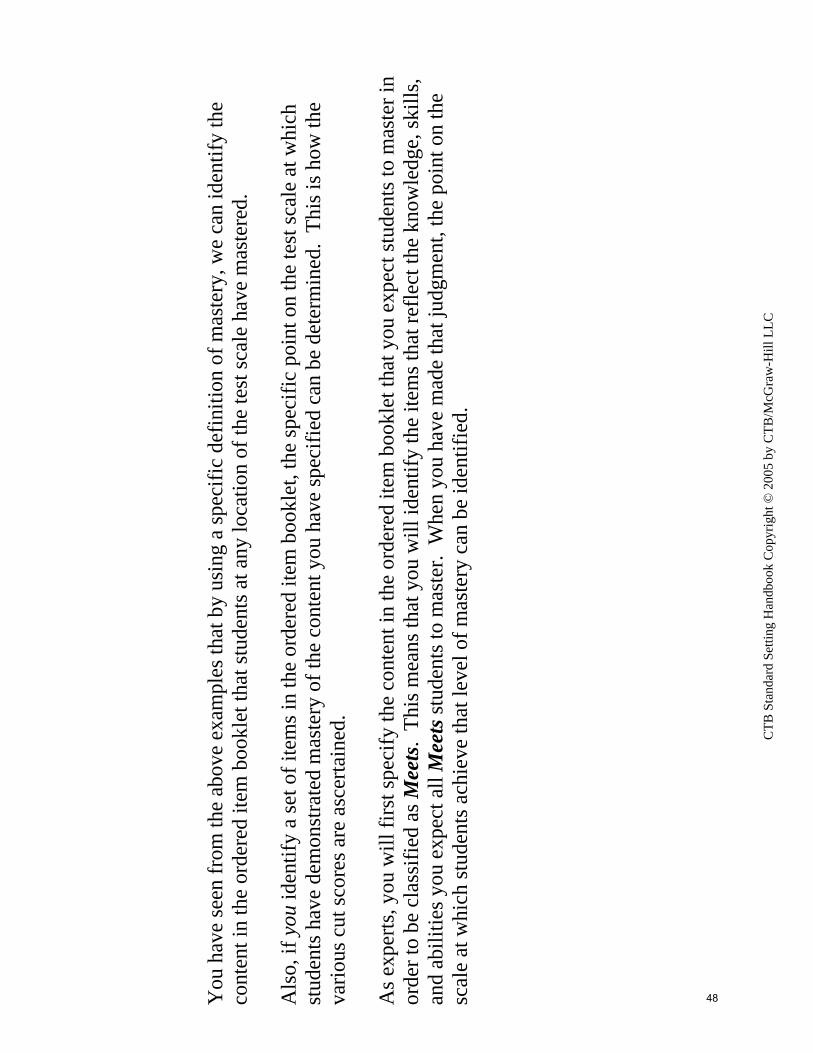
CTB
Sta
ndar
d Se
tting
Han
dboo
k C
opyr
ight
© 2
005
by C
TB/M
cGra
w-H
ill L
LC
You
hav
e se
en fr
om th
e ab
ove
exam
ples
that
by
usin
g a
spec
ific
defin
ition
of m
aste
ry, w
e ca
n id
entif
y th
e co
nten
t in
the
orde
red
item
boo
klet
that
stud
ents
at a
ny lo
catio
n of
the
test
scal
e ha
ve m
aste
red.
A
lso,
if y
ou id
entif
y a
set o
f ite
ms i
n th
e or
dere
d ite
m b
ookl
et, t
he sp
ecifi
c po
int o
n th
e te
st sc
ale
at w
hich
st
uden
ts h
ave
dem
onst
rate
d m
aste
ry o
f the
con
tent
you
hav
e sp
ecifi
ed c
an b
e de
term
ined
. Th
is is
how
the
vario
us c
ut sc
ores
are
asc
erta
ined
.
As e
xper
ts, y
ou w
ill fi
rst s
peci
fy th
e co
nten
t in
the
orde
red
item
boo
klet
that
you
exp
ect s
tude
nts t
o m
aste
r in
orde
r to
be c
lass
ified
as M
eets
. Th
is m
eans
that
you
will
iden
tify
the
item
s tha
t ref
lect
the
know
ledg
e, sk
ills,
and
abili
ties y
ou e
xpec
t all
Mee
ts st
uden
ts to
mas
ter.
Whe
n yo
u ha
ve m
ade
that
judg
men
t, th
e po
int o
n th
e sc
ale
at w
hich
stud
ents
ach
ieve
that
leve
l of m
aste
ry c
an b
e id
entif
ied.
48

Content Area: Reading Mathematics Science Grade:
3 5 8 HS Oregon Academic Suppose the bookmarks were placed in this sample ordered item booklet as follows:
Nearly Meets Bookmark on Page #
Meets Bookmark on Page #
Exceeds Bookmark on Page #
Round 1 7 11 14
1. Which items does a student need to master to just make it into the Meets achievement level? 1 to 6
1 to 7
1 to 10
1 to 11
2. If a student mastered only items 1 through 5, in which achievement level would this student be?
Does Not Yet Meet
Nearly Meets
Meets
Exceeds
3. Suppose a student mastered items 1 through 13. Which achievement level is this student in?
Does Not Yet Meet
Nearly Meets
Meets
Exceeds
4. For students who are classified as Meets, with at least what likelihood will they be able to answer item 10?
1/3
1/2
2/3
3/4
5. Will the items BEFORE the Meets bookmark be more or less difficult to answer than the items AFTER the bookmark or about the same?
More
difficult to answer
About the
same
Less
difficult to answer
8
Ordered
Item Booklet
1
2
3
10
9
76
54
17
16
15 14
13 12
11
NM8
M
E
49

SA
MPL
E M
athe
mat
ics
Item
Map
Ord
er o
f di
fficu
lty
(eas
y to
ha
rd)
Item
Typ
eSc
ore
Key
Stan
dard
*
Wha
t doe
s th
is it
em m
easu
re?
That
is, w
hat d
o yo
u kn
ow a
bout
a s
tude
nt
who
can
resp
ond
succ
essf
ully
to th
is
item
?W
hy is
this
item
mor
e di
fficu
lt th
an th
e pr
eced
ing
item
s?
1
M
CB
1N
/A
2
M
CC
4
3
M
CB
5
4
M
CD
1
5
M
CB
4
6
M
CA
1
7
M
CB
2
8
M
CB
2
9
M
CC
4
* 1
= N
umbe
r Sen
se, P
rope
rties
, & O
pera
tions
; 2
= M
easu
rem
ent;
3 =
Geo
met
ry; 4
= D
ata
Ana
lysi
s, S
tatis
tics,
& P
roba
bilit
y; 5
= A
lgeb
ra &
Fun
ctio
ns
Prin
t Nam
e:__
____
____
____
____
____
____
____
____
____
____
____
__ T
able
Num
ber:
____
__
The
Boo
kmar
k S
tand
ard
Set
ting
Pro
cedu
re ©
Cop
yrig
ht 1
999
by C
TB/M
cGra
w-H
ill.
50

SAMPLE ORDERED ITEM BOOKLET
51

This part has 9 questions. Mark your answers in your booklet. You willhave to fill in an oval or write your answer as directed. In those questionswhere you must write an answer, it is important that your answer be clearand complete and that you show all of your work since partial credit maybe awarded. The last question may require 5 minutes or more to thinkabout and answer. After each question, fill in the oval to indicate whetheryou
1.
used the calculator.
Kitty is taking a trip on which she plans to drive 300 miles each day. Hertrip is 1,723 miles long. She has already driven 849 miles. How muchfarther must she drive?
574 miles
874 miles
1,423 miles
2,872 miles
Did you use the calculator on this question?
O Yes O N o
2. A whole number is multiplied by 5. Which of these could be the result?
652
562
526
265
APOO0533
AP000517
Did you use the calculator on this question?
Yes No
S1 M12 52

S1M9
3. N stands for the number of stamps John had. He gave 12 stamps to his sister.Which expression tells how many stamps John has now?
N+12
N–12
12- N
12 x N Q000706
CARTONS OF EGGS SOLD LAST MONTH
Each = 100 cartons
4. According to the graph, how manyfarms A, B, and C last month?
13
130
1,300
1 3 , 0 0 0
cartons of eggs were sold altogether by
QOO0701
53

S1M9
3. N stands for the number of stamps John had. He gave 12 stamps to his sister.Which expression tells how many stamps John has now?
N+12
N–12
12- N
12 x N Q000706
CARTONS OF EGGS SOLD LAST MONTH
Each = 100 cartons
4. According to the graph, how manyfarms A, B, and C last month?
13
130
1,300
1 3 , 0 0 0
cartons of eggs were sold altogether by
QOO0701
54

This part has 9 questions. Mark your answers in your booklet. You willhave to fill in an oval or write your answer as directed. In those questionswhere you must write an answer, it is important that your answer be clearand complete and that you show all of your work since partial credit maybe awarded. The last question may require 5 minutes or more to thinkabout and answer. After each question, fill in the oval to indicate whetheryou
1.
used the calculator.
Kitty is taking a trip on which she plans to drive 300 miles each day. Hertrip is 1,723 miles long. She has already driven 849 miles. How muchfarther must she drive?
574 miles
874 miles
1,423 miles
2,872 miles
Did you use the calculator on this question?
O Yes O N o
2. A whole number is multiplied by 5. Which of these could be the result?
652
562
526
265
APOO0533
AP000517
Did you use the calculator on this question?
Yes No
S1 M12 55

4. Each boy and girl in the class voted for his or her favorite kind of music.Here are the results.
Boys
Girls
Classical
GirlsBoys
Girls
Boys
Rock Country
Which kind of music did most students in the class prefer?
Classical
Rock
Country
Other
Did you use the calculator on this question?
Yes No
Boys
Girls
Other
AP000554
S1M1256

5. The picture shows the flowerpots in which Kevin will plant flower seeds.He needs 3 seeds for each pot. Which of the following number sentencesshows how many seeds Kevin will need for all of the pots?
5 x 4 x 3 =
(5 x 4) + 3 =
( 5 + 4 ) x 3 =
5 + 4 + 3 = MOO0502
S1M9
1557
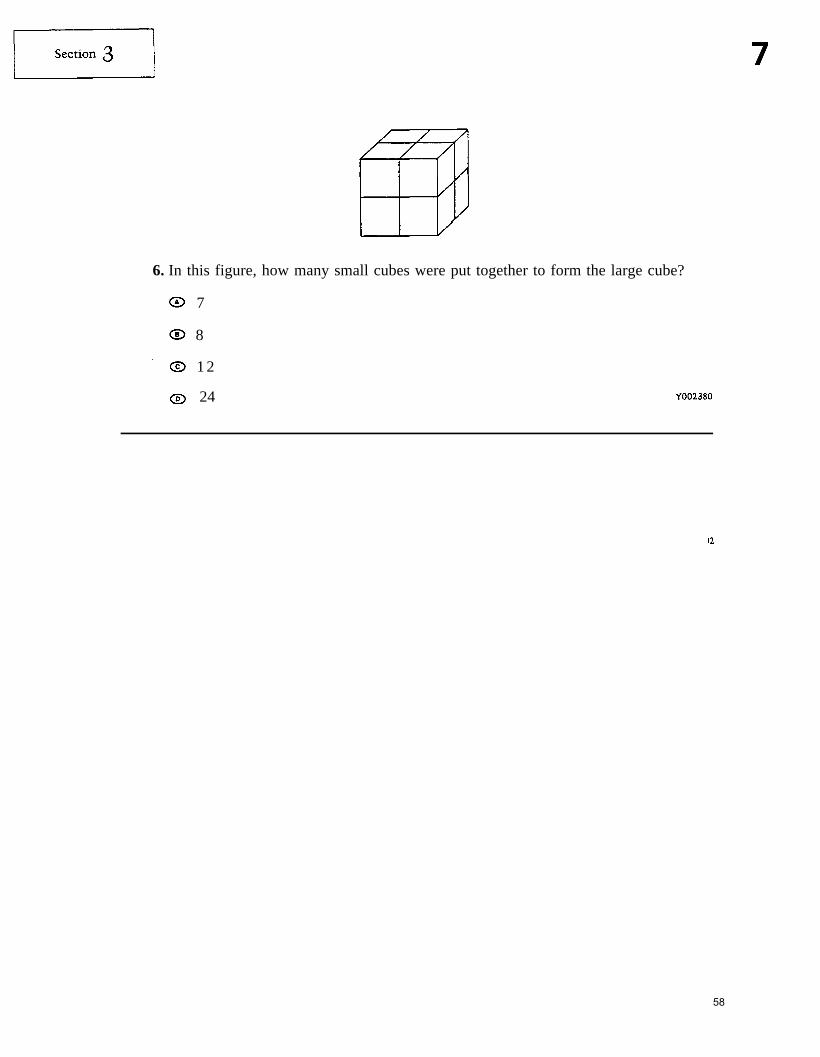
6. In this figure, how many small cubes were put together to form the large cube?
7
8
1 2
24
7. Ms. Hernandez formed teams of 8 students each from the 34 students inher class. She formed as many teams as possible, and the students left overwere substitutes. How many students were substitutes?
Answer:
S1M9
58

8. If both the square and the triangle above have the same perimeter, what isthe length of each side of the square?
QOO0705
9. There are 3 fifth graders and 2 sixth graders on the swim team. Everyone’sname is put in a hat and the captain iS chosen by picking one name. Whatare the chances that the captain will be a fifth grader?
l out of 5
l out of 3
3 out of 5
2 out of 3 QOO0709
S1M917
59

8. If both the square and the triangle above have the same perimeter, what isthe length of each side of the square?
QOO0705
9. There are 3 fifth graders and 2 sixth graders on the swim team. Everyone’sname is put in a hat and the captain iS chosen by picking one name. Whatare the chances that the captain will be a fifth grader?
l out of 5
l out of 3
3 out of 5
2 out of 3 QOO0709
S1M917
60

SECTION E
Training Overheads
61
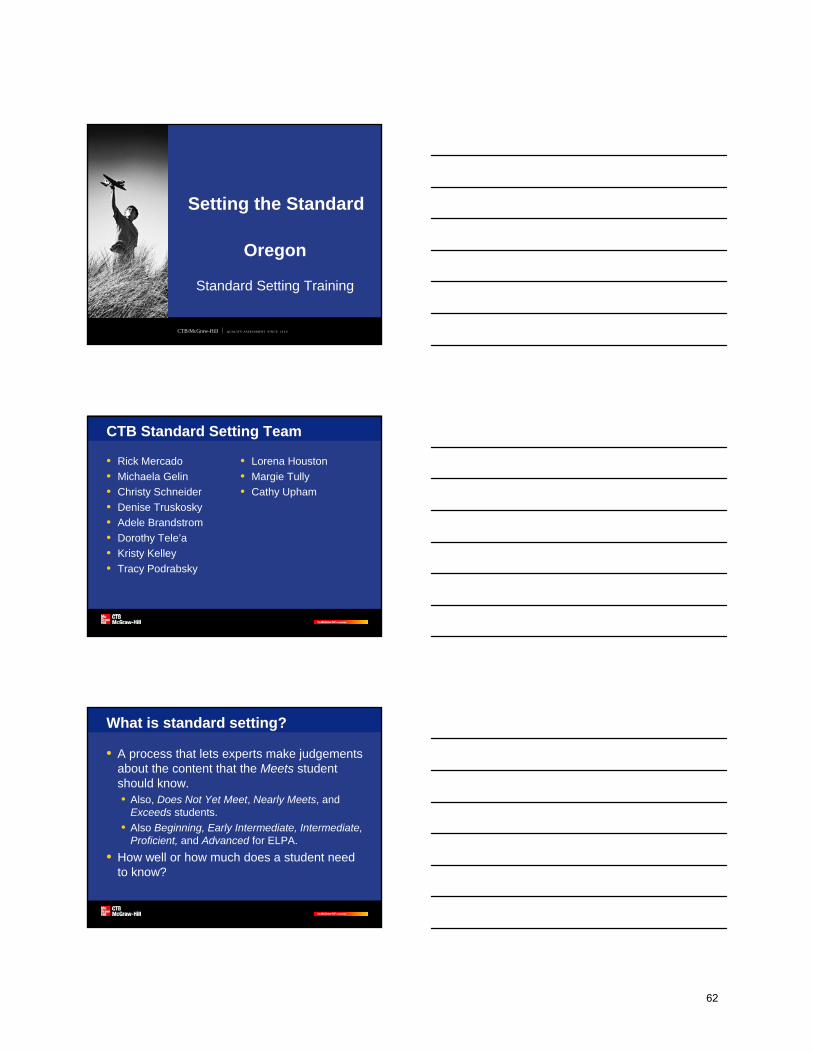
Q UA L I TY AS S E S S M E N T S I N C E 1 9 2 6 CTB/McGraw-Hill
Setting the StandardSetting the Standard
Oregon
Standard Setting Training
CTB Standard Setting TeamCTB Standard Setting Team
• Rick Mercado• Michaela Gelin• Christy Schneider• Denise Truskosky• Adele Brandstrom• Dorothy Tele’a• Kristy Kelley• Tracy Podrabsky
• Lorena Houston• Margie Tully• Cathy Upham
What is standard setting?What is standard setting?
• A process that lets experts make judgements about the content that the Meets student should know.• Also, Does Not Yet Meet, Nearly Meets, and
Exceeds students.• Also Beginning, Early Intermediate, Intermediate,
Proficient, and Advanced for ELPA.• How well or how much does a student need
to know?
62
Scale scoresScale scores
• Do not tell us if a student’s performance was “good enough”
• Do not describe a student’s strengths and weaknesses
Standard settingStandard setting
• In relation to the standards, how much does a student need to know to be classified in a given achievement level for the Oregon Statewide Assessments?
• How much does a student need to know to be classified in a given proficiency level for the English Language Proficiency Assessment?
Why standard setting?Why standard setting?
• Content standards define what students are tested on.• These are things students should be able to do.• Oregon has content standards in
Reading/Literature, Mathematics, and Science.• Oregon has ELP standards designed to
supplement the ELA standards.
63

Why standard setting?Why standard setting?
• Achievement standards define what students should be able to do in each achievement level.• You will actively discuss your expectations of the
target student in each achievement level for the Oregon Statewide Assessments or in each proficiency level for ELPA.
Achievement levelsAchievement levels
• Specify the knowledge, skills, and abilities a student needs to know in order to be classified as Does Not Yet Meet, Nearly Meets, Meets, and Exceeds in relation to the content standards.• For ELPA, Beginning, Early Intermediate,
Intermediate, Proficient, and Advanced.
How do we set our standards?How do we set our standards?
• Percentages• Arbitrary • Test-specific• Do not consider content
• Content• Uses pre-established content standards• Considers educational objectives
• Bookmark Standard Setting Procedure
64

Purpose of the Standard SettingPurpose of the Standard Setting
• Allows cut scores to be set on the test scale• The test scale represents the ability of
students
150 300MeetsCut Score
ExceedsCut Score
Does Not Yet Meet
Students
MeetsStudents
Nearly Meets
Students
ExceedsStudents
Nearly MeetsCut Score
Purpose of the Standard SettingPurpose of the Standard Setting
• You will set three cut scores on the test scale (four cut scores for ELPA).
• Decisions will be based on Oregon content standards.
• One cut score for• Nearly Meets• Meets• Exceeds
• One cut score for• Early Intermediate• Intermediate• Proficient• Advanced
Use of the Bookmark ProcedureUse of the Bookmark Procedure
65
Bookmark Standard Setting Bookmark Standard Setting
• Item-centered method• Content-based decisions
Committee RolesCommittee Roles
• Group Leaders• Table Leaders• Participants• ODE• CTB
Standard Setting Committee
Committee RolesCommittee Roles
• Group Leader• Grade level Facilitator
• Participants stay focused on task
• Participants interact with their own group
• Participants finish in a timely manner
• Facilitates discussion• Materials collection
• Secure materials
Standard Setting Committee
66

Committee RolesCommittee Roles
• Table Leaders• Lead discussion at the
table• Standard setters
• Participants• Standard setters
Standard Setting Committee
Workshop OverviewWorkshop Overview
• Round 1• Study test items• Make ratings without discussion
• Round 2• Discuss ratings in a small group
• Round 3• Discuss ratings in a large group
• Description Writing• Cross-Grade Discussions with Table
Leaders
Ordered Item BookletsOrdered Item Booklets
• One item per page• Easiest item first, hardest item last• Items ascend by difficulty
67

Item Map
Ordered Item 1Ordered Item 1
11. Kitty is taking a trip on which she plans to drive 300
miles each day. Her trip is 1,723 miles long. She has already driven 849 miles. How much farther must she drive?A. 574 milesB. 874 milesC. 1,423 milesD. 2,872 miles
Item MapEliminate extra info, perform subtraction
68

Ordered Item 2Ordered Item 2
2CARTONS OF EGGS SOLD LAST MONTH
Farm A Farm B Farm C
Each = 100 Cartons
4. According to the graph how many cartons of eggs were sold altogether by farms A, B, and C last month? A. 13B. 130C. 1,300D. 13,000
Mock Standard SettingMock Standard Setting
• 2 achievement levels• Meets• Nearly Meets
• 9-item test• Grade 4 Mathematics
Target StudentTarget Student
• We want to describe the skills held in common by all these students• These are the skills of the Just Meets student
Meets Cut Score
ExceedsCut Score
Just MeetsStudent
Mid-level Meets Student High-achieving MeetsStudent
69

Bookmark PlacementBookmark Placement
• Items preceding the Bookmark reflect content that all Meets students should have mastery of• for MC items this means that the Meets students
should most likely know the correct responses
Bookmark PlacementBookmark Placement
• Place the bookmark at the first point…• …where you feel that a student who has
mastery of the content in the items before the bookmark…
• …has demonstrated sufficient skills…• …to infer that the student should be
classified as Meets.
Some students who areMeets may be able to
do some of these items
Students who are Meets are expected to demonstrate
mastery of the set of items in front of the bookmark
These are items that are measuring skills beyondwhat students must be able to do to qualify as
Meets
These are items that define what the
student should know and be able to do to
qualify as Meets
OrderedItem
Booklet
12
3
19
109
8
76
54
1817
1615
1413
12
11
2221
20
M
70

OrderedItem
Booklet
12
3
19
109
8
76
54
1817
1615
1413
12
11
2221
20
M
OrderedItem
Booklet
12
3
19
109
8
76
54
1817
1615
1413
1211
2221
20M
These are items that define the additional content that a student should know and be able to do to qualify as
Exceeds
These are items that define what the
student should know and be able to do to
qualify as Meets
OrderedItem
Booklet
12
3
19
109
8
76
54
1817
1615
1413
12
11
2221
20
M
E
These are items that are measuring skills beyondwhat students must be able to do to qualify as
Exceeds
71

Students ordered by ability.
Test ScaleTest Scale
Items ordered by difficulty.
1
150
2
155
4
185
5
190
6
200
7
220
9
260
10
280
3
165
8
240
11
300
152 158 168 186 198 230 270
MeetsNearly Meets
The Bookmark & the Cut ScoreThe Bookmark & the Cut Score
The cut score separates students.
The bookmark separates items.
Cut Score
152 158 168 186 198 230 270
1
150
2
155
4
185
5
190
6
200
7
220
9
260
10
280
3
165
8
240
11
300
Rating FormRating Form
72

Rating Form for ELPARating Form for ELPA
Sample ResultsSample Results
Bookmark Bookmark BookmarkNearly Meets Meets Exceeds
Table 1
Table 2
Table 3
15
11
14
13
34
37
34
34
86
82
81
82Median
Does Not Yet Meet
0%
Impact Data: estimated percent of students in each achievement level based on the current large group median
Nearly Meets Meets Exceeds
0% 0% 0%
Target Student DiscussionTarget Student Discussion
• The student who has just made it into an achievement level or proficiency level• Just Nearly Meets, Just Meets, and Just Exceeds
students• Refer to Oregon content standards
Just Meets Student
Meets Cut Score
Mid-level MeetsStudent
High-achieving Meets Student
ExceedsCut Score
73

Agenda: Day 1Agenda: Day 1
• Opening Session• Examine the test items
• Individual Activity• Discuss the Target Student
• Group Activity• Study the Ordered Item Booklet
• Table Activity
Agenda: Day 2Agenda: Day 2
• Finish Round 1 bookmark placements• Individual Activity
• Round 2 • Review Round 1 results in tables• Discuss in tables• Make new judgments individually
• Round 3• Review Round 2 results as a large group• Discuss as a large group• Make new judgments individually
Agenda: Day 3Agenda: Day 3
• Review final recommendations• Evaluate the BSSP• Description writing• Cross-grade discussions (Table Leaders)
74

ArticulationArticulation
• Achievement standards are called well-articulated when the impact data associated with the cut scores form a cogent, reasonable pattern.
• After Round 3, Table Leaders will come together to discuss the achievement (proficiency) standards across grades.
Articulation and DisarticulationArticulation and Disarticulation
Percent of Students Meets or Higher
010203040506070
3 4 5 6 7 8 CIM
Grade
Perc
ent
Questions?Questions?
• Thank you for your participation!
75

SECTION F
Detailed Bookmark Judgments
76

Oregon Standard Setting Grade 3 MathematicsRound 1 Bookmark Placements
Table Participant Nearly Meets Meets Exceeds
1 2 9 14 35
1 3 12 29 64
1 4 9 14 47
1 5 9 14 55
1 6 5 16 40
1 9 8 14 47
2 7 9 18 44
2 8 12 27 43
2 10 10 15 46
2 18 10 20 46
2 19 12 18 44
2 20 6 12 44
3 11 9 19 55
3 12 12 21 52
3 13 14 21 51
3 14 9 15 49
3 15 12 19 54
3 16 11 15 48
3 17 9 19 55
Overall Median 9 18 47
Minimum 5 12 35
Maximum 14 29 64
SD 2.22 4.46 6.58
77

Oregon Standard Setting Grade 3 MathematicsRound 1 Cut Scores
Table Participant Nearly Meets Meets Exceeds
1 2 200 203 211
1 3 202 209 224
1 4 200 203 215
1 5 200 203 218
1 6 193 205 213
1 9 198 203 215
2 7 200 205 214
2 8 202 207 213
2 10 201 204 215
2 18 201 205 215
2 19 202 205 214
2 20 196 202 214
3 11 200 205 218
3 12 202 206 218
3 13 203 206 217
3 14 200 204 215
3 15 202 205 218
3 16 201 204 215
3 17 200 205 218
Overall Median 200 205 215
Minimum 193 202 211
Maximum 203 209 224
SD 2.36 1.63 2.84
E2
78

Oregon Standard Setting Grade 3 MathematicsRound 1 Summary of Bookmark Placements
Statistic Table Nearly Meets Meets Exceeds
Median 1 9 14 47
Median 2 10 18 44
Median 3 11 19 52
Median Overall 9 18 47
Minimum 1 5 14 35
Minimum 2 6 12 43
Minimum 3 9 15 48
Minimum Overall 5 12 35
Maximum 1 12 29 64
Maximum 2 12 27 46
Maximum 3 14 21 55
Maximum Overall 14 29 64
SD 1 2.25 6.01 10.39
SD 2 2.23 5.09 1.22
SD 3 1.95 2.51 2.83
SD Overall 2.22 4.46 6.58
Overall Median 9 18 47
Minimum 5 12 35
Maximum 14 29 64
SD 2.22 4.46 6.58
E3
79

Oregon Standard Setting Grade 3 MathematicsRound 1 Summary of Cut Scores
Statistic Table Nearly Meets Meets Exceeds
Median 1 200 203 215
Median 2 201 205 214
Median 3 201 205 218
Median Overall 200 205 215
Minimum 1 193 203 211
Minimum 2 196 202 213
Minimum 3 200 204 215
Minimum Overall 193 202 211
Maximum 1 202 209 224
Maximum 2 202 207 215
Maximum 3 203 206 218
Maximum Overall 203 209 224
SD 1 3.13 2.42 4.56
SD 2 2.25 1.63 0.75
SD 3 1.21 0.82 1.41
SD Overall 2.36 1.63 2.84
Overall Median 200 205 215
Minimum 193 202 211
Maximum 203 209 224
SD 2.36 1.63 2.84
E4
80

Oregon Standard Setting Grade 3 MathematicsRound 1 Median Bookmark Summary
Table Nearly Meets Meets Exceeds1 9 14 472 10 18 443 11 19 52
Overall 9 18 47
Impact Data
Does NotYet Meet
NearlyMeets
Meets Exceeds
Overall 10.2 13.1 41.5 35.2
E5
81

Oregon Standard Setting Grade 3 MathematicsRound 2 Bookmark Placements
Table Participant Nearly Meets Meets Exceeds
1 2 10 14 44
1 3 12 29 59
1 4 10 15 47
1 5 9 12 48
1 6 10 16 40
1 9 9 14 47
2 7 9 15 44
2 8 9 19 43
2 10 10 15 46
2 18 10 20 46
2 19 10 18 46
2 20 10 15 44
3 11 9 20 52
3 12 12 20 55
3 13 12 21 51
3 14 9 20 53
3 15 11 20 51
3 16 9 15 48
3 17 9 19 51
Overall Median 10 18 47
Minimum 9 12 40
Maximum 12 29 59
SD 1.08 3.86 4.65
E6
82

Oregon Standard Setting Grade 3 MathematicsRound 2 Cut Scores
Table Participant Nearly Meets Meets Exceeds
1 2 201 203 214
1 3 202 209 219
1 4 201 204 215
1 5 200 202 215
1 6 201 205 213
1 9 200 203 215
2 7 200 204 214
2 8 200 205 213
2 10 201 204 215
2 18 201 205 215
2 19 201 205 215
2 20 201 204 214
3 11 200 205 218
3 12 202 205 218
3 13 202 206 217
3 14 200 205 218
3 15 201 205 217
3 16 200 204 215
3 17 200 205 217
Overall Median 201 205 215
Minimum 200 202 213
Maximum 202 209 219
SD 0.73 1.42 1.80
E7
83

Oregon Standard Setting Grade 3 MathematicsRound 2 Summary of Bookmark Placements
Statistic Table Nearly Meets Meets Exceeds
Median 1 10 14.5 47
Median 2 10 16.5 45
Median 3 9 20 51
Median Overall 10 18 47
Minimum 1 9 12 40
Minimum 2 9 15 43
Minimum 3 9 15 48
Minimum Overall 9 12 40
Maximum 1 12 29 59
Maximum 2 10 20 46
Maximum 3 12 21 55
Maximum Overall 12 29 59
SD 1 1.10 6.19 6.35
SD 2 0.52 2.28 1.33
SD 3 1.46 1.98 2.15
SD Overall 1.08 3.86 4.65
Overall Median 10 18 47
Minimum 9 12 40
Maximum 12 29 59
SD 1.08 3.86 4.65
E8
84

Oregon Standard Setting Grade 3 MathematicsRound 2 Summary of Cut Scores
Statistic Table Nearly Meets Meets Exceeds
Median 1 201 204 215
Median 2 201 205 215
Median 3 200 205 217
Median Overall 201 205 215
Minimum 1 200 202 213
Minimum 2 200 204 213
Minimum 3 200 204 215
Minimum Overall 200 202 213
Maximum 1 202 209 219
Maximum 2 201 205 215
Maximum 3 202 206 218
Maximum Overall 202 209 219
SD 1 0.75 2.50 2.04
SD 2 0.52 0.55 0.82
SD 3 0.95 0.58 1.07
SD Overall 0.73 1.42 1.80
Overall Median 201 205 215
Minimum 200 202 213
Maximum 202 209 219
SD 0.73 1.42 1.80
E9
85

Oregon Standard Setting Grade 3 MathematicsRound 2 Median Bookmark Summary
Table Nearly Meets Meets Exceeds1 10 14.5 472 10 16.5 453 9 20 51
Overall 10 18 47
Impact Data
Does NotYet Meet
NearlyMeets
Meets Exceeds
Overall 11.4 11.8 41.5 35.3
E10
86

Oregon Standard Setting Grade 3 MathematicsRound 3 Bookmark Placements
Table Participant Nearly Meets Meets Exceeds
1 2 10 14 46
1 3 10 14 48
1 4 10 14 51
1 5 9 12 46
1 6 10 14 47
1 9 9 14 47
2 7 9 15 45
2 8 9 19 47
2 10 10 15 49
2 18 9 15 44
2 19 10 18 46
2 20 10 15 44
3 11 10 19 52
3 12 12 20 55
3 13 10 20 50
3 14 10 20 53
3 15 10 20 54
3 16 10 15 48
3 17 10 20 50
Overall Median 10 15 48
Minimum 9 12 44
Maximum 12 20 55
SD 0.69 2.78 3.29
E11
87

Oregon Standard Setting Grade 3 MathematicsRound 3 Cut Scores
Table Participant Nearly Meets Meets Exceeds
1 2 201 203 215
1 3 201 203 215
1 4 201 203 217
1 5 200 202 215
1 6 201 203 215
1 9 200 203 215
2 7 200 204 214
2 8 200 205 215
2 10 201 204 215
2 18 200 204 214
2 19 201 205 215
2 20 201 204 214
3 11 201 205 218
3 12 202 205 218
3 13 201 205 216
3 14 201 205 218
3 15 201 205 218
3 16 201 204 215
3 17 201 205 216
Overall Median 201 204 215
Minimum 200 202 214
Maximum 202 205 218
SD 0.54 0.97 1.42
E12
88

Oregon Standard Setting Grade 3 MathematicsRound 3 Summary of Bookmark Placements
Statistic Table Nearly Meets Meets Exceeds
Median 1 10 14 47
Median 2 9.5 15 45.5
Median 3 10 20 52
Median Overall 10 15 48
Minimum 1 9 12 46
Minimum 2 9 15 44
Minimum 3 10 15 48
Minimum Overall 9 12 44
Maximum 1 10 14 51
Maximum 2 10 19 49
Maximum 3 12 20 55
Maximum Overall 12 20 55
SD 1 0.52 0.82 1.87
SD 2 0.55 1.83 1.94
SD 3 0.76 1.86 2.50
SD Overall 0.69 2.78 3.29
Overall Median 10 15 48
Minimum 9 12 44
Maximum 12 20 55
SD 0.69 2.78 3.29
E13
89

Oregon Standard Setting Grade 3 MathematicsRound 3 Summary of Cut Scores
Statistic Table Nearly Meets Meets Exceeds
Median 1 201 203 215
Median 2 201 204 215
Median 3 201 205 218
Median Overall 201 204 215
Minimum 1 200 202 215
Minimum 2 200 204 214
Minimum 3 201 204 215
Minimum Overall 200 202 214
Maximum 1 201 203 217
Maximum 2 201 205 215
Maximum 3 202 205 218
Maximum Overall 202 205 218
SD 1 0.52 0.41 0.82
SD 2 0.55 0.52 0.55
SD 3 0.38 0.38 1.29
SD Overall 0.54 0.97 1.42
Overall Median 201 204 215
Minimum 200 202 214
Maximum 202 205 218
SD 0.54 0.97 1.42
E14
90

Oregon Standard Setting Grade 3 MathematicsRound 3 Median Bookmark Summary
Table Nearly Meets Meets Exceeds1 10 14 472 9.5 15 45.53 10 20 52
Overall 10 15 48
Impact Data
Does NotYet Meet
NearlyMeets
Meets Exceeds
Overall 11.4 8.2 45.2 35.2
E15
91

Oregon Standard Setting Grade 5 MathematicsRound 1 Bookmark Placements
Table Participant Nearly Meets Meets Exceeds
1 2 13 26 56
1 3 5 15 56
1 4 10 17 48
1 5 11 17 36
1 8 9 14 48
1 19 6 21 48
2 9 9 17 47
2 10 8 22 67
2 11 7 20 47
2 12 11 21 63
2 13 12 20 43
2 14 9 16 53
3 1 6 12 42
3 15 10 15 54
3 16 10 15 53
3 17 8 27 57
3 18 10 15 53
3 20 10 15 50
Overall Median 9.5 17 51.5
Minimum 5 12 36
Maximum 13 27 67
SD 2.14 4.14 7.42
E16
92

Oregon Standard Setting Grade 5 MathematicsRound 1 Cut Scores
Table Participant Nearly Meets Meets Exceeds
1 2 215 219 230
1 3 209 216 230
1 4 214 217 227
1 5 214 217 223
1 8 214 216 227
1 19 210 218 227
2 9 214 217 227
2 10 212 218 239
2 11 211 218 227
2 12 214 218 235
2 13 215 218 225
2 14 214 217 229
3 1 210 215 225
3 15 214 216 229
3 16 214 216 229
3 17 212 219 231
3 18 214 216 229
3 20 214 216 227
Overall Median 214 217 228
Minimum 209 215 223
Maximum 215 219 239
SD 1.85 1.16 3.69
E17
93

Oregon Standard Setting Grade 5 MathematicsRound 1 Summary of Bookmark Placements
Statistic Table Nearly Meets Meets Exceeds
Median 1 9.5 17 48
Median 2 9 20 50
Median 3 10 15 53
Median Overall 9.5 17 51.5
Minimum 1 5 14 36
Minimum 2 7 16 43
Minimum 3 6 12 42
Minimum Overall 5 12 36
Maximum 1 13 26 56
Maximum 2 12 22 67
Maximum 3 10 27 57
Maximum Overall 13 27 67
SD 1 3.03 4.46 7.34
SD 2 1.86 2.34 9.67
SD 3 1.67 5.28 5.17
SD Overall 2.14 4.14 7.42
Overall Median 9.5 17 51.5
Minimum 5 12 36
Maximum 13 27 67
SD 2.14 4.14 7.42
E18
94

Oregon Standard Setting Grade 5 MathematicsRound 1 Summary of Cut Scores
Statistic Table Nearly Meets Meets Exceeds
Median 1 214 217 227
Median 2 214 218 228
Median 3 214 216 229
Median Overall 214 217 228
Minimum 1 209 216 223
Minimum 2 211 217 225
Minimum 3 210 215 225
Minimum Overall 209 215 223
Maximum 1 215 219 230
Maximum 2 215 218 239
Maximum 3 214 219 231
Maximum Overall 215 219 239
SD 1 2.50 1.17 2.58
SD 2 1.51 0.52 5.47
SD 3 1.67 1.37 2.07
SD Overall 1.85 1.16 3.69
Overall Median 214 217 228
Minimum 209 215 223
Maximum 215 219 239
SD 1.85 1.16 3.69
E19
95

Oregon Standard Setting Grade 5 MathematicsRound 1 Median Bookmark Summary
Table Nearly Meets Meets Exceeds1 9.5 17 482 9 20 503 10 15 53
Overall 9.5 17 51.5
Impact Data
Does NotYet Meet
NearlyMeets
Meets Exceeds
Overall 13.1 9.8 47.4 29.7
E20
96

Oregon Standard Setting Grade 5 MathematicsRound 2 Bookmark Placements
Table Participant Nearly Meets Meets Exceeds
1 2 11 21 48
1 3 6 17 56
1 4 11 17 56
1 5 11 20 48
1 8 14 21 56
1 19 11 20 51
2 9 9 20 54
2 10 9 21 64
2 11 9 20 53
2 12 11 20 63
2 13 9 20 54
2 14 9 20 57
3 1 7 12 42
3 15 10 15 54
3 16 9 15 53
3 17 8 19 53
3 18 10 15 53
3 20 10 15 52
Overall Median 9.5 20 53.5
Minimum 6 12 42
Maximum 14 21 64
SD 1.78 2.76 5.05
E21
97

Oregon Standard Setting Grade 5 MathematicsRound 2 Cut Scores
Table Participant Nearly Meets Meets Exceeds
1 2 214 218 227
1 3 210 217 230
1 4 214 217 230
1 5 214 218 227
1 8 216 218 230
1 19 214 218 228
2 9 214 218 229
2 10 214 218 235
2 11 214 218 229
2 12 214 218 235
2 13 214 218 229
2 14 214 218 231
3 1 211 215 225
3 15 214 216 229
3 16 214 216 229
3 17 212 218 229
3 18 214 216 229
3 20 214 216 228
Overall Median 214 218 229
Minimum 210 215 225
Maximum 216 218 235
SD 1.33 1.02 2.45
E22
98

Oregon Standard Setting Grade 5 MathematicsRound 2 Summary of Bookmark Placements
Statistic Table Nearly Meets Meets Exceeds
Median 1 11 20 53.5
Median 2 9 20 55.5
Median 3 9.5 15 53
Median Overall 9.5 20 53.5
Minimum 1 6 17 48
Minimum 2 9 20 53
Minimum 3 7 12 42
Minimum Overall 6 12 42
Maximum 1 14 21 56
Maximum 2 11 21 64
Maximum 3 10 19 54
Maximum Overall 14 21 64
SD 1 2.58 1.86 3.99
SD 2 0.82 0.41 4.85
SD 3 1.26 2.23 4.54
SD Overall 1.78 2.76 5.05
Overall Median 9.5 20 53.5
Minimum 6 12 42
Maximum 14 21 64
SD 1.78 2.76 5.05
E23
99

Oregon Standard Setting Grade 5 MathematicsRound 2 Summary of Cut Scores
Statistic Table Nearly Meets Meets Exceeds
Median 1 214 218 229
Median 2 214 218 230
Median 3 214 216 229
Median Overall 214 218 229
Minimum 1 210 217 227
Minimum 2 214 218 229
Minimum 3 211 215 225
Minimum Overall 210 215 225
Maximum 1 216 218 230
Maximum 2 214 218 235
Maximum 3 214 218 229
Maximum Overall 216 218 235
SD 1 1.97 0.52 1.51
SD 2 0.00 0.00 2.94
SD 3 1.33 0.98 1.60
SD Overall 1.33 1.02 2.45
Overall Median 214 218 229
Minimum 210 215 225
Maximum 216 218 235
SD 1.33 1.02 2.45
E24
100

Oregon Standard Setting Grade 5 MathematicsRound 2 Median Bookmark Summary
Table Nearly Meets Meets Exceeds1 11 20 53.52 9 20 55.53 9.5 15 53
Overall 9.5 20 53.5
Impact Data
Does NotYet Meet
NearlyMeets
Meets Exceeds
Overall 13.1 14.4 46.1 26.4
E25
101

Oregon Standard Setting Grade 5 MathematicsRound 3 Bookmark Placements
Table Participant Nearly Meets Meets Exceeds
1 2 10 17 54
1 3 9 17 56
1 4 11 20 56
1 5 11 17 56
1 8 11 20 56
1 19 11 20 63
2 9 9 20 64
2 10 9 19 64
2 11 9 20 54
2 12 9 20 63
2 13 9 20 56
2 14 9 20 57
3 1 8 15 53
3 15 9 15 53
3 16 9 17 53
3 17 9 19 53
3 18 10 17 53
3 20 10 15 51
Overall Median 9 19 56
Minimum 8 15 51
Maximum 11 20 64
SD 0.92 1.96 4.22
E26
102

Oregon Standard Setting Grade 5 MathematicsRound 3 Cut Scores
Table Participant Nearly Meets Meets Exceeds
1 2 214 217 229
1 3 214 217 230
1 4 214 218 230
1 5 214 217 230
1 8 214 218 230
1 19 214 218 235
2 9 214 218 235
2 10 214 218 235
2 11 214 218 229
2 12 214 218 235
2 13 214 218 230
2 14 214 218 231
3 1 212 216 229
3 15 214 216 229
3 16 214 217 229
3 17 214 218 229
3 18 214 217 229
3 20 214 216 228
Overall Median 214 218 230
Minimum 212 216 228
Maximum 214 218 235
SD 0.47 0.78 2.47
E27
103

Oregon Standard Setting Grade 5 MathematicsRound 3 Summary of Bookmark Placements
Statistic Table Nearly Meets Meets Exceeds
Median 1 11 18.5 56
Median 2 9 20 60
Median 3 9 16 53
Median Overall 9 19 56
Minimum 1 9 17 54
Minimum 2 9 19 54
Minimum 3 8 15 51
Minimum Overall 8 15 51
Maximum 1 11 20 63
Maximum 2 9 20 64
Maximum 3 10 19 53
Maximum Overall 11 20 64
SD 1 0.84 1.64 3.13
SD 2 0.00 0.41 4.50
SD 3 0.75 1.63 0.82
SD Overall 0.92 1.96 4.22
Overall Median 9 19 56
Minimum 8 15 51
Maximum 11 20 64
SD 0.92 1.96 4.22
E28
104

Oregon Standard Setting Grade 5 MathematicsRound 3 Summary of Cut Scores
Statistic Table Nearly Meets Meets Exceeds
Median 1 214 218 230
Median 2 214 218 233
Median 3 214 217 229
Median Overall 214 218 230
Minimum 1 214 217 229
Minimum 2 214 218 229
Minimum 3 212 216 228
Minimum Overall 212 216 228
Maximum 1 214 218 235
Maximum 2 214 218 235
Maximum 3 214 218 229
Maximum Overall 214 218 235
SD 1 0.00 0.55 2.16
SD 2 0.00 0.00 2.81
SD 3 0.82 0.82 0.41
SD Overall 0.47 0.78 2.47
Overall Median 214 218 230
Minimum 212 216 228
Maximum 214 218 235
SD 0.47 0.78 2.47
E29
105

Oregon Standard Setting Grade 5 MathematicsRound 3 Median Bookmark Summary
Table Nearly Meets Meets Exceeds1 11 18.5 562 9 20 603 9 16 53
Overall 9 19 56
Impact Data
Does NotYet Meet
NearlyMeets
Meets Exceeds
Overall 13.1 14.4 48.9 23.6
E30
106

Oregon Standard Setting Grade 8 MathematicsRound 1 Bookmark Placements
Table Participant Nearly Meets Meets Exceeds
1 2 12 20 40
1 3 16 23 41
1 4 15 22 46
1 5 11 19 44
1 6 12 19 44
1 7 9 20 38
1 8 18 22 48
2 9 7 24 49
2 10 11 19 47
2 11 10 20 40
2 12 12 24 48
2 13 10 19 49
2 14 11 25 44
3 15 12 22 49
3 16 13 25 48
3 17 14 25 47
3 18 13 24 46
3 19 19 27 49
3 20 14 24 56
3 22 12 24 47
Overall Median 12 22.5 47
Minimum 7 19 38
Maximum 19 27 56
SD 2.89 2.50 4.13
E31
107

Oregon Standard Setting Grade 8 MathematicsRound 1 Cut Scores
Table Participant Nearly Meets Meets Exceeds
1 2 225 228 237
1 3 226 232 238
1 4 226 230 241
1 5 224 228 239
1 6 225 228 239
1 7 224 228 237
1 8 228 230 241
2 9 223 233 241
2 10 224 228 241
2 11 224 228 237
2 12 225 233 241
2 13 224 228 241
2 14 224 234 239
3 15 225 230 241
3 16 225 234 241
3 17 226 234 241
3 18 225 233 241
3 19 228 234 241
3 20 226 233 246
3 22 225 233 241
Overall Median 225 230 241
Minimum 223 228 237
Maximum 228 234 246
SD 1.29 2.54 2.07
E32
108

Oregon Standard Setting Grade 8 MathematicsRound 1 Summary of Bookmark Placements
Statistic Table Nearly Meets Meets Exceeds
Median 1 12 20 44
Median 2 10.5 22 47.5
Median 3 13 24 48
Median Overall 12 22.5 47
Minimum 1 9 19 38
Minimum 2 7 19 40
Minimum 3 12 22 46
Minimum Overall 7 19 38
Maximum 1 18 23 48
Maximum 2 12 25 49
Maximum 3 19 27 56
Maximum Overall 19 27 56
SD 1 3.15 1.60 3.51
SD 2 1.72 2.79 3.54
SD 3 2.41 1.51 3.34
SD Overall 2.89 2.50 4.13
Overall Median 12 22.5 47
Minimum 7 19 38
Maximum 19 27 56
SD 2.89 2.50 4.13
E33
109

Oregon Standard Setting Grade 8 MathematicsRound 1 Summary of Cut Scores
Statistic Table Nearly Meets Meets Exceeds
Median 1 225 228 239
Median 2 224 231 241
Median 3 225 233 241
Median Overall 225 230 241
Minimum 1 224 228 237
Minimum 2 223 228 237
Minimum 3 225 230 241
Minimum Overall 223 228 237
Maximum 1 228 232 241
Maximum 2 225 234 241
Maximum 3 228 234 246
Maximum Overall 228 234 246
SD 1 1.40 1.57 1.68
SD 2 0.63 2.94 1.67
SD 3 1.11 1.41 1.89
SD Overall 1.29 2.54 2.07
Overall Median 225 230 241
Minimum 223 228 237
Maximum 228 234 246
SD 1.29 2.54 2.07
E34
110

Oregon Standard Setting Grade 8 MathematicsRound 1 Median Bookmark Summary
Table Nearly Meets Meets Exceeds1 12 20 442 10.5 22 47.53 13 24 48
Overall 12 22.5 47
Impact Data
Does NotYet Meet
NearlyMeets
Meets Exceeds
Overall 19.2 13.1 40.3 27.4
E35
111

Oregon Standard Setting Grade 8 MathematicsRound 2 Bookmark Placements
Table Participant Nearly Meets Meets Exceeds
1 2 13 22 41
1 3 16 23 48
1 4 14 22 45
1 5 10 19 41
1 6 16 20 44
1 7 11 20 41
1 8 17 21 48
2 9 9 24 49
2 10 9 19 48
2 11 8 20 49
2 12 9 19 49
2 13 7 19 49
2 14 10 20 48
3 15 13 24 49
3 16 13 25 50
3 17 13 24 47
3 18 13 24 49
3 19 5 26 49
3 20 14 25 50
3 22 14 26 52
Overall Median 13 22 48.5
Minimum 5 19 41
Maximum 17 26 52
SD 3.23 2.51 3.20
E36
112

Oregon Standard Setting Grade 8 MathematicsRound 2 Cut Scores
Table Participant Nearly Meets Meets Exceeds
1 2 225 230 238
1 3 226 232 241
1 4 226 230 240
1 5 224 228 238
1 6 226 228 239
1 7 224 228 238
1 8 227 229 241
2 9 224 233 241
2 10 224 228 241
2 11 223 228 241
2 12 224 228 241
2 13 223 228 241
2 14 224 228 241
3 15 225 233 241
3 16 225 234 242
3 17 225 233 241
3 18 225 233 241
3 19 221 234 241
3 20 226 234 242
3 22 226 234 242
Overall Median 225 230 241
Minimum 221 228 238
Maximum 227 234 242
SD 1.39 2.60 1.28
E37
113

Oregon Standard Setting Grade 8 MathematicsRound 2 Summary of Bookmark Placements
Statistic Table Nearly Meets Meets Exceeds
Median 1 14 21 44
Median 2 9 19.5 49
Median 3 13 25 49
Median Overall 13 22 48.5
Minimum 1 10 19 41
Minimum 2 7 19 48
Minimum 3 5 24 47
Minimum Overall 5 19 41
Maximum 1 17 23 48
Maximum 2 10 24 49
Maximum 3 14 26 52
Maximum Overall 17 26 52
SD 1 2.67 1.41 3.16
SD 2 1.03 1.94 0.52
SD 3 3.18 0.90 1.51
SD Overall 3.23 2.51 3.20
Overall Median 13 22 48.5
Minimum 5 19 41
Maximum 17 26 52
SD 3.23 2.51 3.20
E38
114

Oregon Standard Setting Grade 8 MathematicsRound 2 Summary of Cut Scores
Statistic Table Nearly Meets Meets Exceeds
Median 1 226 229 239
Median 2 224 228 241
Median 3 225 234 241
Median Overall 225 230 241
Minimum 1 224 228 238
Minimum 2 223 228 241
Minimum 3 221 233 241
Minimum Overall 221 228 238
Maximum 1 227 232 241
Maximum 2 224 233 241
Maximum 3 226 234 242
Maximum Overall 227 234 242
SD 1 1.13 1.50 1.38
SD 2 0.52 2.04 0.00
SD 3 1.70 0.53 0.53
SD Overall 1.39 2.60 1.28
Overall Median 225 230 241
Minimum 221 228 238
Maximum 227 234 242
SD 1.39 2.60 1.28
E39
115
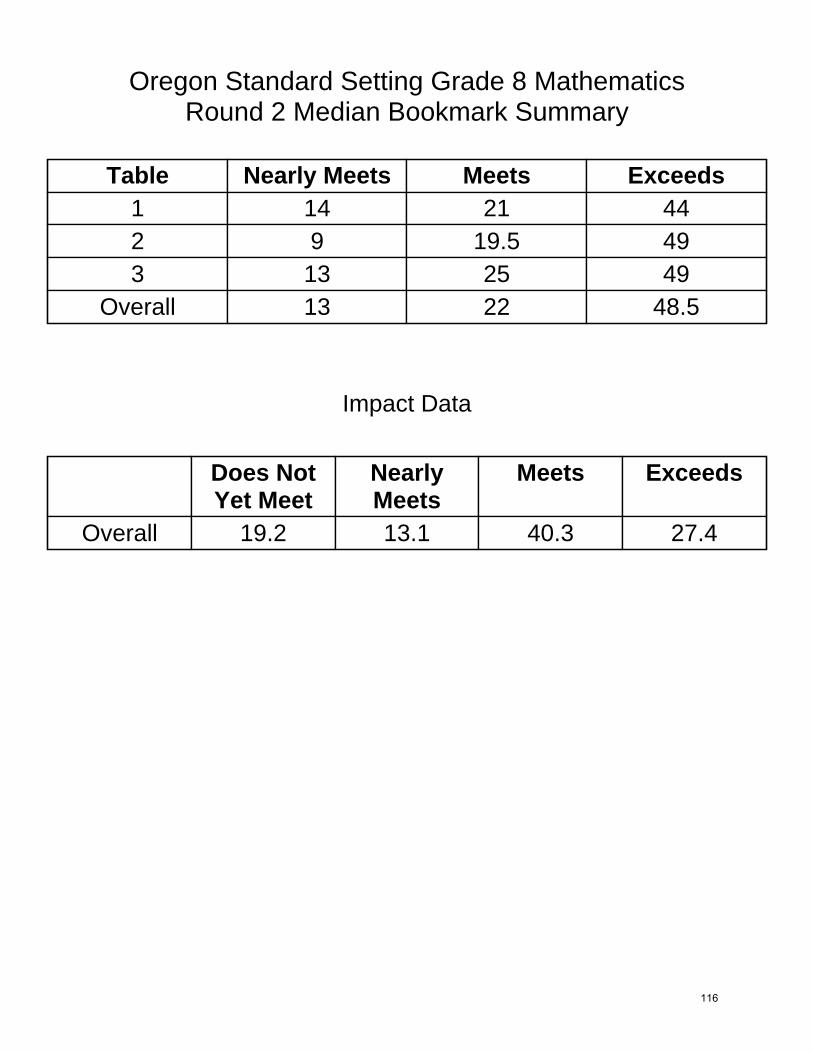
Oregon Standard Setting Grade 8 MathematicsRound 2 Median Bookmark Summary
Table Nearly Meets Meets Exceeds1 14 21 442 9 19.5 493 13 25 49
Overall 13 22 48.5
Impact Data
Does NotYet Meet
NearlyMeets
Meets Exceeds
Overall 19.2 13.1 40.3 27.4
E40
116
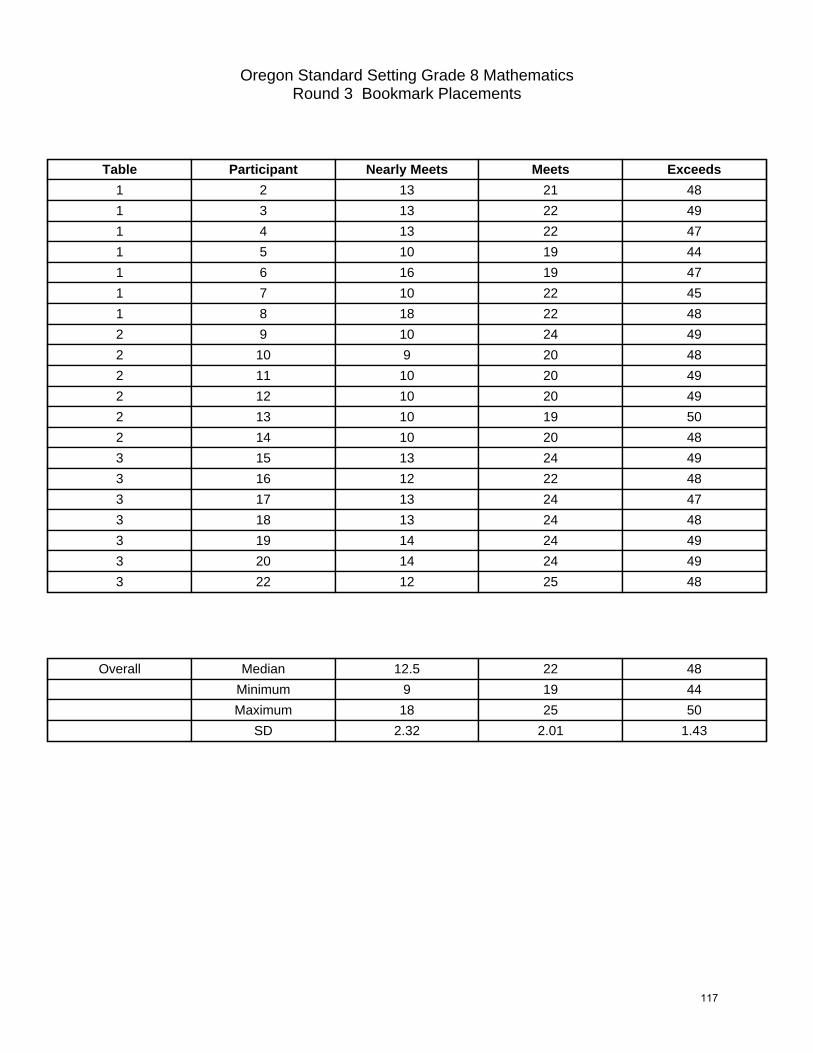
Oregon Standard Setting Grade 8 MathematicsRound 3 Bookmark Placements
Table Participant Nearly Meets Meets Exceeds
1 2 13 21 48
1 3 13 22 49
1 4 13 22 47
1 5 10 19 44
1 6 16 19 47
1 7 10 22 45
1 8 18 22 48
2 9 10 24 49
2 10 9 20 48
2 11 10 20 49
2 12 10 20 49
2 13 10 19 50
2 14 10 20 48
3 15 13 24 49
3 16 12 22 48
3 17 13 24 47
3 18 13 24 48
3 19 14 24 49
3 20 14 24 49
3 22 12 25 48
Overall Median 12.5 22 48
Minimum 9 19 44
Maximum 18 25 50
SD 2.32 2.01 1.43
E41
117
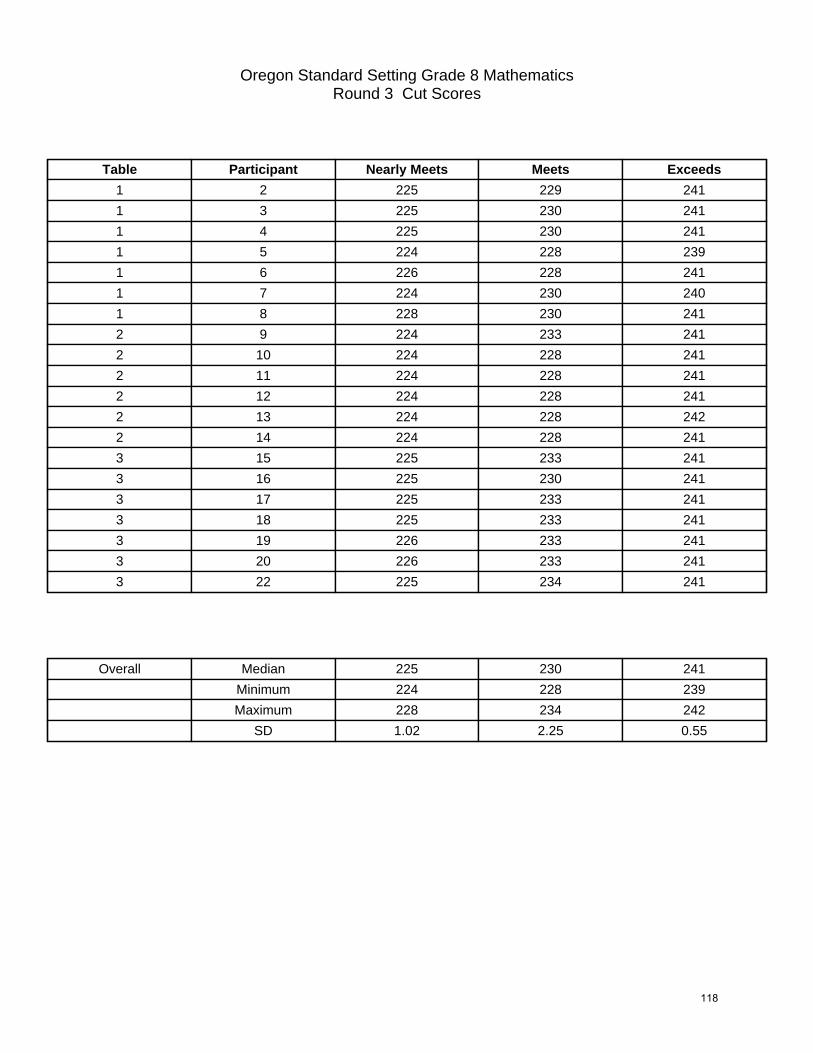
Oregon Standard Setting Grade 8 MathematicsRound 3 Cut Scores
Table Participant Nearly Meets Meets Exceeds
1 2 225 229 241
1 3 225 230 241
1 4 225 230 241
1 5 224 228 239
1 6 226 228 241
1 7 224 230 240
1 8 228 230 241
2 9 224 233 241
2 10 224 228 241
2 11 224 228 241
2 12 224 228 241
2 13 224 228 242
2 14 224 228 241
3 15 225 233 241
3 16 225 230 241
3 17 225 233 241
3 18 225 233 241
3 19 226 233 241
3 20 226 233 241
3 22 225 234 241
Overall Median 225 230 241
Minimum 224 228 239
Maximum 228 234 242
SD 1.02 2.25 0.55
E42
118

Oregon Standard Setting Grade 8 MathematicsRound 3 Summary of Bookmark Placements
Statistic Table Nearly Meets Meets Exceeds
Median 1 13 22 47
Median 2 10 20 49
Median 3 13 24 48
Median Overall 12.5 22 48
Minimum 1 10 19 44
Minimum 2 9 19 48
Minimum 3 12 22 47
Minimum Overall 9 19 44
Maximum 1 18 22 49
Maximum 2 10 24 50
Maximum 3 14 25 49
Maximum Overall 18 25 50
SD 1 2.93 1.41 1.77
SD 2 0.41 1.76 0.75
SD 3 0.82 0.90 0.76
SD Overall 2.32 2.01 1.43
Overall Median 12.5 22 48
Minimum 9 19 44
Maximum 18 25 50
SD 2.32 2.01 1.43
E43
119

Oregon Standard Setting Grade 8 MathematicsRound 3 Summary of Cut Scores
Statistic Table Nearly Meets Meets Exceeds
Median 1 225 230 241
Median 2 224 228 241
Median 3 225 233 241
Median Overall 225 230 241
Minimum 1 224 228 239
Minimum 2 224 228 241
Minimum 3 225 230 241
Minimum Overall 224 228 239
Maximum 1 228 230 241
Maximum 2 224 233 242
Maximum 3 226 234 241
Maximum Overall 228 234 242
SD 1 1.38 0.95 0.79
SD 2 0.00 2.04 0.41
SD 3 0.49 1.25 0.00
SD Overall 1.02 2.25 0.55
Overall Median 225 230 241
Minimum 224 228 239
Maximum 228 234 242
SD 1.02 2.25 0.55
E44
120

Oregon Standard Setting Grade 8 MathematicsRound 3 Median Bookmark Summary
Table Nearly Meets Meets Exceeds1 13 22 472 10 20 493 13 24 48
Overall 12.5 22 48
Impact Data
Does NotYet Meet
NearlyMeets
Meets Exceeds
Overall 19.2 13.1 40.3 27.4
E45
121
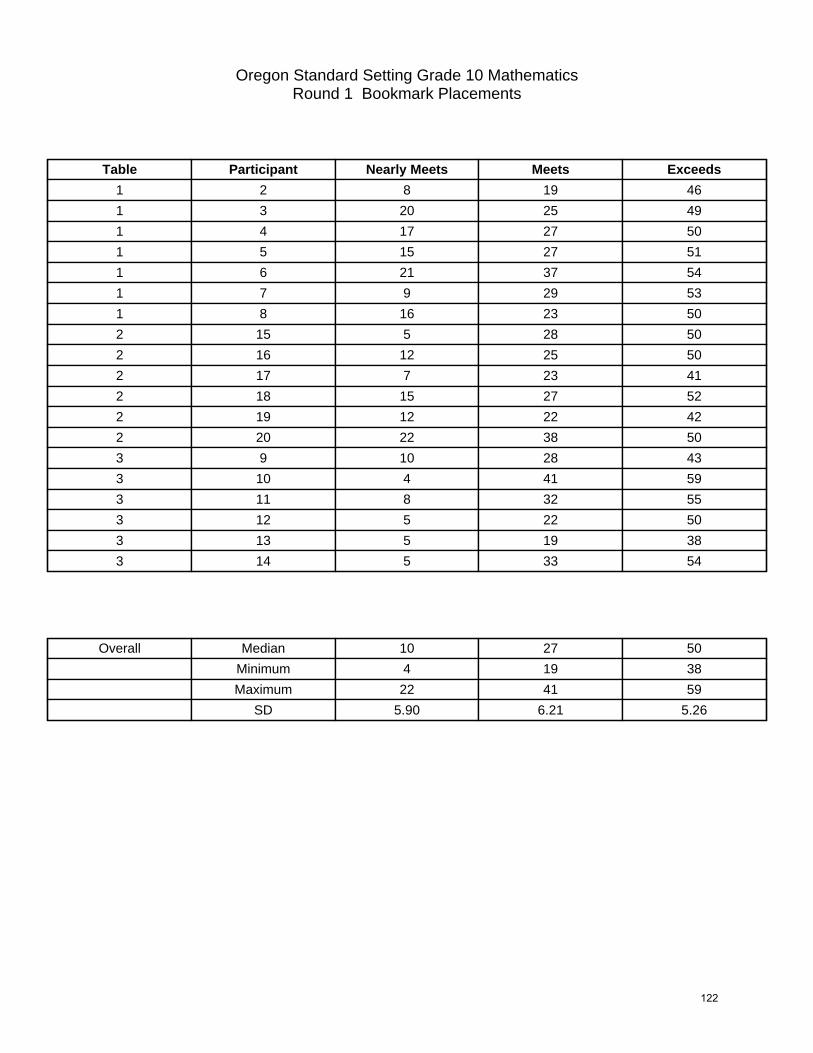
Oregon Standard Setting Grade 10 MathematicsRound 1 Bookmark Placements
Table Participant Nearly Meets Meets Exceeds
1 2 8 19 46
1 3 20 25 49
1 4 17 27 50
1 5 15 27 51
1 6 21 37 54
1 7 9 29 53
1 8 16 23 50
2 15 5 28 50
2 16 12 25 50
2 17 7 23 41
2 18 15 27 52
2 19 12 22 42
2 20 22 38 50
3 9 10 28 43
3 10 4 41 59
3 11 8 32 55
3 12 5 22 50
3 13 5 19 38
3 14 5 33 54
Overall Median 10 27 50
Minimum 4 19 38
Maximum 22 41 59
SD 5.90 6.21 5.26
E46
122

Oregon Standard Setting Grade 10 MathematicsRound 1 Cut Scores
Table Participant Nearly Meets Meets Exceeds
1 2 231 236 245
1 3 236 238 247
1 4 236 239 247
1 5 234 239 248
1 6 237 242 250
1 7 231 239 249
1 8 235 237 247
2 15 230 239 247
2 16 232 238 247
2 17 230 237 244
2 18 234 239 249
2 19 232 237 244
2 20 237 242 247
3 9 232 239 244
3 10 229 244 252
3 11 231 240 250
3 12 230 237 247
3 13 230 236 242
3 14 230 240 250
Overall Median 232 239 247
Minimum 229 236 242
Maximum 237 244 252
SD 2.65 2.12 2.54
E47
123

Oregon Standard Setting Grade 10 MathematicsRound 1 Summary of Bookmark Placements
Statistic Table Nearly Meets Meets Exceeds
Median 1 16 27 50
Median 2 12 26 50
Median 3 5 30 52
Median Overall 10 27 50
Minimum 1 8 19 46
Minimum 2 5 22 41
Minimum 3 4 19 38
Minimum Overall 4 19 38
Maximum 1 21 37 54
Maximum 2 22 38 52
Maximum 3 10 41 59
Maximum Overall 22 41 59
SD 1 5.01 5.59 2.64
SD 2 6.05 5.78 4.72
SD 3 2.32 7.99 7.94
SD Overall 5.90 6.21 5.26
Overall Median 10 27 50
Minimum 4 19 38
Maximum 22 41 59
SD 5.90 6.21 5.26
E48
124

Oregon Standard Setting Grade 10 MathematicsRound 1 Summary of Cut Scores
Statistic Table Nearly Meets Meets Exceeds
Median 1 235 239 247
Median 2 232 239 247
Median 3 230 240 249
Median Overall 232 239 247
Minimum 1 231 236 245
Minimum 2 230 237 244
Minimum 3 229 236 242
Minimum Overall 229 236 242
Maximum 1 237 242 250
Maximum 2 237 242 249
Maximum 3 232 244 252
Maximum Overall 237 244 252
SD 1 2.43 1.90 1.62
SD 2 2.66 1.86 1.97
SD 3 1.03 2.80 3.89
SD Overall 2.65 2.12 2.54
Overall Median 232 239 247
Minimum 229 236 242
Maximum 237 244 252
SD 2.65 2.12 2.54
E49
125

Oregon Standard Setting Grade 10 MathematicsRound 1 Median Bookmark Summary
Table Nearly Meets Meets Exceeds1 16 27 502 12 26 503 5 30 52
Overall 10 27 50
Impact Data
Does NotYet Meet
NearlyMeets
Meets Exceeds
Overall 32.5 23.3 29.6 14.6
E50
126

Oregon Standard Setting Grade 10 MathematicsRound 2 Bookmark Placements
Table Participant Nearly Meets Meets Exceeds
1 2 11 23 45
1 3 15 22 45
1 4 17 23 50
1 5 7 23 50
1 6 4 21 45
1 7 15 29 51
1 8 12 23 50
2 15 5 20 43
2 16 7 20 50
2 17 7 22 45
2 18 8 22 41
2 19 10 22 43
2 20 8 22 50
3 9 5 31 45
3 10 7 28 50
3 11 8 28 50
3 12 10 28 50
3 13 8 28 45
3 14 8 33 50
Overall Median 8 23 50
Minimum 4 20 41
Maximum 17 33 51
SD 3.57 3.92 3.23
E51
127

Oregon Standard Setting Grade 10 MathematicsRound 2 Cut Scores
Table Participant Nearly Meets Meets Exceeds
1 2 232 237 244
1 3 234 237 244
1 4 236 237 247
1 5 230 237 247
1 6 229 237 244
1 7 234 239 248
1 8 232 237 247
2 15 230 236 244
2 16 230 236 247
2 17 230 237 244
2 18 231 237 244
2 19 232 237 244
2 20 231 237 247
3 9 230 240 244
3 10 230 239 247
3 11 231 239 247
3 12 232 239 247
3 13 231 239 244
3 14 231 240 247
Overall Median 231 237 247
Minimum 229 236 244
Maximum 236 240 248
SD 1.74 1.28 1.61
E52
128

Oregon Standard Setting Grade 10 MathematicsRound 2 Summary of Bookmark Placements
Statistic Table Nearly Meets Meets Exceeds
Median 1 12 23 50
Median 2 7.5 22 44
Median 3 8 28 50
Median Overall 8 23 50
Minimum 1 4 21 45
Minimum 2 5 20 41
Minimum 3 5 28 45
Minimum Overall 4 20 41
Maximum 1 17 29 51
Maximum 2 10 22 50
Maximum 3 10 33 50
Maximum Overall 17 33 51
SD 1 4.69 2.57 2.83
SD 2 1.64 1.03 3.83
SD 3 1.63 2.16 2.58
SD Overall 3.57 3.92 3.23
Overall Median 8 23 50
Minimum 4 20 41
Maximum 17 33 51
SD 3.57 3.92 3.23
E53
129

Oregon Standard Setting Grade 10 MathematicsRound 2 Summary of Cut Scores
Statistic Table Nearly Meets Meets Exceeds
Median 1 232 237 247
Median 2 231 237 244
Median 3 231 239 247
Median Overall 231 237 247
Minimum 1 229 237 244
Minimum 2 230 236 244
Minimum 3 230 239 244
Minimum Overall 229 236 244
Maximum 1 236 239 248
Maximum 2 232 237 247
Maximum 3 232 240 247
Maximum Overall 236 240 248
SD 1 2.44 0.76 1.77
SD 2 0.82 0.52 1.55
SD 3 0.75 0.52 1.55
SD Overall 1.74 1.28 1.61
Overall Median 231 237 247
Minimum 229 236 244
Maximum 236 240 248
SD 1.74 1.28 1.61
E54
130
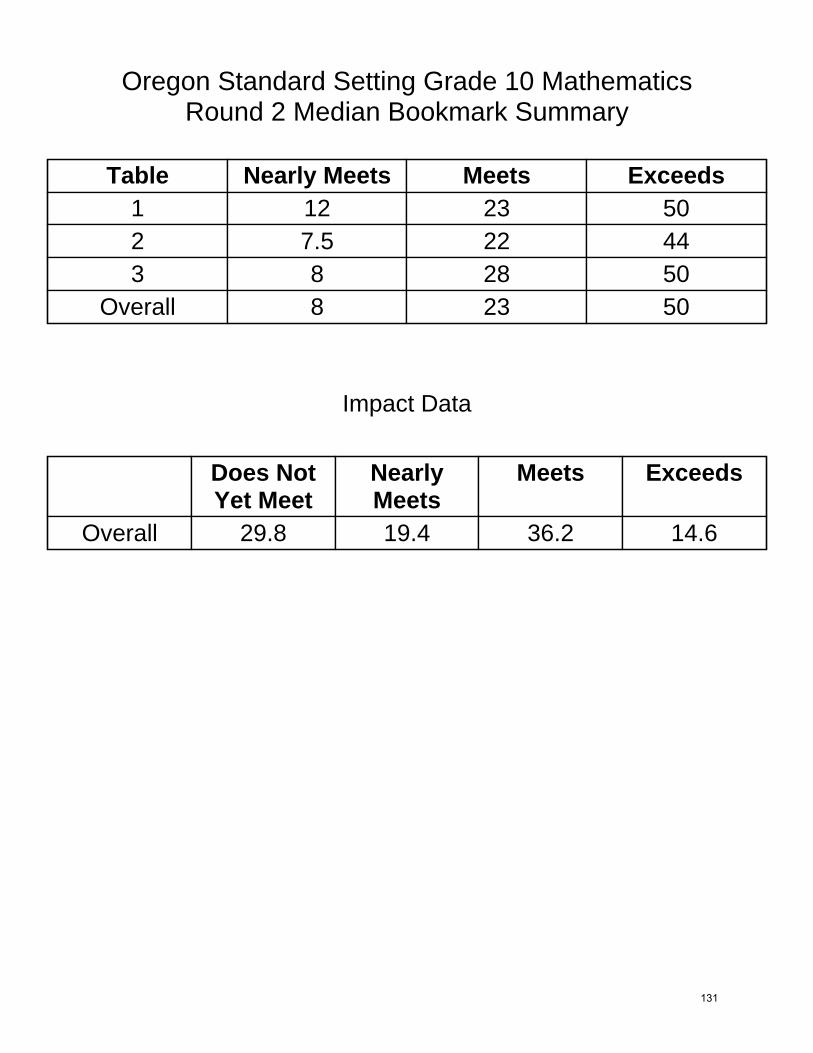
Oregon Standard Setting Grade 10 MathematicsRound 2 Median Bookmark Summary
Table Nearly Meets Meets Exceeds1 12 23 502 7.5 22 443 8 28 50
Overall 8 23 50
Impact Data
Does NotYet Meet
NearlyMeets
Meets Exceeds
Overall 29.8 19.4 36.2 14.6
E55
131

Oregon Standard Setting Grade 10 MathematicsRound 3 Bookmark Placements
Table Participant Nearly Meets Meets Exceeds
1 2 8 19 45
1 3 10 19 45
1 4 16 19 50
1 5 7 22 46
1 6 8 19 43
1 7 8 22 47
1 8 7 19 50
2 15 5 16 40
2 16 8 19 50
2 17 5 19 44
2 18 8 19 45
2 19 8 19 41
2 20 8 19 46
3 9 8 28 50
3 10 7 28 50
3 11 8 27 50
3 12 10 28 50
3 13 8 22 50
3 14 8 26 50
Overall Median 8 19 47
Minimum 5 16 40
Maximum 16 28 50
SD 2.27 3.88 3.37
E56
132
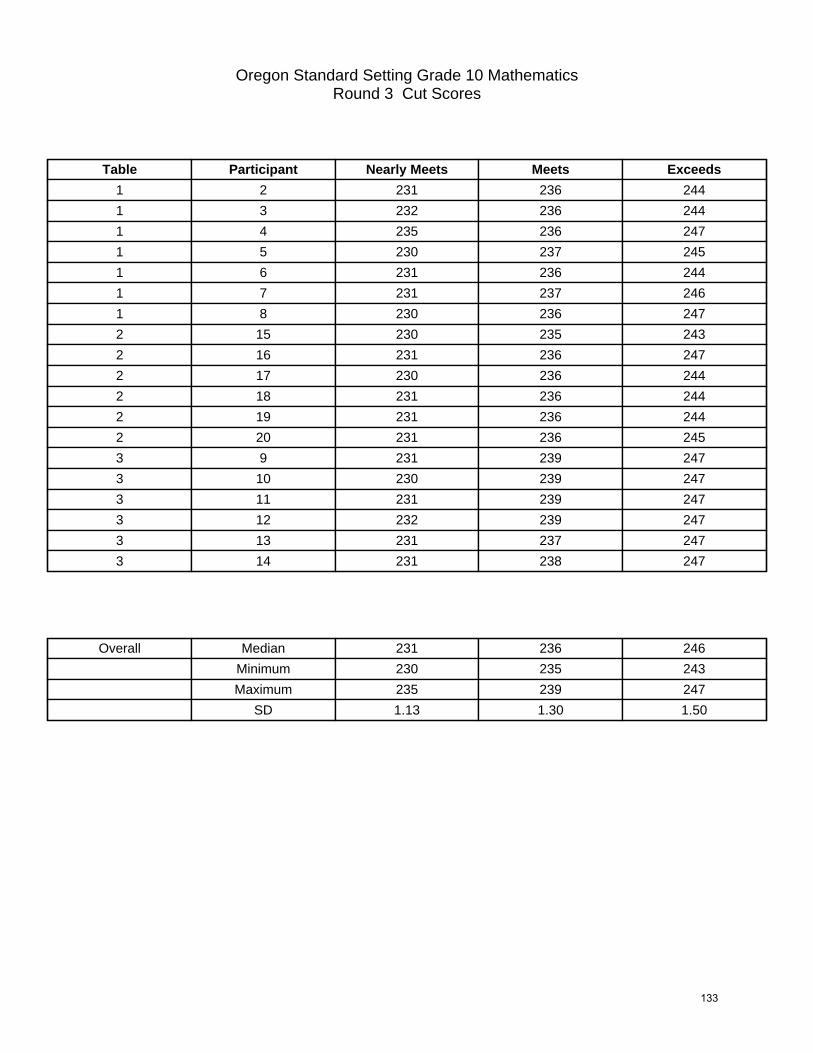
Oregon Standard Setting Grade 10 MathematicsRound 3 Cut Scores
Table Participant Nearly Meets Meets Exceeds
1 2 231 236 244
1 3 232 236 244
1 4 235 236 247
1 5 230 237 245
1 6 231 236 244
1 7 231 237 246
1 8 230 236 247
2 15 230 235 243
2 16 231 236 247
2 17 230 236 244
2 18 231 236 244
2 19 231 236 244
2 20 231 236 245
3 9 231 239 247
3 10 230 239 247
3 11 231 239 247
3 12 232 239 247
3 13 231 237 247
3 14 231 238 247
Overall Median 231 236 246
Minimum 230 235 243
Maximum 235 239 247
SD 1.13 1.30 1.50
E57
133

Oregon Standard Setting Grade 10 MathematicsRound 3 Summary of Bookmark Placements
Statistic Table Nearly Meets Meets Exceeds
Median 1 8 19 46
Median 2 8 19 44.5
Median 3 8 27.5 50
Median Overall 8 19 47
Minimum 1 7 19 43
Minimum 2 5 16 40
Minimum 3 7 22 50
Minimum Overall 5 16 40
Maximum 1 16 22 50
Maximum 2 8 19 50
Maximum 3 10 28 50
Maximum Overall 16 28 50
SD 1 3.18 1.46 2.64
SD 2 1.55 1.22 3.61
SD 3 0.98 2.35 0.00
SD Overall 2.27 3.88 3.37
Overall Median 8 19 47
Minimum 5 16 40
Maximum 16 28 50
SD 2.27 3.88 3.37
E58
134

Oregon Standard Setting Grade 10 MathematicsRound 3 Summary of Cut Scores
Statistic Table Nearly Meets Meets Exceeds
Median 1 231 236 245
Median 2 231 236 244
Median 3 231 239 247
Median Overall 231 236 246
Minimum 1 230 236 244
Minimum 2 230 235 243
Minimum 3 230 237 247
Minimum Overall 230 235 243
Maximum 1 235 237 247
Maximum 2 231 236 247
Maximum 3 232 239 247
Maximum Overall 235 239 247
SD 1 1.72 0.49 1.38
SD 2 0.52 0.41 1.38
SD 3 0.63 0.84 0.00
SD Overall 1.13 1.30 1.50
Overall Median 231 236 246
Minimum 230 235 243
Maximum 235 239 247
SD 1.13 1.30 1.50
E59
135

Oregon Standard Setting Grade 10 MathematicsRound 3 Median Bookmark Summary
Table Nearly Meets Meets Exceeds1 8 19 462 8 19 44.53 8 27.5 50
Overall 8 19 47
Impact Data
Does NotYet Meet
NearlyMeets
Meets Exceeds
Overall 29.8 15.9 37.7 16.6
E60
136

Oregon Standard Setting Grade 3 Reading/LiteratureRound 1 Bookmark Placements
Table Participant Nearly Meets Meets Exceeds
1 2 9 16 45
1 3 6 16 46
1 10 5 16 46
1 11 5 13 46
1 12 6 16 47
1 19 11 42 66
1 20 7 15 45
2 4 4 11 38
2 5 3 11 47
2 6 8 11 47
2 7 6 16 42
2 8 4 12 47
2 9 7 17 56
3 13 5 17 36
3 14 6 17 40
3 15 6 15 40
3 16 2 6 44
3 17 10 25 44
3 18 5 15 37
Overall Median 6 16 45
Minimum 2 6 36
Maximum 11 42 66
SD 2.27 7.31 6.81
E61
137

Oregon Standard Setting Grade 3 Reading/LiteratureRound 1 Cut Scores
Table Participant Nearly Meets Meets Exceeds
1 2 200 203 215
1 3 199 203 215
1 10 198 203 215
1 11 198 202 215
1 12 199 203 216
1 19 201 214 224
1 20 199 203 215
2 4 198 201 212
2 5 194 201 216
2 6 200 201 216
2 7 199 203 214
2 8 198 201 216
2 9 199 204 219
3 13 198 204 212
3 14 199 204 213
3 15 199 203 213
3 16 193 199 215
3 17 200 208 215
3 18 198 203 212
Overall Median 199 203 215
Minimum 193 199 212
Maximum 201 214 224
SD 1.92 3.16 2.75
E62
138

Oregon Standard Setting Grade 3 Reading/LiteratureRound 1 Summary of Bookmark Placements
Statistic Table Nearly Meets Meets Exceeds
Median 1 6 16 46
Median 2 5 11.5 47
Median 3 5.5 16 40
Median Overall 6 16 45
Minimum 1 5 13 45
Minimum 2 3 11 38
Minimum 3 2 6 36
Minimum Overall 2 6 36
Maximum 1 11 42 66
Maximum 2 8 17 56
Maximum 3 10 25 44
Maximum Overall 11 42 66
SD 1 2.24 10.14 7.65
SD 2 1.97 2.76 6.05
SD 3 2.58 6.08 3.37
SD Overall 2.27 7.31 6.81
Overall Median 6 16 45
Minimum 2 6 36
Maximum 11 42 66
SD 2.27 7.31 6.81
E63
139
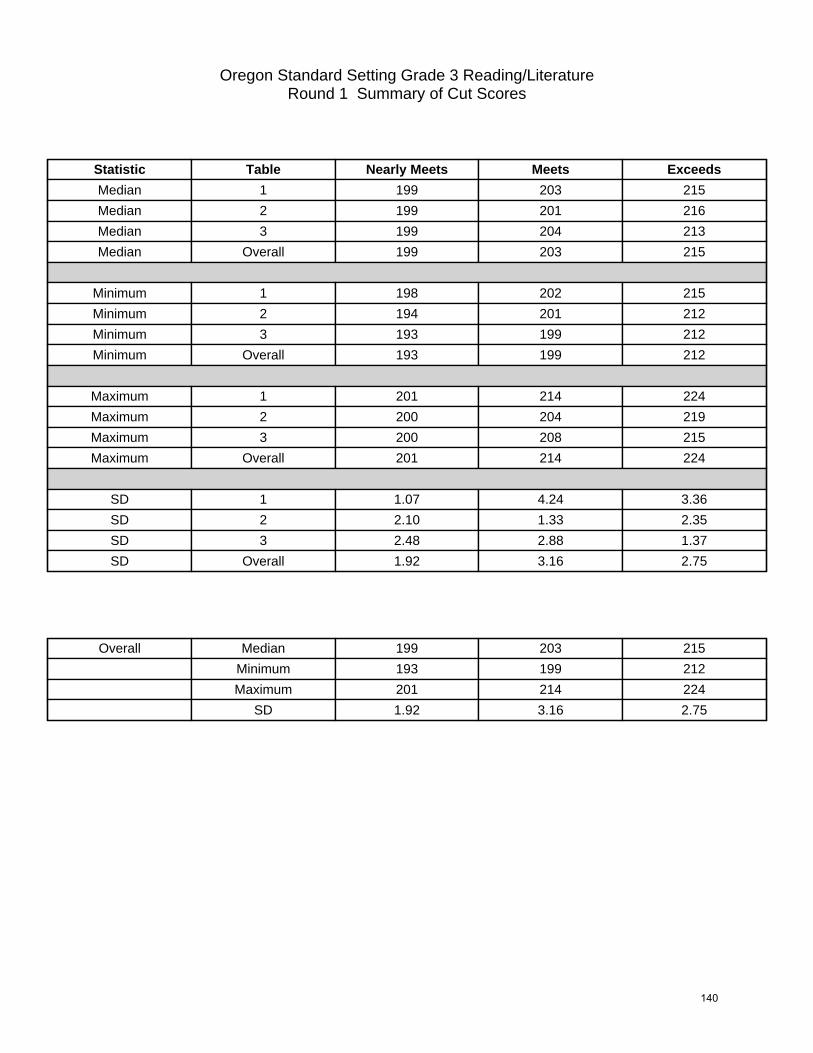
Oregon Standard Setting Grade 3 Reading/LiteratureRound 1 Summary of Cut Scores
Statistic Table Nearly Meets Meets Exceeds
Median 1 199 203 215
Median 2 199 201 216
Median 3 199 204 213
Median Overall 199 203 215
Minimum 1 198 202 215
Minimum 2 194 201 212
Minimum 3 193 199 212
Minimum Overall 193 199 212
Maximum 1 201 214 224
Maximum 2 200 204 219
Maximum 3 200 208 215
Maximum Overall 201 214 224
SD 1 1.07 4.24 3.36
SD 2 2.10 1.33 2.35
SD 3 2.48 2.88 1.37
SD Overall 1.92 3.16 2.75
Overall Median 199 203 215
Minimum 193 199 212
Maximum 201 214 224
SD 1.92 3.16 2.75
E64
140

Oregon Standard Setting Grade 3 Reading/LiteratureRound 1 Median Bookmark Summary
Table Nearly Meets Meets Exceeds1 6 16 462 5 11.5 473 5.5 16 40
Overall 6 16 45
Impact Data
Does NotYet Meet
NearlyMeets
Meets Exceeds
Overall 8.5 7.1 39.0 45.4
E65
141

Oregon Standard Setting Grade 3 Reading/LiteratureRound 2 Bookmark Placements
Table Participant Nearly Meets Meets Exceeds
1 2 6 16 46
1 3 6 16 46
1 10 6 16 46
1 11 6 16 46
1 12 6 17 49
1 19 6 16 45
1 20 7 17 46
2 4 4 12 46
2 5 5 11 47
2 6 5 12 47
2 7 5 14 42
2 8 4 12 47
2 9 5 12 46
3 13 6 16 37
3 14 6 15 39
3 15 6 15 39
3 16 6 16 42
3 17 9 17 42
3 18 6 16 44
Overall Median 6 16 46
Minimum 4 11 37
Maximum 9 17 49
SD 1.08 2.01 3.25
E66
142

Oregon Standard Setting Grade 3 Reading/LiteratureRound 2 Cut Scores
Table Participant Nearly Meets Meets Exceeds
1 2 199 203 215
1 3 199 203 215
1 10 199 203 215
1 11 199 203 215
1 12 199 204 216
1 19 199 203 215
1 20 199 204 215
2 4 198 201 215
2 5 198 201 216
2 6 198 201 216
2 7 198 202 214
2 8 198 201 216
2 9 198 201 215
3 13 199 203 212
3 14 199 203 212
3 15 199 203 212
3 16 199 203 214
3 17 200 204 214
3 18 199 203 215
Overall Median 199 203 215
Minimum 198 201 212
Maximum 200 204 216
SD 0.56 1.07 1.30
E67
143

Oregon Standard Setting Grade 3 Reading/LiteratureRound 2 Summary of Bookmark Placements
Statistic Table Nearly Meets Meets Exceeds
Median 1 6 16 46
Median 2 5 12 46.5
Median 3 6 16 40.5
Median Overall 6 16 46
Minimum 1 6 16 45
Minimum 2 4 11 42
Minimum 3 6 15 37
Minimum Overall 4 11 37
Maximum 1 7 17 49
Maximum 2 5 14 47
Maximum 3 9 17 44
Maximum Overall 9 17 49
SD 1 0.38 0.49 1.25
SD 2 0.52 0.98 1.94
SD 3 1.22 0.75 2.59
SD Overall 1.08 2.01 3.25
Overall Median 6 16 46
Minimum 4 11 37
Maximum 9 17 49
SD 1.08 2.01 3.25
E68
144

Oregon Standard Setting Grade 3 Reading/LiteratureRound 2 Summary of Cut Scores
Statistic Table Nearly Meets Meets Exceeds
Median 1 199 203 215
Median 2 198 201 216
Median 3 199 203 213
Median Overall 199 203 215
Minimum 1 199 203 215
Minimum 2 198 201 214
Minimum 3 199 203 212
Minimum Overall 198 201 212
Maximum 1 199 204 216
Maximum 2 198 202 216
Maximum 3 200 204 215
Maximum Overall 200 204 216
SD 1 0.00 0.49 0.38
SD 2 0.00 0.41 0.82
SD 3 0.41 0.41 1.33
SD Overall 0.56 1.07 1.30
Overall Median 199 203 215
Minimum 198 201 212
Maximum 200 204 216
SD 0.56 1.07 1.30
E69
145

Oregon Standard Setting Grade 3 Reading/LiteratureRound 2 Median Bookmark Summary
Table Nearly Meets Meets Exceeds1 6 16 462 5 12 46.53 6 16 40.5
Overall 6 16 46
Impact Data
Does NotYet Meet
NearlyMeets
Meets Exceeds
Overall 8.5 7.1 39.0 45.4
E70
146

Oregon Standard Setting Grade 3 Reading/LiteratureRound 3 Bookmark Placements
Table Participant Nearly Meets Meets Exceeds
1 2 6 16 46
1 3 6 16 51
1 10 6 16 46
1 11 6 16 47
1 12 6 22 52
1 19 6 16 45
1 20 7 18 46
2 4 6 16 48
2 5 6 16 47
2 6 6 16 47
2 7 6 16 46
2 8 6 16 47
2 9 6 17 46
3 13 6 16 46
3 14 6 16 46
3 15 6 6 48
3 16 27 37 57
3 17 6 25 55
3 18 6 16 50
Overall Median 6 16 47
Minimum 6 6 45
Maximum 27 37 57
SD 4.81 5.86 3.33
E71
147

Oregon Standard Setting Grade 3 Reading/LiteratureRound 3 Cut Scores
Table Participant Nearly Meets Meets Exceeds
1 2 199 203 215
1 3 199 203 217
1 10 199 203 215
1 11 199 203 216
1 12 199 207 217
1 19 199 203 215
1 20 199 204 215
2 4 199 203 216
2 5 199 203 216
2 6 199 203 216
2 7 199 203 215
2 8 199 203 216
2 9 199 204 215
3 13 199 203 215
3 14 199 203 215
3 15 199 199 216
3 16 208 212 220
3 17 199 208 219
3 18 199 203 216
Overall Median 199 203 216
Minimum 199 199 215
Maximum 208 212 220
SD 2.06 2.65 1.39
E72
148

Oregon Standard Setting Grade 3 Reading/LiteratureRound 3 Summary of Bookmark Placements
Statistic Table Nearly Meets Meets Exceeds
Median 1 6 16 46
Median 2 6 16 47
Median 3 6 16 49
Median Overall 6 16 47
Minimum 1 6 16 45
Minimum 2 6 16 46
Minimum 3 6 6 46
Minimum Overall 6 6 45
Maximum 1 7 22 52
Maximum 2 6 17 48
Maximum 3 27 37 57
Maximum Overall 27 37 57
SD 1 0.38 2.27 2.76
SD 2 0.00 0.41 0.75
SD 3 8.57 10.54 4.68
SD Overall 4.81 5.86 3.33
Overall Median 6 16 47
Minimum 6 6 45
Maximum 27 37 57
SD 4.81 5.86 3.33
E73
149

Oregon Standard Setting Grade 3 Reading/LiteratureRound 3 Summary of Cut Scores
Statistic Table Nearly Meets Meets Exceeds
Median 1 199 203 215
Median 2 199 203 216
Median 3 199 203 216
Median Overall 199 203 216
Minimum 1 199 203 215
Minimum 2 199 203 215
Minimum 3 199 199 215
Minimum Overall 199 199 215
Maximum 1 199 207 217
Maximum 2 199 204 216
Maximum 3 208 212 220
Maximum Overall 208 212 220
SD 1 0.00 1.50 0.95
SD 2 0.00 0.41 0.52
SD 3 3.67 4.59 2.14
SD Overall 2.06 2.65 1.39
Overall Median 199 203 216
Minimum 199 199 215
Maximum 208 212 220
SD 2.06 2.65 1.39
E74
150
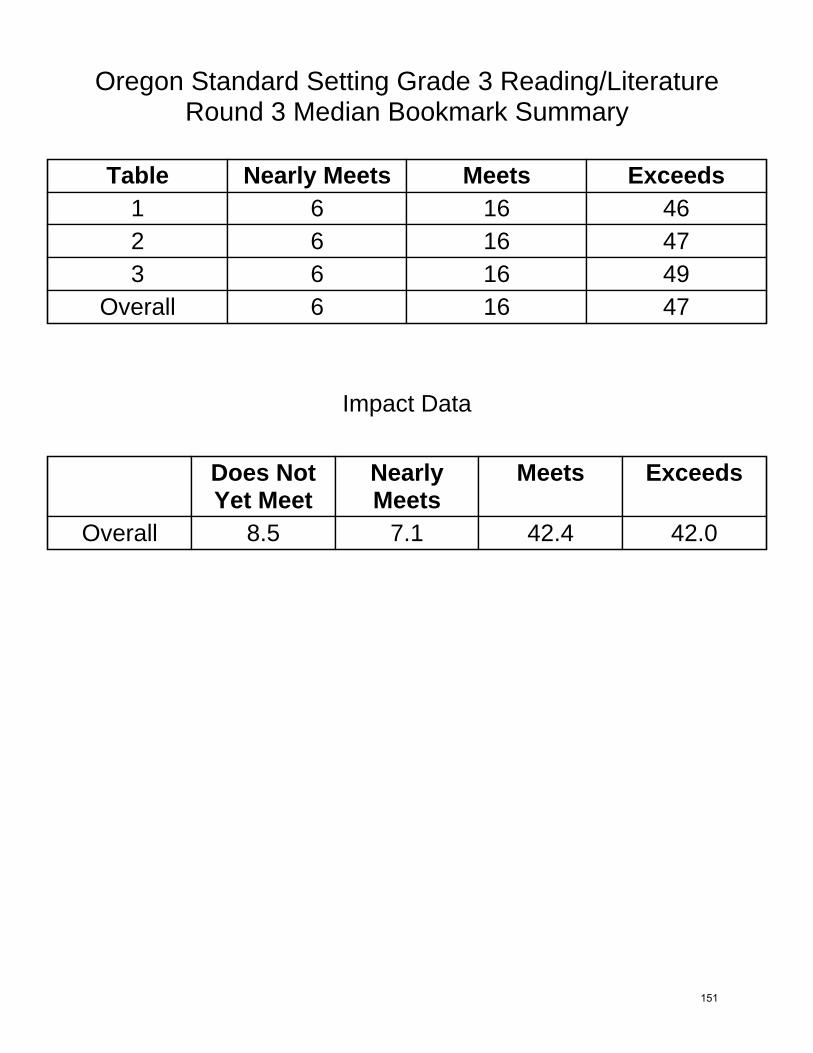
Oregon Standard Setting Grade 3 Reading/LiteratureRound 3 Median Bookmark Summary
Table Nearly Meets Meets Exceeds1 6 16 462 6 16 473 6 16 49
Overall 6 16 47
Impact Data
Does NotYet Meet
NearlyMeets
Meets Exceeds
Overall 8.5 7.1 42.4 42.0
E75
151

Oregon Standard Setting Grade 5 Reading/LiteratureRound 1 Bookmark Placements
Table Participant Nearly Meets Meets Exceeds
1 2 7 20 53
1 3 13 23 58
1 4 23 33 63
1 5 16 32 53
1 6 14 32 56
1 7 14 29 56
2 8 9 20 53
2 9 12 20 48
2 10 9 19 48
2 11 10 20 53
2 12 12 21 51
2 13 12 22 53
2 14 9 13 53
2 15 9 17 47
3 16 12 29 56
3 17 8 21 54
3 18 7 18 49
3 19 13 25 65
3 20 11 29 58
3 22 9 23 57
3 23 14 20 37
3 24 9 26 63
Overall Median 11.5 21.5 53
Minimum 7 13 37
Maximum 23 33 65
SD 3.58 5.40 6.12
E76
152

Oregon Standard Setting Grade 5 Reading/LiteratureRound 1 Cut Scores
Table Participant Nearly Meets Meets Exceeds
1 2 208 216 228
1 3 211 218 231
1 4 218 221 234
1 5 213 221 228
1 6 211 221 229
1 7 211 220 229
2 8 209 216 228
2 9 211 216 226
2 10 209 216 226
2 11 209 216 228
2 12 211 217 227
2 13 211 217 228
2 14 209 211 228
2 15 209 214 226
3 16 211 220 229
3 17 209 217 229
3 18 208 214 227
3 19 211 219 235
3 20 210 220 231
3 22 209 218 230
3 23 211 216 222
3 24 209 219 234
Overall Median 210 217 228
Minimum 208 211 222
Maximum 218 221 235
SD 2.13 2.59 2.96
E77
153

Oregon Standard Setting Grade 5 Reading/LiteratureRound 1 Summary of Bookmark Placements
Statistic Table Nearly Meets Meets Exceeds
Median 1 14 30.5 56
Median 2 9.5 20 52
Median 3 10 24 56.5
Median Overall 11.5 21.5 53
Minimum 1 7 20 53
Minimum 2 9 13 47
Minimum 3 7 18 37
Minimum Overall 7 13 37
Maximum 1 23 33 63
Maximum 2 12 22 53
Maximum 3 14 29 65
Maximum Overall 23 33 65
SD 1 5.17 5.42 3.73
SD 2 1.49 2.83 2.66
SD 3 2.50 4.09 8.77
SD Overall 3.58 5.40 6.12
Overall Median 11.5 21.5 53
Minimum 7 13 37
Maximum 23 33 65
SD 3.58 5.40 6.12
E78
154

Oregon Standard Setting Grade 5 Reading/LiteratureRound 1 Summary of Cut Scores
Statistic Table Nearly Meets Meets Exceeds
Median 1 211 221 229
Median 2 209 216 228
Median 3 210 219 230
Median Overall 210 217 228
Minimum 1 208 216 228
Minimum 2 209 211 226
Minimum 3 208 214 222
Minimum Overall 208 211 222
Maximum 1 218 221 234
Maximum 2 211 217 228
Maximum 3 211 220 235
Maximum Overall 218 221 235
SD 1 3.35 2.07 2.32
SD 2 1.04 2.00 0.99
SD 3 1.16 2.10 4.07
SD Overall 2.13 2.59 2.96
Overall Median 210 217 228
Minimum 208 211 222
Maximum 218 221 235
SD 2.13 2.59 2.96
E79
155

Oregon Standard Setting Grade 5 Reading/LiteratureRound 1 Median Bookmark Summary
Table Nearly Meets Meets Exceeds1 14 30.5 562 9.5 20 523 10 24 56.5
Overall 11.5 21.5 53
Impact Data
Does NotYet Meet
NearlyMeets
Meets Exceeds
Overall 8.8 15.5 43.8 31.9
E80
156

Oregon Standard Setting Grade 5 Reading/LiteratureRound 2 Bookmark Placements
Table Participant Nearly Meets Meets Exceeds
1 2 11 20 58
1 3 13 23 58
1 4 18 33 60
1 5 10 27 53
1 6 14 23 58
1 7 14 29 57
2 8 9 21 56
2 9 10 20 52
2 10 10 20 53
2 11 10 20 51
2 12 11 21 51
2 13 11 20 54
2 14 9 17 53
2 15 9 20 53
3 16 11 27 57
3 17 10 22 56
3 18 9 19 49
3 19 10 25 58
3 20 11 29 58
3 22 10 23 57
3 23 11 26 55
3 24 10 26 63
Overall Median 10 22.5 56
Minimum 9 17 49
Maximum 18 33 63
SD 2.13 4.02 3.36
E81
157
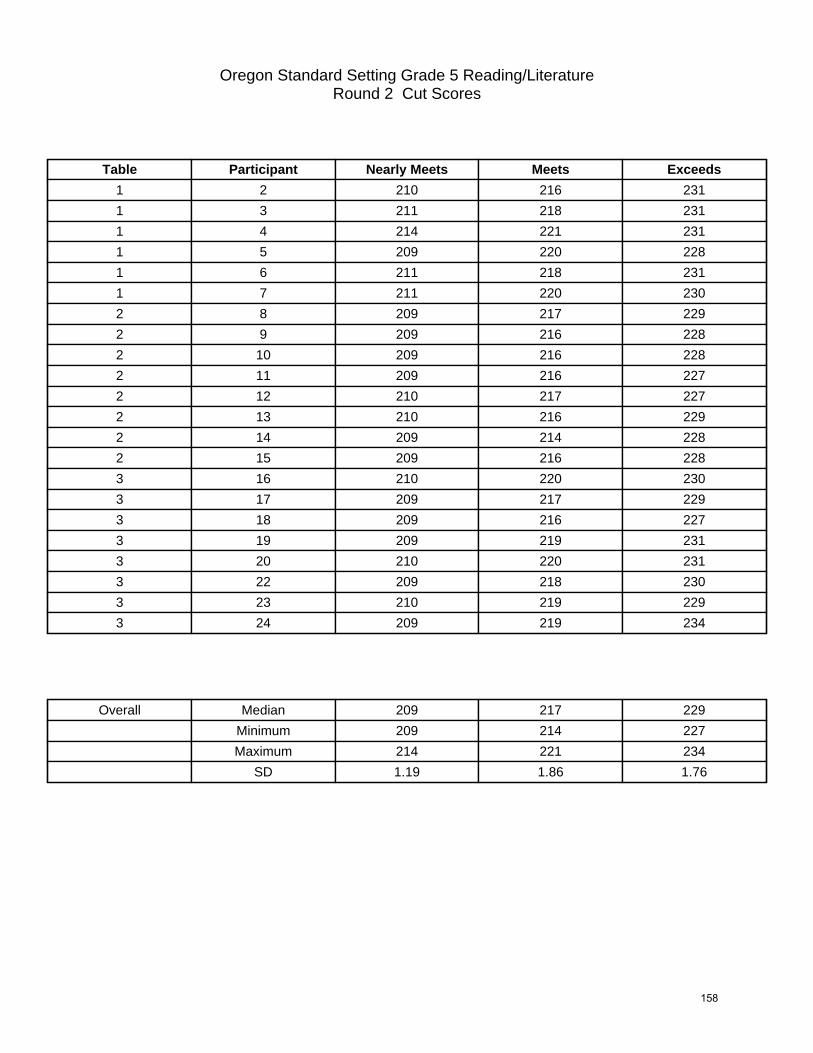
Oregon Standard Setting Grade 5 Reading/LiteratureRound 2 Cut Scores
Table Participant Nearly Meets Meets Exceeds
1 2 210 216 231
1 3 211 218 231
1 4 214 221 231
1 5 209 220 228
1 6 211 218 231
1 7 211 220 230
2 8 209 217 229
2 9 209 216 228
2 10 209 216 228
2 11 209 216 227
2 12 210 217 227
2 13 210 216 229
2 14 209 214 228
2 15 209 216 228
3 16 210 220 230
3 17 209 217 229
3 18 209 216 227
3 19 209 219 231
3 20 210 220 231
3 22 209 218 230
3 23 210 219 229
3 24 209 219 234
Overall Median 209 217 229
Minimum 209 214 227
Maximum 214 221 234
SD 1.19 1.86 1.76
E82
158

Oregon Standard Setting Grade 5 Reading/LiteratureRound 2 Summary of Bookmark Placements
Statistic Table Nearly Meets Meets Exceeds
Median 1 13.5 25 58
Median 2 10 20 53
Median 3 10 25.5 57
Median Overall 10 22.5 56
Minimum 1 10 20 53
Minimum 2 9 17 51
Minimum 3 9 19 49
Minimum Overall 9 17 49
Maximum 1 18 33 60
Maximum 2 11 21 56
Maximum 3 11 29 63
Maximum Overall 18 33 63
SD 1 2.80 4.75 2.34
SD 2 0.83 1.25 1.64
SD 3 0.71 3.16 3.89
SD Overall 2.13 4.02 3.36
Overall Median 10 22.5 56
Minimum 9 17 49
Maximum 18 33 63
SD 2.13 4.02 3.36
E83
159

Oregon Standard Setting Grade 5 Reading/LiteratureRound 2 Summary of Cut Scores
Statistic Table Nearly Meets Meets Exceeds
Median 1 211 219 231
Median 2 209 216 228
Median 3 209 219 230
Median Overall 209 217 229
Minimum 1 209 216 228
Minimum 2 209 214 227
Minimum 3 209 216 227
Minimum Overall 209 214 227
Maximum 1 214 221 231
Maximum 2 210 217 229
Maximum 3 210 220 234
Maximum Overall 214 221 234
SD 1 1.67 1.83 1.21
SD 2 0.46 0.93 0.76
SD 3 0.52 1.41 2.03
SD Overall 1.19 1.86 1.76
Overall Median 209 217 229
Minimum 209 214 227
Maximum 214 221 234
SD 1.19 1.86 1.76
E84
160

Oregon Standard Setting Grade 5 Reading/LiteratureRound 2 Median Bookmark Summary
Table Nearly Meets Meets Exceeds1 13.5 25 582 10 20 533 10 25.5 57
Overall 10 22.5 56
Impact Data
Does NotYet Meet
NearlyMeets
Meets Exceeds
Overall 7.7 16.6 47.1 28.6
E85
161

Oregon Standard Setting Grade 5 Reading/LiteratureRound 3 Bookmark Placements
Table Participant Nearly Meets Meets Exceeds
1 2 11 20 58
1 3 12 23 58
1 4 18 31 61
1 5 10 25 53
1 6 14 25 58
1 7 11 29 58
2 8 10 23 56
2 9 10 21 56
2 10 10 20 56
2 11 10 22 56
2 12 11 21 53
2 13 10 21 55
2 14 9 17 53
2 15 9 20 56
3 16 11 27 58
3 17 10 22 57
3 18 10 22 53
3 19 10 23 58
3 20 13 26 58
3 22 10 23 57
3 23 14 23 61
3 24 10 26 63
Overall Median 10 23 57
Minimum 9 17 53
Maximum 18 31 63
SD 2.08 3.23 2.65
E86
162

Oregon Standard Setting Grade 5 Reading/LiteratureRound 3 Cut Scores
Table Participant Nearly Meets Meets Exceeds
1 2 210 216 231
1 3 211 218 231
1 4 214 221 231
1 5 209 219 228
1 6 211 219 231
1 7 210 220 231
2 8 209 218 229
2 9 209 217 229
2 10 209 216 229
2 11 209 217 229
2 12 210 217 228
2 13 209 217 229
2 14 209 214 228
2 15 209 216 229
3 16 210 220 231
3 17 209 217 230
3 18 209 217 228
3 19 209 218 231
3 20 211 219 231
3 22 209 218 230
3 23 211 218 231
3 24 209 219 234
Overall Median 209 218 230
Minimum 209 214 228
Maximum 214 221 234
SD 1.23 1.60 1.50
E87
163
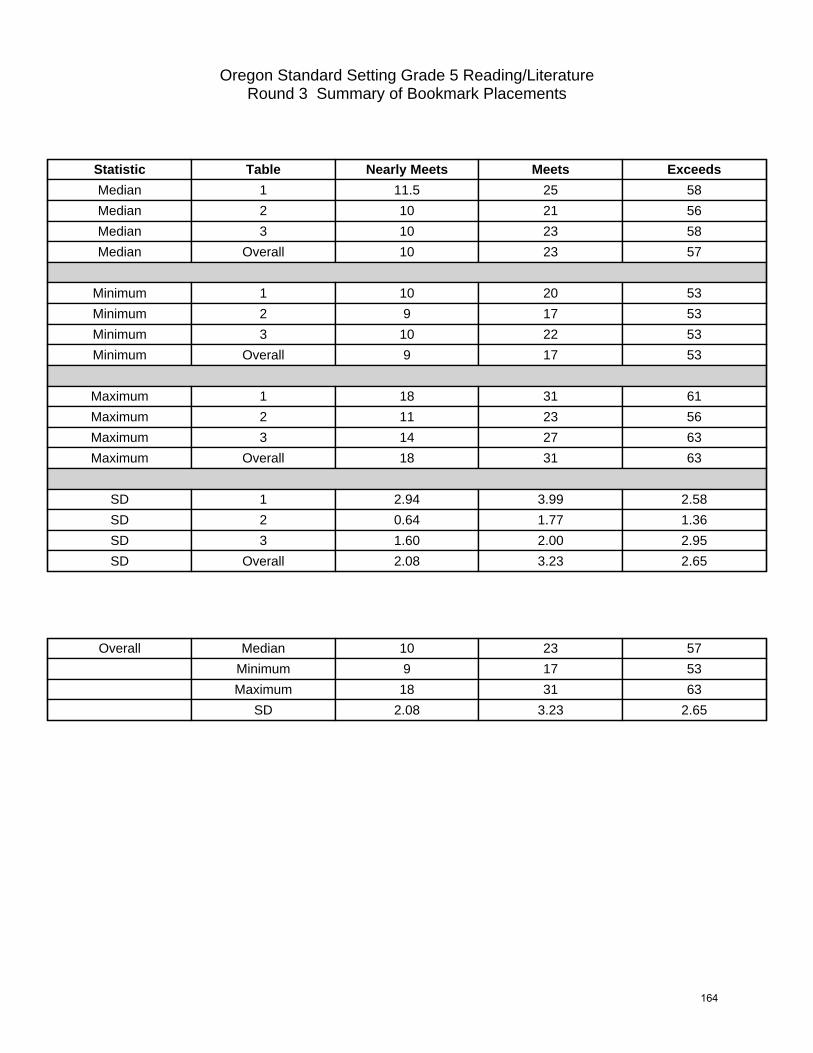
Oregon Standard Setting Grade 5 Reading/LiteratureRound 3 Summary of Bookmark Placements
Statistic Table Nearly Meets Meets Exceeds
Median 1 11.5 25 58
Median 2 10 21 56
Median 3 10 23 58
Median Overall 10 23 57
Minimum 1 10 20 53
Minimum 2 9 17 53
Minimum 3 10 22 53
Minimum Overall 9 17 53
Maximum 1 18 31 61
Maximum 2 11 23 56
Maximum 3 14 27 63
Maximum Overall 18 31 63
SD 1 2.94 3.99 2.58
SD 2 0.64 1.77 1.36
SD 3 1.60 2.00 2.95
SD Overall 2.08 3.23 2.65
Overall Median 10 23 57
Minimum 9 17 53
Maximum 18 31 63
SD 2.08 3.23 2.65
E88
164

Oregon Standard Setting Grade 5 Reading/LiteratureRound 3 Summary of Cut Scores
Statistic Table Nearly Meets Meets Exceeds
Median 1 211 219 231
Median 2 209 217 229
Median 3 209 218 231
Median Overall 209 218 230
Minimum 1 209 216 228
Minimum 2 209 214 228
Minimum 3 209 217 228
Minimum Overall 209 214 228
Maximum 1 214 221 231
Maximum 2 210 218 229
Maximum 3 211 220 234
Maximum Overall 214 221 234
SD 1 1.72 1.72 1.22
SD 2 0.35 1.20 0.46
SD 3 0.92 1.04 1.67
SD Overall 1.23 1.60 1.50
Overall Median 209 218 230
Minimum 209 214 228
Maximum 214 221 234
SD 1.23 1.60 1.50
E89
165

Oregon Standard Setting Grade 5 Reading/LiteratureRound 3 Median Bookmark Summary
Table Nearly Meets Meets Exceeds1 11.5 25 582 10 21 563 10 23 58
Overall 10 23 57
Impact Data
Does NotYet Meet
NearlyMeets
Meets Exceeds
Overall 7.7 20.9 45.8 25.6
E90
166

Oregon Standard Setting Grade 8 Reading/LiteratureRound 1 Bookmark Placements
Table Participant Nearly Meets Meets Exceeds
1 3 15 36 52
1 4 17 28 47
1 5 11 29 41
1 6 14 28 46
1 7 12 28 48
2 2 10 25 43
2 8 17 33 48
2 9 17 29 52
2 10 15 33 48
2 11 19 36 56
2 12 20 36 56
2 13 20 35 50
2 14 17 34 48
3 15 15 27 46
3 16 17 31 42
3 17 16 31 47
3 18 19 28 49
3 19 11 26 43
3 20 17 28 45
3 22 18 28 43
Overall Median 17 29 47.5
Minimum 10 25 41
Maximum 20 36 56
SD 2.98 3.56 4.22
E91
167

Oregon Standard Setting Grade 8 Reading/LiteratureRound 1 Cut Scores
Table Participant Nearly Meets Meets Exceeds
1 3 223 234 241
1 4 224 230 239
1 5 220 230 236
1 6 222 230 238
1 7 221 230 239
2 2 220 228 237
2 8 224 232 239
2 9 224 230 241
2 10 223 232 239
2 11 225 234 242
2 12 226 234 242
2 13 226 233 240
2 14 224 233 239
3 15 223 229 238
3 16 224 231 237
3 17 224 231 239
3 18 225 230 239
3 19 220 228 237
3 20 224 230 238
3 22 225 230 237
Overall Median 224 230 239
Minimum 220 228 236
Maximum 226 234 242
SD 1.87 1.88 1.69
E92
168
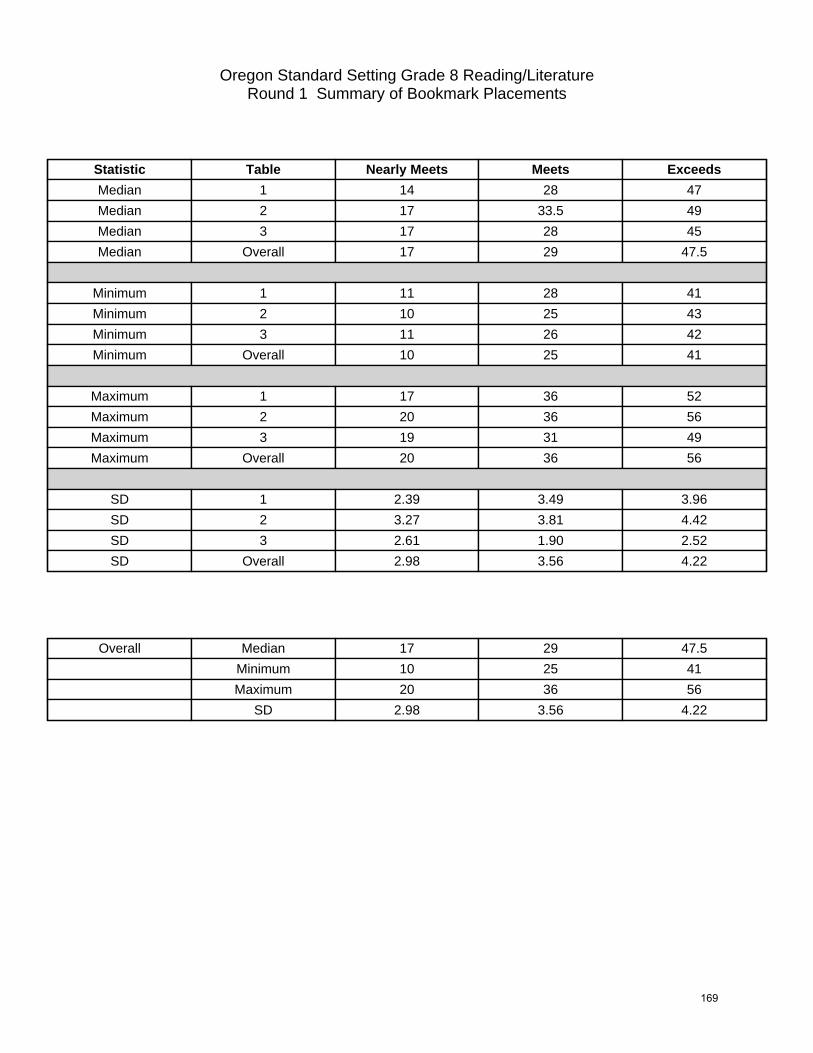
Oregon Standard Setting Grade 8 Reading/LiteratureRound 1 Summary of Bookmark Placements
Statistic Table Nearly Meets Meets Exceeds
Median 1 14 28 47
Median 2 17 33.5 49
Median 3 17 28 45
Median Overall 17 29 47.5
Minimum 1 11 28 41
Minimum 2 10 25 43
Minimum 3 11 26 42
Minimum Overall 10 25 41
Maximum 1 17 36 52
Maximum 2 20 36 56
Maximum 3 19 31 49
Maximum Overall 20 36 56
SD 1 2.39 3.49 3.96
SD 2 3.27 3.81 4.42
SD 3 2.61 1.90 2.52
SD Overall 2.98 3.56 4.22
Overall Median 17 29 47.5
Minimum 10 25 41
Maximum 20 36 56
SD 2.98 3.56 4.22
E93
169

Oregon Standard Setting Grade 8 Reading/LiteratureRound 1 Summary of Cut Scores
Statistic Table Nearly Meets Meets Exceeds
Median 1 222 230 239
Median 2 224 233 240
Median 3 224 230 238
Median Overall 224 230 239
Minimum 1 220 230 236
Minimum 2 220 228 237
Minimum 3 220 228 237
Minimum Overall 220 228 236
Maximum 1 224 234 241
Maximum 2 226 234 242
Maximum 3 225 231 239
Maximum Overall 226 234 242
SD 1 1.58 1.79 1.82
SD 2 1.93 2.07 1.73
SD 3 1.72 1.07 0.90
SD Overall 1.87 1.88 1.69
Overall Median 224 230 239
Minimum 220 228 236
Maximum 226 234 242
SD 1.87 1.88 1.69
E94
170

Oregon Standard Setting Grade 8 Reading/LiteratureRound 1 Median Bookmark Summary
Table Nearly Meets Meets Exceeds1 14 28 472 17 33.5 493 17 28 45
Overall 17 29 47.5
Impact Data
Does NotYet Meet
NearlyMeets
Meets Exceeds
Overall 15.9 15.2 40.0 28.9
E95
171
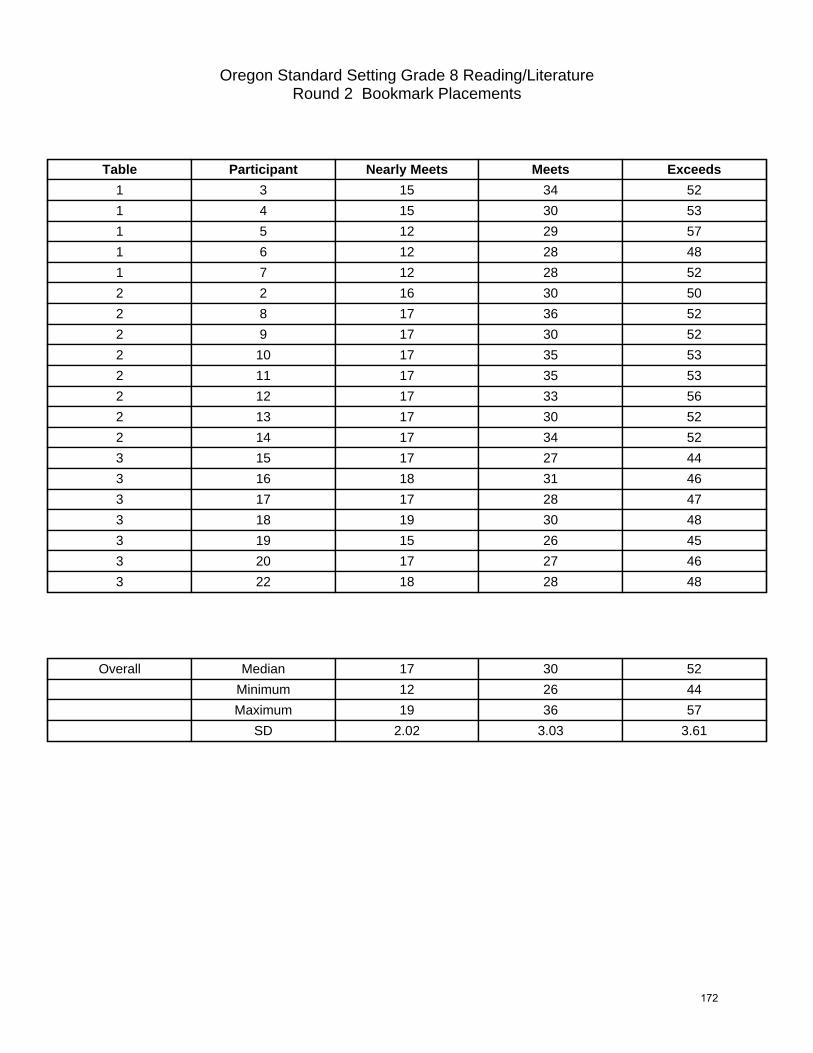
Oregon Standard Setting Grade 8 Reading/LiteratureRound 2 Bookmark Placements
Table Participant Nearly Meets Meets Exceeds
1 3 15 34 52
1 4 15 30 53
1 5 12 29 57
1 6 12 28 48
1 7 12 28 52
2 2 16 30 50
2 8 17 36 52
2 9 17 30 52
2 10 17 35 53
2 11 17 35 53
2 12 17 33 56
2 13 17 30 52
2 14 17 34 52
3 15 17 27 44
3 16 18 31 46
3 17 17 28 47
3 18 19 30 48
3 19 15 26 45
3 20 17 27 46
3 22 18 28 48
Overall Median 17 30 52
Minimum 12 26 44
Maximum 19 36 57
SD 2.02 3.03 3.61
E96
172

Oregon Standard Setting Grade 8 Reading/LiteratureRound 2 Cut Scores
Table Participant Nearly Meets Meets Exceeds
1 3 223 233 241
1 4 223 231 241
1 5 221 230 242
1 6 221 230 239
1 7 221 230 241
2 2 224 231 240
2 8 224 234 241
2 9 224 231 241
2 10 224 233 241
2 11 224 233 241
2 12 224 232 242
2 13 224 231 241
2 14 224 233 241
3 15 224 229 237
3 16 225 231 238
3 17 224 230 239
3 18 225 231 239
3 19 223 228 238
3 20 224 229 238
3 22 225 230 239
Overall Median 224 231 241
Minimum 221 228 237
Maximum 225 234 242
SD 1.23 1.59 1.49
E97
173

Oregon Standard Setting Grade 8 Reading/LiteratureRound 2 Summary of Bookmark Placements
Statistic Table Nearly Meets Meets Exceeds
Median 1 12 29 52
Median 2 17 33.5 52
Median 3 17 28 46
Median Overall 17 30 52
Minimum 1 12 28 48
Minimum 2 16 30 50
Minimum 3 15 26 44
Minimum Overall 12 26 44
Maximum 1 15 34 57
Maximum 2 17 36 56
Maximum 3 19 31 48
Maximum Overall 19 36 57
SD 1 1.64 2.49 3.21
SD 2 0.35 2.53 1.69
SD 3 1.25 1.77 1.50
SD Overall 2.02 3.03 3.61
Overall Median 17 30 52
Minimum 12 26 44
Maximum 19 36 57
SD 2.02 3.03 3.61
E98
174

Oregon Standard Setting Grade 8 Reading/LiteratureRound 2 Summary of Cut Scores
Statistic Table Nearly Meets Meets Exceeds
Median 1 221 230 241
Median 2 224 233 241
Median 3 224 230 238
Median Overall 224 231 241
Minimum 1 221 230 239
Minimum 2 224 231 240
Minimum 3 223 228 237
Minimum Overall 221 228 237
Maximum 1 223 233 242
Maximum 2 224 234 242
Maximum 3 225 231 239
Maximum Overall 225 234 242
SD 1 1.10 1.30 1.10
SD 2 0.00 1.16 0.53
SD 3 0.76 1.11 0.76
SD Overall 1.23 1.59 1.49
Overall Median 224 231 241
Minimum 221 228 237
Maximum 225 234 242
SD 1.23 1.59 1.49
E99
175

Oregon Standard Setting Grade 8 Reading/LiteratureRound 2 Median Bookmark Summary
Table Nearly Meets Meets Exceeds1 12 29 522 17 33.5 523 17 28 46
Overall 17 30 52
Impact Data
Does NotYet Meet
NearlyMeets
Meets Exceeds
Overall 15.9 18.6 43.9 21.6
E100
176

Oregon Standard Setting Grade 8 Reading/LiteratureRound 3 Bookmark Placements
Table Participant Nearly Meets Meets Exceeds
1 3 15 36 52
1 4 15 28 47
1 5 13 28 52
1 6 15 29 49
1 7 15 28 52
2 2 17 29 52
2 8 17 33 52
2 9 17 30 52
2 10 15 34 52
2 11 17 35 53
2 12 17 33 52
2 13 17 30 52
2 14 17 32 52
3 15 17 27 48
3 16 17 31 48
3 17 17 30 47
3 18 17 29 50
3 19 15 26 46
3 20 17 28 46
3 22 18 28 49
Overall Median 17 29.5 52
Minimum 13 26 46
Maximum 18 36 53
SD 1.25 2.78 2.39
E101
177

Oregon Standard Setting Grade 8 Reading/LiteratureRound 3 Cut Scores
Table Participant Nearly Meets Meets Exceeds
1 3 223 234 241
1 4 223 230 239
1 5 222 230 241
1 6 223 230 239
1 7 223 230 241
2 2 224 230 241
2 8 224 232 241
2 9 224 231 241
2 10 223 233 241
2 11 224 233 241
2 12 224 232 241
2 13 224 231 241
2 14 224 232 241
3 15 224 229 239
3 16 224 231 239
3 17 224 231 239
3 18 224 230 240
3 19 223 228 238
3 20 224 230 238
3 22 225 230 239
Overall Median 224 230 241
Minimum 222 228 238
Maximum 225 234 241
SD 0.67 1.46 1.15
E102
178

Oregon Standard Setting Grade 8 Reading/LiteratureRound 3 Summary of Bookmark Placements
Statistic Table Nearly Meets Meets Exceeds
Median 1 15 28 52
Median 2 17 32.5 52
Median 3 17 28 48
Median Overall 17 29.5 52
Minimum 1 13 28 47
Minimum 2 15 29 52
Minimum 3 15 26 46
Minimum Overall 13 26 46
Maximum 1 15 36 52
Maximum 2 17 35 53
Maximum 3 18 31 50
Maximum Overall 18 36 53
SD 1 0.89 3.49 2.30
SD 2 0.71 2.14 0.35
SD 3 0.90 1.72 1.50
SD Overall 1.25 2.78 2.39
Overall Median 17 29.5 52
Minimum 13 26 46
Maximum 18 36 53
SD 1.25 2.78 2.39
E103
179

Oregon Standard Setting Grade 8 Reading/LiteratureRound 3 Summary of Cut Scores
Statistic Table Nearly Meets Meets Exceeds
Median 1 223 230 241
Median 2 224 232 241
Median 3 224 230 239
Median Overall 224 230 241
Minimum 1 222 230 239
Minimum 2 223 230 241
Minimum 3 223 228 238
Minimum Overall 222 228 238
Maximum 1 223 234 241
Maximum 2 224 233 241
Maximum 3 225 231 240
Maximum Overall 225 234 241
SD 1 0.45 1.79 1.10
SD 2 0.35 1.04 0.00
SD 3 0.58 1.07 0.69
SD Overall 0.67 1.46 1.15
Overall Median 224 230 241
Minimum 222 228 238
Maximum 225 234 241
SD 0.67 1.46 1.15
E104
180

Oregon Standard Setting Grade 8 Reading/LiteratureRound 3 Median Bookmark Summary
Table Nearly Meets Meets Exceeds1 15 28 522 17 32.5 523 17 28 48
Overall 17 29.5 52
Impact Data
Does NotYet Meet
NearlyMeets
Meets Exceeds
Overall 15.9 15.2 47.4 21.5
E105
181
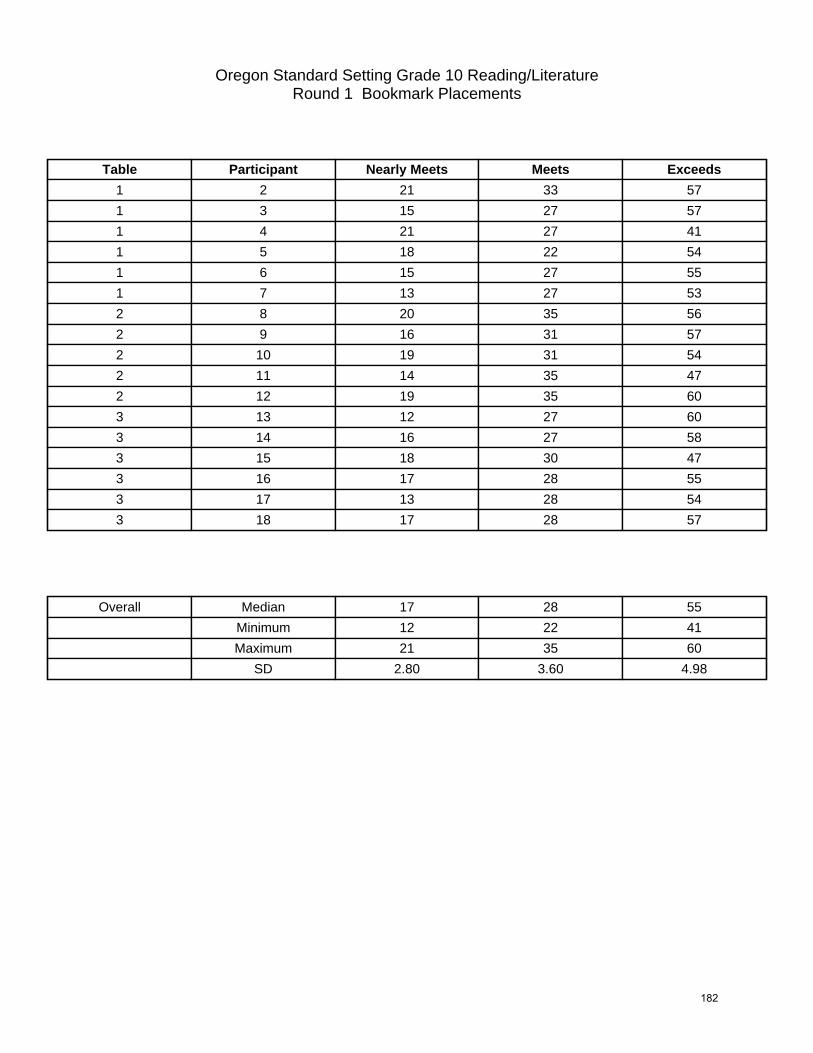
Oregon Standard Setting Grade 10 Reading/LiteratureRound 1 Bookmark Placements
Table Participant Nearly Meets Meets Exceeds
1 2 21 33 57
1 3 15 27 57
1 4 21 27 41
1 5 18 22 54
1 6 15 27 55
1 7 13 27 53
2 8 20 35 56
2 9 16 31 57
2 10 19 31 54
2 11 14 35 47
2 12 19 35 60
3 13 12 27 60
3 14 16 27 58
3 15 18 30 47
3 16 17 28 55
3 17 13 28 54
3 18 17 28 57
Overall Median 17 28 55
Minimum 12 22 41
Maximum 21 35 60
SD 2.80 3.60 4.98
E106
182
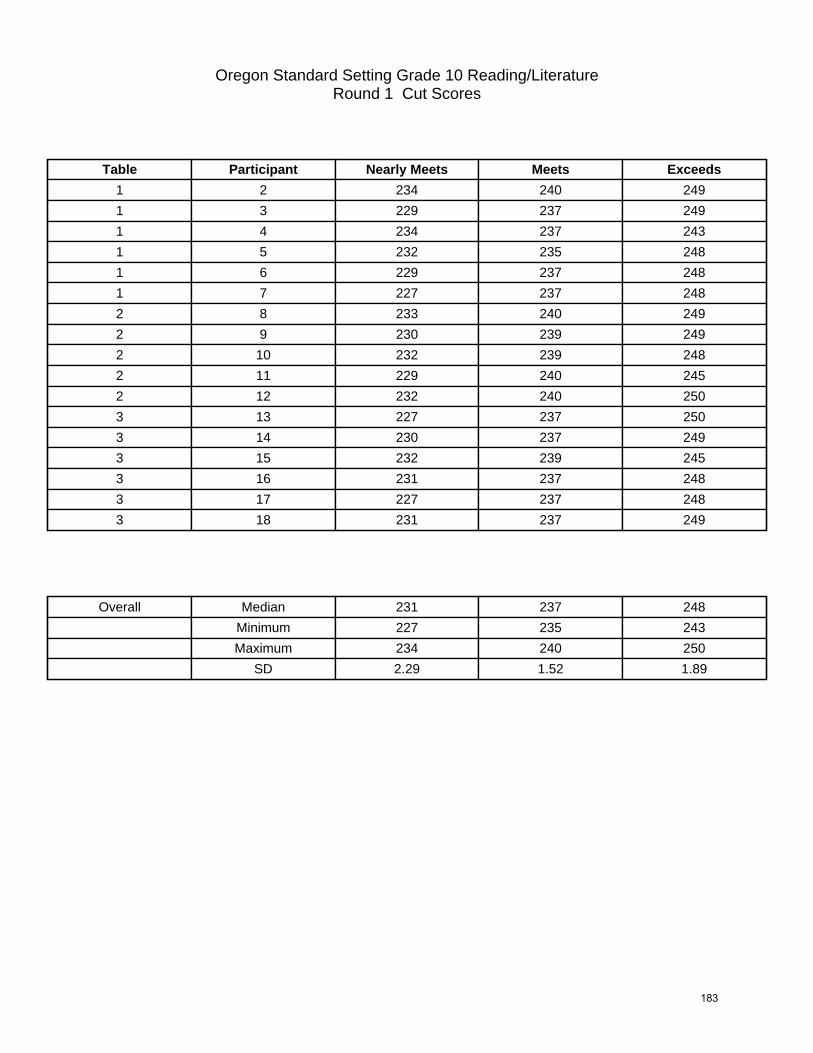
Oregon Standard Setting Grade 10 Reading/LiteratureRound 1 Cut Scores
Table Participant Nearly Meets Meets Exceeds
1 2 234 240 249
1 3 229 237 249
1 4 234 237 243
1 5 232 235 248
1 6 229 237 248
1 7 227 237 248
2 8 233 240 249
2 9 230 239 249
2 10 232 239 248
2 11 229 240 245
2 12 232 240 250
3 13 227 237 250
3 14 230 237 249
3 15 232 239 245
3 16 231 237 248
3 17 227 237 248
3 18 231 237 249
Overall Median 231 237 248
Minimum 227 235 243
Maximum 234 240 250
SD 2.29 1.52 1.89
E107
183

Oregon Standard Setting Grade 10 Reading/LiteratureRound 1 Summary of Bookmark Placements
Statistic Table Nearly Meets Meets Exceeds
Median 1 16.5 27 54.5
Median 2 19 35 56
Median 3 16.5 28 56
Median Overall 17 28 55
Minimum 1 13 22 41
Minimum 2 14 31 47
Minimum 3 12 27 47
Minimum Overall 12 22 41
Maximum 1 21 33 57
Maximum 2 20 35 60
Maximum 3 18 30 60
Maximum Overall 21 35 60
SD 1 3.37 3.49 6.01
SD 2 2.51 2.19 4.87
SD 3 2.43 1.10 4.54
SD Overall 2.80 3.60 4.98
Overall Median 17 28 55
Minimum 12 22 41
Maximum 21 35 60
SD 2.80 3.60 4.98
E108
184

Oregon Standard Setting Grade 10 Reading/LiteratureRound 1 Summary of Cut Scores
Statistic Table Nearly Meets Meets Exceeds
Median 1 231 237 248
Median 2 232 240 249
Median 3 231 237 249
Median Overall 231 237 248
Minimum 1 227 235 243
Minimum 2 229 239 245
Minimum 3 227 237 245
Minimum Overall 227 235 243
Maximum 1 234 240 249
Maximum 2 233 240 250
Maximum 3 232 239 250
Maximum Overall 234 240 250
SD 1 2.93 1.60 2.26
SD 2 1.64 0.55 1.92
SD 3 2.16 0.82 1.72
SD Overall 2.29 1.52 1.89
Overall Median 231 237 248
Minimum 227 235 243
Maximum 234 240 250
SD 2.29 1.52 1.89
E109
185

Oregon Standard Setting Grade 10 Reading/LiteratureRound 1 Median Bookmark Summary
Table Nearly Meets Meets Exceeds1 16.5 27 54.52 19 35 563 16.5 28 56
Overall 17 28 55
Impact Data
Does NotYet Meet
NearlyMeets
Meets Exceeds
Overall 21.3 17.5 44.2 17.0
E110
186

Oregon Standard Setting Grade 10 Reading/LiteratureRound 2 Bookmark Placements
Table Participant Nearly Meets Meets Exceeds
1 2 21 33 57
1 3 16 29 57
1 4 15 25 46
1 5 20 24 56
1 6 15 25 45
1 7 14 26 52
2 8 20 31 53
2 9 20 33 57
2 10 20 31 57
2 11 14 32 59
2 12 19 35 57
3 13 14 27 51
3 14 17 28 58
3 15 17 28 53
3 16 17 27 55
3 17 16 28 55
3 18 17 18 56
Overall Median 17 28 56
Minimum 14 18 45
Maximum 21 35 59
SD 2.40 4.13 3.98
E111
187

Oregon Standard Setting Grade 10 Reading/LiteratureRound 2 Cut Scores
Table Participant Nearly Meets Meets Exceeds
1 2 234 240 249
1 3 230 239 249
1 4 229 236 245
1 5 233 236 249
1 6 229 236 245
1 7 229 236 247
2 8 233 239 248
2 9 233 240 249
2 10 233 239 249
2 11 229 240 250
2 12 232 240 249
3 13 229 237 247
3 14 231 237 249
3 15 231 237 248
3 16 231 237 248
3 17 230 237 248
3 18 231 232 249
Overall Median 231 237 249
Minimum 229 232 245
Maximum 234 240 250
SD 1.73 2.12 1.41
E112
188

Oregon Standard Setting Grade 10 Reading/LiteratureRound 2 Summary of Bookmark Placements
Statistic Table Nearly Meets Meets Exceeds
Median 1 15.5 25.5 54
Median 2 20 32 57
Median 3 17 27.5 55
Median Overall 17 28 56
Minimum 1 14 24 45
Minimum 2 14 31 53
Minimum 3 14 18 51
Minimum Overall 14 18 45
Maximum 1 21 33 57
Maximum 2 20 35 59
Maximum 3 17 28 58
Maximum Overall 21 35 59
SD 1 2.93 3.41 5.49
SD 2 2.61 1.67 2.19
SD 3 1.21 3.95 2.42
SD Overall 2.40 4.13 3.98
Overall Median 17 28 56
Minimum 14 18 45
Maximum 21 35 59
SD 2.40 4.13 3.98
E113
189

Oregon Standard Setting Grade 10 Reading/LiteratureRound 2 Summary of Cut Scores
Statistic Table Nearly Meets Meets Exceeds
Median 1 230 236 248
Median 2 233 240 249
Median 3 231 237 248
Median Overall 231 237 249
Minimum 1 229 236 245
Minimum 2 229 239 248
Minimum 3 229 232 247
Minimum Overall 229 232 245
Maximum 1 234 240 249
Maximum 2 233 240 250
Maximum 3 231 237 249
Maximum Overall 234 240 250
SD 1 2.25 1.83 1.97
SD 2 1.73 0.55 0.71
SD 3 0.84 2.04 0.75
SD Overall 1.73 2.12 1.41
Overall Median 231 237 249
Minimum 229 232 245
Maximum 234 240 250
SD 1.73 2.12 1.41
E114
190

Oregon Standard Setting Grade 10 Reading/LiteratureRound 2 Median Bookmark Summary
Table Nearly Meets Meets Exceeds1 15.5 25.5 542 20 32 573 17 27.5 55
Overall 17 28 56
Impact Data
Does NotYet Meet
NearlyMeets
Meets Exceeds
Overall 21.3 17.5 46.7 14.5
E115
191

Oregon Standard Setting Grade 10 Reading/LiteratureRound 3 Bookmark Placements
Table Participant Nearly Meets Meets Exceeds
1 2 21 33 57
1 3 16 26 55
1 4 15 25 55
1 5 18 25 54
1 6 15 25 46
1 7 14 24 50
2 8 20 31 53
2 9 20 33 57
2 10 19 27 54
2 11 20 27 59
2 12 17 26 56
3 13 14 27 51
3 14 17 27 58
3 15 14 26 43
3 16 17 26 55
3 17 16 28 55
3 18 17 26 56
Overall Median 17 26 55
Minimum 14 24 43
Maximum 21 33 59
SD 2.30 2.67 4.19
E116
192
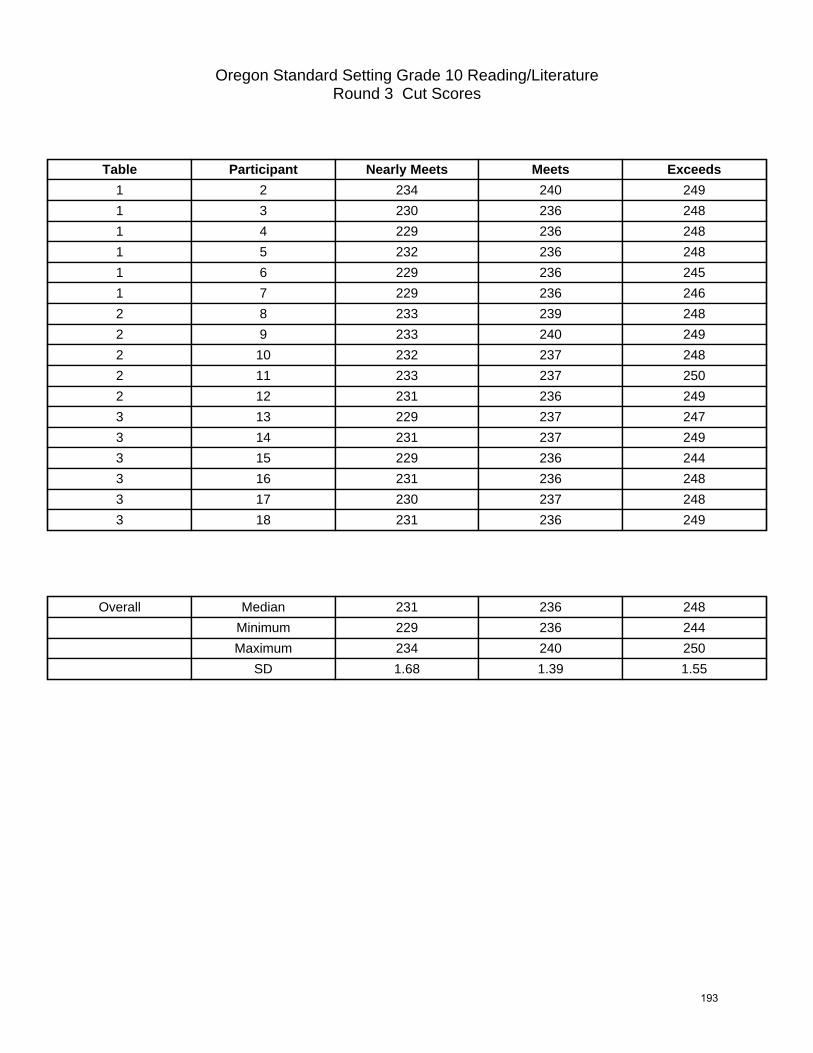
Oregon Standard Setting Grade 10 Reading/LiteratureRound 3 Cut Scores
Table Participant Nearly Meets Meets Exceeds
1 2 234 240 249
1 3 230 236 248
1 4 229 236 248
1 5 232 236 248
1 6 229 236 245
1 7 229 236 246
2 8 233 239 248
2 9 233 240 249
2 10 232 237 248
2 11 233 237 250
2 12 231 236 249
3 13 229 237 247
3 14 231 237 249
3 15 229 236 244
3 16 231 236 248
3 17 230 237 248
3 18 231 236 249
Overall Median 231 236 248
Minimum 229 236 244
Maximum 234 240 250
SD 1.68 1.39 1.55
E117
193

Oregon Standard Setting Grade 10 Reading/LiteratureRound 3 Summary of Bookmark Placements
Statistic Table Nearly Meets Meets Exceeds
Median 1 15.5 25 54.5
Median 2 20 27 56
Median 3 16.5 26.5 55
Median Overall 17 26 55
Minimum 1 14 24 46
Minimum 2 17 26 53
Minimum 3 14 26 43
Minimum Overall 14 24 43
Maximum 1 21 33 57
Maximum 2 20 33 59
Maximum 3 17 28 58
Maximum Overall 21 33 59
SD 1 2.59 3.33 4.07
SD 2 1.30 3.03 2.39
SD 3 1.47 0.82 5.40
SD Overall 2.30 2.67 4.19
Overall Median 17 26 55
Minimum 14 24 43
Maximum 21 33 59
SD 2.30 2.67 4.19
E118
194

Oregon Standard Setting Grade 10 Reading/LiteratureRound 3 Summary of Cut Scores
Statistic Table Nearly Meets Meets Exceeds
Median 1 230 236 248
Median 2 233 237 249
Median 3 231 237 248
Median Overall 231 236 248
Minimum 1 229 236 245
Minimum 2 231 236 248
Minimum 3 229 236 244
Minimum Overall 229 236 244
Maximum 1 234 240 249
Maximum 2 233 240 250
Maximum 3 231 237 249
Maximum Overall 234 240 250
SD 1 2.07 1.63 1.51
SD 2 0.89 1.64 0.84
SD 3 0.98 0.55 1.87
SD Overall 1.68 1.39 1.55
Overall Median 231 236 248
Minimum 229 236 244
Maximum 234 240 250
SD 1.68 1.39 1.55
E119
195

Oregon Standard Setting Grade 10 Reading/LiteratureRound 3 Median Bookmark Summary
Table Nearly Meets Meets Exceeds1 15.5 25 54.52 20 27 563 16.5 26.5 55
Overall 17 26 55
Impact Data
Does NotYet Meet
NearlyMeets
Meets Exceeds
Overall 21.3 14.2 47.6 16.9
E120
196
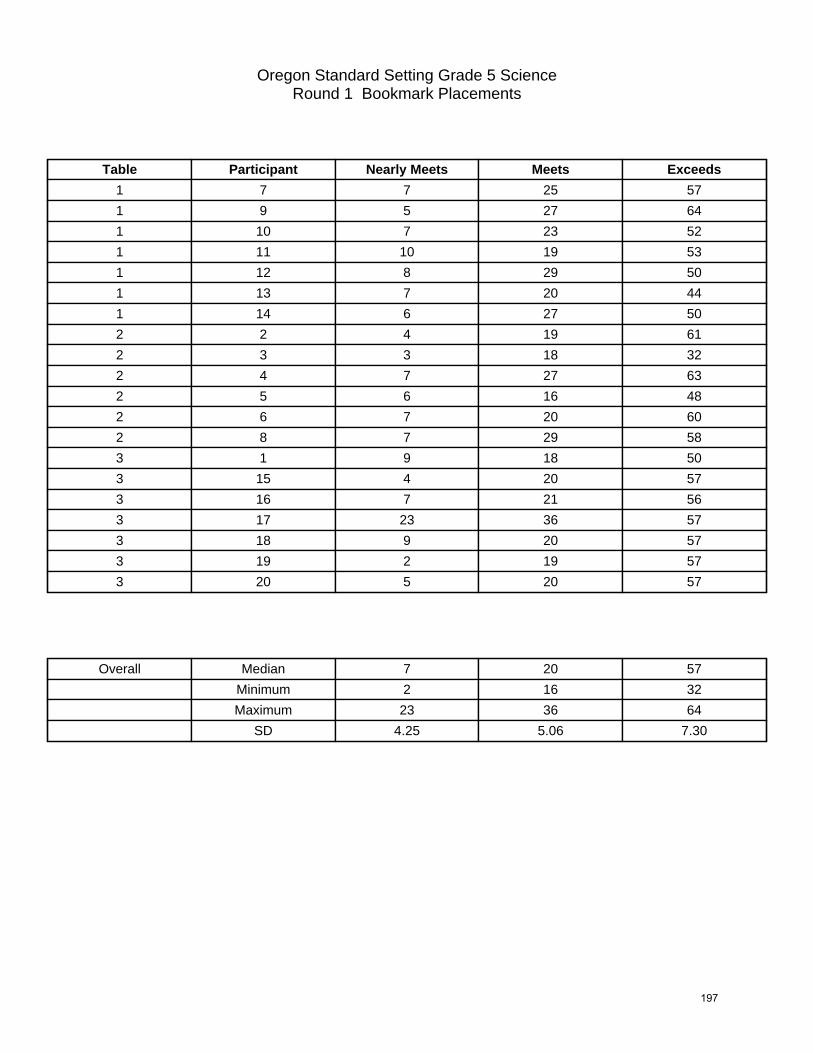
Oregon Standard Setting Grade 5 ScienceRound 1 Bookmark Placements
Table Participant Nearly Meets Meets Exceeds
1 7 7 25 57
1 9 5 27 64
1 10 7 23 52
1 11 10 19 53
1 12 8 29 50
1 13 7 20 44
1 14 6 27 50
2 2 4 19 61
2 3 3 18 32
2 4 7 27 63
2 5 6 16 48
2 6 7 20 60
2 8 7 29 58
3 1 9 18 50
3 15 4 20 57
3 16 7 21 56
3 17 23 36 57
3 18 9 20 57
3 19 2 19 57
3 20 5 20 57
Overall Median 7 20 57
Minimum 2 16 32
Maximum 23 36 64
SD 4.25 5.06 7.30
E121
197

Oregon Standard Setting Grade 5 ScienceRound 1 Cut Scores
Table Participant Nearly Meets Meets Exceeds
1 7 216 227 238
1 9 213 228 243
1 10 216 226 237
1 11 219 225 237
1 12 217 228 236
1 13 216 225 233
1 14 215 228 236
2 2 212 225 241
2 3 211 224 229
2 4 216 228 242
2 5 215 224 235
2 6 216 225 240
2 8 216 228 239
3 1 218 224 236
3 15 212 225 238
3 16 216 225 238
3 17 226 230 238
3 18 218 225 238
3 19 208 225 238
3 20 213 225 238
Overall Median 216 225 238
Minimum 208 224 229
Maximum 226 230 243
SD 3.65 1.75 3.07
E122
198

Oregon Standard Setting Grade 5 ScienceRound 1 Summary of Bookmark Placements
Statistic Table Nearly Meets Meets Exceeds
Median 1 7 25 52
Median 2 6.5 19.5 59
Median 3 7 20 57
Median Overall 7 20 57
Minimum 1 5 19 44
Minimum 2 3 16 32
Minimum 3 2 18 50
Minimum Overall 2 16 32
Maximum 1 10 29 64
Maximum 2 7 29 63
Maximum 3 23 36 57
Maximum Overall 23 36 64
SD 1 1.57 3.77 6.28
SD 2 1.75 5.24 11.84
SD 3 6.92 6.24 2.61
SD Overall 4.25 5.06 7.30
Overall Median 7 20 57
Minimum 2 16 32
Maximum 23 36 64
SD 4.25 5.06 7.30
E123
199

Oregon Standard Setting Grade 5 ScienceRound 1 Summary of Cut Scores
Statistic Table Nearly Meets Meets Exceeds
Median 1 216 227 237
Median 2 216 225 240
Median 3 216 225 238
Median Overall 216 225 238
Minimum 1 213 225 233
Minimum 2 211 224 229
Minimum 3 208 224 236
Minimum Overall 208 224 229
Maximum 1 219 228 243
Maximum 2 216 228 242
Maximum 3 226 230 238
Maximum Overall 226 230 243
SD 1 1.83 1.38 3.02
SD 2 2.25 1.86 4.89
SD 3 5.73 1.99 0.76
SD Overall 3.65 1.75 3.07
Overall Median 216 225 238
Minimum 208 224 229
Maximum 226 230 243
SD 3.65 1.75 3.07
E124
200

Oregon Standard Setting Grade 5 ScienceRound 1 Median Bookmark Summary
Table Nearly Meets Meets Exceeds1 7 25 522 6.5 19.5 593 7 20 57
Overall 7 20 57
Impact Data
Does NotYet Meet
NearlyMeets
Meets Exceeds
Overall 8.0 19.1 50.5 22.4
E125
201

Oregon Standard Setting Grade 5 ScienceRound 2 Bookmark Placements
Table Participant Nearly Meets Meets Exceeds
1 7 7 27 55
1 9 8 27 60
1 10 7 20 50
1 11 7 20 53
1 12 7 27 50
1 13 7 20 57
1 14 9 25 50
2 2 4 20 57
2 3 5 23 37
2 4 7 27 57
2 5 7 20 49
2 6 7 20 59
2 8 7 20 58
3 1 9 21 57
3 15 9 20 57
3 16 9 21 57
3 17 12 23 57
3 18 9 20 57
3 19 7 19 57
3 20 7 19 57
Overall Median 7 20 57
Minimum 4 19 37
Maximum 12 27 60
SD 1.67 2.96 5.26
E126
202

Oregon Standard Setting Grade 5 ScienceRound 2 Cut Scores
Table Participant Nearly Meets Meets Exceeds
1 7 216 228 238
1 9 217 228 240
1 10 216 225 236
1 11 216 225 237
1 12 216 228 236
1 13 216 225 238
1 14 218 227 236
2 2 212 225 238
2 3 213 226 231
2 4 216 228 238
2 5 216 225 235
2 6 216 225 239
2 8 216 225 239
3 1 218 225 238
3 15 218 225 238
3 16 218 225 238
3 17 221 226 238
3 18 218 225 238
3 19 216 225 238
3 20 216 225 238
Overall Median 216 225 238
Minimum 212 225 231
Maximum 221 228 240
SD 1.88 1.24 1.90
E127
203

Oregon Standard Setting Grade 5 ScienceRound 2 Summary of Bookmark Placements
Statistic Table Nearly Meets Meets Exceeds
Median 1 7 25 53
Median 2 7 20 57
Median 3 9 20 57
Median Overall 7 20 57
Minimum 1 7 20 50
Minimum 2 4 20 37
Minimum 3 7 19 57
Minimum Overall 4 19 37
Maximum 1 9 27 60
Maximum 2 7 27 59
Maximum 3 12 23 57
Maximum Overall 12 27 60
SD 1 0.79 3.55 3.95
SD 2 1.33 2.88 8.54
SD 3 1.68 1.40 0.00
SD Overall 1.67 2.96 5.26
Overall Median 7 20 57
Minimum 4 19 37
Maximum 12 27 60
SD 1.67 2.96 5.26
E128
204

Oregon Standard Setting Grade 5 ScienceRound 2 Summary of Cut Scores
Statistic Table Nearly Meets Meets Exceeds
Median 1 216 227 237
Median 2 216 225 238
Median 3 218 225 238
Median Overall 216 225 238
Minimum 1 216 225 236
Minimum 2 212 225 231
Minimum 3 216 225 238
Minimum Overall 212 225 231
Maximum 1 218 228 240
Maximum 2 216 228 239
Maximum 3 221 226 238
Maximum Overall 221 228 240
SD 1 0.79 1.51 1.50
SD 2 1.83 1.21 3.14
SD 3 1.68 0.38 0.00
SD Overall 1.88 1.24 1.90
Overall Median 216 225 238
Minimum 212 225 231
Maximum 221 228 240
SD 1.88 1.24 1.90
E129
205

Oregon Standard Setting Grade 5 ScienceRound 2 Median Bookmark Summary
Table Nearly Meets Meets Exceeds1 7 25 532 7 20 573 9 20 57
Overall 7 20 57
Impact Data
Does NotYet Meet
NearlyMeets
Meets Exceeds
Overall 8.0 19.1 50.5 22.4
E130
206
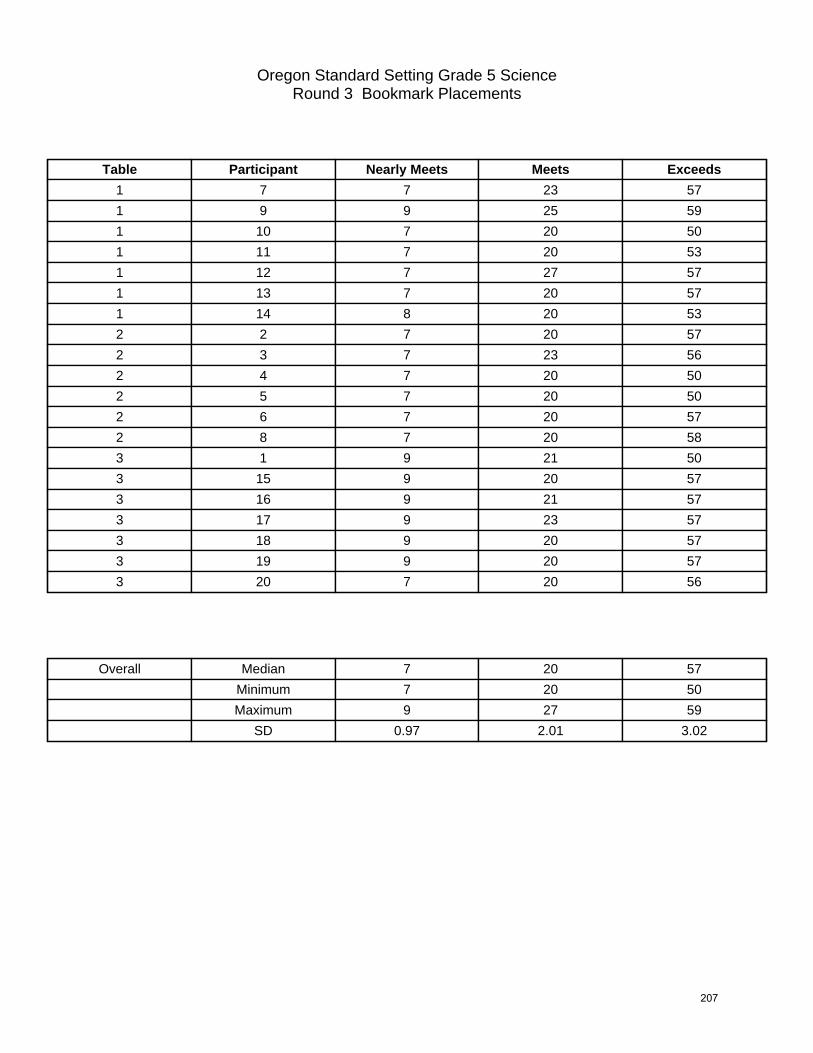
Oregon Standard Setting Grade 5 ScienceRound 3 Bookmark Placements
Table Participant Nearly Meets Meets Exceeds
1 7 7 23 57
1 9 9 25 59
1 10 7 20 50
1 11 7 20 53
1 12 7 27 57
1 13 7 20 57
1 14 8 20 53
2 2 7 20 57
2 3 7 23 56
2 4 7 20 50
2 5 7 20 50
2 6 7 20 57
2 8 7 20 58
3 1 9 21 50
3 15 9 20 57
3 16 9 21 57
3 17 9 23 57
3 18 9 20 57
3 19 9 20 57
3 20 7 20 56
Overall Median 7 20 57
Minimum 7 20 50
Maximum 9 27 59
SD 0.97 2.01 3.02
E131
207

Oregon Standard Setting Grade 5 ScienceRound 3 Cut Scores
Table Participant Nearly Meets Meets Exceeds
1 7 216 226 238
1 9 218 227 239
1 10 216 225 236
1 11 216 225 237
1 12 216 228 238
1 13 216 225 238
1 14 217 225 237
2 2 216 225 238
2 3 216 226 238
2 4 216 225 236
2 5 216 225 236
2 6 216 225 238
2 8 216 225 239
3 1 218 225 236
3 15 218 225 238
3 16 218 225 238
3 17 218 226 238
3 18 218 225 238
3 19 218 225 238
3 20 216 225 238
Overall Median 216 225 238
Minimum 216 225 236
Maximum 218 228 239
SD 0.97 0.82 0.94
E132
208

Oregon Standard Setting Grade 5 ScienceRound 3 Summary of Bookmark Placements
Statistic Table Nearly Meets Meets Exceeds
Median 1 7 20 57
Median 2 7 20 56.5
Median 3 9 20 57
Median Overall 7 20 57
Minimum 1 7 20 50
Minimum 2 7 20 50
Minimum 3 7 20 50
Minimum Overall 7 20 50
Maximum 1 9 27 59
Maximum 2 7 23 58
Maximum 3 9 23 57
Maximum Overall 9 27 59
SD 1 0.79 2.91 3.18
SD 2 0.00 1.22 3.67
SD 3 0.76 1.11 2.61
SD Overall 0.97 2.01 3.02
Overall Median 7 20 57
Minimum 7 20 50
Maximum 9 27 59
SD 0.97 2.01 3.02
E133
209

Oregon Standard Setting Grade 5 ScienceRound 3 Summary of Cut Scores
Statistic Table Nearly Meets Meets Exceeds
Median 1 216 225 238
Median 2 216 225 238
Median 3 218 225 238
Median Overall 216 225 238
Minimum 1 216 225 236
Minimum 2 216 225 236
Minimum 3 216 225 236
Minimum Overall 216 225 236
Maximum 1 218 228 239
Maximum 2 216 226 239
Maximum 3 218 226 238
Maximum Overall 218 228 239
SD 1 0.79 1.21 0.98
SD 2 0.00 0.41 1.22
SD 3 0.76 0.38 0.76
SD Overall 0.97 0.82 0.94
Overall Median 216 225 238
Minimum 216 225 236
Maximum 218 228 239
SD 0.97 0.82 0.94
E134
210

Oregon Standard Setting Grade 5 ScienceRound 3 Median Bookmark Summary
Table Nearly Meets Meets Exceeds1 7 20 572 7 20 56.53 9 20 57
Overall 7 20 57
Impact Data
Does NotYet Meet
NearlyMeets
Meets Exceeds
Overall 8.0 19.1 50.5 22.4
E135
211

Oregon Standard Setting Grade 8 ScienceRound 1 Bookmark Placements
Table Participant Nearly Meets Meets Exceeds
1 1 15 27 56
1 2 14 32 53
1 3 20 32 55
1 4 19 34 55
1 5 14 21 47
1 6 24 35 60
2 7 12 24 55
2 8 16 27 55
2 9 19 24 54
2 10 20 27 61
2 11 18 24 54
2 12 8 27 56
2 13 13 20 55
3 14 12 26 52
3 15 19 22 54
3 16 12 27 57
3 17 14 21 57
3 18 20 32 53
3 19 13 21 53
3 22 17 29 56
Overall Median 15.5 27 55
Minimum 8 20 47
Maximum 24 35 61
SD 3.89 4.58 2.90
E136
212

Oregon Standard Setting Grade 8 ScienceRound 1 Cut Scores
Table Participant Nearly Meets Meets Exceeds
1 1 227 234 246
1 2 227 236 245
1 3 231 236 246
1 4 230 237 246
1 5 227 231 242
1 6 233 237 248
2 7 225 233 246
2 8 228 234 246
2 9 230 233 245
2 10 231 234 249
2 11 229 233 245
2 12 223 234 246
2 13 226 231 246
3 14 225 234 244
3 15 230 232 245
3 16 225 234 247
3 17 227 231 247
3 18 231 236 245
3 19 226 231 245
3 22 229 235 246
Overall Median 227 234 246
Minimum 223 231 242
Maximum 233 237 249
SD 2.62 1.96 1.45
E137
213

Oregon Standard Setting Grade 8 ScienceRound 1 Summary of Bookmark Placements
Statistic Table Nearly Meets Meets Exceeds
Median 1 17 32 55
Median 2 16 24 55
Median 3 14 26 54
Median Overall 15.5 27 55
Minimum 1 14 21 47
Minimum 2 8 20 54
Minimum 3 12 21 52
Minimum Overall 8 20 47
Maximum 1 24 35 60
Maximum 2 20 27 61
Maximum 3 20 32 57
Maximum Overall 24 35 61
SD 1 4.03 5.27 4.27
SD 2 4.34 2.56 2.43
SD 3 3.35 4.28 2.07
SD Overall 3.89 4.58 2.90
Overall Median 15.5 27 55
Minimum 8 20 47
Maximum 24 35 61
SD 3.89 4.58 2.90
E138
214

Oregon Standard Setting Grade 8 ScienceRound 1 Summary of Cut Scores
Statistic Table Nearly Meets Meets Exceeds
Median 1 229 236 246
Median 2 228 233 246
Median 3 227 234 245
Median Overall 227 234 246
Minimum 1 227 231 242
Minimum 2 223 231 245
Minimum 3 225 231 244
Minimum Overall 223 231 242
Maximum 1 233 237 248
Maximum 2 231 234 249
Maximum 3 231 236 247
Maximum Overall 233 237 249
SD 1 2.56 2.32 1.97
SD 2 2.88 1.07 1.35
SD 3 2.44 1.98 1.13
SD Overall 2.62 1.96 1.45
Overall Median 227 234 246
Minimum 223 231 242
Maximum 233 237 249
SD 2.62 1.96 1.45
E139
215
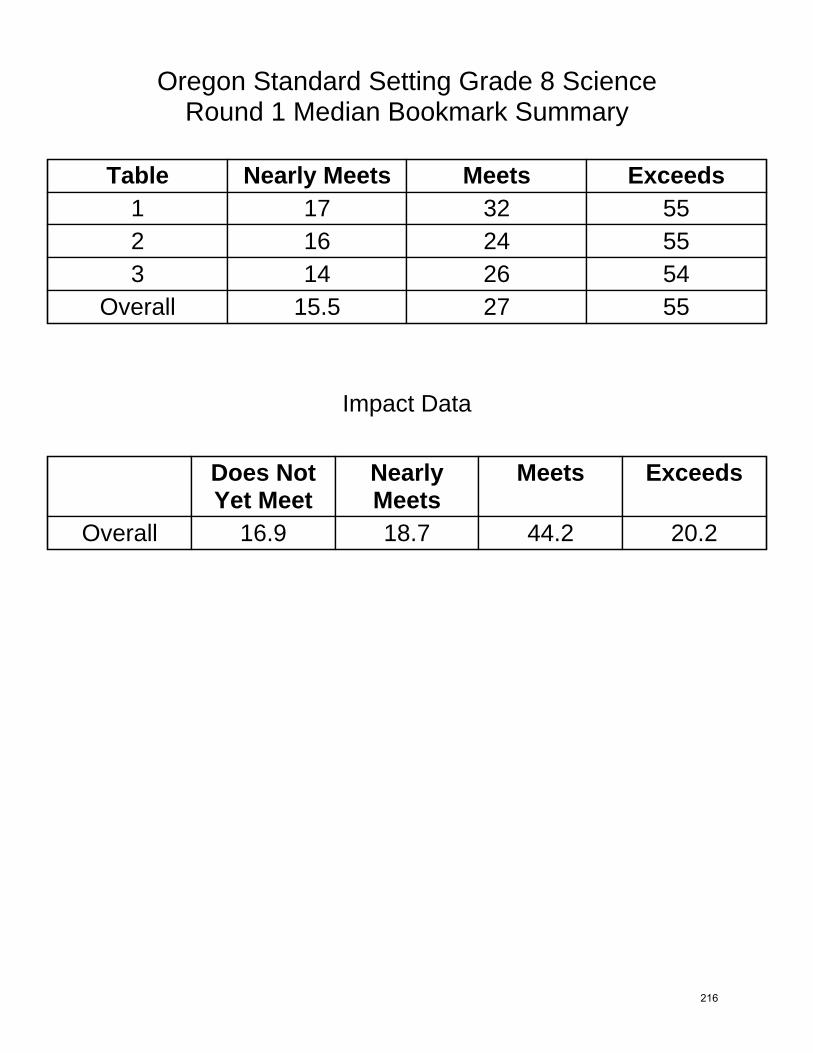
Oregon Standard Setting Grade 8 ScienceRound 1 Median Bookmark Summary
Table Nearly Meets Meets Exceeds1 17 32 552 16 24 553 14 26 54
Overall 15.5 27 55
Impact Data
Does NotYet Meet
NearlyMeets
Meets Exceeds
Overall 16.9 18.7 44.2 20.2
E140
216
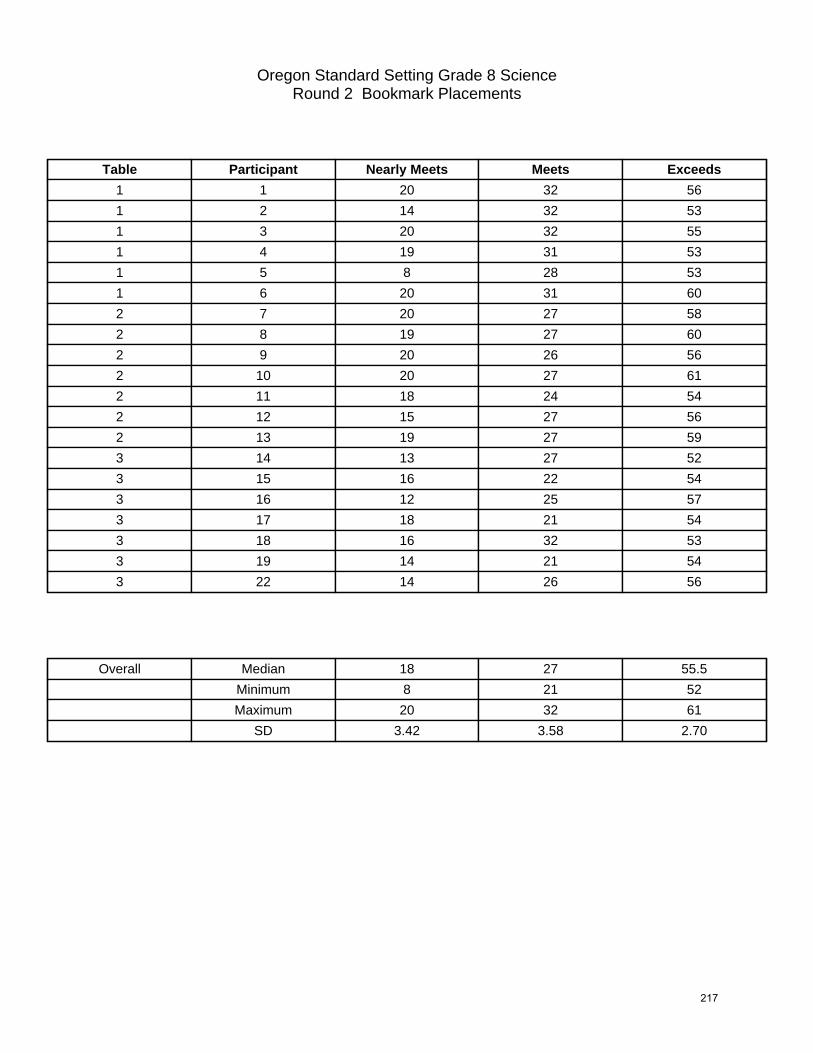
Oregon Standard Setting Grade 8 ScienceRound 2 Bookmark Placements
Table Participant Nearly Meets Meets Exceeds
1 1 20 32 56
1 2 14 32 53
1 3 20 32 55
1 4 19 31 53
1 5 8 28 53
1 6 20 31 60
2 7 20 27 58
2 8 19 27 60
2 9 20 26 56
2 10 20 27 61
2 11 18 24 54
2 12 15 27 56
2 13 19 27 59
3 14 13 27 52
3 15 16 22 54
3 16 12 25 57
3 17 18 21 54
3 18 16 32 53
3 19 14 21 54
3 22 14 26 56
Overall Median 18 27 55.5
Minimum 8 21 52
Maximum 20 32 61
SD 3.42 3.58 2.70
E141
217

Oregon Standard Setting Grade 8 ScienceRound 2 Cut Scores
Table Participant Nearly Meets Meets Exceeds
1 1 231 236 246
1 2 227 236 245
1 3 231 236 246
1 4 230 236 245
1 5 223 235 245
1 6 231 236 248
2 7 231 234 247
2 8 230 234 248
2 9 231 234 246
2 10 231 234 249
2 11 229 233 245
2 12 227 234 246
2 13 230 234 248
3 14 226 234 244
3 15 228 232 245
3 16 225 233 247
3 17 229 231 245
3 18 228 236 245
3 19 227 231 245
3 22 227 234 246
Overall Median 229 234 246
Minimum 223 231 244
Maximum 231 236 249
SD 2.33 1.60 1.36
E142
218

Oregon Standard Setting Grade 8 ScienceRound 2 Summary of Bookmark Placements
Statistic Table Nearly Meets Meets Exceeds
Median 1 19.5 31.5 54
Median 2 19 27 58
Median 3 14 25 54
Median Overall 18 27 55.5
Minimum 1 8 28 53
Minimum 2 15 24 54
Minimum 3 12 21 52
Minimum Overall 8 21 52
Maximum 1 20 32 60
Maximum 2 20 27 61
Maximum 3 18 32 57
Maximum Overall 20 32 61
SD 1 4.92 1.55 2.76
SD 2 1.80 1.13 2.50
SD 3 2.06 3.98 1.70
SD Overall 3.42 3.58 2.70
Overall Median 18 27 55.5
Minimum 8 21 52
Maximum 20 32 61
SD 3.42 3.58 2.70
E143
219

Oregon Standard Setting Grade 8 ScienceRound 2 Summary of Cut Scores
Statistic Table Nearly Meets Meets Exceeds
Median 1 231 236 246
Median 2 230 234 247
Median 3 227 233 245
Median Overall 229 234 246
Minimum 1 223 235 245
Minimum 2 227 233 245
Minimum 3 225 231 244
Minimum Overall 223 231 244
Maximum 1 231 236 248
Maximum 2 231 234 249
Maximum 3 229 236 247
Maximum Overall 231 236 249
SD 1 3.25 0.41 1.17
SD 2 1.46 0.38 1.41
SD 3 1.35 1.83 0.95
SD Overall 2.33 1.60 1.36
Overall Median 229 234 246
Minimum 223 231 244
Maximum 231 236 249
SD 2.33 1.60 1.36
E144
220

Oregon Standard Setting Grade 8 ScienceRound 2 Median Bookmark Summary
Table Nearly Meets Meets Exceeds1 19.5 31.5 542 19 27 583 14 25 54
Overall 18 27 55.5
Impact Data
Does NotYet Meet
NearlyMeets
Meets Exceeds
Overall 21.3 14.3 44.2 20.2
E145
221

Oregon Standard Setting Grade 8 ScienceRound 3 Bookmark Placements
Table Participant Nearly Meets Meets Exceeds
1 1 19 27 56
1 2 14 24 53
1 3 20 32 55
1 4 14 27 53
1 5 4 22 53
1 6 19 31 57
2 7 18 27 55
2 8 20 27 60
2 9 18 24 55
2 10 19 26 60
2 11 18 24 54
2 12 18 27 54
2 13 16 27 55
3 14 13 27 54
3 15 17 21 55
3 16 14 26 57
3 17 18 22 54
3 18 19 32 53
3 19 15 22 55
3 22 17 26 56
Overall Median 18 26.5 55
Minimum 4 21 53
Maximum 20 32 60
SD 3.63 3.15 2.04
E146
222

Oregon Standard Setting Grade 8 ScienceRound 3 Cut Scores
Table Participant Nearly Meets Meets Exceeds
1 1 230 234 246
1 2 227 233 245
1 3 231 236 246
1 4 227 234 245
1 5 220 232 245
1 6 230 236 247
2 7 229 234 246
2 8 231 234 248
2 9 229 233 246
2 10 230 234 248
2 11 229 233 245
2 12 229 234 245
2 13 228 234 246
3 14 226 234 245
3 15 229 231 246
3 16 227 234 247
3 17 229 232 245
3 18 230 236 245
3 19 227 232 246
3 22 229 234 246
Overall Median 229 234 246
Minimum 220 231 245
Maximum 231 236 248
SD 2.41 1.34 0.97
E147
223

Oregon Standard Setting Grade 8 ScienceRound 3 Summary of Bookmark Placements
Statistic Table Nearly Meets Meets Exceeds
Median 1 16.5 27 54
Median 2 18 27 55
Median 3 17 26 55
Median Overall 18 26.5 55
Minimum 1 4 22 53
Minimum 2 16 24 54
Minimum 3 13 21 53
Minimum Overall 4 21 53
Maximum 1 20 32 57
Maximum 2 20 27 60
Maximum 3 19 32 57
Maximum Overall 20 32 60
SD 1 6.00 3.87 1.76
SD 2 1.21 1.41 2.67
SD 3 2.19 3.85 1.35
SD Overall 3.63 3.15 2.04
Overall Median 18 26.5 55
Minimum 4 21 53
Maximum 20 32 60
SD 3.63 3.15 2.04
E148
224

Oregon Standard Setting Grade 8 ScienceRound 3 Summary of Cut Scores
Statistic Table Nearly Meets Meets Exceeds
Median 1 229 234 246
Median 2 229 234 246
Median 3 229 234 246
Median Overall 229 234 246
Minimum 1 220 232 245
Minimum 2 228 233 245
Minimum 3 226 231 245
Minimum Overall 220 231 245
Maximum 1 231 236 247
Maximum 2 231 234 248
Maximum 3 230 236 247
Maximum Overall 231 236 248
SD 1 4.04 1.60 0.82
SD 2 0.95 0.49 1.25
SD 3 1.46 1.70 0.76
SD Overall 2.41 1.34 0.97
Overall Median 229 234 246
Minimum 220 231 245
Maximum 231 236 248
SD 2.41 1.34 0.97
E149
225

Oregon Standard Setting Grade 8 ScienceRound 3 Median Bookmark Summary
Table Nearly Meets Meets Exceeds1 16.5 27 542 18 27 553 17 26 55
Overall 18 26.5 55
Impact Data
Does NotYet Meet
NearlyMeets
Meets Exceeds
Overall 21.3 14.3 44.2 20.2
E150
226

Oregon Standard Setting Grade 10 ScienceRound 1 Bookmark Placements
Table Participant Nearly Meets Meets Exceeds
1 2 17 31 59
1 3 16 32 56
1 4 24 34 52
1 5 19 31 55
1 6 24 33 51
2 7 27 43 51
2 8 20 33 54
2 9 19 33 55
2 10 17 23 53
2 11 16 31 61
3 12 21 33 55
3 13 15 33 57
3 14 16 29 45
3 15 15 32 62
3 16 18 24 41
3 17 18 29 41
Overall Median 18 32 54.5
Minimum 15 23 41
Maximum 27 43 62
SD 3.54 4.41 6.22
E151
227
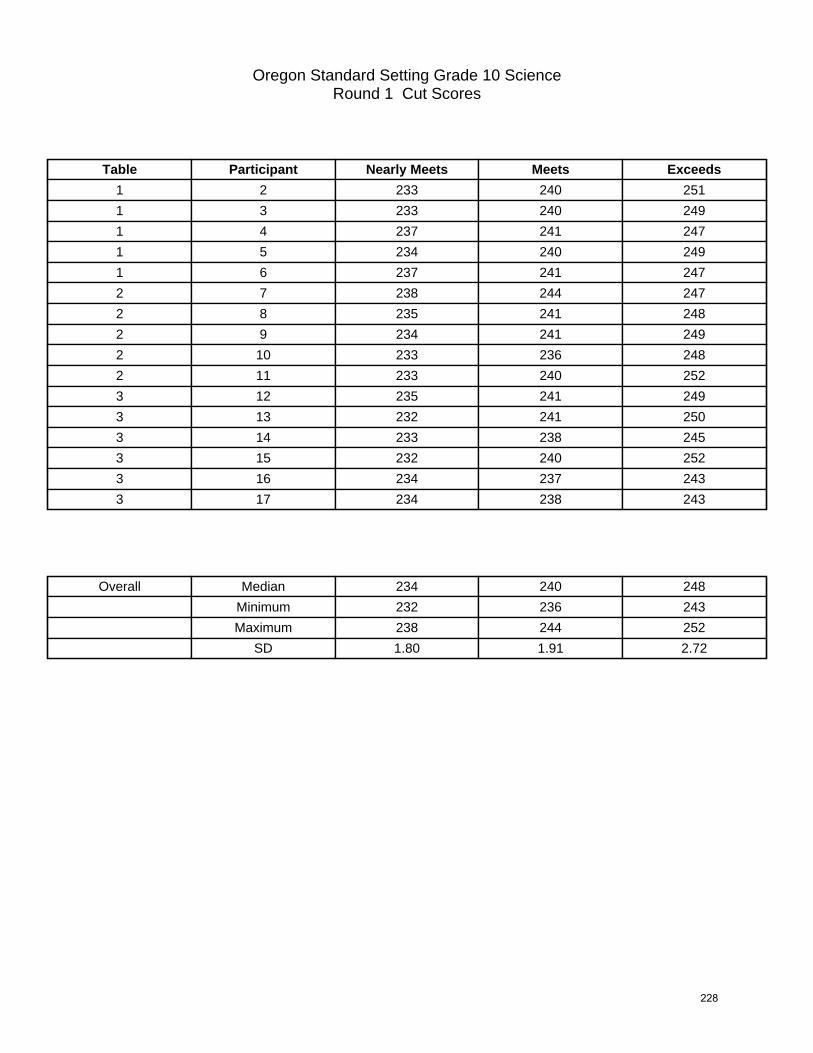
Oregon Standard Setting Grade 10 ScienceRound 1 Cut Scores
Table Participant Nearly Meets Meets Exceeds
1 2 233 240 251
1 3 233 240 249
1 4 237 241 247
1 5 234 240 249
1 6 237 241 247
2 7 238 244 247
2 8 235 241 248
2 9 234 241 249
2 10 233 236 248
2 11 233 240 252
3 12 235 241 249
3 13 232 241 250
3 14 233 238 245
3 15 232 240 252
3 16 234 237 243
3 17 234 238 243
Overall Median 234 240 248
Minimum 232 236 243
Maximum 238 244 252
SD 1.80 1.91 2.72
E152
228

Oregon Standard Setting Grade 10 ScienceRound 1 Summary of Bookmark Placements
Statistic Table Nearly Meets Meets Exceeds
Median 1 19 32 55
Median 2 19 33 54
Median 3 17 30.5 50
Median Overall 18 32 54.5
Minimum 1 16 31 51
Minimum 2 16 23 51
Minimum 3 15 24 41
Minimum Overall 15 23 41
Maximum 1 24 34 59
Maximum 2 27 43 61
Maximum 3 21 33 62
Maximum Overall 27 43 62
SD 1 3.81 1.30 3.21
SD 2 4.32 7.13 3.77
SD 3 2.32 3.46 9.00
SD Overall 3.54 4.41 6.22
Overall Median 18 32 54.5
Minimum 15 23 41
Maximum 27 43 62
SD 3.54 4.41 6.22
E153
229

Oregon Standard Setting Grade 10 ScienceRound 1 Summary of Cut Scores
Statistic Table Nearly Meets Meets Exceeds
Median 1 234 240 249
Median 2 234 241 248
Median 3 234 239 247
Median Overall 234 240 248
Minimum 1 233 240 247
Minimum 2 233 236 247
Minimum 3 232 237 243
Minimum Overall 232 236 243
Maximum 1 237 241 251
Maximum 2 238 244 252
Maximum 3 235 241 252
Maximum Overall 238 244 252
SD 1 2.05 0.55 1.67
SD 2 2.07 2.88 1.92
SD 3 1.21 1.72 3.85
SD Overall 1.80 1.91 2.72
Overall Median 234 240 248
Minimum 232 236 243
Maximum 238 244 252
SD 1.80 1.91 2.72
E154
230
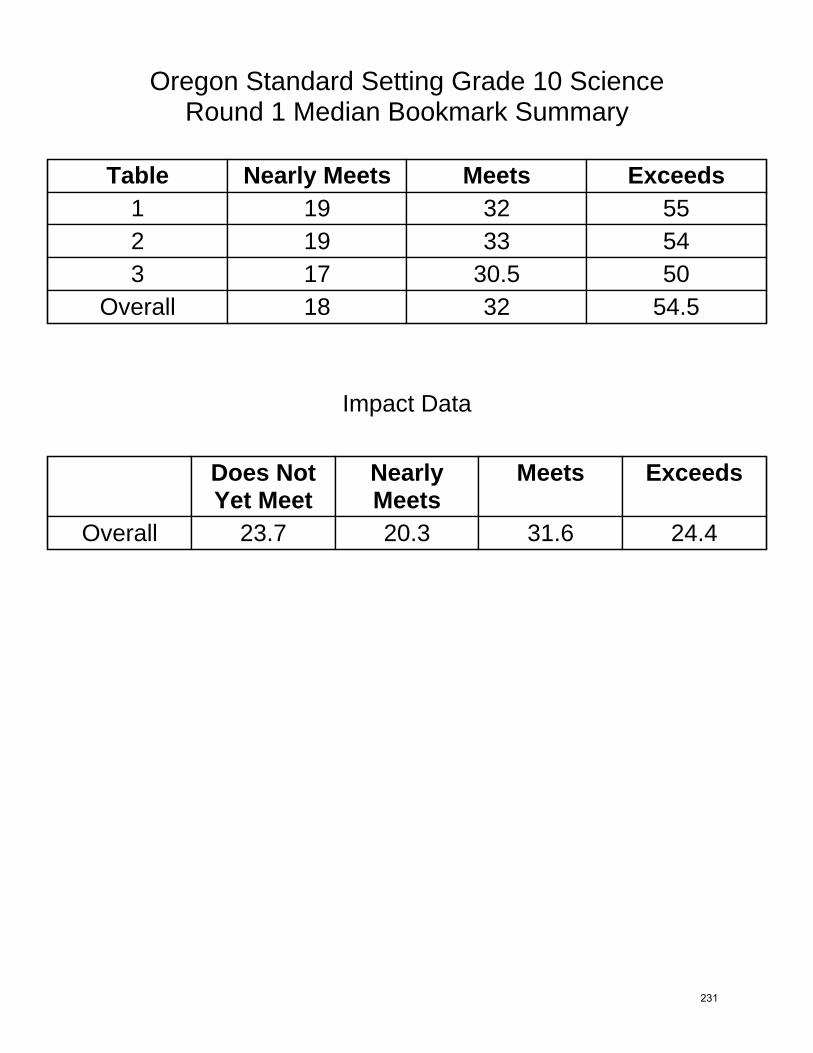
Oregon Standard Setting Grade 10 ScienceRound 1 Median Bookmark Summary
Table Nearly Meets Meets Exceeds1 19 32 552 19 33 543 17 30.5 50
Overall 18 32 54.5
Impact Data
Does NotYet Meet
NearlyMeets
Meets Exceeds
Overall 23.7 20.3 31.6 24.4
E155
231

Oregon Standard Setting Grade 10 ScienceRound 2 Bookmark Placements
Table Participant Nearly Meets Meets Exceeds
1 2 21 34 63
1 3 21 32 63
1 4 21 31 59
1 5 19 31 55
1 6 23 33 63
2 7 21 33 59
2 8 20 33 54
2 9 20 33 55
2 10 23 36 56
2 11 32 41 60
3 12 19 33 55
3 13 15 32 57
3 14 9 29 45
3 15 15 32 55
3 16 18 24 41
3 17 20 32 54
Overall Median 20 32.5 55.5
Minimum 9 24 41
Maximum 32 41 63
SD 4.78 3.44 6.00
E156
232

Oregon Standard Setting Grade 10 ScienceRound 2 Cut Scores
Table Participant Nearly Meets Meets Exceeds
1 2 235 241 253
1 3 235 240 253
1 4 235 240 251
1 5 234 240 249
1 6 236 241 253
2 7 235 241 251
2 8 235 241 248
2 9 235 241 249
2 10 236 242 249
2 11 240 243 251
3 12 234 241 249
3 13 232 240 250
3 14 228 238 245
3 15 232 240 249
3 16 234 237 243
3 17 235 240 248
Overall Median 235 240 249
Minimum 228 237 243
Maximum 240 243 253
SD 2.48 1.41 2.73
E157
233

Oregon Standard Setting Grade 10 ScienceRound 2 Summary of Bookmark Placements
Statistic Table Nearly Meets Meets Exceeds
Median 1 21 32 63
Median 2 21 33 56
Median 3 16.5 32 54.5
Median Overall 20 32.5 55.5
Minimum 1 19 31 55
Minimum 2 20 33 54
Minimum 3 9 24 41
Minimum Overall 9 24 41
Maximum 1 23 34 63
Maximum 2 32 41 60
Maximum 3 20 33 57
Maximum Overall 32 41 63
SD 1 1.41 1.30 3.58
SD 2 5.07 3.49 2.59
SD 3 4.00 3.39 6.52
SD Overall 4.78 3.44 6.00
Overall Median 20 32.5 55.5
Minimum 9 24 41
Maximum 32 41 63
SD 4.78 3.44 6.00
E158
234

Oregon Standard Setting Grade 10 ScienceRound 2 Summary of Cut Scores
Statistic Table Nearly Meets Meets Exceeds
Median 1 235 240 253
Median 2 235 241 249
Median 3 233 240 249
Median Overall 235 240 249
Minimum 1 234 240 249
Minimum 2 235 241 248
Minimum 3 228 237 243
Minimum Overall 228 237 243
Maximum 1 236 241 253
Maximum 2 240 243 251
Maximum 3 235 241 250
Maximum Overall 240 243 253
SD 1 0.71 0.55 1.79
SD 2 2.17 0.89 1.34
SD 3 2.51 1.51 2.73
SD Overall 2.48 1.41 2.73
Overall Median 235 240 249
Minimum 228 237 243
Maximum 240 243 253
SD 2.48 1.41 2.73
E159
235

Oregon Standard Setting Grade 10 ScienceRound 2 Median Bookmark Summary
Table Nearly Meets Meets Exceeds1 21 32 632 21 33 563 16.5 32 54.5
Overall 20 32.5 55.5
Impact Data
Does NotYet Meet
NearlyMeets
Meets Exceeds
Overall 26.6 17.4 35.3 20.7
E160
236

Oregon Standard Setting Grade 10 ScienceRound 3 Bookmark Placements
Table Participant Nearly Meets Meets Exceeds
1 2 23 34 63
1 3 21 31 56
1 4 21 31 56
1 5 19 29 55
1 6 23 33 63
2 7 18 30 56
2 8 23 31 54
2 9 21 33 56
2 10 19 24 56
2 11 24 35 57
3 12 19 29 53
3 13 21 32 58
3 14 19 29 52
3 15 16 33 55
3 16 18 24 48
3 17 23 33 61
Overall Median 21 31 56
Minimum 16 24 48
Maximum 24 35 63
SD 2.31 3.18 3.85
E161
237

Oregon Standard Setting Grade 10 ScienceRound 3 Cut Scores
Table Participant Nearly Meets Meets Exceeds
1 2 236 241 253
1 3 235 240 249
1 4 235 240 249
1 5 234 238 249
1 6 236 241 253
2 7 234 240 249
2 8 236 240 248
2 9 235 241 249
2 10 234 237 249
2 11 237 241 250
3 12 234 238 248
3 13 235 240 250
3 14 234 238 247
3 15 233 241 249
3 16 234 237 246
3 17 236 241 252
Overall Median 235 240 249
Minimum 233 237 246
Maximum 237 241 253
SD 1.09 1.50 1.93
E162
238
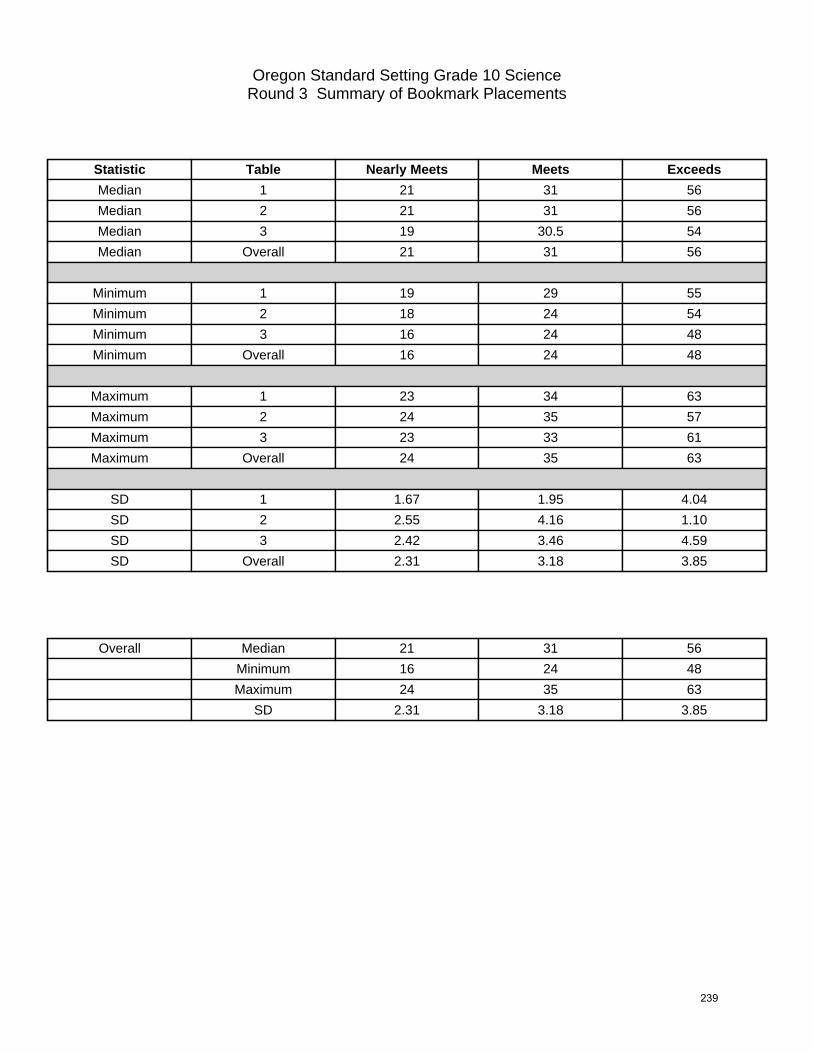
Oregon Standard Setting Grade 10 ScienceRound 3 Summary of Bookmark Placements
Statistic Table Nearly Meets Meets Exceeds
Median 1 21 31 56
Median 2 21 31 56
Median 3 19 30.5 54
Median Overall 21 31 56
Minimum 1 19 29 55
Minimum 2 18 24 54
Minimum 3 16 24 48
Minimum Overall 16 24 48
Maximum 1 23 34 63
Maximum 2 24 35 57
Maximum 3 23 33 61
Maximum Overall 24 35 63
SD 1 1.67 1.95 4.04
SD 2 2.55 4.16 1.10
SD 3 2.42 3.46 4.59
SD Overall 2.31 3.18 3.85
Overall Median 21 31 56
Minimum 16 24 48
Maximum 24 35 63
SD 2.31 3.18 3.85
E163
239

Oregon Standard Setting Grade 10 ScienceRound 3 Summary of Cut Scores
Statistic Table Nearly Meets Meets Exceeds
Median 1 235 240 249
Median 2 235 240 249
Median 3 234 239 249
Median Overall 235 240 249
Minimum 1 234 238 249
Minimum 2 234 237 248
Minimum 3 233 237 246
Minimum Overall 233 237 246
Maximum 1 236 241 253
Maximum 2 237 241 250
Maximum 3 236 241 252
Maximum Overall 237 241 253
SD 1 0.84 1.22 2.19
SD 2 1.30 1.64 0.71
SD 3 1.03 1.72 2.16
SD Overall 1.09 1.50 1.93
Overall Median 235 240 249
Minimum 233 237 246
Maximum 237 241 253
SD 1.09 1.50 1.93
E164
240

Oregon Standard Setting Grade 10 ScienceRound 3 Median Bookmark Summary
Table Nearly Meets Meets Exceeds1 21 31 562 21 31 563 19 30.5 54
Overall 21 31 56
Impact Data
Does NotYet Meet
NearlyMeets
Meets Exceeds
Overall 26.6 17.4 35.3 20.7
E165
241

SECTION G
Participant Judgments
Plus/Minus 1, 2, and 3 Standard Errors
242
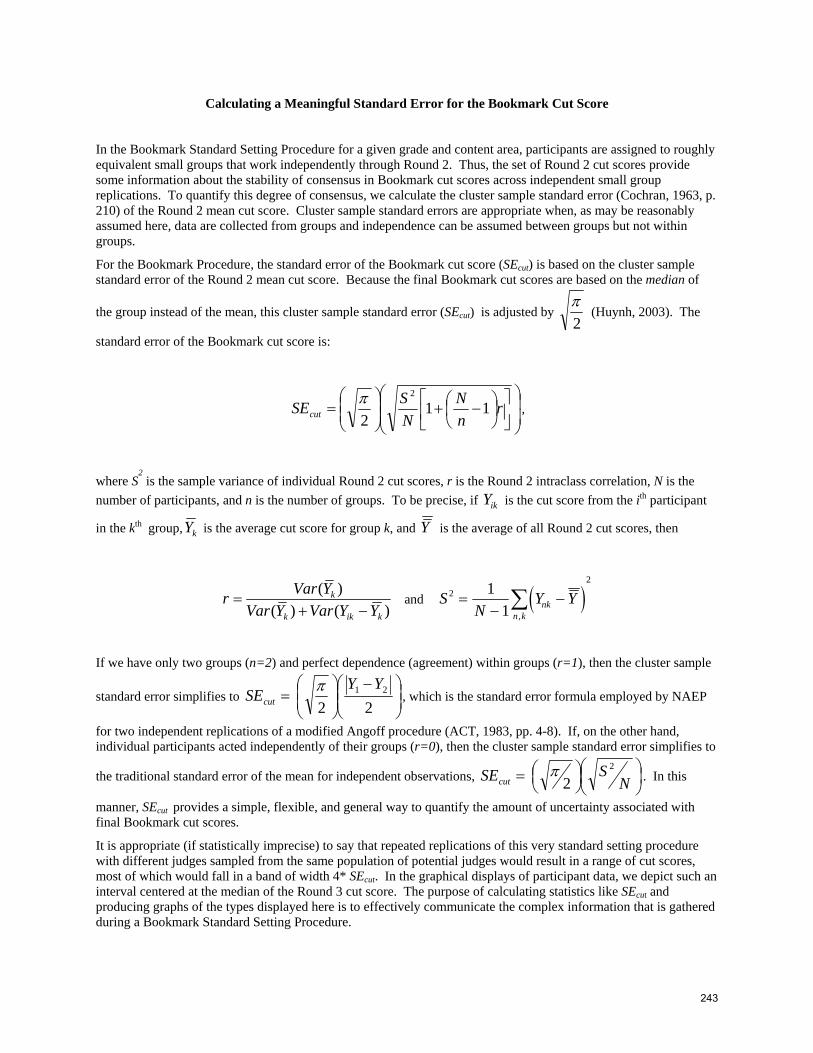
Calculating a Meaningful Standard Error for the Bookmark Cut Score
In the Bookmark Standard Setting Procedure for a given grade and content area, participants are assigned to roughly equivalent small groups that work independently through Round 2. Thus, the set of Round 2 cut scores provide some information about the stability of consensus in Bookmark cut scores across independent small group replications. To quantify this degree of consensus, we calculate the cluster sample standard error (Cochran, 1963, p. 210) of the Round 2 mean cut score. Cluster sample standard errors are appropriate when, as may be reasonably assumed here, data are collected from groups and independence can be assumed between groups but not within groups.
For the Bookmark Procedure, the standard error of the Bookmark cut score (SEcut) is based on the cluster sample standard error of the Round 2 mean cut score. Because the final Bookmark cut scores are based on the median of
the group instead of the mean, this cluster sample standard error (SEcut) is adjusted by 2π
(Huynh, 2003). The
standard error of the Bookmark cut score is:
⎟⎟
⎠
⎞
⎜⎜
⎝
⎛⎥⎦
⎤⎢⎣
⎡⎟⎠⎞
⎜⎝⎛ −+⎟⎟
⎠
⎞⎜⎜⎝
⎛= r
nN
NSSEcut 11
2
2π,
where S2 is the sample variance of individual Round 2 cut scores, r is the Round 2 intraclass correlation, N is the
number of participants, and n is the number of groups. To be precise, if ikY is the cut score from the ith participant
in the kth group, kY is the average cut score for group k, and Y is the average of all Round 2 cut scores, then
)()()(
kikk
k
YYVarYVarYVarr
−+= and ( )S
NY Ynk
n k
22
11
=−
−∑,
If we have only two groups (n=2) and perfect dependence (agreement) within groups (r=1), then the cluster sample
standard error simplifies to ⎟⎟⎠
⎞⎜⎜⎝
⎛ −⎟⎟⎠
⎞⎜⎜⎝
⎛=
22 21 YY
SEcutπ
, which is the standard error formula employed by NAEP
for two independent replications of a modified Angoff procedure (ACT, 1983, pp. 4-8). If, on the other hand, individual participants acted independently of their groups (r=0), then the cluster sample standard error simplifies to
the traditional standard error of the mean for independent observations, ⎟⎠⎞
⎜⎝⎛⎟⎠⎞⎜
⎝⎛= N
SSEcut
2
2 π . In this
manner, SEcut provides a simple, flexible, and general way to quantify the amount of uncertainty associated with final Bookmark cut scores.
It is appropriate (if statistically imprecise) to say that repeated replications of this very standard setting procedure with different judges sampled from the same population of potential judges would result in a range of cut scores, most of which would fall in a band of width 4* SEcut. In the graphical displays of participant data, we depict such an interval centered at the median of the Round 3 cut score. The purpose of calculating statistics like SEcut and producing graphs of the types displayed here is to effectively communicate the complex information that is gathered during a Bookmark Standard Setting Procedure.
243

References
ACT (1993). Setting achievement levels on the 1992 National Assessment of Educational Progress in Mathematics, Reading, and Writing: A technical report on reliability and validity.
Cochran, W. G. (1963). Sampling techniques. New York: John Wiley & Sons.
Huynh, H. (2003, August). Technical Memorandum for Computing Standard Error in Bookmark Standard Setting. (The South Carolina PACT 2003 Standard Setting Support Project). Columbia: University of South Carolina.
244

Oregon Standard Setting Grade 3 MathematicsRecommended Cut Points* Plus/Minus Selected Standard Errors (SEs) of the Cut Score
Performance Level Does Not Yet Meet Nearly Meets Meets Exceeds
SE (cut score) 0.22 0.47 1.00
RecommendedCut Point* + 3 SE
202 205 218 + 3 SE
Percent ofStudents in Each
Level
12.9 10.4 53.2 23.5
RecommendedCut Point* + 2 SE
202 205 217 + 2 SE
Percent ofStudents in Each
Level
12.9 10.4 49.7 27.0
RecommendedCut Point* + 1 SE
201 205 216 + 1 SE
Percent ofStudents in Each
Level
11.4 11.8 45.9 30.9
RecommendedCut Point*
201 204 215 RecommendedCut Points*
Percent ofStudents in Each
Level
11.4 8.2 45.2 35.2
RecommendedCut Point* -1 SE
201 204 214 -1 SE
Percent ofStudents in Each
Level
11.4 8.2 41.2 39.2
RecommendedCut Point* -2 SE
201 203 213 -2 SE
Percent ofStudents in Each
Level
11.4 4.7 40.4 43.5
RecommendedCut Point* -3 SE
200 203 212 -3 SE
Percent ofStudents in Each
Level
10.2 5.9 36.4 47.5
* Participants' Large Group Medians
F1
245

Oregon Standard Setting Grade 3 MathematicsRecommended Cut Points* Plus/Minus Selected Standard Errors (SEs) of Measurement
Performance Level Does Not Yet Meet Nearly Meets Meets Exceeds
Standard Error(SE) measurement
3.52 3.51 3.55
RecommendedCut Point* + 3 SE
212 215 226 + 3 SE
Percent ofStudents in Each
Level
52.5 12.3 29.3 5.9
RecommendedCut Point* + 2 SE
208 211 222 + 2 SE
Percent ofStudents in Each
Level
35.7 12.7 39.3 12.3
RecommendedCut Point* + 1 SE
205 208 219 + 1 SE
Percent ofStudents in Each
Level
23.3 12.4 44.3 20.0
RecommendedCut Point*
201 204 215 RecommendedCut Points*
Percent ofStudents in Each
Level
11.4 8.2 45.2 35.2
RecommendedCut Point* -1 SE
198 201 212 -1 SE
Percent ofStudents in Each
Level
7.7 3.7 41.1 47.5
RecommendedCut Point* -2 SE
194 197 208 -2 SE
Percent ofStudents in Each
Level
4.2 2.5 29.0 64.3
RecommendedCut Point* -3 SE
191 194 204 -3 SE
Percent ofStudents in Each
Level
2.6 1.7 15.4 80.3
* Participants' Large Group Medians
F2
246
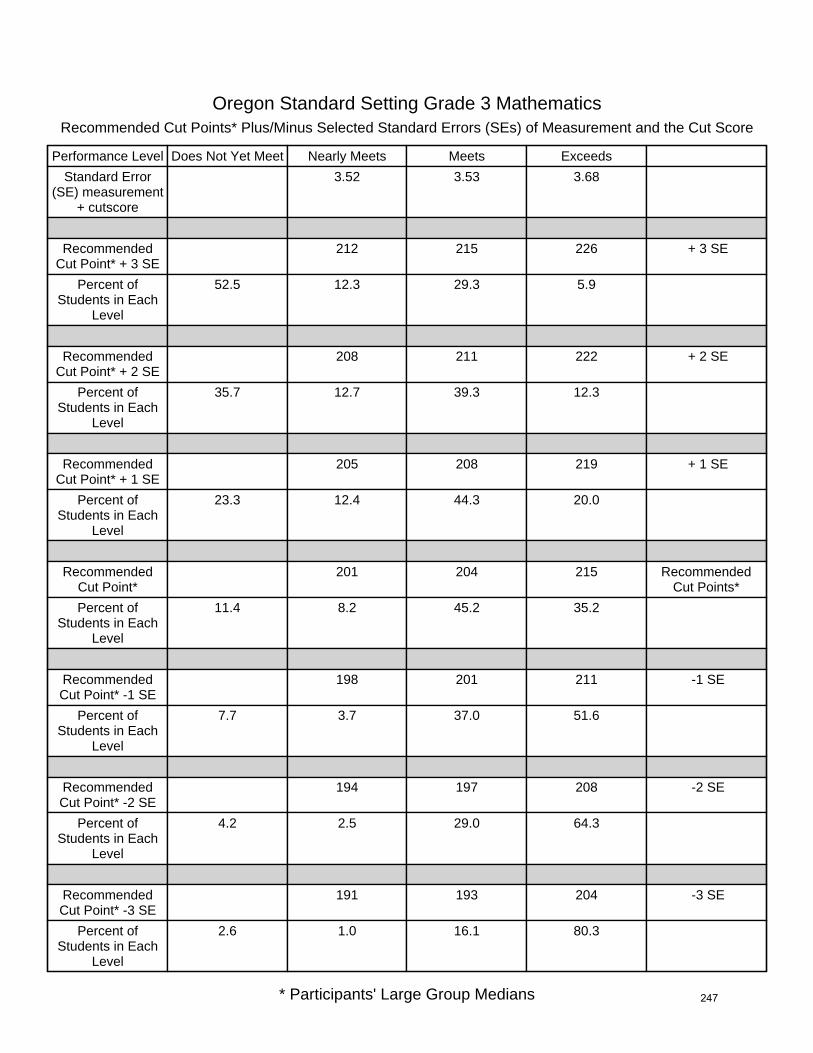
Oregon Standard Setting Grade 3 MathematicsRecommended Cut Points* Plus/Minus Selected Standard Errors (SEs) of Measurement and the Cut Score
Performance Level Does Not Yet Meet Nearly Meets Meets Exceeds
Standard Error(SE) measurement
+ cutscore
3.52 3.53 3.68
RecommendedCut Point* + 3 SE
212 215 226 + 3 SE
Percent ofStudents in Each
Level
52.5 12.3 29.3 5.9
RecommendedCut Point* + 2 SE
208 211 222 + 2 SE
Percent ofStudents in Each
Level
35.7 12.7 39.3 12.3
RecommendedCut Point* + 1 SE
205 208 219 + 1 SE
Percent ofStudents in Each
Level
23.3 12.4 44.3 20.0
RecommendedCut Point*
201 204 215 RecommendedCut Points*
Percent ofStudents in Each
Level
11.4 8.2 45.2 35.2
RecommendedCut Point* -1 SE
198 201 211 -1 SE
Percent ofStudents in Each
Level
7.7 3.7 37.0 51.6
RecommendedCut Point* -2 SE
194 197 208 -2 SE
Percent ofStudents in Each
Level
4.2 2.5 29.0 64.3
RecommendedCut Point* -3 SE
191 193 204 -3 SE
Percent ofStudents in Each
Level
2.6 1.0 16.1 80.3
* Participants' Large Group Medians
F3
247

Oregon Standard Setting Grade 5 MathematicsRecommended Cut Points* Plus/Minus Selected Standard Errors (SEs) of the Cut Score
Performance Level Does Not Yet Meet Nearly Meets Meets Exceeds
SE (cut score) 0.48 0.65 1.28
RecommendedCut Point* + 3 SE
216 220 234 + 3 SE
Percent ofStudents in Each
Level
18.9 17.5 50.3 13.3
RecommendedCut Point* + 2 SE
215 219 233 + 2 SE
Percent ofStudents in Each
Level
14.9 17.1 52.3 15.7
RecommendedCut Point* + 1 SE
215 219 231 + 1 SE
Percent ofStudents in Each
Level
14.9 17.1 46.9 21.1
RecommendedCut Point*
214 218 230 RecommendedCut Points*
Percent ofStudents in Each
Level
13.1 14.4 48.9 23.6
RecommendedCut Point* -1 SE
214 217 229 -1 SE
Percent ofStudents in Each
Level
13.1 9.8 50.7 26.4
RecommendedCut Point* -2 SE
213 217 228 -2 SE
Percent ofStudents in Each
Level
11.3 11.6 47.4 29.7
RecommendedCut Point* -3 SE
213 216 226 -3 SE
Percent ofStudents in Each
Level
11.3 7.6 44.1 37.0
* Participants' Large Group Medians
F4
248

Oregon Standard Setting Grade 5 MathematicsRecommended Cut Points* Plus/Minus Selected Standard Errors (SEs) of Measurement
Performance Level Does Not Yet Meet Nearly Meets Meets Exceeds
Standard Error(SE) measurement
3.51 3.51 3.50
RecommendedCut Point* + 3 SE
225 229 241 + 3 SE
Percent ofStudents in Each
Level
58.8 14.7 22.0 4.5
RecommendedCut Point* + 2 SE
221 225 237 + 2 SE
Percent ofStudents in Each
Level
41.0 17.8 33.0 8.2
RecommendedCut Point* + 1 SE
218 222 234 + 1 SE
Percent ofStudents in Each
Level
27.4 18.2 41.1 13.3
RecommendedCut Point*
214 218 230 RecommendedCut Points*
Percent ofStudents in Each
Level
13.1 14.4 48.9 23.6
RecommendedCut Point* -1 SE
211 215 227 -1 SE
Percent ofStudents in Each
Level
8.6 6.4 51.8 33.2
RecommendedCut Point* -2 SE
207 211 223 -2 SE
Percent ofStudents in Each
Level
4.6 3.9 41.5 50.0
RecommendedCut Point* -3 SE
204 208 220 -3 SE
Percent ofStudents in Each
Level
2.8 2.7 31.0 63.5
* Participants' Large Group Medians
F5
249

Oregon Standard Setting Grade 5 MathematicsRecommended Cut Points* Plus/Minus Selected Standard Errors (SEs) of Measurement and the Cut Score
Performance Level Does Not Yet Meet Nearly Meets Meets Exceeds
Standard Error(SE) measurement
+ cutscore
3.54 3.57 3.72
RecommendedCut Point* + 3 SE
225 229 241 + 3 SE
Percent ofStudents in Each
Level
58.8 14.7 22.0 4.5
RecommendedCut Point* + 2 SE
221 225 238 + 2 SE
Percent ofStudents in Each
Level
41.0 17.8 34.3 6.9
RecommendedCut Point* + 1 SE
218 222 234 + 1 SE
Percent ofStudents in Each
Level
27.4 18.2 41.1 13.3
RecommendedCut Point*
214 218 230 RecommendedCut Points*
Percent ofStudents in Each
Level
13.1 14.4 48.9 23.6
RecommendedCut Point* -1 SE
211 215 226 -1 SE
Percent ofStudents in Each
Level
8.6 6.4 48.1 36.9
RecommendedCut Point* -2 SE
207 211 223 -2 SE
Percent ofStudents in Each
Level
4.6 3.9 41.5 50.0
RecommendedCut Point* -3 SE
203 207 219 -3 SE
Percent ofStudents in Each
Level
2.4 2.2 27.4 68.0
* Participants' Large Group Medians
F6
250
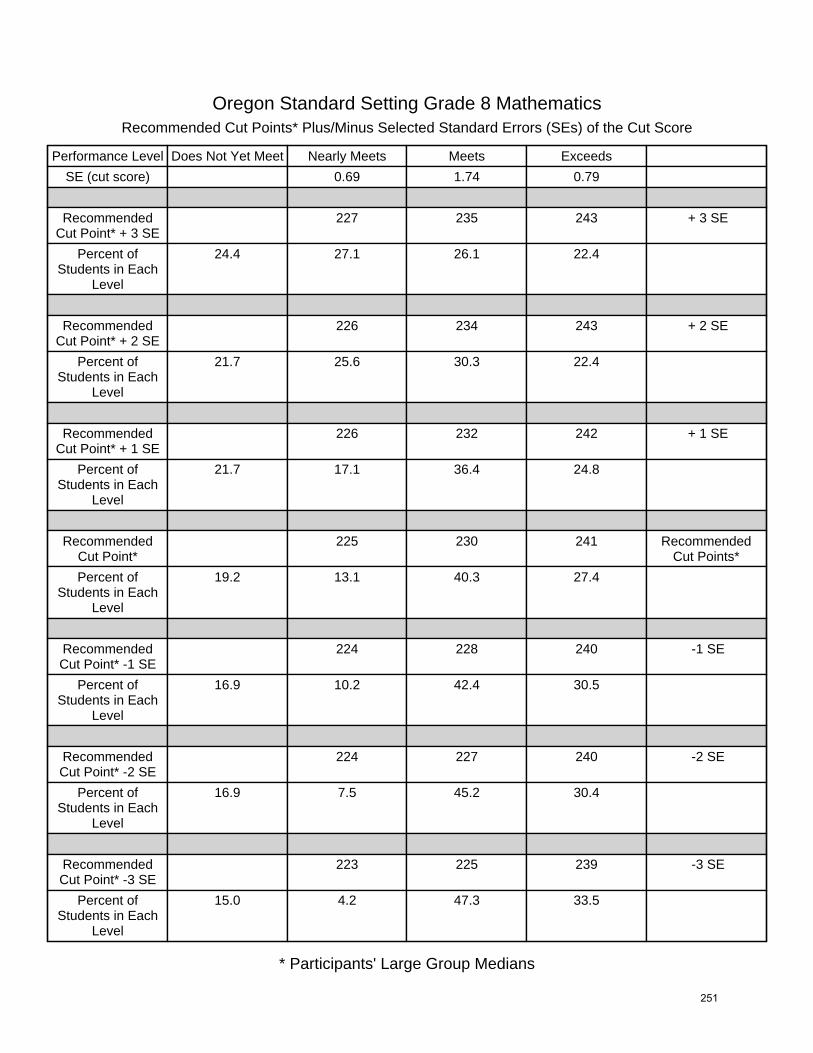
Oregon Standard Setting Grade 8 MathematicsRecommended Cut Points* Plus/Minus Selected Standard Errors (SEs) of the Cut Score
Performance Level Does Not Yet Meet Nearly Meets Meets Exceeds
SE (cut score) 0.69 1.74 0.79
RecommendedCut Point* + 3 SE
227 235 243 + 3 SE
Percent ofStudents in Each
Level
24.4 27.1 26.1 22.4
RecommendedCut Point* + 2 SE
226 234 243 + 2 SE
Percent ofStudents in Each
Level
21.7 25.6 30.3 22.4
RecommendedCut Point* + 1 SE
226 232 242 + 1 SE
Percent ofStudents in Each
Level
21.7 17.1 36.4 24.8
RecommendedCut Point*
225 230 241 RecommendedCut Points*
Percent ofStudents in Each
Level
19.2 13.1 40.3 27.4
RecommendedCut Point* -1 SE
224 228 240 -1 SE
Percent ofStudents in Each
Level
16.9 10.2 42.4 30.5
RecommendedCut Point* -2 SE
224 227 240 -2 SE
Percent ofStudents in Each
Level
16.9 7.5 45.2 30.4
RecommendedCut Point* -3 SE
223 225 239 -3 SE
Percent ofStudents in Each
Level
15.0 4.2 47.3 33.5
* Participants' Large Group Medians
F7
251

Oregon Standard Setting Grade 8 MathematicsRecommended Cut Points* Plus/Minus Selected Standard Errors (SEs) of Measurement
Performance Level Does Not Yet Meet Nearly Meets Meets Exceeds
Standard Error(SE) measurement
3.53 3.51 3.50
RecommendedCut Point* + 3 SE
236 241 252 + 3 SE
Percent ofStudents in Each
Level
55.4 17.2 20.1 7.3
RecommendedCut Point* + 2 SE
232 237 248 + 2 SE
Percent ofStudents in Each
Level
38.9 20.7 27.4 13.0
RecommendedCut Point* + 1 SE
229 234 245 + 1 SE
Percent ofStudents in Each
Level
29.9 17.4 34.2 18.5
RecommendedCut Point*
225 230 241 RecommendedCut Points*
Percent ofStudents in Each
Level
19.2 13.1 40.3 27.4
RecommendedCut Point* -1 SE
222 227 238 -1 SE
Percent ofStudents in Each
Level
13.3 11.1 38.8 36.8
RecommendedCut Point* -2 SE
218 223 234 -2 SE
Percent ofStudents in Each
Level
7.6 7.4 32.3 52.7
RecommendedCut Point* -3 SE
214 220 231 -3 SE
Percent ofStudents in Each
Level
3.5 6.7 24.8 65.0
* Participants' Large Group Medians
F8
252

Oregon Standard Setting Grade 8 MathematicsRecommended Cut Points* Plus/Minus Selected Standard Errors (SEs) of Measurement and the Cut Score
Performance Level Does Not Yet Meet Nearly Meets Meets Exceeds
Standard Error(SE) measurement
+ cutscore
3.59 3.92 3.58
RecommendedCut Point* + 3 SE
236 242 252 + 3 SE
Percent ofStudents in Each
Level
55.4 19.9 17.4 7.3
RecommendedCut Point* + 2 SE
232 238 248 + 2 SE
Percent ofStudents in Each
Level
38.9 24.3 23.7 13.1
RecommendedCut Point* + 1 SE
229 234 245 + 1 SE
Percent ofStudents in Each
Level
29.9 17.4 34.2 18.5
RecommendedCut Point*
225 230 241 RecommendedCut Points*
Percent ofStudents in Each
Level
19.2 13.1 40.3 27.4
RecommendedCut Point* -1 SE
221 226 238 -1 SE
Percent ofStudents in Each
Level
11.5 10.2 41.5 36.8
RecommendedCut Point* -2 SE
218 222 234 -2 SE
Percent ofStudents in Each
Level
7.6 5.7 34.0 52.7
RecommendedCut Point* -3 SE
214 218 230 -3 SE
Percent ofStudents in Each
Level
3.5 4.1 24.7 67.7
* Participants' Large Group Medians
F9
253

Oregon Standard Setting Grade 10 MathematicsRecommended Cut Points* Plus/Minus Selected Standard Errors (SEs) of the Cut Score
Performance Level Does Not Yet Meet Nearly Meets Meets Exceeds
SE (cut score) 0.78 0.85 0.57
RecommendedCut Point* + 3 SE
233 239 248 + 3 SE
Percent ofStudents in Each
Level
35.5 20.4 31.5 12.6
RecommendedCut Point* + 2 SE
233 238 247 + 2 SE
Percent ofStudents in Each
Level
35.5 17.2 32.7 14.6
RecommendedCut Point* + 1 SE
232 237 247 + 1 SE
Percent ofStudents in Each
Level
32.5 16.7 36.2 14.6
RecommendedCut Point*
231 236 246 RecommendedCut Points*
Percent ofStudents in Each
Level
29.8 15.9 37.7 16.6
RecommendedCut Point* -1 SE
230 235 246 -1 SE
Percent ofStudents in Each
Level
27.1 15.1 41.1 16.7
RecommendedCut Point* -2 SE
230 234 245 -2 SE
Percent ofStudents in Each
Level
27.1 11.8 41.8 19.3
RecommendedCut Point* -3 SE
229 234 244 -3 SE
Percent ofStudents in Each
Level
24.6 14.3 39.1 22.0
* Participants' Large Group Medians
F10
254
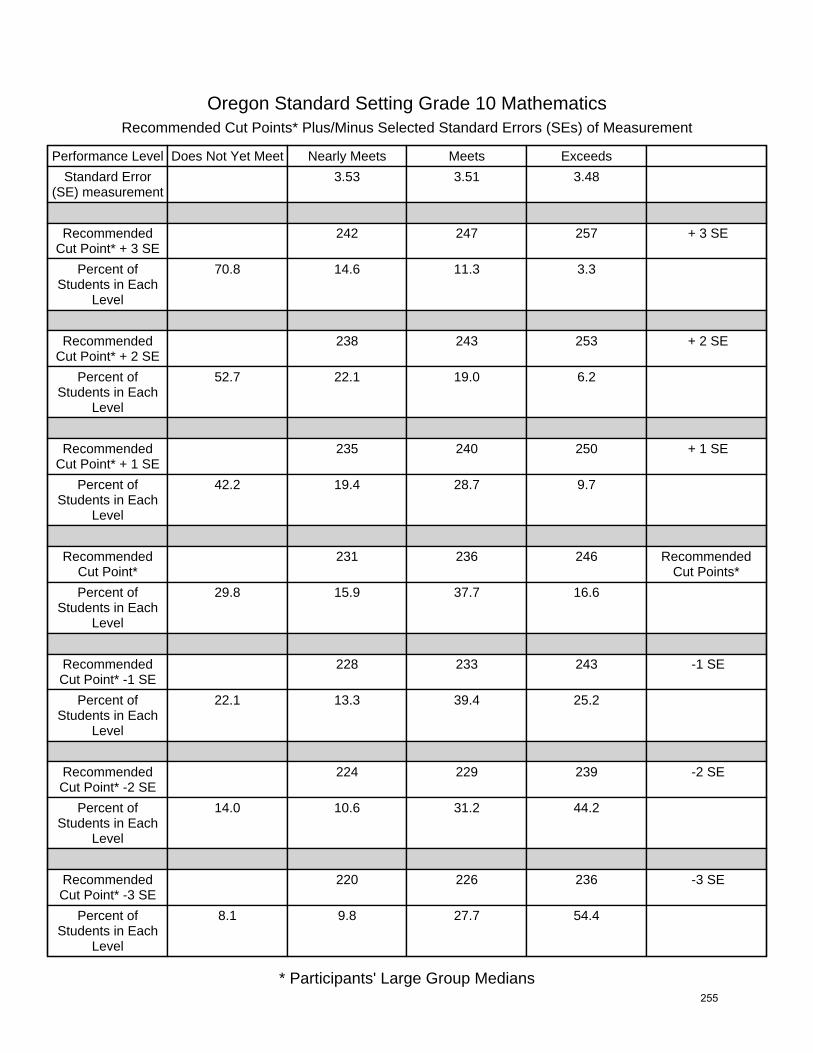
Oregon Standard Setting Grade 10 MathematicsRecommended Cut Points* Plus/Minus Selected Standard Errors (SEs) of Measurement
Performance Level Does Not Yet Meet Nearly Meets Meets Exceeds
Standard Error(SE) measurement
3.53 3.51 3.48
RecommendedCut Point* + 3 SE
242 247 257 + 3 SE
Percent ofStudents in Each
Level
70.8 14.6 11.3 3.3
RecommendedCut Point* + 2 SE
238 243 253 + 2 SE
Percent ofStudents in Each
Level
52.7 22.1 19.0 6.2
RecommendedCut Point* + 1 SE
235 240 250 + 1 SE
Percent ofStudents in Each
Level
42.2 19.4 28.7 9.7
RecommendedCut Point*
231 236 246 RecommendedCut Points*
Percent ofStudents in Each
Level
29.8 15.9 37.7 16.6
RecommendedCut Point* -1 SE
228 233 243 -1 SE
Percent ofStudents in Each
Level
22.1 13.3 39.4 25.2
RecommendedCut Point* -2 SE
224 229 239 -2 SE
Percent ofStudents in Each
Level
14.0 10.6 31.2 44.2
RecommendedCut Point* -3 SE
220 226 236 -3 SE
Percent ofStudents in Each
Level
8.1 9.8 27.7 54.4
* Participants' Large Group Medians
F11
255

Oregon Standard Setting Grade 10 MathematicsRecommended Cut Points* Plus/Minus Selected Standard Errors (SEs) of Measurement and the Cut Score
Performance Level Does Not Yet Meet Nearly Meets Meets Exceeds
Standard Error(SE) measurement
+ cutscore
3.61 3.61 3.53
RecommendedCut Point* + 3 SE
242 247 257 + 3 SE
Percent ofStudents in Each
Level
70.8 14.6 11.3 3.3
RecommendedCut Point* + 2 SE
238 243 253 + 2 SE
Percent ofStudents in Each
Level
52.7 22.1 19.0 6.2
RecommendedCut Point* + 1 SE
235 240 250 + 1 SE
Percent ofStudents in Each
Level
42.2 19.4 28.7 9.7
RecommendedCut Point*
231 236 246 RecommendedCut Points*
Percent ofStudents in Each
Level
29.8 15.9 37.7 16.6
RecommendedCut Point* -1 SE
227 232 243 -1 SE
Percent ofStudents in Each
Level
19.9 12.7 42.3 25.1
RecommendedCut Point* -2 SE
224 229 239 -2 SE
Percent ofStudents in Each
Level
14.0 10.6 31.2 44.2
RecommendedCut Point* -3 SE
220 225 235 -3 SE
Percent ofStudents in Each
Level
8.1 7.7 26.3 57.9
* Participants' Large Group Medians
F12
256

Oregon Standard Setting Grade 3 Reading/LiteratureRecommended Cut Points* Plus/Minus Selected Standard Errors (SEs) of the Cut Score
Performance Level Does Not Yet Meet Nearly Meets Meets Exceeds
SE (cut score) 0.38 0.72 0.78
RecommendedCut Point* + 3 SE
200 205 218 + 3 SE
Percent ofStudents in Each
Level
9.4 11.9 44.5 34.2
RecommendedCut Point* + 2 SE
200 205 218 + 2 SE
Percent ofStudents in Each
Level
9.4 11.9 44.5 34.2
RecommendedCut Point* + 1 SE
199 204 217 + 1 SE
Percent ofStudents in Each
Level
8.5 9.8 43.9 37.8
RecommendedCut Point*
199 203 216 RecommendedCut Points*
Percent ofStudents in Each
Level
8.5 7.1 42.4 42.0
RecommendedCut Point* -1 SE
199 202 215 -1 SE
Percent ofStudents in Each
Level
8.5 4.4 41.8 45.3
RecommendedCut Point* -2 SE
198 202 215 -2 SE
Percent ofStudents in Each
Level
7.5 5.3 41.8 45.4
RecommendedCut Point* -3 SE
198 201 214 -3 SE
Percent ofStudents in Each
Level
7.5 2.8 41.2 48.5
* Participants' Large Group Medians
F13
257

Oregon Standard Setting Grade 3 Reading/LiteratureRecommended Cut Points* Plus/Minus Selected Standard Errors (SEs) of Measurement
Performance Level Does Not Yet Meet Nearly Meets Meets Exceeds
Standard Error(SE) measurement
3.60 3.58 3.90
RecommendedCut Point* + 3 SE
210 214 228 + 3 SE
Percent ofStudents in Each
Level
37.5 14.0 36.8 11.7
RecommendedCut Point* + 2 SE
206 210 224 + 2 SE
Percent ofStudents in Each
Level
24.3 13.2 43.5 19.0
RecommendedCut Point* + 1 SE
203 207 220 + 1 SE
Percent ofStudents in Each
Level
15.6 11.7 44.3 28.4
RecommendedCut Point*
199 203 216 RecommendedCut Points*
Percent ofStudents in Each
Level
8.5 7.1 42.4 42.0
RecommendedCut Point* -1 SE
195 200 212 -1 SE
Percent ofStudents in Each
Level
5.1 4.3 35.0 55.6
RecommendedCut Point* -2 SE
192 196 208 -2 SE
Percent ofStudents in Each
Level
3.1 2.9 24.6 69.4
RecommendedCut Point* -3 SE
188 192 204 -3 SE
Percent ofStudents in Each
Level
1.2 1.8 15.3 81.7
* Participants' Large Group Medians
F14
258
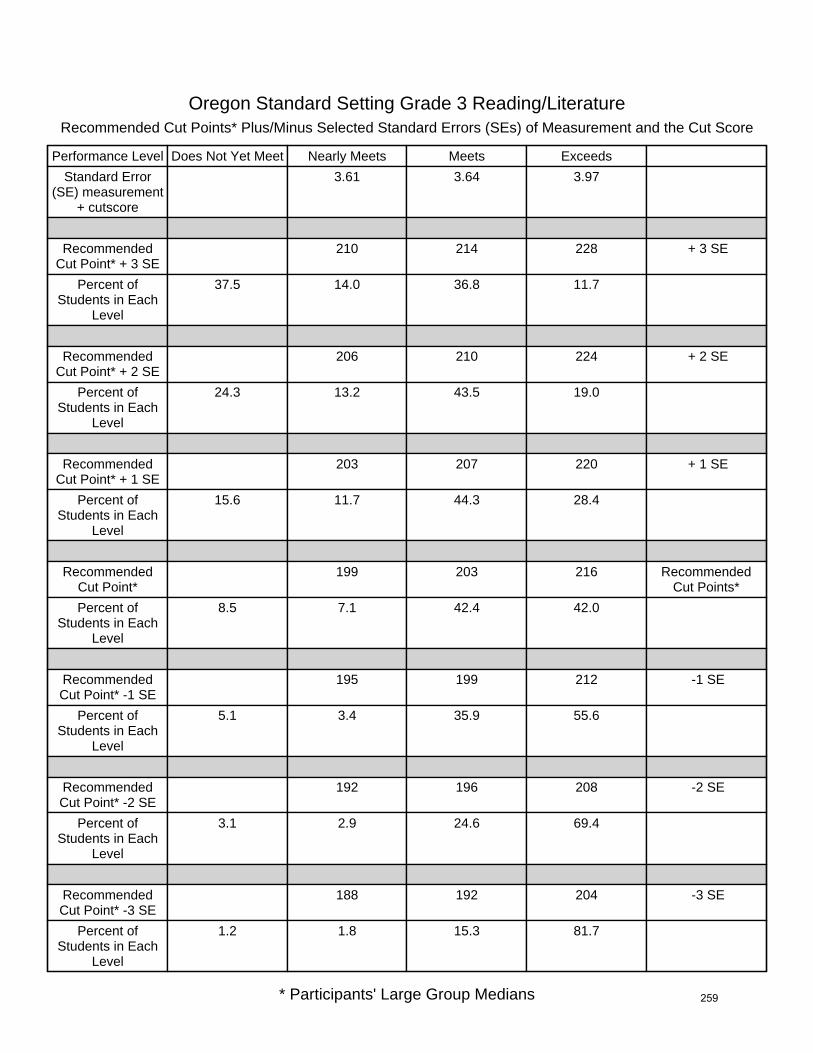
Oregon Standard Setting Grade 3 Reading/LiteratureRecommended Cut Points* Plus/Minus Selected Standard Errors (SEs) of Measurement and the Cut Score
Performance Level Does Not Yet Meet Nearly Meets Meets Exceeds
Standard Error(SE) measurement
+ cutscore
3.61 3.64 3.97
RecommendedCut Point* + 3 SE
210 214 228 + 3 SE
Percent ofStudents in Each
Level
37.5 14.0 36.8 11.7
RecommendedCut Point* + 2 SE
206 210 224 + 2 SE
Percent ofStudents in Each
Level
24.3 13.2 43.5 19.0
RecommendedCut Point* + 1 SE
203 207 220 + 1 SE
Percent ofStudents in Each
Level
15.6 11.7 44.3 28.4
RecommendedCut Point*
199 203 216 RecommendedCut Points*
Percent ofStudents in Each
Level
8.5 7.1 42.4 42.0
RecommendedCut Point* -1 SE
195 199 212 -1 SE
Percent ofStudents in Each
Level
5.1 3.4 35.9 55.6
RecommendedCut Point* -2 SE
192 196 208 -2 SE
Percent ofStudents in Each
Level
3.1 2.9 24.6 69.4
RecommendedCut Point* -3 SE
188 192 204 -3 SE
Percent ofStudents in Each
Level
1.2 1.8 15.3 81.7
* Participants' Large Group Medians
F15
259

Oregon Standard Setting Grade 5 Reading/LiteratureRecommended Cut Points* Plus/Minus Selected Standard Errors (SEs) of the Cut Score
Performance Level Does Not Yet Meet Nearly Meets Meets Exceeds
SE (cut score) 0.65 1.05 0.92
RecommendedCut Point* + 3 SE
211 221 233 + 3 SE
Percent ofStudents in Each
Level
10.0 31.7 40.9 17.4
RecommendedCut Point* + 2 SE
210 220 232 + 2 SE
Percent ofStudents in Each
Level
8.8 28.8 42.4 20.0
RecommendedCut Point* + 1 SE
210 219 231 + 1 SE
Percent ofStudents in Each
Level
8.8 24.3 43.8 23.1
RecommendedCut Point*
209 218 230 RecommendedCut Points*
Percent ofStudents in Each
Level
7.7 20.9 45.8 25.6
RecommendedCut Point* -1 SE
208 217 229 -1 SE
Percent ofStudents in Each
Level
6.7 17.6 47.1 28.6
RecommendedCut Point* -2 SE
208 216 228 -2 SE
Percent ofStudents in Each
Level
6.7 13.4 48.0 31.9
RecommendedCut Point* -3 SE
207 215 227 -3 SE
Percent ofStudents in Each
Level
5.8 10.4 48.6 35.2
* Participants' Large Group Medians
F16
260

Oregon Standard Setting Grade 5 Reading/LiteratureRecommended Cut Points* Plus/Minus Selected Standard Errors (SEs) of Measurement
Performance Level Does Not Yet Meet Nearly Meets Meets Exceeds
Standard Error(SE) measurement
3.42 3.41 4.10
RecommendedCut Point* + 3 SE
219 228 242 + 3 SE
Percent ofStudents in Each
Level
33.0 35.1 27.8 4.1
RecommendedCut Point* + 2 SE
216 225 238 + 2 SE
Percent ofStudents in Each
Level
20.1 37.8 34.1 8.0
RecommendedCut Point* + 1 SE
213 221 234 + 1 SE
Percent ofStudents in Each
Level
12.7 29.1 43.1 15.1
RecommendedCut Point*
209 218 230 RecommendedCut Points*
Percent ofStudents in Each
Level
7.7 20.9 45.8 25.6
RecommendedCut Point* -1 SE
206 215 226 -1 SE
Percent ofStudents in Each
Level
5.1 11.1 45.4 38.4
RecommendedCut Point* -2 SE
202 211 222 -2 SE
Percent ofStudents in Each
Level
2.8 7.2 36.1 53.9
RecommendedCut Point* -3 SE
199 208 218 -3 SE
Percent ofStudents in Each
Level
1.6 5.1 21.9 71.4
* Participants' Large Group Medians
F17
261

Oregon Standard Setting Grade 5 Reading/LiteratureRecommended Cut Points* Plus/Minus Selected Standard Errors (SEs) of Measurement and the Cut Score
Performance Level Does Not Yet Meet Nearly Meets Meets Exceeds
Standard Error(SE) measurement
+ cutscore
3.48 3.56 4.20
RecommendedCut Point* + 3 SE
220 229 243 + 3 SE
Percent ofStudents in Each
Level
37.6 33.9 25.4 3.1
RecommendedCut Point* + 2 SE
216 225 238 + 2 SE
Percent ofStudents in Each
Level
20.1 37.8 34.1 8.0
RecommendedCut Point* + 1 SE
213 222 234 + 1 SE
Percent ofStudents in Each
Level
12.7 33.4 38.7 15.2
RecommendedCut Point*
209 218 230 RecommendedCut Points*
Percent ofStudents in Each
Level
7.7 20.9 45.8 25.6
RecommendedCut Point* -1 SE
206 215 226 -1 SE
Percent ofStudents in Each
Level
5.1 11.1 45.4 38.4
RecommendedCut Point* -2 SE
202 211 222 -2 SE
Percent ofStudents in Each
Level
2.8 7.2 36.1 53.9
RecommendedCut Point* -3 SE
199 207 217 -3 SE
Percent ofStudents in Each
Level
1.6 4.2 18.5 75.7
* Participants' Large Group Medians
F18
262

Oregon Standard Setting Grade 8 Reading/LiteratureRecommended Cut Points* Plus/Minus Selected Standard Errors (SEs) of the Cut Score
Performance Level Does Not Yet Meet Nearly Meets Meets Exceeds
SE (cut score) 0.84 0.93 1.01
RecommendedCut Point* + 3 SE
227 233 244 + 3 SE
Percent ofStudents in Each
Level
22.6 22.1 41.7 13.6
RecommendedCut Point* + 2 SE
226 232 243 + 2 SE
Percent ofStudents in Each
Level
20.1 19.6 44.4 15.9
RecommendedCut Point* + 1 SE
225 231 242 + 1 SE
Percent ofStudents in Each
Level
17.9 16.6 46.7 18.8
RecommendedCut Point*
224 230 241 RecommendedCut Points*
Percent ofStudents in Each
Level
15.9 15.2 47.4 21.5
RecommendedCut Point* -1 SE
223 229 240 -1 SE
Percent ofStudents in Each
Level
14.1 14.0 46.7 25.2
RecommendedCut Point* -2 SE
222 228 239 -2 SE
Percent ofStudents in Each
Level
12.5 12.8 45.8 28.9
RecommendedCut Point* -3 SE
222 227 238 -3 SE
Percent ofStudents in Each
Level
12.5 10.1 44.7 32.7
* Participants' Large Group Medians
F19
263

Oregon Standard Setting Grade 8 Reading/LiteratureRecommended Cut Points* Plus/Minus Selected Standard Errors (SEs) of Measurement
Performance Level Does Not Yet Meet Nearly Meets Meets Exceeds
Standard Error(SE) measurement
3.39 3.39 3.96
RecommendedCut Point* + 3 SE
234 240 253 + 3 SE
Percent ofStudents in Each
Level
49.8 25.0 23.0 2.2
RecommendedCut Point* + 2 SE
231 237 249 + 2 SE
Percent ofStudents in Each
Level
34.5 29.1 31.0 5.4
RecommendedCut Point* + 1 SE
227 233 245 + 1 SE
Percent ofStudents in Each
Level
22.6 22.1 43.8 11.5
RecommendedCut Point*
224 230 241 RecommendedCut Points*
Percent ofStudents in Each
Level
15.9 15.2 47.4 21.5
RecommendedCut Point* -1 SE
221 227 237 -1 SE
Percent ofStudents in Each
Level
11.1 11.5 41.0 36.4
RecommendedCut Point* -2 SE
217 223 233 -2 SE
Percent ofStudents in Each
Level
6.4 7.7 30.6 55.3
RecommendedCut Point* -3 SE
214 220 229 -3 SE
Percent ofStudents in Each
Level
4.0 5.8 18.4 71.8
* Participants' Large Group Medians
F20
264

Oregon Standard Setting Grade 8 Reading/LiteratureRecommended Cut Points* Plus/Minus Selected Standard Errors (SEs) of Measurement and the Cut Score
Performance Level Does Not Yet Meet Nearly Meets Meets Exceeds
Standard Error(SE) measurement
+ cutscore
3.48 3.51 4.08
RecommendedCut Point* + 3 SE
235 241 253 + 3 SE
Percent ofStudents in Each
Level
54.6 23.8 19.4 2.2
RecommendedCut Point* + 2 SE
231 237 249 + 2 SE
Percent ofStudents in Each
Level
34.5 29.1 31.0 5.4
RecommendedCut Point* + 1 SE
228 234 245 + 1 SE
Percent ofStudents in Each
Level
25.3 24.5 38.7 11.5
RecommendedCut Point*
224 230 241 RecommendedCut Points*
Percent ofStudents in Each
Level
15.9 15.2 47.4 21.5
RecommendedCut Point* -1 SE
221 227 237 -1 SE
Percent ofStudents in Each
Level
11.1 11.5 41.0 36.4
RecommendedCut Point* -2 SE
217 223 233 -2 SE
Percent ofStudents in Each
Level
6.4 7.7 30.6 55.3
RecommendedCut Point* -3 SE
214 220 229 -3 SE
Percent ofStudents in Each
Level
4.0 5.8 18.4 71.8
* Participants' Large Group Medians
F21
265

Oregon Standard Setting Grade 10 Reading/LiteratureRecommended Cut Points* Plus/Minus Selected Standard Errors (SEs) of the Cut Score
Performance Level Does Not Yet Meet Nearly Meets Meets Exceeds
SE (cut score) 0.75 1.26 0.69
RecommendedCut Point* + 3 SE
233 240 250 + 3 SE
Percent ofStudents in Each
Level
26.4 24.0 37.7 11.9
RecommendedCut Point* + 2 SE
233 239 249 + 2 SE
Percent ofStudents in Each
Level
26.4 19.0 40.2 14.4
RecommendedCut Point* + 1 SE
232 237 249 + 1 SE
Percent ofStudents in Each
Level
23.7 15.1 46.7 14.5
RecommendedCut Point*
231 236 248 RecommendedCut Points*
Percent ofStudents in Each
Level
21.3 14.2 47.6 16.9
RecommendedCut Point* -1 SE
230 235 247 -1 SE
Percent ofStudents in Each
Level
19.3 12.8 47.9 20.0
RecommendedCut Point* -2 SE
230 234 247 -2 SE
Percent ofStudents in Each
Level
19.3 9.9 50.8 20.0
RecommendedCut Point* -3 SE
229 232 246 -3 SE
Percent ofStudents in Each
Level
17.2 6.5 52.9 23.4
* Participants' Large Group Medians
F22
266

Oregon Standard Setting Grade 10 Reading/LiteratureRecommended Cut Points* Plus/Minus Selected Standard Errors (SEs) of Measurement
Performance Level Does Not Yet Meet Nearly Meets Meets Exceeds
Standard Error(SE) measurement
3.38 3.39 3.85
RecommendedCut Point* + 3 SE
241 246 260 + 3 SE
Percent ofStudents in Each
Level
55.4 21.2 22.3 1.1
RecommendedCut Point* + 2 SE
238 243 256 + 2 SE
Percent ofStudents in Each
Level
42.0 22.4 32.3 3.3
RecommendedCut Point* + 1 SE
234 239 252 + 1 SE
Percent ofStudents in Each
Level
29.1 16.2 46.6 8.1
RecommendedCut Point*
231 236 248 RecommendedCut Points*
Percent ofStudents in Each
Level
21.3 14.2 47.6 16.9
RecommendedCut Point* -1 SE
228 233 244 -1 SE
Percent ofStudents in Each
Level
15.5 10.9 42.6 31.0
RecommendedCut Point* -2 SE
224 229 240 -2 SE
Percent ofStudents in Each
Level
9.5 7.7 33.1 49.7
RecommendedCut Point* -3 SE
221 226 237 -3 SE
Percent ofStudents in Each
Level
6.3 6.0 26.6 61.1
* Participants' Large Group Medians
F23
267

Oregon Standard Setting Grade 10 Reading/LiteratureRecommended Cut Points* Plus/Minus Selected Standard Errors (SEs) of Measurement and the Cut Score
Performance Level Does Not Yet Meet Nearly Meets Meets Exceeds
Standard Error(SE) measurement
+ cutscore
3.45 3.61 3.90
RecommendedCut Point* + 3 SE
241 247 260 + 3 SE
Percent ofStudents in Each
Level
55.4 24.6 18.8 1.2
RecommendedCut Point* + 2 SE
238 243 256 + 2 SE
Percent ofStudents in Each
Level
42.0 22.4 32.3 3.3
RecommendedCut Point* + 1 SE
235 240 252 + 1 SE
Percent ofStudents in Each
Level
32.1 18.3 41.6 8.0
RecommendedCut Point*
231 236 248 RecommendedCut Points*
Percent ofStudents in Each
Level
21.3 14.2 47.6 16.9
RecommendedCut Point* -1 SE
228 232 244 -1 SE
Percent ofStudents in Each
Level
15.5 8.3 45.2 31.0
RecommendedCut Point* -2 SE
224 229 240 -2 SE
Percent ofStudents in Each
Level
9.5 7.7 33.1 49.7
RecommendedCut Point* -3 SE
221 225 236 -3 SE
Percent ofStudents in Each
Level
6.3 4.6 24.6 64.5
* Participants' Large Group Medians
F24
268

Oregon Standard Setting Grade 5 ScienceRecommended Cut Points* Plus/Minus Selected Standard Errors (SEs) of the Cut Score
Performance Level Does Not Yet Meet Nearly Meets Meets Exceeds
SE (cut score) 1.08 0.59 0.70
RecommendedCut Point* + 3 SE
219 227 240 + 3 SE
Percent ofStudents in Each
Level
12.4 22.5 48.4 16.7
RecommendedCut Point* + 2 SE
218 226 239 + 2 SE
Percent ofStudents in Each
Level
10.8 20.2 49.5 19.5
RecommendedCut Point* + 1 SE
217 226 239 + 1 SE
Percent ofStudents in Each
Level
9.3 21.7 49.5 19.5
RecommendedCut Point*
216 225 238 RecommendedCut Points*
Percent ofStudents in Each
Level
8.0 19.1 50.5 22.4
RecommendedCut Point* -1 SE
215 224 237 -1 SE
Percent ofStudents in Each
Level
6.9 16.9 50.8 25.4
RecommendedCut Point* -2 SE
214 224 237 -2 SE
Percent ofStudents in Each
Level
5.8 18.0 50.8 25.4
RecommendedCut Point* -3 SE
213 223 236 -3 SE
Percent ofStudents in Each
Level
4.9 15.6 51.2 28.3
* Participants' Large Group Medians
F25
269

Oregon Standard Setting Grade 5 ScienceRecommended Cut Points* Plus/Minus Selected Standard Errors (SEs) of Measurement
Performance Level Does Not Yet Meet Nearly Meets Meets Exceeds
Standard Error(SE) measurement
3.02 2.99 3.36
RecommendedCut Point* + 3 SE
225 234 248 + 3 SE
Percent ofStudents in Each
Level
27.1 37.3 31.4 4.2
RecommendedCut Point* + 2 SE
222 231 245 + 2 SE
Percent ofStudents in Each
Level
18.2 33.8 40.8 7.2
RecommendedCut Point* + 1 SE
219 228 241 + 1 SE
Percent ofStudents in Each
Level
12.4 26.7 45.9 15.0
RecommendedCut Point*
216 225 238 RecommendedCut Points*
Percent ofStudents in Each
Level
8.0 19.1 50.5 22.4
RecommendedCut Point* -1 SE
213 222 235 -1 SE
Percent ofStudents in Each
Level
4.9 13.3 49.9 31.9
RecommendedCut Point* -2 SE
210 219 231 -2 SE
Percent ofStudents in Each
Level
2.5 9.9 39.6 48.0
RecommendedCut Point* -3 SE
207 216 228 -3 SE
Percent ofStudents in Each
Level
1.0 7.0 31.1 60.9
* Participants' Large Group Medians
F26
270

Oregon Standard Setting Grade 5 ScienceRecommended Cut Points* Plus/Minus Selected Standard Errors (SEs) of Measurement and the Cut Score
Performance Level Does Not Yet Meet Nearly Meets Meets Exceeds
Standard Error(SE) measurement
+ cutscore
3.20 3.04 3.43
RecommendedCut Point* + 3 SE
226 234 248 + 3 SE
Percent ofStudents in Each
Level
31.0 33.4 31.4 4.2
RecommendedCut Point* + 2 SE
222 231 245 + 2 SE
Percent ofStudents in Each
Level
18.2 33.8 40.8 7.2
RecommendedCut Point* + 1 SE
219 228 242 + 1 SE
Percent ofStudents in Each
Level
12.4 26.7 48.3 12.6
RecommendedCut Point*
216 225 238 RecommendedCut Points*
Percent ofStudents in Each
Level
8.0 19.1 50.5 22.4
RecommendedCut Point* -1 SE
213 222 235 -1 SE
Percent ofStudents in Each
Level
4.9 13.3 49.9 31.9
RecommendedCut Point* -2 SE
210 219 231 -2 SE
Percent ofStudents in Each
Level
2.5 9.9 39.6 48.0
RecommendedCut Point* -3 SE
206 216 228 -3 SE
Percent ofStudents in Each
Level
0.8 7.2 31.1 60.9
* Participants' Large Group Medians
F27
271

Oregon Standard Setting Grade 8 ScienceRecommended Cut Points* Plus/Minus Selected Standard Errors (SEs) of the Cut Score
Performance Level Does Not Yet Meet Nearly Meets Meets Exceeds
SE (cut score) 1.11 0.99 0.69
RecommendedCut Point* + 3 SE
232 237 248 + 3 SE
Percent ofStudents in Each
Level
28.9 18.5 37.5 15.1
RecommendedCut Point* + 2 SE
231 236 247 + 2 SE
Percent ofStudents in Each
Level
26.1 17.1 39.1 17.7
RecommendedCut Point* + 1 SE
230 235 247 + 1 SE
Percent ofStudents in Each
Level
23.6 15.6 43.1 17.7
RecommendedCut Point*
229 234 246 RecommendedCut Points*
Percent ofStudents in Each
Level
21.3 14.3 44.2 20.2
RecommendedCut Point* -1 SE
228 233 245 -1 SE
Percent ofStudents in Each
Level
19.1 12.7 45.2 23.0
RecommendedCut Point* -2 SE
227 232 245 -2 SE
Percent ofStudents in Each
Level
16.9 12.0 48.1 23.0
RecommendedCut Point* -3 SE
226 231 244 -3 SE
Percent ofStudents in Each
Level
15.0 11.1 47.7 26.2
* Participants' Large Group Medians
F28
272

Oregon Standard Setting Grade 8 ScienceRecommended Cut Points* Plus/Minus Selected Standard Errors (SEs) of Measurement
Performance Level Does Not Yet Meet Nearly Meets Meets Exceeds
Standard Error(SE) measurement
2.95 2.96 3.27
RecommendedCut Point* + 3 SE
238 243 256 + 3 SE
Percent ofStudents in Each
Level
51.4 18.9 25.3 4.4
RecommendedCut Point* + 2 SE
235 240 253 + 2 SE
Percent ofStudents in Each
Level
39.2 20.2 33.6 7.0
RecommendedCut Point* + 1 SE
232 237 249 + 1 SE
Percent ofStudents in Each
Level
28.9 18.5 39.4 13.2
RecommendedCut Point*
229 234 246 RecommendedCut Points*
Percent ofStudents in Each
Level
21.3 14.3 44.2 20.2
RecommendedCut Point* -1 SE
226 231 243 -1 SE
Percent ofStudents in Each
Level
15.0 11.1 44.3 29.6
RecommendedCut Point* -2 SE
223 228 240 -2 SE
Percent ofStudents in Each
Level
9.7 9.3 40.3 40.7
RecommendedCut Point* -3 SE
220 225 236 -3 SE
Percent ofStudents in Each
Level
5.0 8.1 30.0 56.9
* Participants' Large Group Medians
F29
273

Oregon Standard Setting Grade 8 ScienceRecommended Cut Points* Plus/Minus Selected Standard Errors (SEs) of Measurement and the Cut Score
Performance Level Does Not Yet Meet Nearly Meets Meets Exceeds
Standard Error(SE) measurement
+ cutscore
3.15 3.11 3.34
RecommendedCut Point* + 3 SE
239 243 256 + 3 SE
Percent ofStudents in Each
Level
55.4 15.0 25.3 4.3
RecommendedCut Point* + 2 SE
235 240 253 + 2 SE
Percent ofStudents in Each
Level
39.2 20.2 33.6 7.0
RecommendedCut Point* + 1 SE
232 237 249 + 1 SE
Percent ofStudents in Each
Level
28.9 18.5 39.4 13.2
RecommendedCut Point*
229 234 246 RecommendedCut Points*
Percent ofStudents in Each
Level
21.3 14.3 44.2 20.2
RecommendedCut Point* -1 SE
226 231 243 -1 SE
Percent ofStudents in Each
Level
15.0 11.1 44.3 29.6
RecommendedCut Point* -2 SE
223 228 239 -2 SE
Percent ofStudents in Each
Level
9.7 9.3 36.3 44.7
RecommendedCut Point* -3 SE
220 225 236 -3 SE
Percent ofStudents in Each
Level
5.0 8.1 30.0 56.9
* Participants' Large Group Medians
F30
274

Oregon Standard Setting Grade 10 ScienceRecommended Cut Points* Plus/Minus Selected Standard Errors (SEs) of the Cut Score
Performance Level Does Not Yet Meet Nearly Meets Meets Exceeds
SE (cut score) 1.35 0.79 1.55
RecommendedCut Point* + 3 SE
239 242 254 + 3 SE
Percent ofStudents in Each
Level
38.5 13.5 39.4 8.6
RecommendedCut Point* + 2 SE
238 242 252 + 2 SE
Percent ofStudents in Each
Level
36.6 15.4 35.5 12.5
RecommendedCut Point* + 1 SE
236 241 251 + 1 SE
Percent ofStudents in Each
Level
29.8 19.3 35.6 15.3
RecommendedCut Point*
235 240 249 RecommendedCut Points*
Percent ofStudents in Each
Level
26.6 17.4 35.3 20.7
RecommendedCut Point* -1 SE
234 239 248 -1 SE
Percent ofStudents in Each
Level
23.7 14.8 37.0 24.5
RecommendedCut Point* -2 SE
232 239 246 -2 SE
Percent ofStudents in Each
Level
19.6 19.0 30.4 31.0
RecommendedCut Point* -3 SE
231 238 244 -3 SE
Percent ofStudents in Each
Level
17.1 19.5 24.8 38.6
* Participants' Large Group Medians
F31
275

Oregon Standard Setting Grade 10 ScienceRecommended Cut Points* Plus/Minus Selected Standard Errors (SEs) of Measurement
Performance Level Does Not Yet Meet Nearly Meets Meets Exceeds
Standard Error(SE) measurement
3.64 3.76 4.27
RecommendedCut Point* + 3 SE
246 251 262 + 3 SE
Percent ofStudents in Each
Level
68.9 15.8 13.2 2.1
RecommendedCut Point* + 2 SE
242 248 258 + 2 SE
Percent ofStudents in Each
Level
52.0 23.5 20.1 4.4
RecommendedCut Point* + 1 SE
239 244 253 + 1 SE
Percent ofStudents in Each
Level
38.5 22.9 27.4 11.2
RecommendedCut Point*
235 240 249 RecommendedCut Points*
Percent ofStudents in Each
Level
26.6 17.4 35.3 20.7
RecommendedCut Point* -1 SE
231 236 245 -1 SE
Percent ofStudents in Each
Level
17.1 12.7 34.6 35.6
RecommendedCut Point* -2 SE
228 233 241 -2 SE
Percent ofStudents in Each
Level
11.5 10.8 26.8 50.9
RecommendedCut Point* -3 SE
224 229 236 -3 SE
Percent ofStudents in Each
Level
5.9 7.8 16.2 70.1
* Participants' Large Group Medians
F32
276
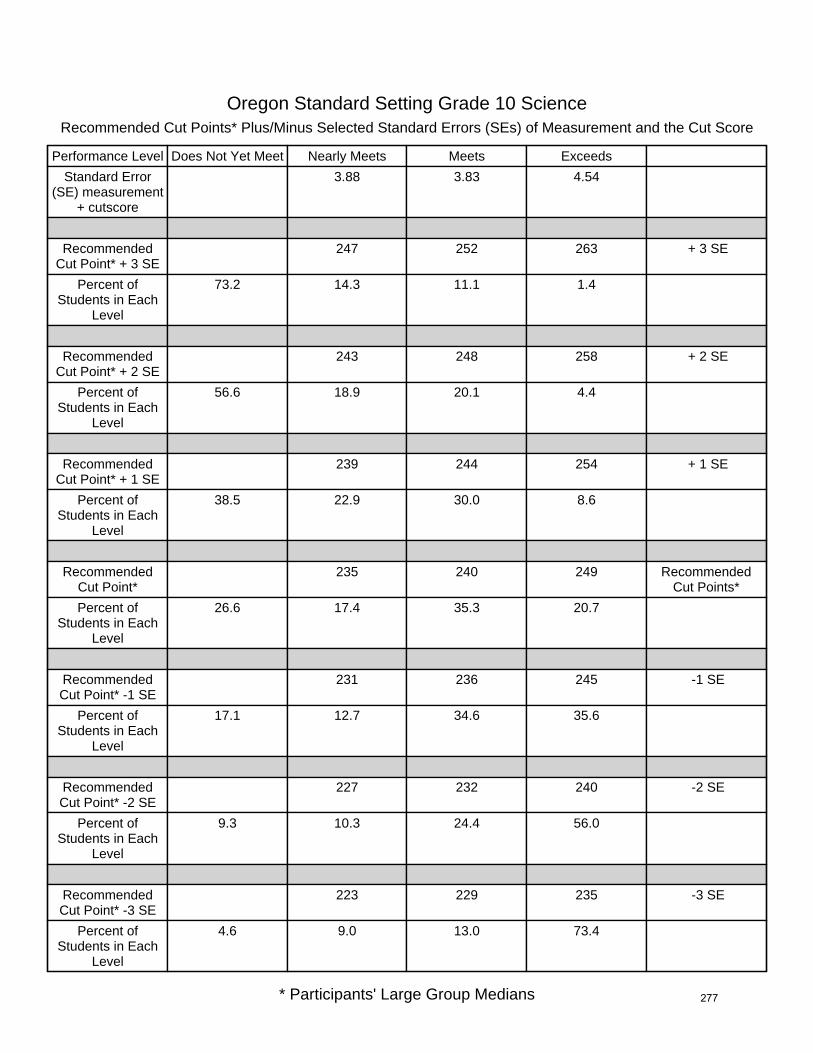
Oregon Standard Setting Grade 10 ScienceRecommended Cut Points* Plus/Minus Selected Standard Errors (SEs) of Measurement and the Cut Score
Performance Level Does Not Yet Meet Nearly Meets Meets Exceeds
Standard Error(SE) measurement
+ cutscore
3.88 3.83 4.54
RecommendedCut Point* + 3 SE
247 252 263 + 3 SE
Percent ofStudents in Each
Level
73.2 14.3 11.1 1.4
RecommendedCut Point* + 2 SE
243 248 258 + 2 SE
Percent ofStudents in Each
Level
56.6 18.9 20.1 4.4
RecommendedCut Point* + 1 SE
239 244 254 + 1 SE
Percent ofStudents in Each
Level
38.5 22.9 30.0 8.6
RecommendedCut Point*
235 240 249 RecommendedCut Points*
Percent ofStudents in Each
Level
26.6 17.4 35.3 20.7
RecommendedCut Point* -1 SE
231 236 245 -1 SE
Percent ofStudents in Each
Level
17.1 12.7 34.6 35.6
RecommendedCut Point* -2 SE
227 232 240 -2 SE
Percent ofStudents in Each
Level
9.3 10.3 24.4 56.0
RecommendedCut Point* -3 SE
223 229 235 -3 SE
Percent ofStudents in Each
Level
4.6 9.0 13.0 73.4
* Participants' Large Group Medians
F33
277

SECTION H
Graphical Representations of
Participants’ Judgments
278

Math
em
ati
csB
ase
d o
n P
art
icip
an
ts' R
ou
nd
3 B
oo
km
ark
Reco
mm
en
dati
on
sQ
uad
ratic
inte
rpola
tion u
sed t
o e
stab
lish c
ut
score
s fo
r G
rades
4,
6,
and 7
**
*3
45
67
81
0D
oes
No
t Y
et
Meet
11.4
%10.7
%13.1
%13.2
%17.0
%19.2
%29.8
%N
earl
y M
eets
8.2
%13.2
%14.4
%12.6
%12.2
%13.1
%15.9
%M
eets
45.2
%44.8
%48.9
%49.1
%45.5
%40.3
%37.7
%Exce
ed
s35.2
%31.3
%23.7
%25.1
%25.3
%27.4
%16.7
%M
eets
& A
bo
ve
80
.4%
76
.1%
72
.6%
74
.3%
70
.8%
67
.7%
54
.4%
89%
89%
87%
87%
83%
81%
70%
Nearl
y M
eets
20
1208
21
4215
221
22
52
31
Meets
20
4212
21
8220
226
23
02
36
Exce
ed
s2
15
224
23
0233
239
24
12
46
279

Math
em
ati
csB
ase
d o
n T
ab
le L
ead
ers
' S
mo
oth
ed
Reco
mm
en
dati
on
sFr
om
the
cross
-gra
de
articu
lation d
iscu
ssio
n o
f D
ecem
ber
13,
2006
**
*3
45
67
81
0D
oes
No
t Y
et
Meet
11.4
%10.7
%13.1
%15.2
%17.0
%19.2
%29.8
%N
earl
y M
eets
11.8
%13.2
%14.4
%14.5
%12.2
%13.1
%15.9
%M
eets
49.7
%48.1
%46.1
%42.2
%42.5
%40.3
%37.7
%Exce
ed
s27.1
%28.0
%26.4
%28.1
%28.3
%27.4
%16.7
%M
eets
& A
bo
ve
76
.7%
76
.1%
72
.6%
70
.3%
70
.8%
67
.7%
54
.4%
89%
89%
87%
85%
83%
81%
70%
Nearl
y M
eets
20
1208
21
4216
221
22
52
31
Meets
20
5212
21
8221
226
23
02
36
Exce
ed
s2
17
225
22
9232
238
24
12
46
280
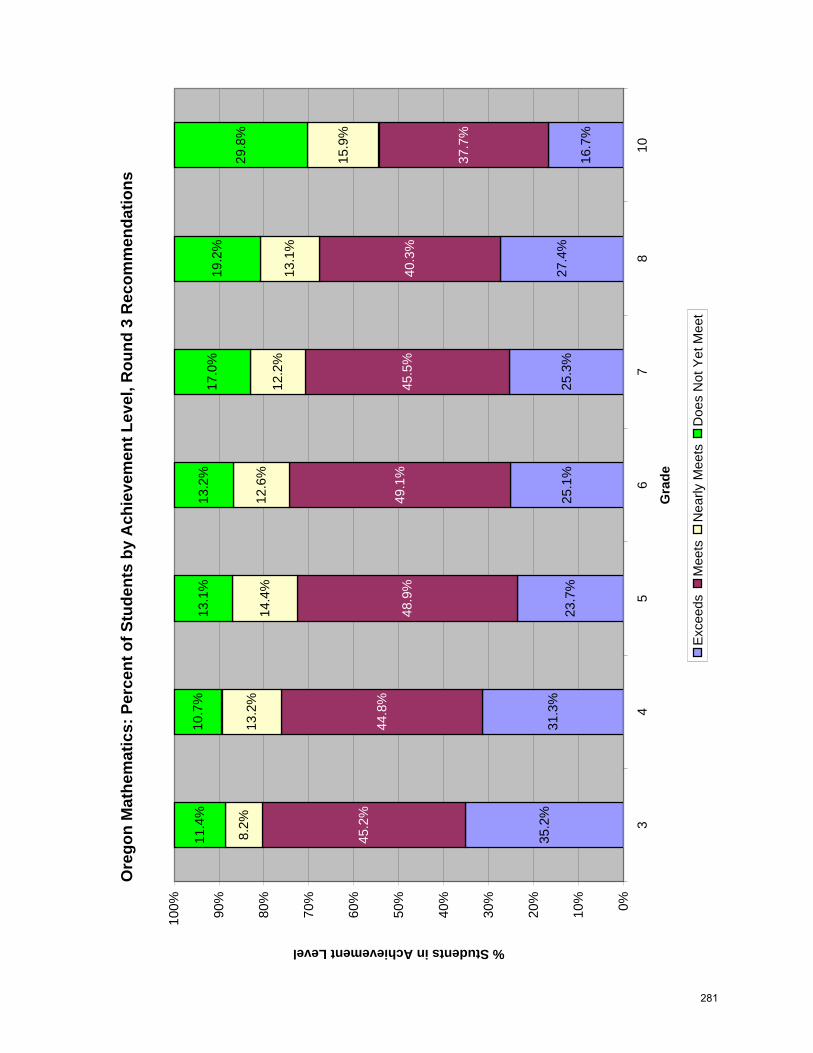
Ore
gon
Mat
hem
atic
s: P
erce
nt o
f Stu
dent
s by
Ach
ieve
men
t Lev
el, R
ound
3 R
ecom
men
datio
ns
35.2
%31
.3%
23.7
%25
.1%
25.3
%27
.4%
16.7
%
45.2
%44
.8%
48.9
%49
.1%
45.5
%40
.3%
37.7
%
8.2%
13.2
%14
.4%
12.6
%12
.2%
13.1
%
15.9
%
11.4
%10
.7%
13.1
%17
.0%
19.2
%
29.8
%
13.2
%
0%10%
20%
30%
40%
50%
60%
70%
80%
90%
100%
34
56
78
10
Gra
de
% Students in Achievement Level
Exc
eeds
Mee
tsN
early
Mee
tsD
oes
Not
Yet
Mee
t
281

Ore
gon
Mat
hem
atic
s: P
erce
nt o
f Stu
dent
s by
Ach
ieve
men
t Lev
el, T
able
Lea
der S
moo
thin
g R
ecom
men
datio
ns
27.1
%28
.0%
26.4
%28
.1%
28.3
%27
.4%
16.7
%
49.7
%48
.1%
46.1
%42
.2%
42.5
%40
.3%
37.7
%
11.8
%13
.2%
14.4
%14
.5%
12.2
%13
.1%
15.9
%
11.4
%10
.7%
13.1
%17
.0%
19.2
%
29.8
%
15.2
%
0%10%
20%
30%
40%
50%
60%
70%
80%
90%
100%
34
56
78
10
Gra
de
% Students in Achievement Level
Exc
eeds
Mee
tsN
early
Mee
tsD
oes
Not
Yet
Mee
t
282

Read
ing
Base
d o
n P
art
icip
an
ts' R
ou
nd
3 B
oo
km
ark
Reco
mm
en
dati
on
sQ
uad
ratic
inte
rpola
tion u
sed t
o e
stab
lish c
ut
score
s fo
r G
rades
4,
6,
and 7
**
*3
45
67
81
0D
oes
No
t Y
et
Meet
8.5
%7.7
%7.7
%10.4
%11.4
%15.9
%21.3
%N
earl
y M
eets
7.1
%12.7
%20.9
%19.2
%19.3
%15.2
%14.2
%M
eets
42.4
%45.6
%45.8
%45.1
%49.7
%47.4
%47.6
%Exce
ed
s42.0
%34.0
%25.6
%25.3
%19.6
%21.6
%16.9
%M
eets
& A
bo
ve
84
.4%
79
.6%
71
.4%
70
.4%
69
.3%
68
.9%
64
.6%
92%
92%
92%
90%
89%
84%
79%
Nearl
y M
eets
19
9205
20
9214
219
22
42
31
Meets
20
3211
21
8222
227
23
02
36
Exce
ed
s2
16
223
23
0234
241
24
12
48
283

Read
ing
Base
d o
n T
ab
le L
ead
ers
' S
mo
oth
ed
Reco
mm
en
dati
on
sFr
om
the
cross
-gra
de
articu
lation d
iscu
ssio
n o
f D
ecem
ber
13,
2006
**
*3
45
67
81
0D
oes
No
t Y
et
Meet
8.5
%7.7
%7.7
%10.4
%11.4
%15.9
%21.3
%N
earl
y M
eets
9.8
%12.7
%20.9
%19.2
%19.3
%18.6
%14.2
%M
eets
47.5
%45.6
%45.8
%45.1
%44.1
%43.9
%47.6
%Exce
ed
s34.2
%34.0
%25.6
%25.3
%25.2
%21.6
%16.9
%M
eets
& A
bo
ve
81
.7%
79
.6%
71
.4%
70
.4%
69
.3%
65
.5%
64
.6%
92%
92%
92%
90%
89%
84%
79%
Nearl
y M
eets
19
9205
20
9214
219
22
42
31
Meets
20
4211
21
8222
227
23
12
36
Exce
ed
s2
18
223
23
0234
239
24
12
48
284
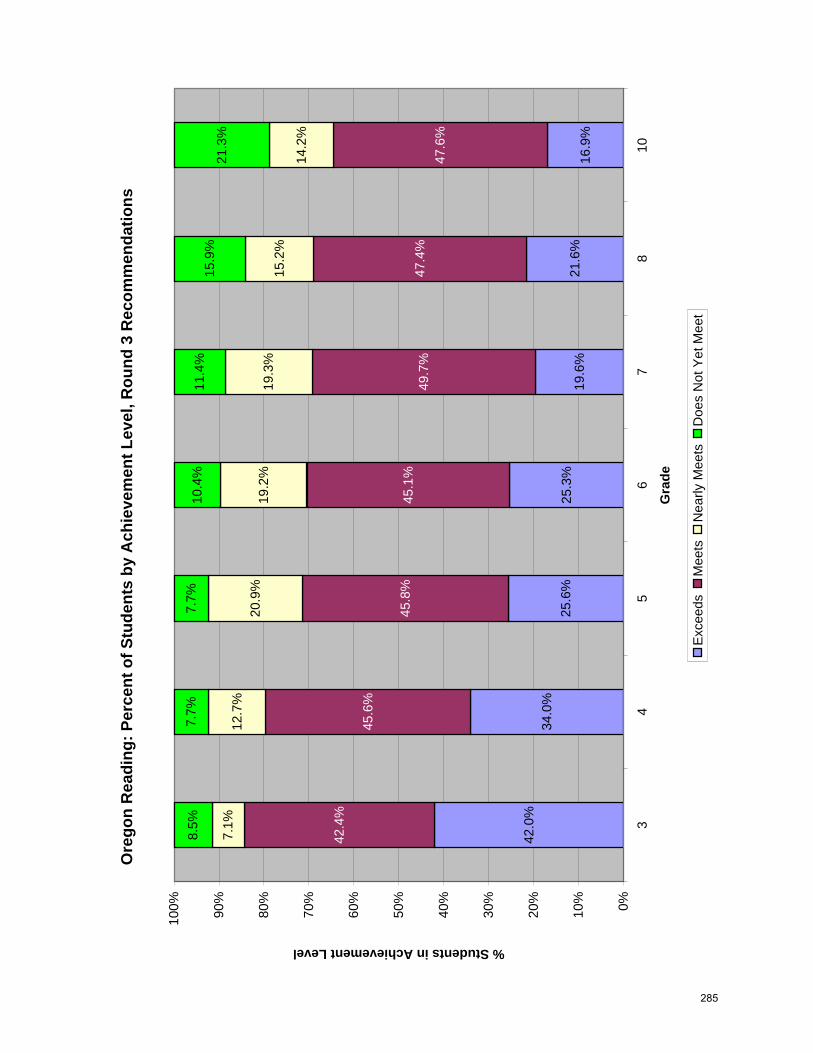
Ore
gon
Rea
ding
: Per
cent
of S
tude
nts
by A
chie
vem
ent L
evel
, Rou
nd 3
Rec
omm
enda
tions
42.0
%34
.0%
25.6
%25
.3%
19.6
%21
.6%
16.9
%
42.4
%
45.6
%
45.8
%45
.1%
49.7
%47
.4%
47.6
%
7.1%
12.7
%20
.9%
19.2
%19
.3%
15.2
%14
.2%
8.5%
7.7%
7.7%
11.4
%15
.9%
21.3
%
10.4
%
0%10%
20%
30%
40%
50%
60%
70%
80%
90%
100%
34
56
78
10
Gra
de
% Students in Achievement Level
Exc
eeds
Mee
tsN
early
Mee
tsD
oes
Not
Yet
Mee
t
285

Ore
gon
Rea
ding
: Per
cent
of S
tude
nts
by A
chie
vem
ent L
evel
, Tab
le L
eade
r Sm
ooth
ing
Rec
omm
enda
tions
34.2
%34
.0%
25.6
%25
.3%
25.2
%21
.6%
16.9
%
47.5
%45
.6%
45.8
%45
.1%
44.1
%43
.9%
47.6
%
9.8%
12.7
%20
.9%
19.2
%19
.3%
18.6
%14
.2%
8.5%
7.7%
7.7%
11.4
%15
.9%
21.3
%
10.4
%
0%10%
20%
30%
40%
50%
60%
70%
80%
90%
100%
34
56
78
10
Gra
de
% Students in Achievement Level
Exc
eeds
Mee
tsN
early
Mee
tsD
oes
Not
Yet
Mee
t
286

Sci
en
ceB
ase
d o
n P
art
icip
an
ts' R
ou
nd
3 B
oo
km
ark
Reco
mm
en
dati
on
sSta
ndar
d s
etting w
ork
shop h
eld D
ecem
ber
11-1
3,
2006
58
10
Do
es
No
t Y
et
Meet
8.0
%21.3
%26.6
%Im
pact
Nearl
y M
eets
19.1
%14.3
%17.4
%M
eets
50.5
%44.2
%35.3
%Exce
ed
s22.4
%20.2
%20.7
%M
eets
& A
bo
ve
72
.9%
64
.4%
56
.0%
92%
79%
73%
Nearl
y M
eets
21
62
29
23
5C
ut
Sco
reM
eets
22
52
34
24
0Exce
ed
s2
38
24
62
49
287

Sci
en
ceB
ase
d o
n T
ab
le L
ead
ers
' S
mo
oth
ed
Reco
mm
en
dati
on
sFr
om
the
cross
-gra
de
articu
lation d
iscu
ssio
n o
f D
ecem
ber
13,
2006
58
10
Do
es
No
t Y
et
Meet
8.0
%21.3
%26.6
%Im
pact
Nearl
y M
eets
19.1
%14.3
%17.4
%M
eets
50.5
%44.2
%35.3
%Exce
ed
s22.4
%20.2
%20.7
%M
eets
& A
bo
ve
72
.9%
64
.4%
56
.0%
92%
79%
73%
Nearl
y M
eets
21
62
29
23
5C
ut
Sco
reM
eets
22
52
34
24
0Exce
ed
s2
38
24
62
49
288

Ore
gon
Scie
nce:
Per
cent
of S
tude
nts
by A
chie
vem
ent L
evel
, Rou
nd 3
Rec
omm
enda
tions
22.4
%20
.2%
20.7
%
50.5
%
44.2
%35
.3%
19.1
%
14.3
%
17.4
%
8.0%
21.3
%26
.6%
0%10%
20%
30%
40%
50%
60%
70%
80%
90%
100%
58
10
Gra
de
% Students in Achievement Level
Exc
eeds
Mee
tsN
early
Mee
tsD
oes
Not
Yet
Mee
t
289
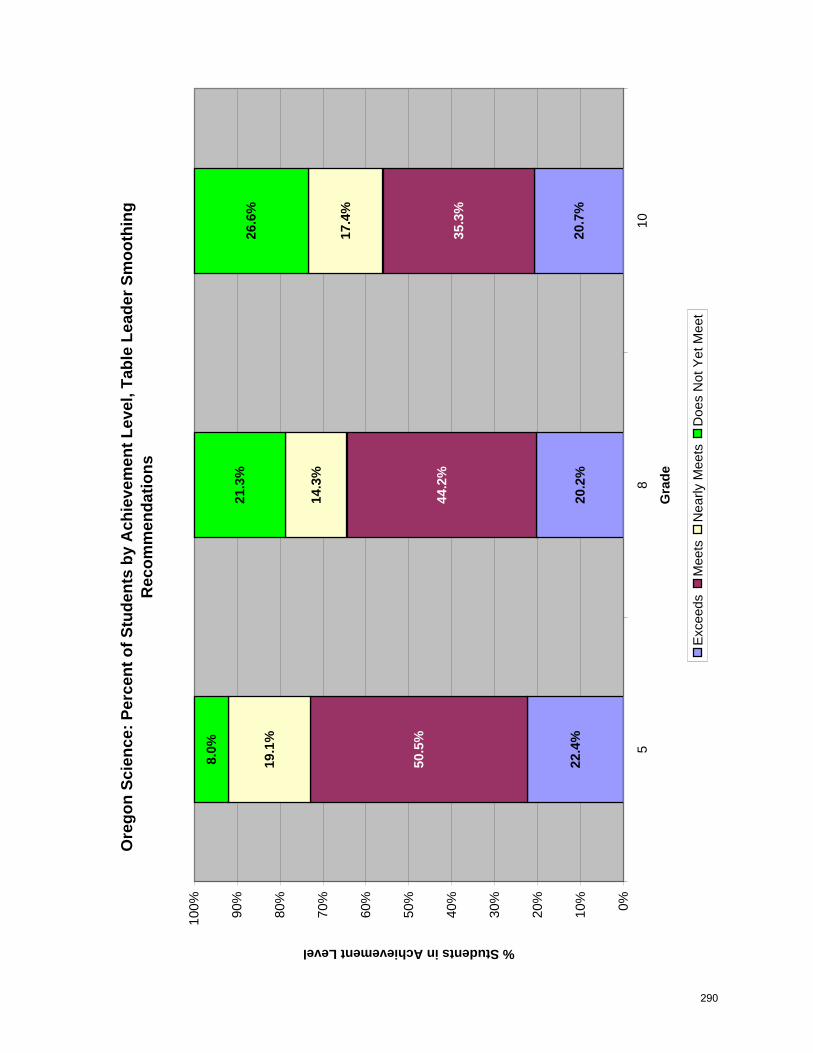
Ore
gon
Scie
nce:
Per
cent
of S
tude
nts
by A
chie
vem
ent L
evel
, Tab
le L
eade
r Sm
ooth
ing
Rec
omm
enda
tions
22.4
%20
.2%
20.7
%
50.5
%
44.2
%35
.3%
19.1
%
14.3
%
17.4
%
8.0%
21.3
%26
.6%
0%10%
20%
30%
40%
50%
60%
70%
80%
90%
100%
58
10
Gra
de
% Students in Achievement Level
Exc
eeds
Mee
tsN
early
Mee
tsD
oes
Not
Yet
Mee
t
290

Ore
gon
Sta
ndar
d S
ettin
g G
rade
3 M
athe
mat
ics
Nea
rly M
eets
Cut
Poi
nt
Tab
le 1
Tab
le 2
Tab
le 3
Rou
nd 3
SE
Bk
= 0.
22; r
= 0
.01
Rou
nd 2
250
240
230
Rou
nd 1
220
210
Scale Score
200
190
180
G1
291

Ore
gon
Sta
ndar
d S
ettin
g G
rade
3 M
athe
mat
ics
Nea
rly M
eets
Cut
Poi
nt
Rou
nd 3
Rou
nd 2
Tab
le 1
Rou
nd 1
250
240
230
220
210
Scale Score
200
190
180
G2
292

Ore
gon
Sta
ndar
d S
ettin
g G
rade
3 M
athe
mat
ics
Nea
rly M
eets
Cut
Poi
nt
Rou
nd 3
Rou
nd 2
250
240
Tab
le 2
Rou
nd 1
230
220
210
Scale Score
200
190
180
G3
293

Ore
gon
Sta
ndar
d S
ettin
g G
rade
3 M
athe
mat
ics
Nea
rly M
eets
Cut
Poi
nt
Rou
nd 3
Rou
nd 2
Tab
le 3
Rou
nd 1
250
240
230
220
210
Scale Score
200
190
180
G4
294

Ore
gon
Sta
ndar
d S
ettin
g G
rade
3 M
athe
mat
ics
Mee
ts C
ut P
oint
Tab
le 1
Tab
le 2
Tab
le 3
Rou
nd 3
SE
Bk
= 0.
47; r
= 0
.06
Rou
nd 2
Rou
nd 1
250
240
230
220
210
Scale Score
200
190
180
G5
295

Ore
gon
Sta
ndar
d S
ettin
g G
rade
3 M
athe
mat
ics
Mee
ts C
ut P
oint
Rou
nd 3
Rou
nd 2
Tab
le 1
Rou
nd 1
250
240
230
220
210
Scale Score
200
190
180
G6
296

Ore
gon
Sta
ndar
d S
ettin
g G
rade
3 M
athe
mat
ics
Mee
ts C
ut P
oint
Rou
nd 3
Rou
nd 2
Tab
le 2
250
240
Rou
nd 1
230
220
210
Scale Score
200
190
180
G7
297

Ore
gon
Sta
ndar
d S
ettin
g G
rade
3 M
athe
mat
ics
Mee
ts C
ut P
oint
250
240
230
220
210
Scale Score
Rou
nd 3
Rou
nd 2
Tab
le 3
Rou
nd 1
200
190
180
G8
298

Ore
gon
Sta
ndar
d S
ettin
g G
rade
3 M
athe
mat
ics
Exc
eeds
Cut
Poi
nt
Tab
le 1
Tab
le 2
Tab
le 3
Rou
nd 3
SE
Bk
= 1.
00; r
= 0
.55
Rou
nd 2
250
240
230
220
Scale Score
210
200
Rou
nd 1
190
180
G9
299

Ore
gon
Sta
ndar
d S
ettin
g G
rade
3 M
athe
mat
ics
Exc
eeds
Cut
Poi
nt
Rou
nd 3
Rou
nd 2
Tab
le 1
Rou
nd 1
180
250
240
230
220
210
Scale Score
200
190
G10
300

Ore
gon
Sta
ndar
d S
ettin
g G
rade
3 M
athe
mat
ics
Exc
eeds
Cut
Poi
nt
Rou
nd 3
Rou
nd 2
Tab
le 2
Rou
nd 1
180
250
240
230
220
210
Scale Score
200
190
G11
301

Ore
gon
Sta
ndar
d S
ettin
g G
rade
3 M
athe
mat
ics
Exc
eeds
Cut
Poi
nt
250
240
230
220
Rou
nd 3
Rou
nd 2
Tab
le 3
Rou
nd 1
210
Scale Score
200
190
180
G12
302

Ore
gon
Sta
ndar
d S
ettin
g G
rade
5 M
athe
mat
ics
Nea
rly M
eets
Cut
Poi
nt
Tab
le 1
Tab
le 2
Tab
le 3
260
250
240
Rou
nd 2
Rou
nd 3
SE
Bk
= 0.
48; r
= 0
.10
Rou
nd 1
190
230
Scale Score
220
210
200
G13
303
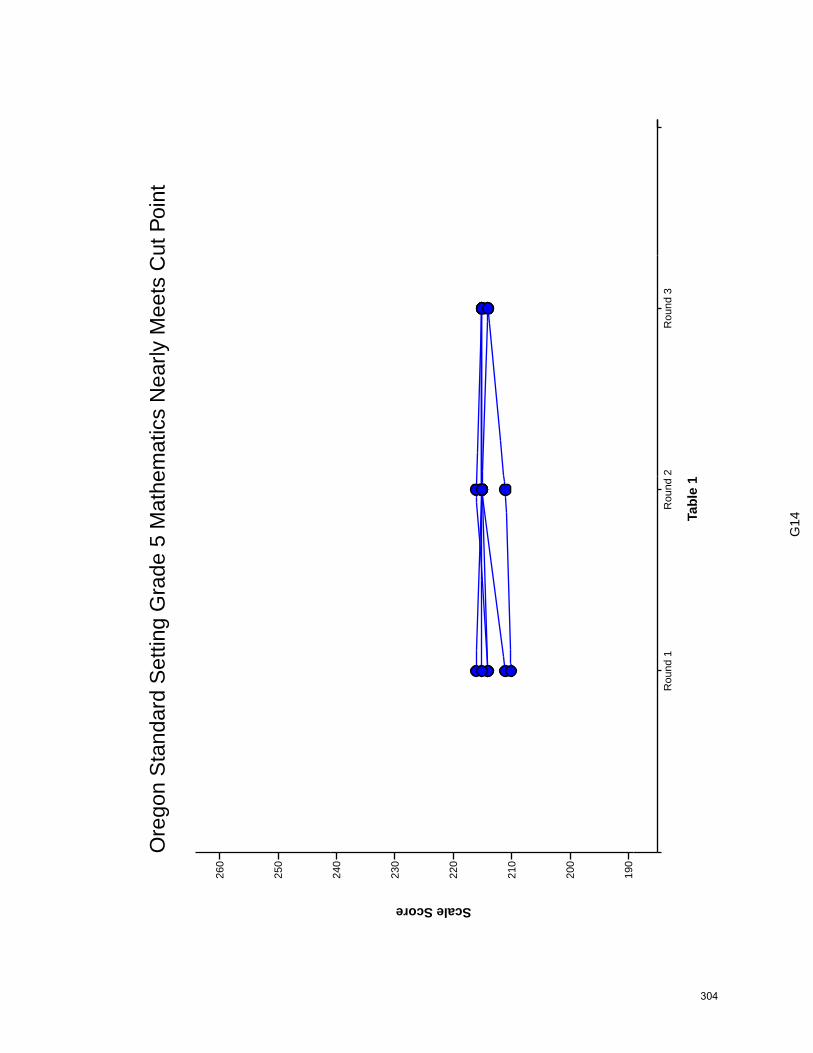
Ore
gon
Sta
ndar
d S
ettin
g G
rade
5 M
athe
mat
ics
Nea
rly M
eets
Cut
Poi
nt
260
250
Rou
nd 3
Rou
nd 2
Tab
le 1
Rou
nd 1
240
230
Scale Score
220
210
200
190
G14
304

Ore
gon
Sta
ndar
d S
ettin
g G
rade
5 M
athe
mat
ics
Nea
rly M
eets
Cut
Poi
nt
Rou
nd 3
Rou
nd 2
Tab
le 2
Rou
nd 1
260
250
240
230
Scale Score
220
210
200
190
G15
305

Ore
gon
Sta
ndar
d S
ettin
g G
rade
5 M
athe
mat
ics
Nea
rly M
eets
Cut
Poi
nt
Rou
nd 3
260
250
240
230
Scale Score
220
Rou
nd 2
Tab
le 3
Rou
nd 1
210
200
190
G16
306

Ore
gon
Sta
ndar
d S
ettin
g G
rade
5 M
athe
mat
ics
Mee
ts C
ut P
oint
Tab
le 1
Tab
le 2
Tab
le 3
260
250
Rou
nd 3
SE
Bk
= 0.
65; r
= 0
.72
Rou
nd 2
240
230
Scale Score
220
210
200
Rou
nd 1
190
G17
307

Ore
gon
Sta
ndar
d S
ettin
g G
rade
5 M
athe
mat
ics
Mee
ts C
ut P
oint
Rou
nd 3
Rou
nd 2
Tab
le 1
Rou
nd 1
190
260
250
240
230
Scale Score
220
210
200
G18
308

Ore
gon
Sta
ndar
d S
ettin
g G
rade
5 M
athe
mat
ics
Mee
ts C
ut P
oint
Rou
nd 3
Rou
nd 2
Tab
le 2
Rou
nd 1
260
250
240
230
Scale Score
220
210
200
190
G19
309

Ore
gon
Sta
ndar
d S
ettin
g G
rade
5 M
athe
mat
ics
Mee
ts C
ut P
oint
Rou
nd 3
260
250
240
230
Scale Score
220
Rou
nd 2
Tab
le 3
Rou
nd 1
210
200
190
G20
310

Ore
gon
Sta
ndar
d S
ettin
g G
rade
5 M
athe
mat
ics
Exc
eeds
Cut
Poi
nt
Tab
le 1
Tab
le 2
Tab
le 3
260
250
240
230
Scale Score
220
210
Rou
nd 3
SE
Bk
= 1.
28; r
= 0
.42
Rou
nd 2
Rou
nd 1
200
190
G21
311

Ore
gon
Sta
ndar
d S
ettin
g G
rade
5 M
athe
mat
ics
Exc
eeds
Cut
Poi
nt
260
Rou
nd 3
Rou
nd 2
Tab
le 1
Rou
nd 1
200
190
250
240
230
Scale Score
220
210
G22
312
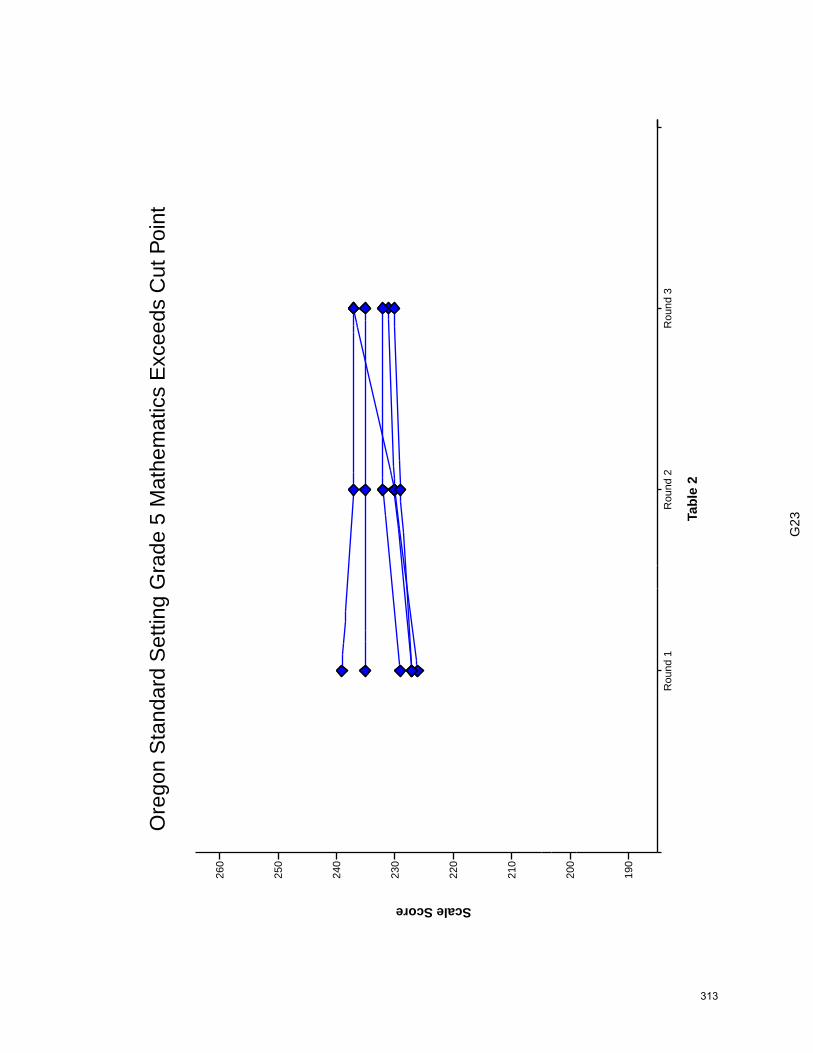
Ore
gon
Sta
ndar
d S
ettin
g G
rade
5 M
athe
mat
ics
Exc
eeds
Cut
Poi
nt
Rou
nd 3
Rou
nd 2
Tab
le 2
Rou
nd 1
190
200
260
250
240
230
Scale Score
220
210
G23
313

Ore
gon
Sta
ndar
d S
ettin
g G
rade
5 M
athe
mat
ics
Exc
eeds
Cut
Poi
nt
Rou
nd 3
Rou
nd 2
Tab
le 3
Rou
nd 1
260
250
240
230
Scale Score
220
210
200
190
G24
314

Ore
gon
Sta
ndar
d S
ettin
g G
rade
8 M
athe
mat
ics
Nea
rly M
eets
Cut
Poi
nt
Tab
le 1
Tab
le 2
Tab
le 3
Rou
nd 3
SE
Bk
= 0.
69; r
= 0
.36
Rou
nd 2
Rou
nd 1
200
270
265
260
255
250
245
240
235
Scale Score
230
225
220
215
210
205
G25
315

Ore
gon
Sta
ndar
d S
ettin
g G
rade
8 M
athe
mat
ics
Nea
rly M
eets
Cut
Poi
nt
Rou
nd 3
Rou
nd 2
Tab
le 1
Rou
nd 1
200
215
210
205
270
265
260
255
250
245
240
235
Scale Score
230
225
220
G26
316

Ore
gon
Sta
ndar
d S
ettin
g G
rade
8 M
athe
mat
ics
Nea
rly M
eets
Cut
Poi
nt
Rou
nd 3
Rou
nd 2
Tab
le 2
Rou
nd 1
270
265
260
255
250
245
240
235
Scale Score
230
225
220
215
210
205
200
G27
317

Ore
gon
Sta
ndar
d S
ettin
g G
rade
8 M
athe
mat
ics
Nea
rly M
eets
Cut
Poi
nt
Rou
nd 3
Rou
nd 2
Tab
le 3
Rou
nd 1
270
265
260
255
250
245
240
235
Scale Score
230
225
220
215
210
205
200
G28
318

Ore
gon
Sta
ndar
d S
ettin
g G
rade
8 M
athe
mat
ics
Mee
ts C
ut P
oint
Tab
le 1
Tab
le 2
Tab
le 3
Rou
nd 3
SE
Bk
= 1.
74; r
= 0
.78
Rou
nd 2
270
265
260
255
250
245
240
235
Scale Score
230
225
220
215
210
205
Rou
nd 1
200
G29
319

Ore
gon
Sta
ndar
d S
ettin
g G
rade
8 M
athe
mat
ics
Mee
ts C
ut P
oint
Rou
nd 3
Rou
nd 2
Tab
le 1
Rou
nd 1
200
205
270
265
260
255
250
245
240
235
Scale Score
230
225
220
215
210
G30
320

Ore
gon
Sta
ndar
d S
ettin
g G
rade
8 M
athe
mat
ics
Mee
ts C
ut P
oint
Rou
nd 3
Rou
nd 2
Tab
le 2
Rou
nd 1
200
270
265
260
255
250
245
240
235
Scale Score
230
225
220
215
210
205
G31
321

Ore
gon
Sta
ndar
d S
ettin
g G
rade
8 M
athe
mat
ics
Mee
ts C
ut P
oint
270
265
260
255
250
245
240
235
Rou
nd 3
Rou
nd 2
Tab
le 3
Rou
nd 1
Scale Score
230
225
220
215
210
205
200
G32
322
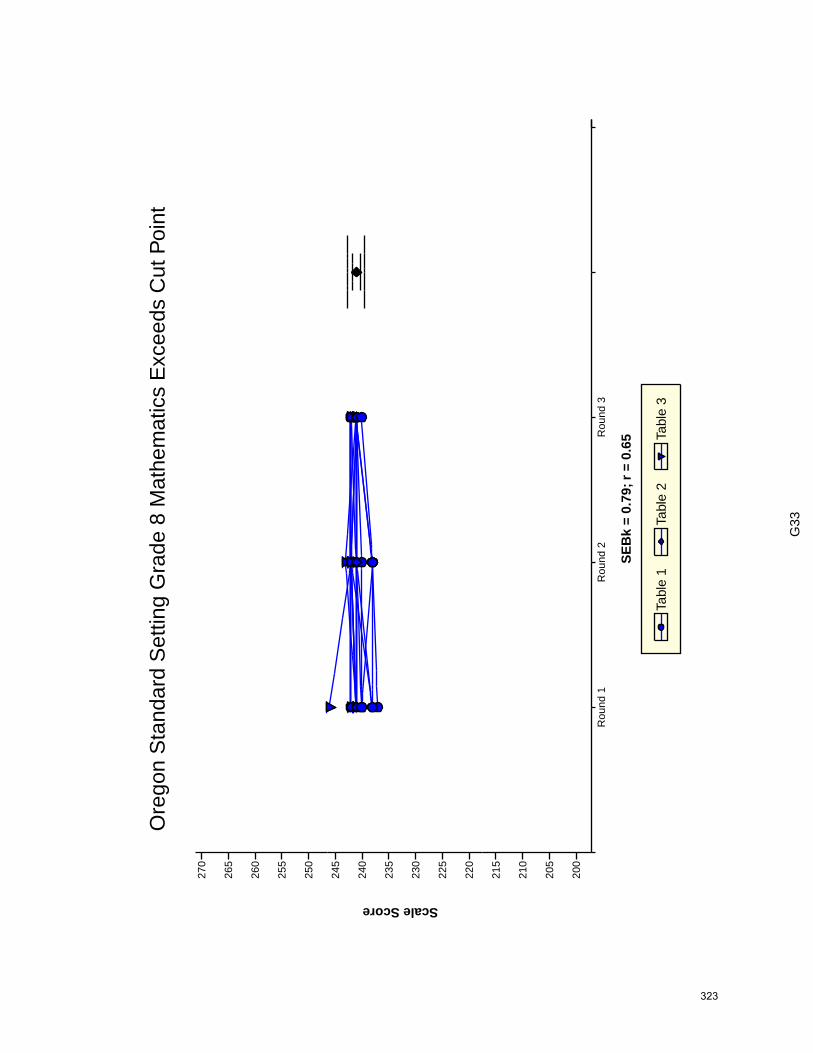
Ore
gon
Sta
ndar
d S
ettin
g G
rade
8 M
athe
mat
ics
Exc
eeds
Cut
Poi
nt
Tab
le 1
Tab
le 2
Tab
le 3
270
265
260
255
250
245
240
235
Scale Score
230
225
220
Rou
nd 3
SE
Bk
= 0.
79; r
= 0
.65
Rou
nd 2
Rou
nd 1
215
210
205
200
G33
323

Ore
gon
Sta
ndar
d S
ettin
g G
rade
8 M
athe
mat
ics
Exc
eeds
Cut
Poi
nt
Rou
nd 3
Rou
nd 2
Tab
le 1
Rou
nd 1
215
210
205
200
270
265
260
255
250
245
240
235
Scale Score
230
225
220
G34
324

Ore
gon
Sta
ndar
d S
ettin
g G
rade
8 M
athe
mat
ics
Exc
eeds
Cut
Poi
nt
Rou
nd 3
Rou
nd 2
Tab
le 2
Rou
nd 1
210
205
200
270
265
260
255
250
245
240
235
Scale Score
230
225
220
215
G35
325

Ore
gon
Sta
ndar
d S
ettin
g G
rade
8 M
athe
mat
ics
Exc
eeds
Cut
Poi
nt
Rou
nd 3
Rou
nd 2
Tab
le 3
Rou
nd 1
270
265
260
255
250
245
240
235
Scale Score
230
225
220
215
210
205
200
G36
326
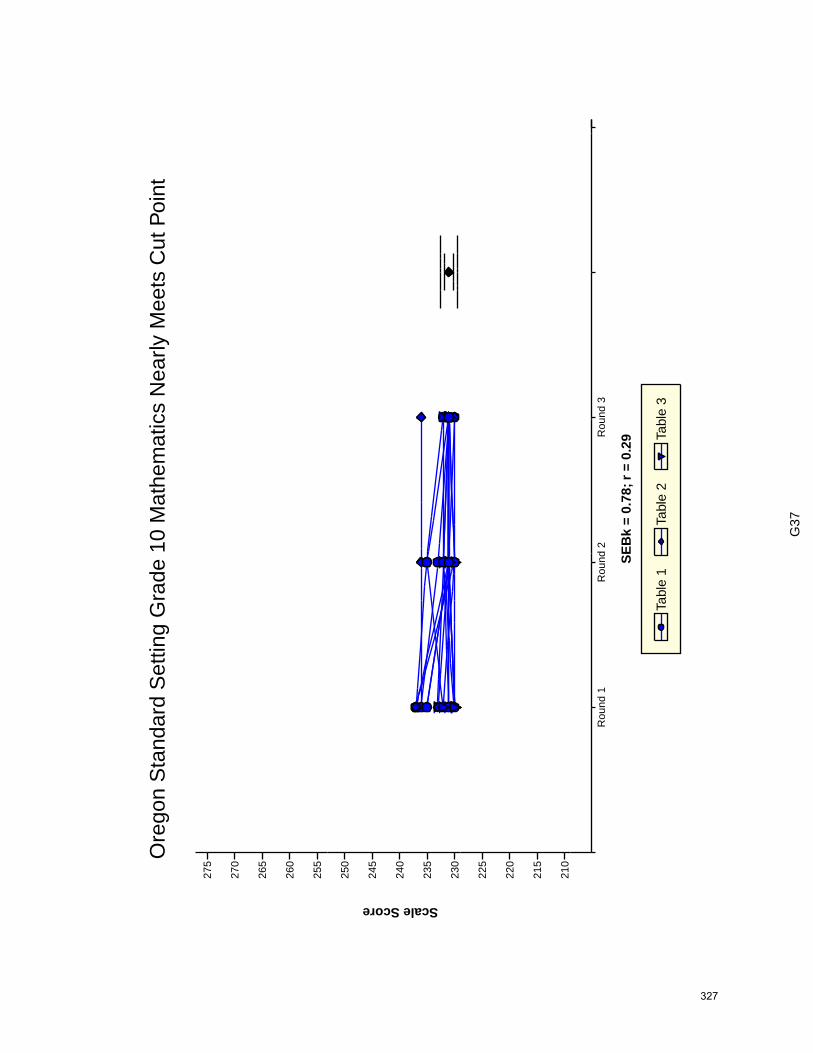
Ore
gon
Sta
ndar
d S
ettin
g G
rade
10
Mat
hem
atic
s N
early
Mee
ts C
ut P
oint
Tab
le 1
Tab
le 2
Tab
le 3
Rou
nd 3
SE
Bk
= 0.
78; r
= 0
.29
275
270
265
260
255
Rou
nd 2
Rou
nd 1
250
245
240
Scale Score
235
230
225
220
215
210
G37
327

Ore
gon
Sta
ndar
d S
ettin
g G
rade
10
Mat
hem
atic
s N
early
Mee
ts C
ut P
oint
Rou
nd 3
Rou
nd 2
Tab
le 1
Rou
nd 1
275
270
265
260
255
250
245
240
Scale Score
235
230
225
220
215
210
G38
328

Ore
gon
Sta
ndar
d S
ettin
g G
rade
10
Mat
hem
atic
s N
early
Mee
ts C
ut P
oint
Rou
nd 3
Rou
nd 2
Tab
le 2
Rou
nd 1
275
270
265
260
255
250
245
240
Scale Score
235
230
225
220
215
210
G39
329

Ore
gon
Sta
ndar
d S
ettin
g G
rade
10
Mat
hem
atic
s N
early
Mee
ts C
ut P
oint
275
270
265
260
255
250
245
240
Scale Score
235
Rou
nd 3
Rou
nd 2
Tab
le 3
Rou
nd 1
230
225
220
215
210
G40
330

Ore
gon
Sta
ndar
d S
ettin
g G
rade
10
Mat
hem
atic
s M
eets
Cut
Poi
nt
Tab
le 1
Tab
le 2
Tab
le 3
275
270
265
260
255
250
245
240
Scale Score
235
230
225
220
Rou
nd 3
SE
Bk
= 0.
85; r
= 0
.85
Rou
nd 2
Rou
nd 1
215
210
G41
331

Ore
gon
Sta
ndar
d S
ettin
g G
rade
10
Mat
hem
atic
s M
eets
Cut
Poi
nt
275
270
265
Rou
nd 3
Rou
nd 2
Tab
le 1
Rou
nd 1
210
260
255
250
245
240
Scale Score
235
230
225
220
215
G42
332

Ore
gon
Sta
ndar
d S
ettin
g G
rade
10
Mat
hem
atic
s M
eets
Cut
Poi
nt
Rou
nd 3
Rou
nd 2
Tab
le 2
Rou
nd 1
210
275
270
265
260
255
250
245
240
Scale Score
235
230
225
220
215
G43
333

Ore
gon
Sta
ndar
d S
ettin
g G
rade
10
Mat
hem
atic
s M
eets
Cut
Poi
nt
Rou
nd 3
Rou
nd 2
Tab
le 3
Rou
nd 1
275
270
265
260
255
250
245
240
Scale Score
235
230
225
220
215
210
G44
334
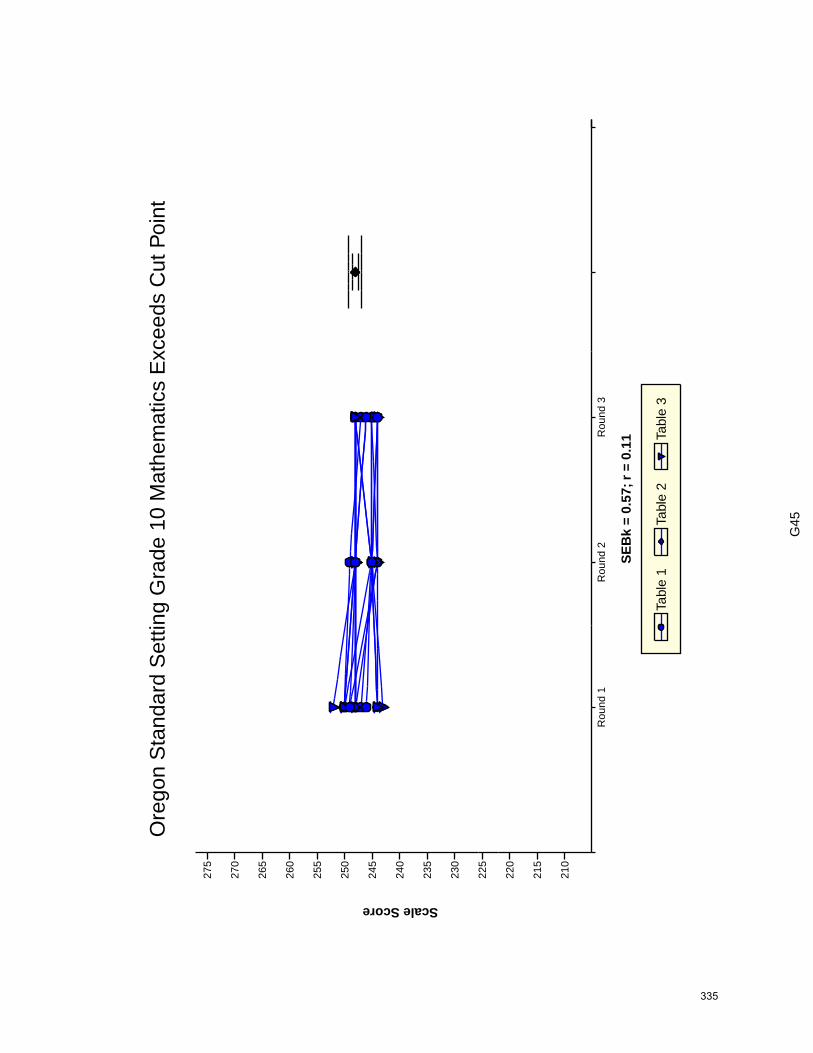
Ore
gon
Sta
ndar
d S
ettin
g G
rade
10
Mat
hem
atic
s E
xcee
ds C
ut P
oint
Tab
le 1
Tab
le 2
Tab
le 3
275
270
265
260
255
250
245
240
Scale Score
235
230
Rou
nd 3
SE
Bk
= 0.
57; r
= 0
.11
Rou
nd 2
225
Rou
nd 1
220
215
210
G45
335

Ore
gon
Sta
ndar
d S
ettin
g G
rade
10
Mat
hem
atic
s E
xcee
ds C
ut P
oint
275
Rou
nd 3
Rou
nd 2
Tab
le 1
Rou
nd 1
220
215
210
270
265
260
255
250
245
240
Scale Score
235
230
225
G46
336

Ore
gon
Sta
ndar
d S
ettin
g G
rade
10
Mat
hem
atic
s E
xcee
ds C
ut P
oint
Rou
nd 3
Rou
nd 2
Tab
le 2
Rou
nd 1
215
210
275
270
265
260
255
250
245
240
Scale Score
235
230
225
220
G47
337
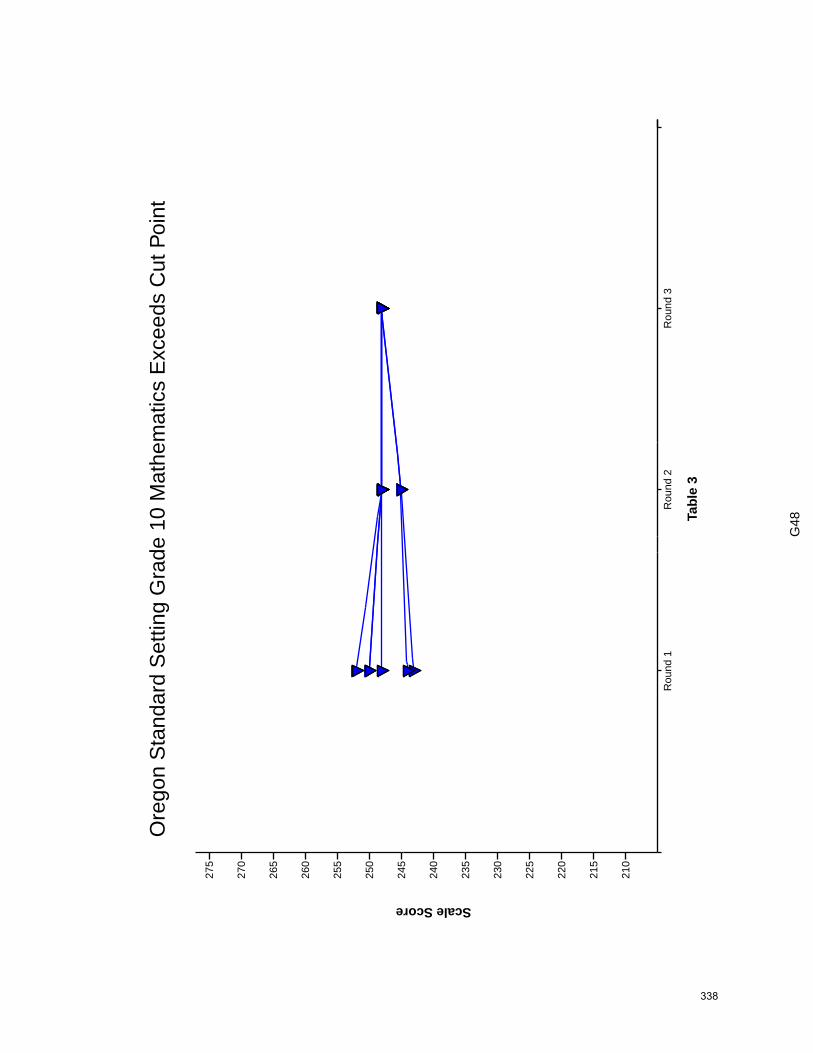
Ore
gon
Sta
ndar
d S
ettin
g G
rade
10
Mat
hem
atic
s E
xcee
ds C
ut P
oint
Rou
nd 3
Rou
nd 2
Tab
le 3
275
270
265
260
255
250
245
Rou
nd 1
240
Scale Score
235
230
225
220
215
210
G48
338

Ore
gon
Sta
ndar
d S
ettin
g G
rade
3 R
eadi
ng/L
itera
ture
Nea
rly M
eets
Cut
Poi
nt
Tab
le 1
Tab
le 2
Tab
le 3
Rou
nd 3
SE
Bk
= 0.
38; r
= 0
.90
Rou
nd 2
240
230
Rou
nd 1
220
210
Scale Score
200
190
180
170
G49
339

Ore
gon
Sta
ndar
d S
ettin
g G
rade
3 R
eadi
ng/L
itera
ture
Nea
rly M
eets
Cut
Poi
nt
Rou
nd 3
Rou
nd 2
Tab
le 1
Rou
nd 1
170
240
230
220
210
Scale Score
200
190
180
G50
340

Ore
gon
Sta
ndar
d S
ettin
g G
rade
3 R
eadi
ng/L
itera
ture
Nea
rly M
eets
Cut
Poi
nt
Rou
nd 3
Rou
nd 2
240
Tab
le 2
Rou
nd 1
230
220
210
Scale Score
200
190
180
170
G51
341

Ore
gon
Sta
ndar
d S
ettin
g G
rade
3 R
eadi
ng/L
itera
ture
Nea
rly M
eets
Cut
Poi
nt
Rou
nd 3
Rou
nd 2
Tab
le 3
Rou
nd 1
240
230
220
210
Scale Score
200
190
180
170
G52
342

Ore
gon
Sta
ndar
d S
ettin
g G
rade
3 R
eadi
ng/L
itera
ture
Mee
ts C
ut P
oint
Tab
le 1
Tab
le 2
Tab
le 3
Rou
nd 3
SE
Bk
= 0.
72; r
= 0
.89
240
Rou
nd 2
Rou
nd 1
230
220
210
Scale Score
200
190
180
170
G53
343

Ore
gon
Sta
ndar
d S
ettin
g G
rade
3 R
eadi
ng/L
itera
ture
Mee
ts C
ut P
oint
240
230
220
210
Scale Score
200
Rou
nd 3
Rou
nd 2
Tab
le 1
Rou
nd 1
170
190
180
G54
344

Ore
gon
Sta
ndar
d S
ettin
g G
rade
3 R
eadi
ng/L
itera
ture
Mee
ts C
ut P
oint
Rou
nd 3
Rou
nd 2
Tab
le 2
240
Rou
nd 1
230
220
210
Scale Score
200
190
180
170
G55
345

Ore
gon
Sta
ndar
d S
ettin
g G
rade
3 R
eadi
ng/L
itera
ture
Mee
ts C
ut P
oint
Rou
nd 3
Rou
nd 2
Tab
le 3
Rou
nd 1
240
230
220
210
Scale Score
200
190
180
170
G56
346

Ore
gon
Sta
ndar
d S
ettin
g G
rade
3 R
eadi
ng/L
itera
ture
Exc
eeds
Cut
Poi
nt
Tab
le 1
Tab
le 2
Tab
le 3
Rou
nd 3
SE
Bk
= 0.
78; r
= 0
.67
Rou
nd 2
Rou
nd 1
180
170
240
230
220
210
Scale Score
200
190
G57
347

Ore
gon
Sta
ndar
d S
ettin
g G
rade
3 R
eadi
ng/L
itera
ture
Exc
eeds
Cut
Poi
nt
240
230
220
210
Scale Score
Rou
nd 3
Rou
nd 2
Tab
le 1
Rou
nd 1
180
170
200
190
G58
348

Ore
gon
Sta
ndar
d S
ettin
g G
rade
3 R
eadi
ng/L
itera
ture
Exc
eeds
Cut
Poi
nt
Rou
nd 3
Rou
nd 2
Tab
le 2
Rou
nd 1
180
170
240
230
220
210
Scale Score
200
190
G59
349

Ore
gon
Sta
ndar
d S
ettin
g G
rade
3 R
eadi
ng/L
itera
ture
Exc
eeds
Cut
Poi
nt
Rou
nd 3
Rou
nd 2
Tab
le 3
Rou
nd 1
240
230
220
210
Scale Score
200
190
180
170
G60
350

Ore
gon
Sta
ndar
d S
ettin
g G
rade
5 R
eadi
ng/L
itera
ture
Nea
rly M
eets
Cut
Poi
nt
Tab
le 1
Tab
le 2
Tab
le 3
Rou
nd 3
SE
Bk
= 0.
65; r
= 0
.54
Rou
nd 2
Rou
nd 1
260
250
240
230
Scale Score
220
210
200
190
G61
351

Ore
gon
Sta
ndar
d S
ettin
g G
rade
5 R
eadi
ng/L
itera
ture
Nea
rly M
eets
Cut
Poi
nt
Rou
nd 3
Rou
nd 2
Tab
le 1
Rou
nd 1
200
190
260
250
240
230
Scale Score
220
210
G62
352

Ore
gon
Sta
ndar
d S
ettin
g G
rade
5 R
eadi
ng/L
itera
ture
Nea
rly M
eets
Cut
Poi
nt
Rou
nd 3
Rou
nd 2
Tab
le 2
Rou
nd 1
260
250
240
230
Scale Score
220
210
200
190
G63
353

Ore
gon
Sta
ndar
d S
ettin
g G
rade
5 R
eadi
ng/L
itera
ture
Nea
rly M
eets
Cut
Poi
nt
Rou
nd 3
Rou
nd 2
Tab
le 3
Rou
nd 1
260
250
240
230
Scale Score
220
210
200
190
G64
354
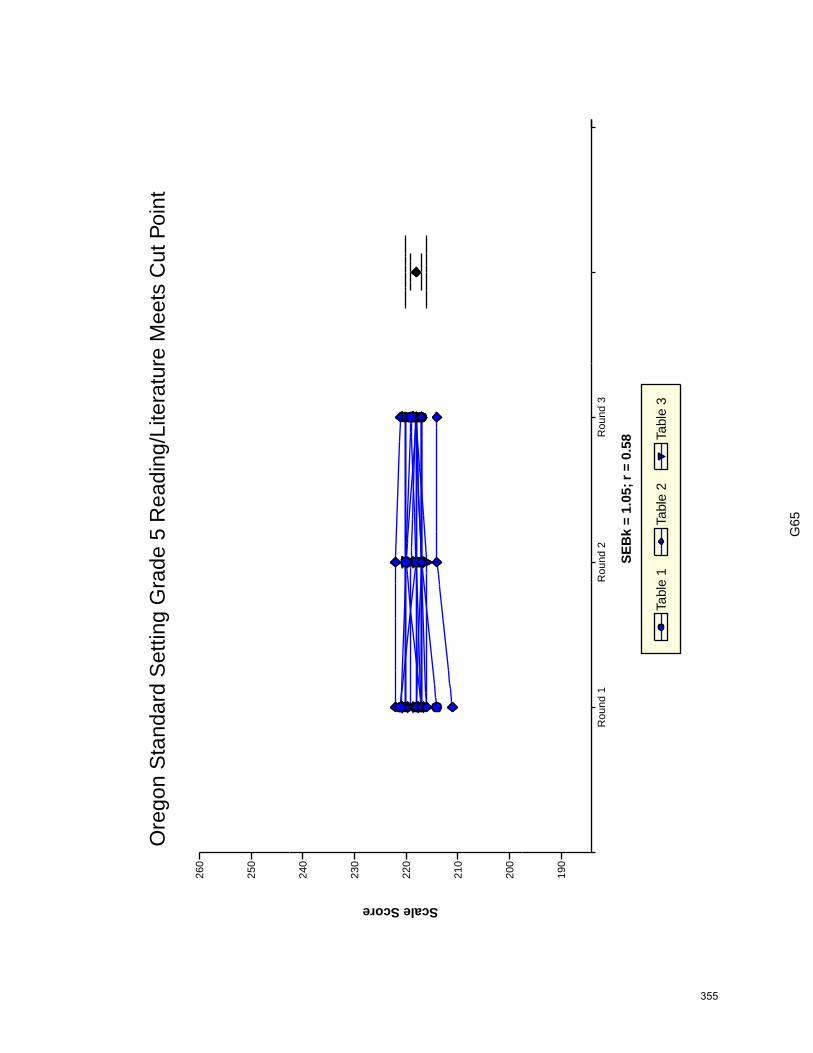
Ore
gon
Sta
ndar
d S
ettin
g G
rade
5 R
eadi
ng/L
itera
ture
Mee
ts C
ut P
oint
Tab
le 1
Tab
le 2
Tab
le 3
260
250
240
230
Scale Score
220
210
200
Rou
nd 3
SE
Bk
= 1.
05; r
= 0
.58
Rou
nd 2
Rou
nd 1
190
G65
355

Ore
gon
Sta
ndar
d S
ettin
g G
rade
5 R
eadi
ng/L
itera
ture
Mee
ts C
ut P
oint
Rou
nd 3
Rou
nd 2
Tab
le 1
Rou
nd 1
190
260
250
240
230
Scale Score
220
210
200
G66
356
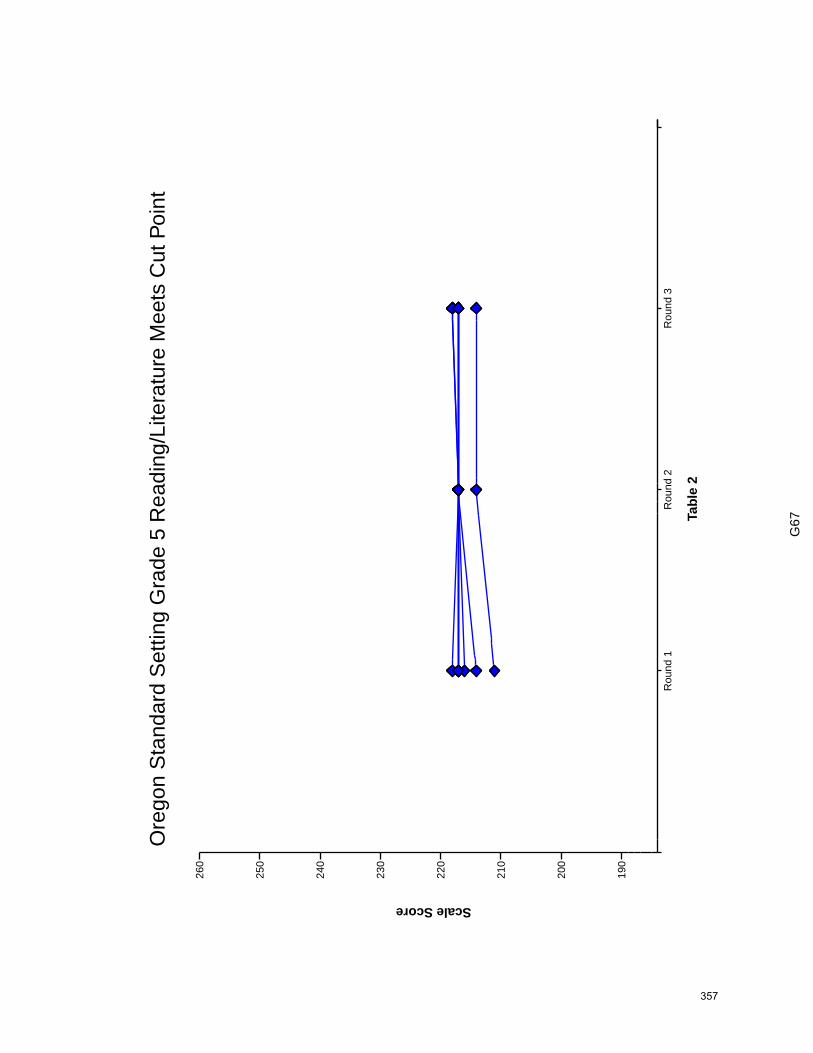
Ore
gon
Sta
ndar
d S
ettin
g G
rade
5 R
eadi
ng/L
itera
ture
Mee
ts C
ut P
oint
Rou
nd 2
Rou
nd 3
Tab
le 2
Rou
nd 1
260
250
240
230
Scale Score
220
210
200
190
G67
357

Ore
gon
Sta
ndar
d S
ettin
g G
rade
5 R
eadi
ng/L
itera
ture
Mee
ts C
ut P
oint
Rou
nd 3
260
250
240
230
Scale Score
220
Rou
nd 2
Tab
le 3
Rou
nd 1
210
200
190
G68
358

Ore
gon
Sta
ndar
d S
ettin
g G
rade
5 R
eadi
ng/L
itera
ture
Exc
eeds
Cut
Poi
nt
Tab
le 1
Tab
le 2
Tab
le 3
Rou
nd 3
SE
Bk
= 0.
92; r
= 0
.47
Rou
nd 2
260
250
240
230
Scale Score
220
210
Rou
nd 1
200
190
G69
359

Ore
gon
Sta
ndar
d S
ettin
g G
rade
5 R
eadi
ng/L
itera
ture
Exc
eeds
Cut
Poi
nt
Rou
nd 3
Rou
nd 2
Tab
le 1
Rou
nd 1
200
190
260
250
240
230
Scale Score
220
210
G70
360

Ore
gon
Sta
ndar
d S
ettin
g G
rade
5 R
eadi
ng/L
itera
ture
Exc
eeds
Cut
Poi
nt
Rou
nd 3
Rou
nd 2
Tab
le 2
260
Rou
nd 1
190
250
240
230
Scale Score
220
210
200
G71
361

Ore
gon
Sta
ndar
d S
ettin
g G
rade
5 R
eadi
ng/L
itera
ture
Exc
eeds
Cut
Poi
nt
Rou
nd 3
260
250
240
230
Rou
nd 2
Tab
le 3
Rou
nd 1
Scale Score
220
210
200
190
G72
362

Ore
gon
Sta
ndar
d S
ettin
g G
rade
8 R
eadi
ng/L
itera
ture
Nea
rly M
eets
Cut
Poi
nt
Tab
le 1
Tab
le 2
Tab
le 3
Rou
nd 3
SE
Bk
= 0.
84; r
= 0
.81
Rou
nd 2
Rou
nd 1
200
265
260
255
250
245
240
235
230
Scale Score
225
220
215
210
205
G73
363

Ore
gon
Sta
ndar
d S
ettin
g G
rade
8 R
eadi
ng/L
itera
ture
Nea
rly M
eets
Cut
Poi
nt
Rou
nd 3
Rou
nd 2
Tab
le 1
Rou
nd 1
265
260
255
250
245
240
235
230
Scale Score
225
220
215
210
205
200
G74
364

Ore
gon
Sta
ndar
d S
ettin
g G
rade
8 R
eadi
ng/L
itera
ture
Nea
rly M
eets
Cut
Poi
nt
Rou
nd 3
Rou
nd 2
Tab
le 2
Rou
nd 1
265
260
255
250
245
240
235
230
Scale Score
225
220
215
210
205
200
G75
365

Ore
gon
Sta
ndar
d S
ettin
g G
rade
8 R
eadi
ng/L
itera
ture
Nea
rly M
eets
Cut
Poi
nt
Rou
nd 3
265
260
255
250
245
240
235
230
Scale Score
Rou
nd 2
Tab
le 3
Rou
nd 1
225
220
215
210
205
200
G76
366

Ore
gon
Sta
ndar
d S
ettin
g G
rade
8 R
eadi
ng/L
itera
ture
Mee
ts C
ut P
oint
Tab
le 1
Tab
le 2
Tab
le 3
Rou
nd 3
SE
Bk
= 0.
93; r
= 0
.56
Rou
nd 2
265
260
255
250
245
240
235
230
Scale Score
225
220
215
210
Rou
nd 1
205
200
G77
367

Ore
gon
Sta
ndar
d S
ettin
g G
rade
8 R
eadi
ng/L
itera
ture
Mee
ts C
ut P
oint
Rou
nd 3
Rou
nd 2
Tab
le 1
Rou
nd 1
205
200
265
260
255
250
245
240
235
230
Scale Score
225
220
215
210
G78
368
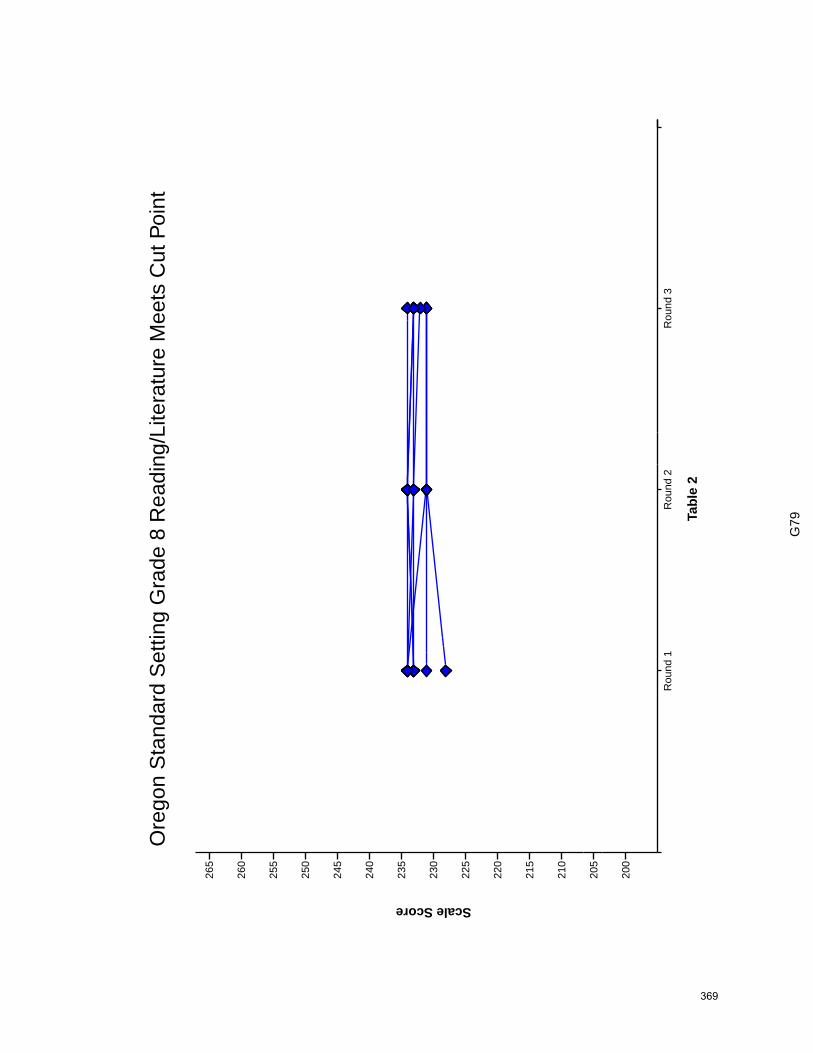
Ore
gon
Sta
ndar
d S
ettin
g G
rade
8 R
eadi
ng/L
itera
ture
Mee
ts C
ut P
oint
Rou
nd 3
Rou
nd 2
Tab
le 2
Rou
nd 1
200
205
265
260
255
250
245
240
235
230
Scale Score
225
220
215
210
G79
369

Ore
gon
Sta
ndar
d S
ettin
g G
rade
8 R
eadi
ng/L
itera
ture
Mee
ts C
ut P
oint
Rou
nd 3
Rou
nd 2
Tab
le 3
Rou
nd 1
265
260
255
250
245
240
235
230
Scale Score
225
220
215
210
205
200
G80
370

Ore
gon
Sta
ndar
d S
ettin
g G
rade
8 R
eadi
ng/L
itera
ture
Exc
eeds
Cut
Poi
nt
Tab
le 1
Tab
le 2
Tab
le 3
265
260
255
250
245
240
235
Scale Score
230
225
220
Rou
nd 3
SE
Bk
= 1.
01; r
= 0
.81
Rou
nd 2
Rou
nd 1
215
210
205
200
G81
371

Ore
gon
Sta
ndar
d S
ettin
g G
rade
8 R
eadi
ng/L
itera
ture
Exc
eeds
Cut
Poi
nt
265
260
255
250
245
240
235
230
Scale Score
225
220
Rou
nd 3
Rou
nd 2
Tab
le 1
Rou
nd 1
215
210
205
200
G82
372
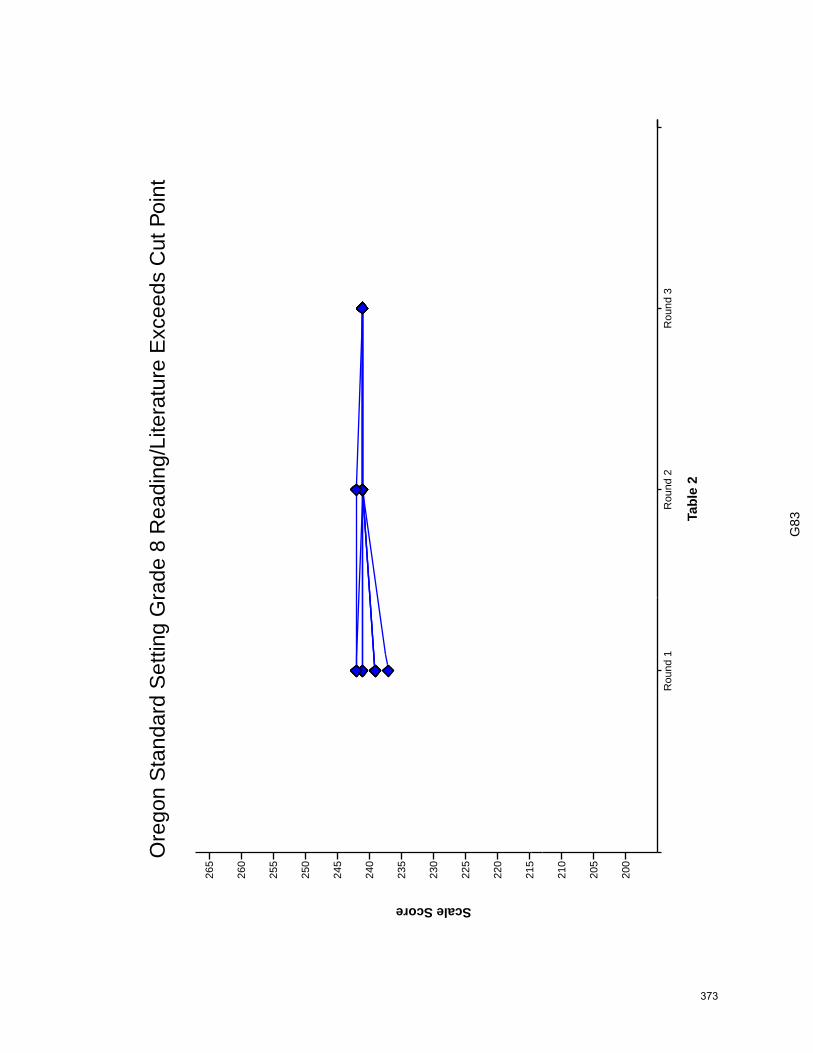
Ore
gon
Sta
ndar
d S
ettin
g G
rade
8 R
eadi
ng/L
itera
ture
Exc
eeds
Cut
Poi
nt
Rou
nd 3
Rou
nd 2
Tab
le 2
Rou
nd 1
210
205
200
265
260
255
250
245
240
235
230
Scale Score
225
220
215
G83
373

Ore
gon
Sta
ndar
d S
ettin
g G
rade
8 R
eadi
ng/L
itera
ture
Exc
eeds
Cut
Poi
nt
Rou
nd 3
Rou
nd 2
Tab
le 3
Rou
nd 1
265
260
255
250
245
240
235
230
Scale Score
225
220
215
210
205
200
G84
374

Ore
gon
Sta
ndar
d S
ettin
g G
rade
10
Rea
ding
/Lite
ratu
re N
early
Mee
ts C
ut P
oint
Tab
le 1
Tab
le 2
Tab
le 3
275
270
265
260
Rou
nd 3
SE
Bk
= 0.
75; r
= 0
.21
Rou
nd 2
255
250
245
240
Scale Score
235
230
Rou
nd 1
225
220
215
210
205
G85
375

Ore
gon
Sta
ndar
d S
ettin
g G
rade
10
Rea
ding
/Lite
ratu
re N
early
Mee
ts C
ut P
oint
275
270
265
260
255
Rou
nd 3
Rou
nd 2
Tab
le 1
Rou
nd 1
250
245
240
Scale Score
235
230
225
220
215
210
205
G86
376
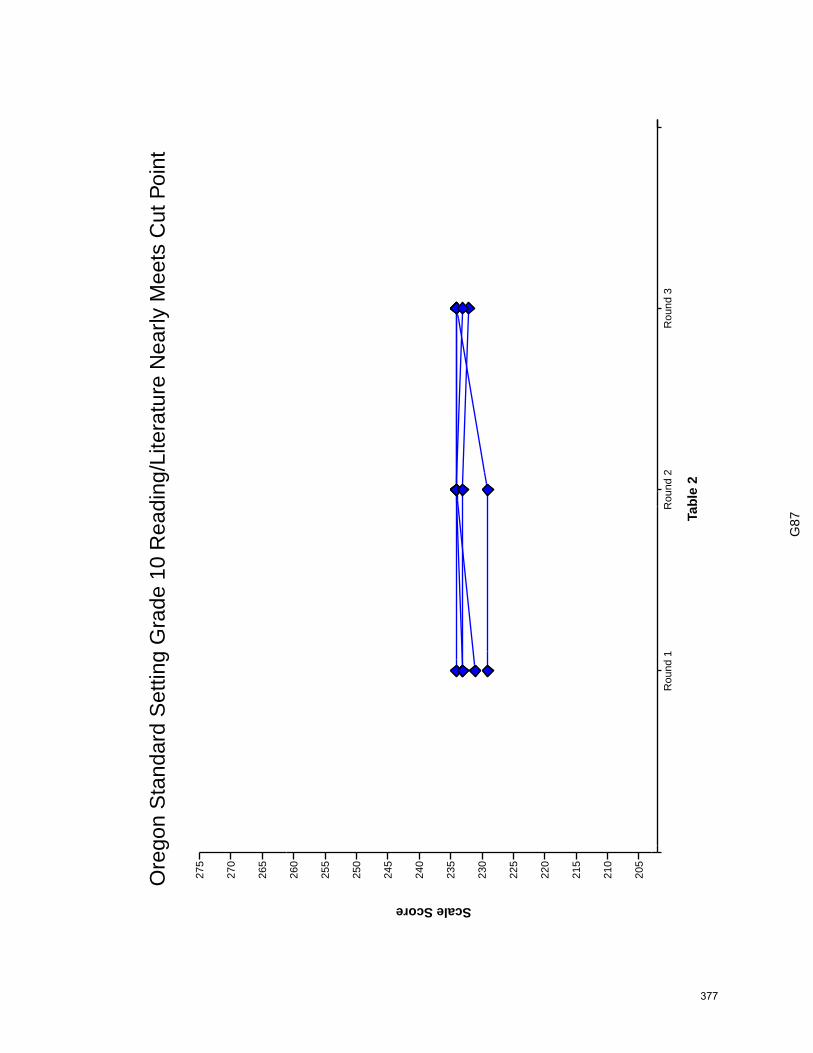
Ore
gon
Sta
ndar
d S
ettin
g G
rade
10
Rea
ding
/Lite
ratu
re N
early
Mee
ts C
ut P
oint
Rou
nd 3
Rou
nd 2
Tab
le 2
275
270
265
Rou
nd 1
260
255
250
245
240
Scale Score
235
230
225
220
215
210
205
G87
377

Ore
gon
Sta
ndar
d S
ettin
g G
rade
10
Rea
ding
/Lite
ratu
re N
early
Mee
ts C
ut P
oint
275
270
265
260
255
250
245
240
Scale Score
235
Rou
nd 3
Rou
nd 2
Tab
le 3
Rou
nd 1
230
225
220
215
210
205
G88
378

Ore
gon
Sta
ndar
d S
ettin
g G
rade
10
Rea
ding
/Lite
ratu
re M
eets
Cut
Poi
nt
Tab
le 1
Tab
le 2
Tab
le 3
Rou
nd 3
SE
Bk
= 1.
26; r
= 0
.56
Rou
nd 2
275
270
265
260
255
250
245
240
Scale Score
235
230
225
220
215
Rou
nd 1
210
205
G89
379

Ore
gon
Sta
ndar
d S
ettin
g G
rade
10
Rea
ding
/Lite
ratu
re M
eets
Cut
Poi
nt
Rou
nd 3
Rou
nd 2
Tab
le 1
Rou
nd 1
210
205
275
270
265
260
255
250
245
240
Scale Score
235
230
225
220
215
G90
380

Ore
gon
Sta
ndar
d S
ettin
g G
rade
10
Rea
ding
/Lite
ratu
re M
eets
Cut
Poi
nt
Rou
nd 3
Rou
nd 2
Tab
le 2
Rou
nd 1
210
205
275
270
265
260
255
250
245
240
Scale Score
235
230
225
220
215
G91
381

Ore
gon
Sta
ndar
d S
ettin
g G
rade
10
Rea
ding
/Lite
ratu
re M
eets
Cut
Poi
nt
Rou
nd 3
275
270
265
260
255
250
245
240
Rou
nd 2
Tab
le 3
Rou
nd 1
Scale Score
235
230
225
220
215
210
205
G92
382

Ore
gon
Sta
ndar
d S
ettin
g G
rade
10
Rea
ding
/Lite
ratu
re E
xcee
ds C
ut P
oint
Tab
le 1
Tab
le 2
Tab
le 3
Rou
nd 3
SE
Bk
= 0.
69; r
= 0
.31
Rou
nd 2
275
270
265
260
255
250
245
240
Scale Score
235
230
Rou
nd 1
225
220
215
210
205
G93
383

Ore
gon
Sta
ndar
d S
ettin
g G
rade
10
Rea
ding
/Lite
ratu
re E
xcee
ds C
ut P
oint
Rou
nd 3
Rou
nd 2
Tab
le 1
Rou
nd 1
220
215
210
205
275
270
265
260
255
250
245
240
Scale Score
235
230
225
G94
384
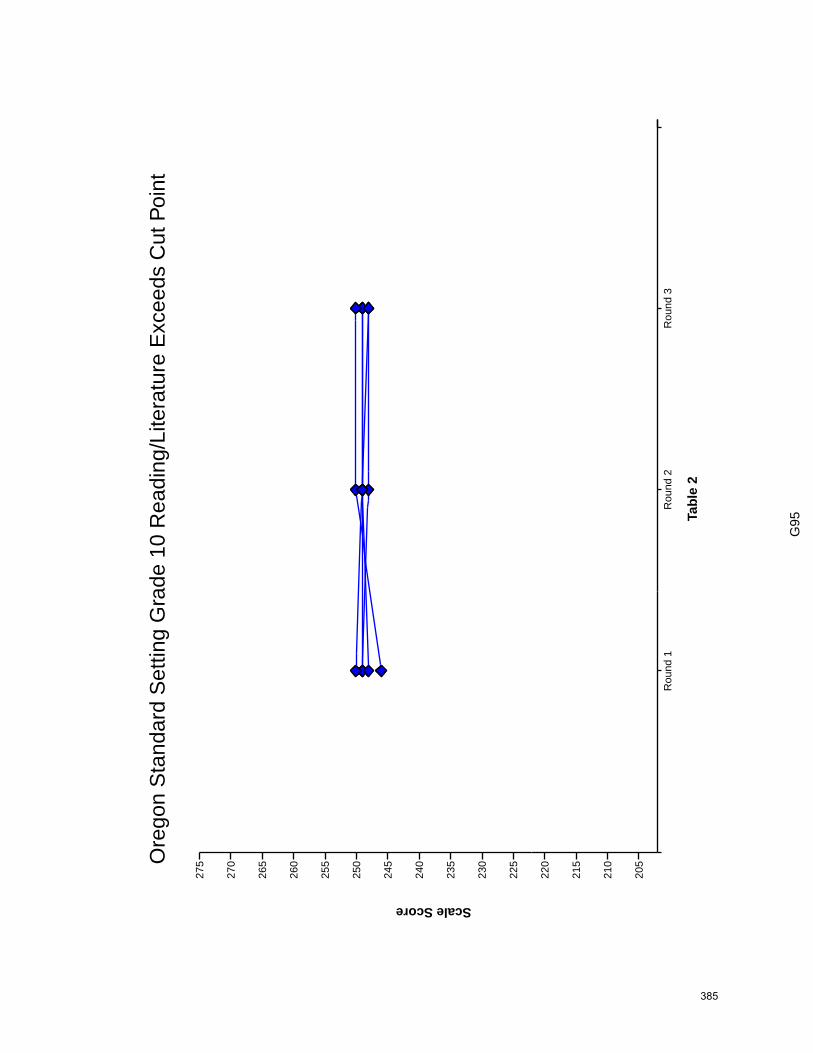
Ore
gon
Sta
ndar
d S
ettin
g G
rade
10
Rea
ding
/Lite
ratu
re E
xcee
ds C
ut P
oint
Rou
nd 3
Rou
nd 2
Tab
le 2
Rou
nd 1
220
215
210
205
275
270
265
260
255
250
245
240
Scale Score
235
230
225
G95
385

Ore
gon
Sta
ndar
d S
ettin
g G
rade
10
Rea
ding
/Lite
ratu
re E
xcee
ds C
ut P
oint
275
270
265
260
255
Rou
nd 3
Rou
nd 2
Tab
le 3
Rou
nd 1
250
245
240
Scale Score
235
230
225
220
215
210
205
G96
386

Ore
gon
Sta
ndar
d S
ettin
g G
rade
5 S
cien
ce N
early
Mee
ts C
ut P
oint
Tab
le 1
Tab
le 2
Tab
le 3
Rou
nd 3
SE
Bk
= 1.
08; r
= 0
.54
Rou
nd 2
260
250
240
230
Scale Score
220
Rou
nd 1
210
200
190
G97
387

Ore
gon
Sta
ndar
d S
ettin
g G
rade
5 S
cien
ce N
early
Mee
ts C
ut P
oint
Rou
nd 3
Rou
nd 2
Tab
le 1
Rou
nd 1
260
250
240
230
Scale Score
220
210
200
190
G98
388
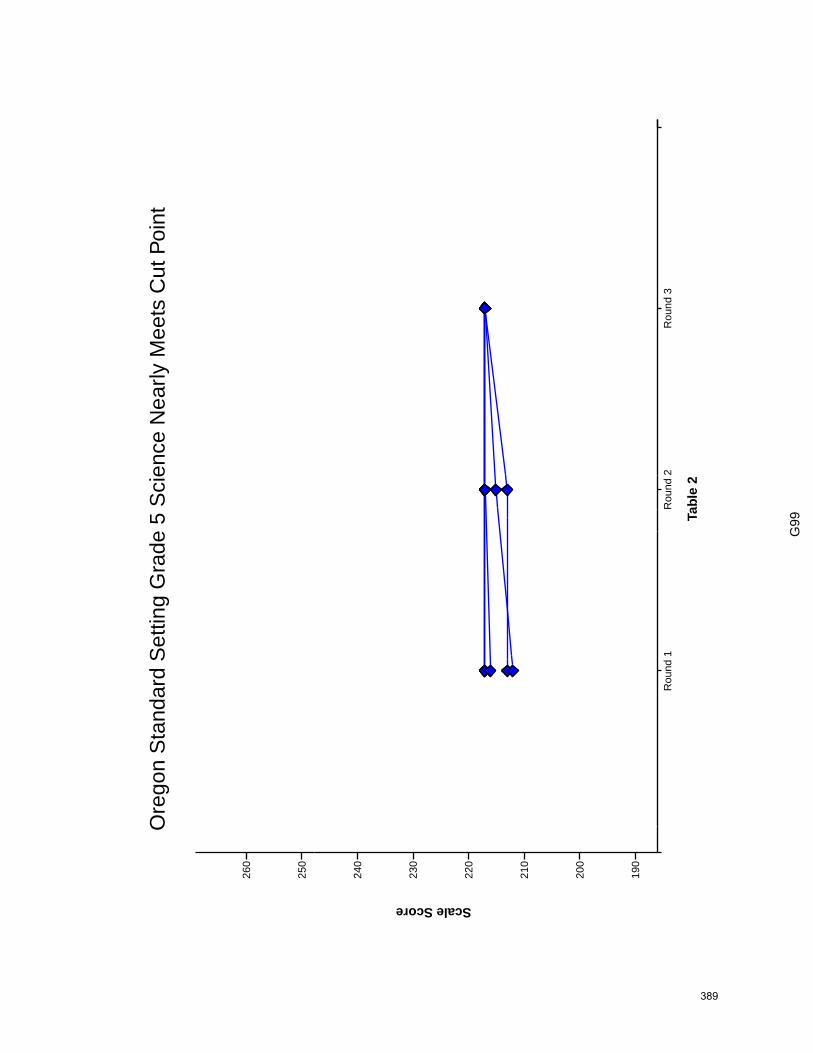
Ore
gon
Sta
ndar
d S
ettin
g G
rade
5 S
cien
ce N
early
Mee
ts C
ut P
oint
Rou
nd 3
Rou
nd 2
260
250
Tab
le 2
Rou
nd 1
240
230
Scale Score
220
210
200
190
G99
389

Ore
gon
Sta
ndar
d S
ettin
g G
rade
5 S
cien
ce N
early
Mee
ts C
ut P
oint
Rou
nd 3
260
250
240
230
Scale Score
220
Rou
nd 2
Tab
le 3
Rou
nd 1
210
200
190
G10
0
390

Ore
gon
Sta
ndar
d S
ettin
g G
rade
5 S
cien
ce M
eets
Cut
Poi
nt
Tab
le 1
Tab
le 2
Tab
le 3
Rou
nd 3
SE
Bk
= 0.
59; r
= 0
.31
260
Rou
nd 2
Rou
nd 1
250
240
230
Scale Score
220
210
200
190
G10
1
391

Ore
gon
Sta
ndar
d S
ettin
g G
rade
5 S
cien
ce M
eets
Cut
Poi
nt
260
250
240
230
Scale Score
Rou
nd 3
Rou
nd 2
Tab
le 1
Rou
nd 1
190
220
210
200
G10
2
392

Ore
gon
Sta
ndar
d S
ettin
g G
rade
5 S
cien
ce M
eets
Cut
Poi
nt
Rou
nd 3
Rou
nd 2
Tab
le 2
260
Rou
nd 1
250
240
230
Scale Score
220
210
200
190
G10
3
393
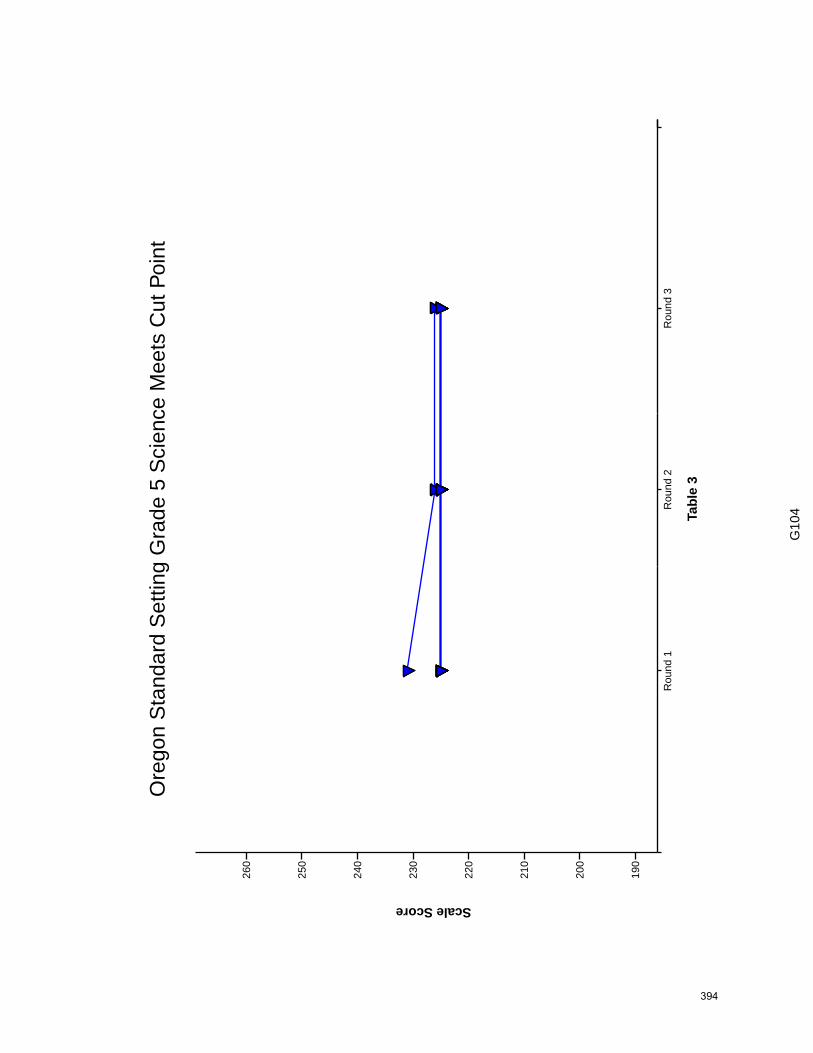
Ore
gon
Sta
ndar
d S
ettin
g G
rade
5 S
cien
ce M
eets
Cut
Poi
nt
Rou
nd 3
Rou
nd 2
Tab
le 3
Rou
nd 1
260
250
240
230
Scale Score
220
210
200
190
G10
4
394

Ore
gon
Sta
ndar
d S
ettin
g G
rade
5 S
cien
ce E
xcee
ds C
ut P
oint
Tab
le 1
Tab
le 2
Tab
le 3
Rou
nd 3
SE
Bk
= 0.
70; r
= 0
.12
Rou
nd 2
260
250
240
230
Scale Score
Rou
nd 1
220
210
200
190
G10
5
395

Ore
gon
Sta
ndar
d S
ettin
g G
rade
5 S
cien
ce E
xcee
ds C
ut P
oint
Rou
nd 3
260
250
240
230
Scale Score
220
Rou
nd 2
Tab
le 1
Rou
nd 1
210
200
190
G10
6
396

Ore
gon
Sta
ndar
d S
ettin
g G
rade
5 S
cien
ce E
xcee
ds C
ut P
oint
Rou
nd 3
Rou
nd 2
Tab
le 2
Rou
nd 1
190
260
250
240
230
Scale Score
220
210
200
G10
7
397

Ore
gon
Sta
ndar
d S
ettin
g G
rade
5 S
cien
ce E
xcee
ds C
ut P
oint
260
250
240
Rou
nd 3
Rou
nd 2
Tab
le 3
Rou
nd 1
230
Scale Score
220
210
200
190
G10
8
398

Ore
gon
Sta
ndar
d S
ettin
g G
rade
8 S
cien
ce N
early
Mee
ts C
ut P
oint
Tab
le 1
Tab
le 2
Tab
le 3
Rou
nd 3
SE
Bk
= 1.
11; r
= 0
.32
Rou
nd 2
Rou
nd 1
270
260
250
240
Scale Score
230
220
210
200
G10
9
399
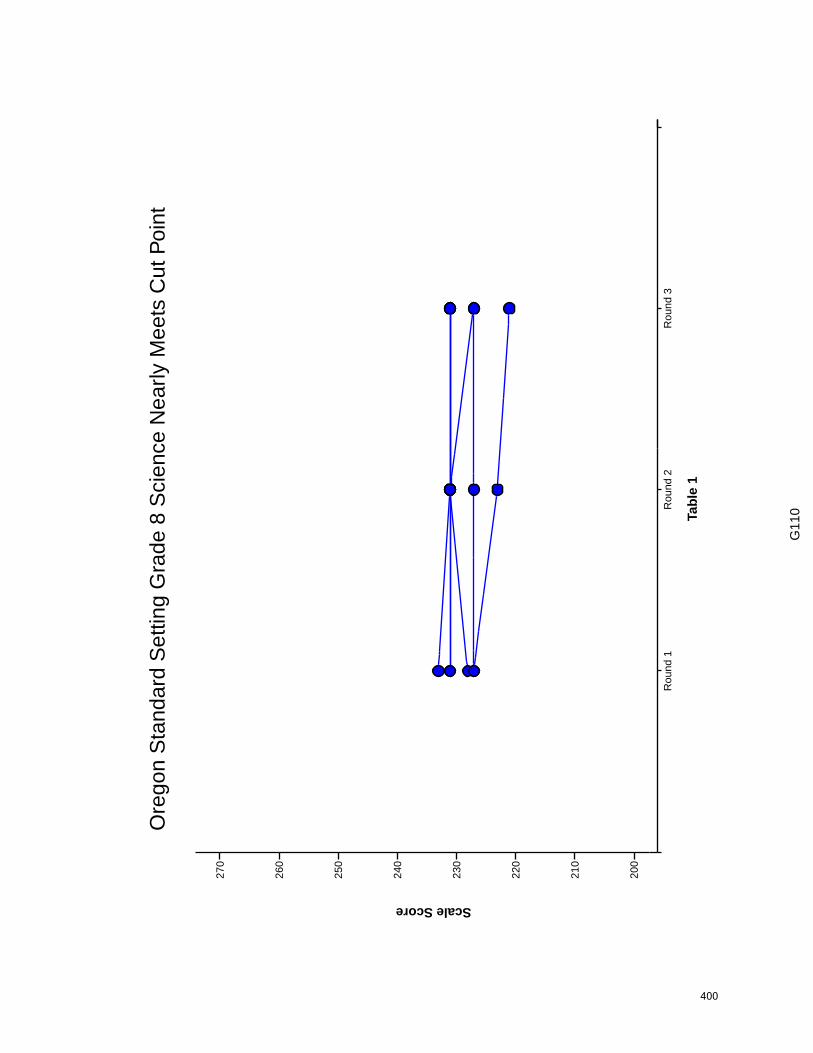
Ore
gon
Sta
ndar
d S
ettin
g G
rade
8 S
cien
ce N
early
Mee
ts C
ut P
oint
Rou
nd 3
Rou
nd 2
Tab
le 1
Rou
nd 1
270
260
250
240
Scale Score
230
220
210
200
G11
0
400
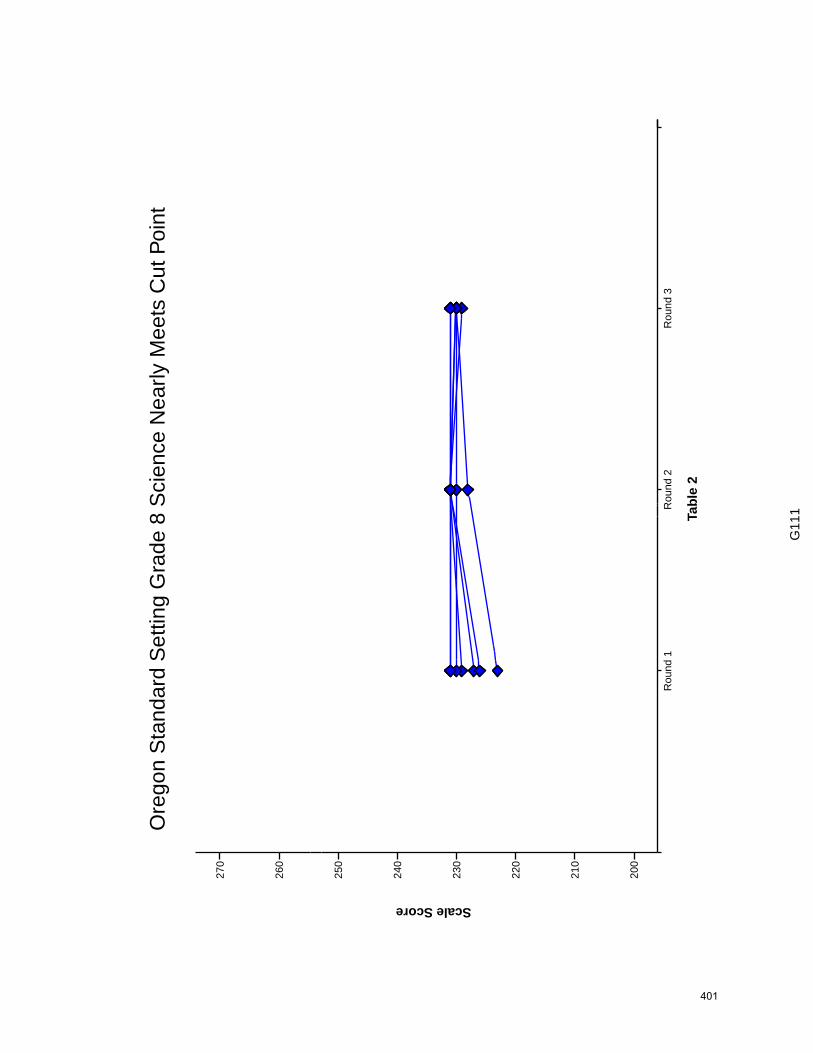
Ore
gon
Sta
ndar
d S
ettin
g G
rade
8 S
cien
ce N
early
Mee
ts C
ut P
oint
Rou
nd 3
Rou
nd 2
270
260
Tab
le 2
Rou
nd 1
250
240
Scale Score
230
220
210
200
G11
1
401
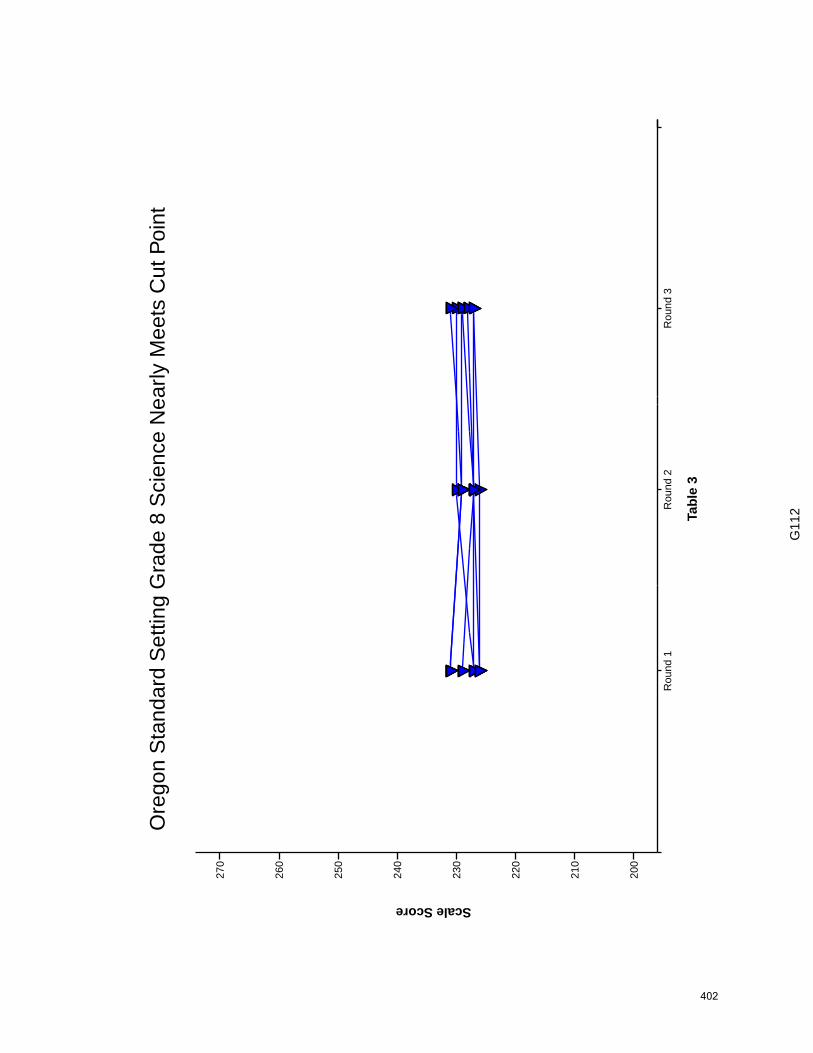
Ore
gon
Sta
ndar
d S
ettin
g G
rade
8 S
cien
ce N
early
Mee
ts C
ut P
oint
Rou
nd 3
Rou
nd 2
Tab
le 3
Rou
nd 1
270
260
250
240
Scale Score
230
220
210
200
G11
2
402

Ore
gon
Sta
ndar
d S
ettin
g G
rade
8 S
cien
ce M
eets
Cut
Poi
nt
Tab
le 1
Tab
le 2
Tab
le 3
Rou
nd 3
SE
Bk
= 0.
99; r
= 0
.65
Rou
nd 2
270
260
250
240
Scale Score
230
220
210
Rou
nd 1
200
G11
3
403

Ore
gon
Sta
ndar
d S
ettin
g G
rade
8 S
cien
ce M
eets
Cut
Poi
nt
Rou
nd 3
Rou
nd 2
Tab
le 1
Rou
nd 1
200
270
260
250
240
Scale Score
230
220
210
G11
4
404

Ore
gon
Sta
ndar
d S
ettin
g G
rade
8 S
cien
ce M
eets
Cut
Poi
nt
Rou
nd 3
Rou
nd 2
Tab
le 2
Rou
nd 1
200
270
260
250
240
Scale Score
230
220
210
G11
5
405
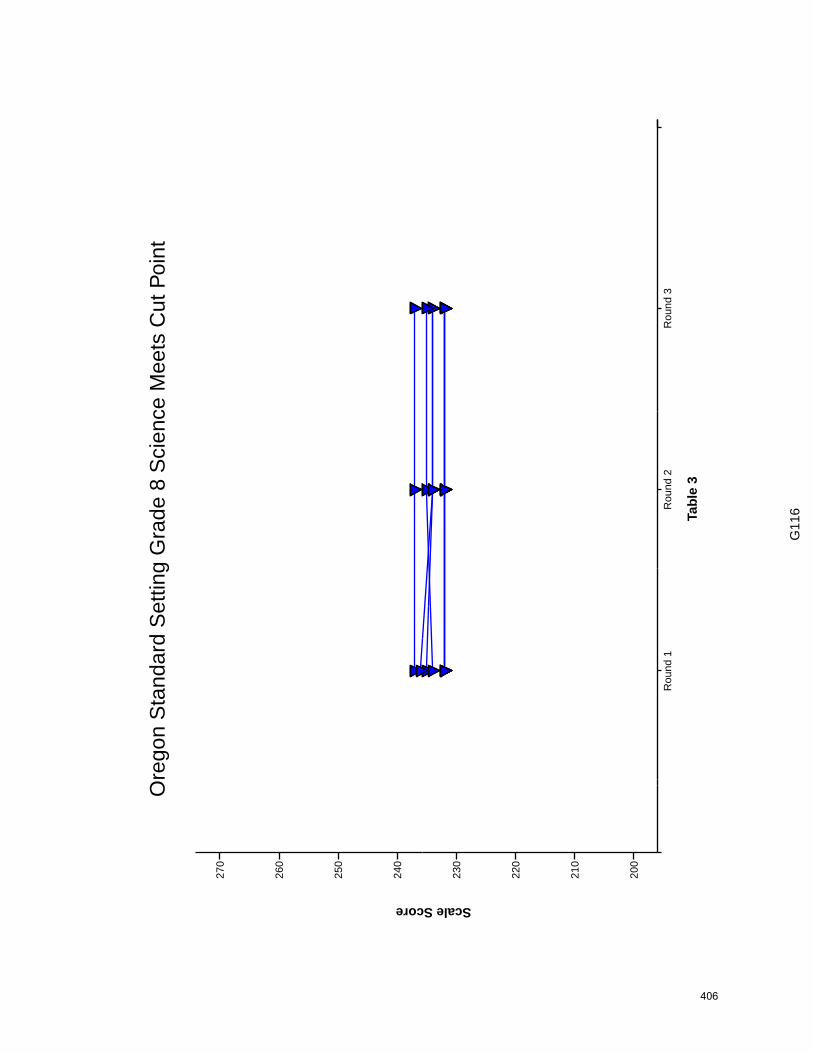
Ore
gon
Sta
ndar
d S
ettin
g G
rade
8 S
cien
ce M
eets
Cut
Poi
nt
270
260
250
240
Rou
nd 3
Rou
nd 2
Tab
le 3
Rou
nd 1
Scale Score
230
220
210
200
G11
6
406

Ore
gon
Sta
ndar
d S
ettin
g G
rade
8 S
cien
ce E
xcee
ds C
ut P
oint
Tab
le 1
Tab
le 2
Tab
le 3
Rou
nd 3
SE
Bk
= 0.
69; r
= 0
.38
Rou
nd 2
270
260
250
240
Scale Score
230
Rou
nd 1
220
210
200
G11
7
407

Ore
gon
Sta
ndar
d S
ettin
g G
rade
8 S
cien
ce E
xcee
ds C
ut P
oint
Rou
nd 3
Rou
nd 2
Tab
le 1
Rou
nd 1
210
200
270
260
250
240
Scale Score
230
220
G11
8
408

Ore
gon
Sta
ndar
d S
ettin
g G
rade
8 S
cien
ce E
xcee
ds C
ut P
oint
Rou
nd 3
Rou
nd 2
Tab
le 2
Rou
nd 1
210
200
270
260
250
240
Scale Score
230
220
G11
9
409

Ore
gon
Sta
ndar
d S
ettin
g G
rade
8 S
cien
ce E
xcee
ds C
ut P
oint
270
260
250
Rou
nd 3
Rou
nd 2
Tab
le 3
Rou
nd 1
240
Scale Score
230
220
210
200
G12
0
410

Ore
gon
Sta
ndar
d S
ettin
g G
rade
10
Sci
ence
Nea
rly M
eets
Cut
Poi
nt
Tab
le 1
Tab
le 2
Tab
le 3
Rou
nd 3
SE
Bk
= 1.
35; r
= 0
.51
Rou
nd 2
270
260
250
240
Scale Score
230
220
Rou
nd 1
210
G12
1
411

Ore
gon
Sta
ndar
d S
ettin
g G
rade
10
Sci
ence
Nea
rly M
eets
Cut
Poi
nt
Rou
nd 3
Rou
nd 2
Tab
le 1
Rou
nd 1
210
270
260
250
240
Scale Score
230
220
G12
2
412

Ore
gon
Sta
ndar
d S
ettin
g G
rade
10
Sci
ence
Nea
rly M
eets
Cut
Poi
nt
Rou
nd 3
Rou
nd 2
Tab
le 2
270
Rou
nd 1
260
250
240
Scale Score
230
220
210
G12
3
413

Ore
gon
Sta
ndar
d S
ettin
g G
rade
10
Sci
ence
Nea
rly M
eets
Cut
Poi
nt
270
260
250
240
Scale Score
230
Rou
nd 3
Rou
nd 2
Tab
le 3
Rou
nd 1
220
210
G12
4
414

Ore
gon
Sta
ndar
d S
ettin
g G
rade
10
Sci
ence
Mee
ts C
ut P
oint
Tab
le 1
Tab
le 2
Tab
le 3
Rou
nd 3
SE
Bk
= 0.
79; r
= 0
.55
Rou
nd 2
270
260
250
240
Scale Score
230
220
Rou
nd 1
210
G12
5
415

Ore
gon
Sta
ndar
d S
ettin
g G
rade
10
Sci
ence
Mee
ts C
ut P
oint
Rou
nd 3
Rou
nd 2
Tab
le 1
Rou
nd 1
210
270
260
250
240
Scale Score
230
220
G12
6
416

Ore
gon
Sta
ndar
d S
ettin
g G
rade
10
Sci
ence
Mee
ts C
ut P
oint
Rou
nd 3
Rou
nd 2
Tab
le 2
270
Rou
nd 1
260
250
240
Scale Score
230
220
210
G12
7
417
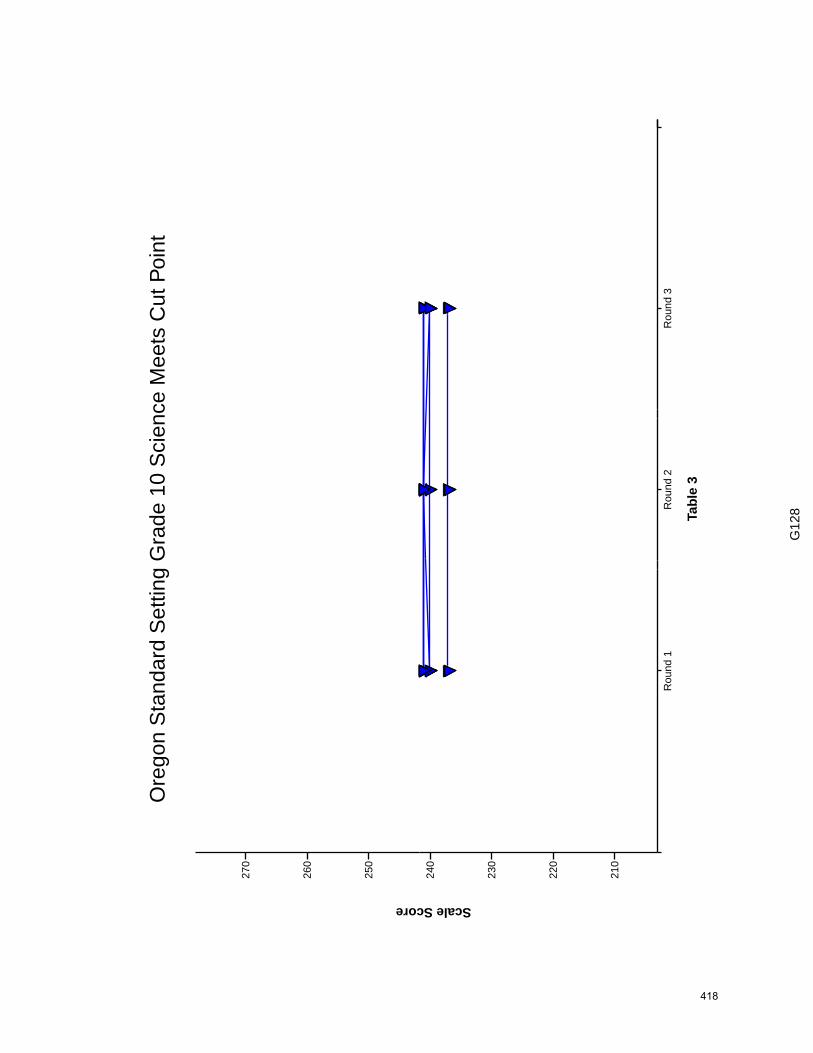
Ore
gon
Sta
ndar
d S
ettin
g G
rade
10
Sci
ence
Mee
ts C
ut P
oint
270
260
250
Rou
nd 3
Rou
nd 2
Tab
le 3
Rou
nd 1
240
Scale Score
230
220
210
G12
8
418

Ore
gon
Sta
ndar
d S
ettin
g G
rade
10
Sci
ence
Exc
eeds
Cut
Poi
nt
Tab
le 1
Tab
le 2
Tab
le 3
Rou
nd 3
SE
Bk
= 1.
55; r
= 0
.57
Rou
nd 2
270
260
250
240
Scale Score
230
Rou
nd 1
220
210
G12
9
419

Ore
gon
Sta
ndar
d S
ettin
g G
rade
10
Sci
ence
Exc
eeds
Cut
Poi
nt
Rou
nd 3
Rou
nd 2
Tab
le 1
Rou
nd 1
220
210
270
260
250
240
Scale Score
230
G13
0
420

Ore
gon
Sta
ndar
d S
ettin
g G
rade
10
Sci
ence
Exc
eeds
Cut
Poi
nt
Rou
nd 3
Rou
nd 2
Tab
le 2
Rou
nd 1
210
270
260
250
240
Scale Score
230
220
G13
1
421

Ore
gon
Sta
ndar
d S
ettin
g G
rade
10
Sci
ence
Exc
eeds
Cut
Poi
nt
Rou
nd 3
Rou
nd 2
Tab
le 3
270
260
250
Rou
nd 1
240
Scale Score
230
220
210
G13
2
422

SECTION I
Participant Evaluation of the Oregon
Standard Setting
423

BSS
P A
cade
mic
Eva
luat
ion
- Ore
gon
Stan
dard
Set
ting
– D
ecem
ber
2006
Pl
ease
add
you
r co
mm
ents
on
the
back
of t
his e
valu
atio
n.
Tha
nk y
ou!
29. W
hat i
s you
r oc
cupa
tion?
30. H
ow m
any
year
s in
your
cur
rent
pro
fess
ion?
O
Tea
cher
O
A
dmin
istr
ator
O
O
ther
O
1–5
O
6–
10
O
11–1
5 O
16
–20
O
21+
31
. Wha
t is y
our
prim
ary
role
at
this
stan
dard
sett
ing?
32
. Wha
t is y
our
educ
atio
n le
vel?
O
Edu
cato
r O
Pa
rent
O
C
omm
unity
Mem
ber
O
Bus
ines
s Mem
ber
O
HSD
or
GE
D
O
Bac
helo
r's
O
Mas
ter'
s O
D
octo
rate
33. W
hat i
s you
r ge
nder
?
34. W
hat i
s you
r ra
ce?
O
M
ale
O
Fe
mal
e
O
Asi
an/
Paci
fic Is
land
er
O
Bla
ck/
Afr
ican
-Am
eric
an
O
Am
eric
an In
dian
O
W
hite
O
O
ther
35. A
re y
ou o
f His
pani
c or
igin
?
36. H
ave
you
taug
ht
Spec
ial E
duca
tion?
O
Yes
O
N
o
O
Yes
O
N
o
37. H
ave
you
taug
ht E
SL/E
LD
?
38. H
ave
you
taug
ht
Voc
atio
nal E
duca
tion?
O
Yes
O
N
o
O
Yes
O
N
o
39.
Hav
e yo
u ta
ught
A
ltern
ativ
e E
duca
tion?
40. H
ave
you
taug
ht
Adu
lt E
duca
tion?
O
Yes
O
N
o O
Y
es
O
No
41. W
hich
con
tent
are
a di
d yo
u w
ork
on d
urin
g th
is st
anda
rd
sett
ing?
42. W
hich
gra
de d
id y
ou
wor
k on
dur
ing
this
st
anda
rd se
ttin
g?
O
R
eadi
ng/L
itera
ture
O
M
athe
mat
ics
O
Scie
nce
O
O
O
O
3
5
8
H
S
Key
: SD
=Str
ongl
y D
isag
ree
D=D
isag
ree
N=N
eutr
al A
=Agr
ee S
A=S
tron
gly
Agr
ee
SD
D
N
A
SA
1. T
he B
ookm
ark
Proc
edur
e w
as w
ell d
escr
ibed
. O
O
O
O
O
2.
The
trai
ning
on
book
mar
k pl
acem
ent m
ade
the
task
cle
ar to
me.
O
O
O
O
O
3.
The
trai
ning
mat
eria
ls w
ere
help
ful.
O
O
O
O
O
4. T
he g
oals
for
the
Boo
kmar
k Pr
oced
ure
wer
e cl
ear.
O
O
O
O
O
5.
Rev
iew
ing
the
test
item
s hel
ped
me
plac
e m
y bo
okm
arks
. O
O
O
O
O
6.
The
ord
erin
g of
the
item
s in
the
orde
red
item
boo
klet
agr
eed
with
my
perc
eptio
n of
the
rela
tive
diff
icul
ty o
f the
item
s. O
O
O
O
O
7. R
evie
win
g th
e T
arge
t Stu
dent
hel
ped
me
plac
e m
y bo
okm
arks
. O
O
O
O
O
8.
I co
nsid
ered
the
cont
ent s
tand
ards
whe
n I p
lace
d m
y bo
okm
arks
. O
O
O
O
O
9.
Dur
ing
Rou
nd 1
, I p
lace
d m
y bo
okm
arks
with
out c
onsu
lting
oth
er
part
icip
ants
. O
O
O
O
O
10. I
had
eno
ugh
time
to c
onsi
der
my
Rou
nd 1
boo
kmar
ks.
O
O
O
O
O
11. O
vera
ll, m
y ta
ble'
s dis
cuss
ions
wer
e op
en a
nd h
ones
t. O
O
O
O
O
12
. Ove
rall,
I be
lieve
that
my
opin
ions
wer
e co
nsid
ered
and
val
ued
by m
y gr
oup.
O
O
O
O
O
13. T
he p
rese
ntat
ion
of d
iffer
ent t
ypes
of i
mpa
ct d
ata
was
hel
pful
to m
e.
O
O
O
O
O
14. I
lear
ned
how
to d
o th
e bo
okm
ark
plac
emen
t as I
wen
t alo
ng, s
o m
y la
ter
ones
may
not
be
com
para
ble
to m
y ea
rlie
r on
es.
O
O
O
O
O
15. I
und
erst
ood
how
to p
lace
my
book
mar
ks.
O
O
O
O
O
16. O
vera
ll, I
am sa
tisfie
d w
ith m
y gr
oup'
s fin
al b
ookm
arks
. O
O
O
O
O
17
. I fe
el th
is p
roce
dure
was
fair
. O
O
O
O
O
18. I
am
con
fiden
t tha
t the
Boo
kmar
k Pr
oced
ure
prod
uced
val
id st
anda
rds.
O
O
O
O
O
19. I
wou
ld d
efen
d th
e N
earl
y M
eets
cut
scor
e ag
ains
t cri
ticis
m th
at it
is to
o hi
gh.
O
O
O
O
O
20. I
wou
ld d
efen
d th
e N
earl
y M
eets
cut
scor
e ag
ains
t cri
ticis
m th
at it
is to
o lo
w.
O
O
O
O
O
21. I
wou
ld d
efen
d th
e M
eets
cut
scor
e ag
ains
t cri
ticis
m th
at it
is to
o hi
gh.
O
O
O
O
O
22. I
wou
ld d
efen
d th
e M
eets
cut
scor
e ag
ains
t cri
ticis
m th
at it
is to
o lo
w.
O
O
O
O
O
23. I
wou
ld d
efen
d th
e E
xcee
ds c
ut sc
ore
agai
nst c
ritic
ism
that
it is
too
high
. O
O
O
O
O
24. I
wou
ld d
efen
d th
e E
xcee
ds c
ut sc
ore
agai
nst c
ritic
ism
that
it is
too
low
. O
O
O
O
O
25. P
artic
ipat
ing
in th
e B
ookm
ark
Proc
edur
e in
crea
sed
my
unde
rsta
ndin
g of
th
e te
st.
O
O
O
O
O
26. T
his e
xper
ienc
e w
ill h
elp
me
targ
et in
stru
ctio
n fo
r th
e st
uden
ts in
my
clas
sroo
m.
O
O
O
O
O
27. O
vera
ll, I
valu
ed th
e co
nfer
ence
as a
pro
fess
iona
l dev
elop
men
t exp
erie
nce.
O
O
O
O
O
28
. The
stan
dard
sett
ing
was
wel
l org
aniz
ed.
O
O
O
O
O
424

Oregon December 2006 Academic Evaluations Bookmark Standard Setting
Evaluation Results
About these results Each question is shown, along with its answer choices and associated response percentages. For Likert-type questions, there are five possible responses: "Strongly Disagree," "Disagree," "Neutral," "Agree," and "Strongly Agree." For each question, the number of respondents is shown in the column labeled "N." Question 1 The Bookmark Procedure was well described.
Content Area Grade N Strongly Disagree Disagree Neutral Agree
Strongly Agree
Agree + Strongly
Agree Overall 209 0.0% 1.9% 7.2% 61.7% 29.2% 90.9%
3 19 0.0% 0.0% 10.5% 57.9% 31.6% 89.5% 5 18 0.0% 11.1% 16.7% 44.4% 27.8% 72.2% 8 20 0.0% 5.0% 0.0% 65.0% 30.0% 95.0%
Mathematics
10 19 0.0% 0.0% 0.0% 68.4% 31.6% 100% 3 19 0.0% 0.0% 0.0% 57.9% 42.1% 100% 5 22 0.0% 0.0% 4.5% 68.2% 27.3% 95.5% 8 20 0.0% 5.0% 15.0% 55.0% 25.0% 80.0%
Reading/ Literature
10 16 0.0% 0.0% 18.8% 50.0% 31.3% 81.3% 5 20 0.0% 0.0% 10.0% 50.0% 40.0% 90.0% 8 20 0.0% 0.0% 5.0% 80.0% 15.0% 95.0% Science 10 16 0.0% 0.0% 0.0% 81.3% 18.8% 100%
425

Question 2 The training on bookmark placement made the task clear to me.
Content Area Grade N Strongly Disagree Disagree Neutral Agree
Strongly Agree
Agree + Strongly
Agree Overall 209 0.0% 3.3% 9.6% 61.7% 25.4% 87.1%
3 19 0.0% 0.0% 10.5% 63.2% 26.3% 89.5% 5 18 0.0% 11.1% 16.7% 55.6% 16.7% 72.3% 8 20 0.0% 0.0% 5.0% 75.0% 20.0% 95.0%
Mathematics
10 19 0.0% 0.0% 10.5% 57.9% 31.6% 89.5% 3 19 0.0% 0.0% 5.3% 52.6% 42.1% 94.7% 5 22 0.0% 4.5% 9.1% 50.0% 36.4% 86.4% 8 20 0.0% 10.0% 15.0% 50.0% 25.0% 75.0%
Reading/ Literature
10 16 0.0% 0.0% 6.3% 68.8% 25.0% 93.8% 5 20 0.0% 10.0% 5.0% 50.0% 35.0% 85.0% 8 20 0.0% 0.0% 15.0% 80.0% 5.0% 85.0% Science 10 16 0.0% 0.0% 6.3% 81.3% 12.5% 93.8%
Question 3 The training materials were helpful.
Content Area Grade N Strongly Disagree Disagree Neutral Agree
Strongly Agree
Agree + Strongly
Agree Overall 209 0.0% 1.0% 11.5% 66.5% 21.1% 87.6%
3 19 0.0% 0.0% 5.3% 68.4% 26.3% 94.7% 5 18 0.0% 0.0% 16.7% 72.2% 11.1% 83.3% 8 20 0.0% 0.0% 10.0% 70.0% 20.0% 90.0%
Mathematics
10 19 0.0% 5.3% 5.3% 57.9% 31.6% 89.5% 3 19 0.0% 0.0% 5.3% 78.9% 15.8% 94.7% 5 22 0.0% 0.0% 9.1% 63.6% 27.3% 90.9% 8 20 0.0% 5.0% 25.0% 60.0% 10.0% 70.0%
Reading/ Literature
10 16 0.0% 0.0% 18.8% 56.3% 25.0% 81.3% 5 20 0.0% 0.0% 5.0% 60.0% 35.0% 95.0% 8 20 0.0% 0.0% 20.0% 75.0% 5.0% 80.0% Science 10 16 0.0% 0.0% 6.3% 68.8% 25.0% 93.8%
426

Question 4 The goals for the Bookmark Procedure were clear.
Content Area Grade N Strongly Disagree Disagree Neutral Agree
Strongly Agree
Agree + Strongly
Agree Overall 208 0.0% 7.2% 9.1% 57.7% 26.0% 83.7%
3 19 0.0% 5.3% 10.5% 63.2% 21.1% 84.3% 5 18 0.0% 11.1% 16.7% 55.6% 16.7% 72.3% 8 20 0.0% 0.0% 10.0% 60.0% 30.0% 90.0%
Mathematics
10 19 0.0% 0.0% 15.8% 63.2% 21.1% 84.3% 3 19 0.0% 5.3% 0.0% 52.6% 42.1% 94.7% 5 21 0.0% 4.8% 0.0% 61.9% 33.3% 95.2% 8 20 0.0% 20.0% 5.0% 65.0% 10.0% 75.0%
Reading/ Literature
10 16 0.0% 12.5% 6.3% 43.8% 37.5% 81.3% 5 20 0.0% 5.0% 0.0% 55.0% 40.0% 95.0% 8 20 0.0% 15.0% 25.0% 40.0% 20.0% 60.0% Science 10 16 0.0% 0.0% 12.5% 75.0% 12.5% 87.5%
Question 5 Reviewing the test items helped me place my bookmarks.
Content Area Grade N Strongly Disagree Disagree Neutral Agree
Strongly Agree
Agree + Strongly
Agree Overall 208 1.9% 2.4% 4.8% 38.0% 52.9% 90.9%
3 19 0.0% 0.0% 5.3% 36.8% 57.9% 94.7% 5 18 11.1% 0.0% 5.6% 27.8% 55.6% 83.4% 8 20 0.0% 0.0% 5.0% 40.0% 55.0% 95.0%
Mathematics
10 19 0.0% 0.0% 10.5% 26.3% 63.2% 89.5% 3 19 0.0% 0.0% 0.0% 21.1% 78.9% 100% 5 21 0.0% 0.0% 4.8% 52.4% 42.9% 95.3% 8 20 0.0% 5.0% 0.0% 65.0% 30.0% 95.0%
Reading/ Literature
10 16 0.0% 0.0% 6.3% 50.0% 43.8% 93.8% 5 20 5.0% 0.0% 0.0% 30.0% 65.0% 95.0% 8 20 5.0% 20.0% 15.0% 40.0% 20.0% 60.0% Science 10 16 0.0% 0.0% 0.0% 25.0% 75.0% 100%
427

Question 6 The ordering of the items in the ordered item booklet agreed with my perception of the relative difficulty of the items.
Content Area Grade N Strongly Disagree Disagree Neutral Agree
Strongly Agree
Agree + Strongly
Agree Overall 209 6.2% 28.2% 19.1% 42.6% 3.8% 46.4%
3 19 5.3% 36.8% 15.8% 42.1% 0.0% 42.1% 5 18 0.0% 22.2% 33.3% 44.4% 0.0% 44.4% 8 20 0.0% 25.0% 35.0% 35.0% 5.0% 40.0%
Mathematics
10 19 15.8% 52.6% 10.5% 21.1% 0.0% 21.1% 3 19 0.0% 21.1% 15.8% 63.2% 0.0% 63.2% 5 22 0.0% 0.0% 13.6% 68.2% 18.2% 86.4% 8 20 0.0% 15.0% 20.0% 65.0% 0.0% 65.0%
Reading/ Literature
10 16 6.3% 12.5% 25.0% 50.0% 6.3% 56.3% 5 20 5.0% 25.0% 25.0% 40.0% 5.0% 45.0% 8 20 25.0% 45.0% 10.0% 20.0% 0.0% 20.0% Science 10 16 12.5% 62.5% 6.3% 12.5% 6.3% 18.8%
Question 7 Reviewing the Target Student helped me place my bookmarks.
Content Area Grade N Strongly Disagree Disagree Neutral Agree
Strongly Agree
Agree + Strongly
Agree Overall 209 1.0% 11.0% 22.0% 52.6% 13.4% 66.0%
3 19 0.0% 0.0% 36.8% 63.2% 0.0% 63.2% 5 18 0.0% 11.1% 33.3% 38.9% 16.7% 55.6% 8 20 0.0% 15.0% 30.0% 50.0% 5.0% 55.0%
Mathematics
10 19 0.0% 15.8% 31.6% 52.6% 0.0% 52.6% 3 19 0.0% 5.3% 10.5% 73.7% 10.5% 84.2% 5 22 0.0% 9.1% 9.1% 54.5% 27.3% 81.8% 8 20 5.0% 30.0% 10.0% 40.0% 15.0% 55.0%
Reading/ Literature
10 16 0.0% 12.5% 18.8% 37.5% 31.3% 68.8% 5 20 0.0% 15.0% 5.0% 55.0% 25.0% 80.0% 8 20 5.0% 5.0% 30.0% 50.0% 10.0% 60.0% Science 10 16 0.0% 0.0% 31.3% 62.5% 6.3% 68.8%
428

Question 8 I considered the content standards when I placed my bookmarks.
Content Area Grade N Strongly Disagree Disagree Neutral Agree
Strongly Agree
Agree + Strongly
Agree Overall 207 0.0% 2.4% 3.9% 40.6% 53.1% 93.7%
3 18 0.0% 0.0% 5.6% 16.7% 77.8% 94.5% 5 18 0.0% 0.0% 0.0% 55.6% 44.4% 100% 8 20 0.0% 0.0% 5.0% 55.0% 40.0% 95.0%
Mathematics
10 19 0.0% 0.0% 10.5% 31.6% 57.9% 89.5% 3 19 0.0% 0.0% 0.0% 26.3% 73.7% 100% 5 22 0.0% 4.5% 0.0% 40.9% 54.5% 95.4% 8 20 0.0% 0.0% 5.0% 45.0% 50.0% 95.0%
Reading/ Literature
10 16 0.0% 6.3% 6.3% 43.8% 43.8% 87.6% 5 19 0.0% 10.5% 0.0% 31.6% 57.9% 89.5% 8 20 0.0% 5.0% 5.0% 60.0% 30.0% 90.0% Science 10 16 0.0% 0.0% 6.3% 37.5% 56.3% 93.8%
Question 9 During Round 1, I placed my bookmarks without consulting other participants.
Content Area Grade N Strongly Disagree Disagree Neutral Agree
Strongly Agree
Agree + Strongly
Agree Overall 209 1.4% 2.4% 2.9% 31.1% 62.2% 93.3%
3 19 0.0% 0.0% 0.0% 26.3% 73.7% 100% 5 18 0.0% 5.6% 16.7% 38.9% 38.9% 77.8% 8 20 0.0% 5.0% 0.0% 35.0% 60.0% 95.0%
Mathematics
10 19 0.0% 0.0% 0.0% 42.1% 57.9% 100% 3 19 0.0% 0.0% 0.0% 5.3% 94.7% 100% 5 22 4.5% 13.6% 4.5% 45.5% 31.8% 77.3% 8 20 0.0% 0.0% 0.0% 30.0% 70.0% 100%
Reading/ Literature
10 16 0.0% 0.0% 0.0% 25.0% 75.0% 100% 5 20 5.0% 0.0% 0.0% 5.0% 90.0% 95.0% 8 20 5.0% 0.0% 0.0% 55.0% 40.0% 95.0% Science 10 16 0.0% 0.0% 12.5% 31.3% 56.3% 87.6%
429

Question 10 I had enough time to consider my Round 1 bookmarks.
Content Area Grade N Strongly Disagree Disagree Neutral Agree
Strongly Agree
Agree + Strongly
Agree Overall 209 1.4% 6.7% 5.3% 33.5% 53.1% 86.6%
3 19 0.0% 0.0% 5.3% 21.1% 73.7% 94.8% 5 18 0.0% 0.0% 5.6% 44.4% 50.0% 94.4% 8 20 0.0% 5.0% 0.0% 45.0% 50.0% 95.0%
Mathematics
10 19 0.0% 10.5% 10.5% 36.8% 42.1% 78.9% 3 19 0.0% 0.0% 0.0% 26.3% 73.7% 100% 5 22 0.0% 18.2% 13.6% 40.9% 27.3% 68.2% 8 20 0.0% 5.0% 0.0% 35.0% 60.0% 95.0%
Reading/ Literature
10 16 18.8% 0.0% 12.5% 43.8% 25.0% 68.8% 5 20 0.0% 10.0% 0.0% 0.0% 90.0% 90.0% 8 20 0.0% 15.0% 10.0% 40.0% 35.0% 75.0% Science 10 16 0.0% 6.3% 0.0% 37.5% 56.3% 93.8%
Question 11 Overall, my table's discussions were open and honest.
Content Area Grade N Strongly Disagree Disagree Neutral Agree
Strongly Agree
Agree + Strongly
Agree Overall 209 0.0% 0.0% 0.5% 16.7% 82.8% 99.5%
3 19 0.0% 0.0% 0.0% 10.5% 89.5% 100% 5 18 0.0% 0.0% 0.0% 22.2% 77.8% 100% 8 20 0.0% 0.0% 0.0% 15.0% 85.0% 100%
Mathematics
10 19 0.0% 0.0% 0.0% 21.1% 78.9% 100% 3 19 0.0% 0.0% 0.0% 5.3% 94.7% 100% 5 22 0.0% 0.0% 0.0% 9.1% 90.9% 100% 8 20 0.0% 0.0% 0.0% 20.0% 80.0% 100%
Reading/ Literature
10 16 0.0% 0.0% 0.0% 12.5% 87.5% 100% 5 20 0.0% 0.0% 5.0% 20.0% 75.0% 95.0% 8 20 0.0% 0.0% 0.0% 25.0% 75.0% 100% Science 10 16 0.0% 0.0% 0.0% 25.0% 75.0% 100%
430

Question 12 Overall, I believe that my opinions were considered and valued by my group.
Content Area Grade N Strongly Disagree Disagree Neutral Agree
Strongly Agree
Agree + Strongly
Agree Overall 209 0.5% 1.9% 4.3% 27.8% 65.6% 93.4%
3 19 0.0% 0.0% 0.0% 36.8% 63.2% 100% 5 18 0.0% 5.6% 11.1% 27.8% 55.6% 83.4% 8 20 0.0% 0.0% 0.0% 40.0% 60.0% 100%
Mathematics
10 19 0.0% 0.0% 5.3% 15.8% 78.9% 94.7% 3 19 0.0% 0.0% 0.0% 10.5% 89.5% 100% 5 22 4.5% 0.0% 4.5% 22.7% 68.2% 90.9% 8 20 0.0% 10.0% 5.0% 30.0% 55.0% 85.0%
Reading/ Literature
10 16 0.0% 0.0% 0.0% 18.8% 81.3% 100% 5 20 0.0% 0.0% 5.0% 25.0% 70.0% 95.0% 8 20 0.0% 5.0% 10.0% 45.0% 40.0% 85.0% Science 10 16 0.0% 0.0% 6.3% 31.3% 62.5% 93.8%
Question 13 The presentation of different types of impact data was helpful to me.
Content Area Grade N Strongly Disagree Disagree Neutral Agree
Strongly Agree
Agree + Strongly
Agree Overall 209 2.4% 9.1% 13.4% 47.8% 27.3% 75.1%
3 19 0.0% 15.8% 5.3% 42.1% 36.8% 78.9% 5 18 0.0% 0.0% 11.1% 66.7% 22.2% 88.9% 8 20 0.0% 0.0% 5.0% 40.0% 55.0% 95.0%
Mathematics
10 19 0.0% 10.5% 10.5% 42.1% 36.8% 78.9% 3 19 0.0% 10.5% 5.3% 63.2% 21.1% 84.3% 5 22 0.0% 0.0% 4.5% 50.0% 45.5% 95.5% 8 20 5.0% 35.0% 25.0% 30.0% 5.0% 35.0%
Reading/ Literature
10 16 12.5% 18.8% 31.3% 31.3% 6.3% 37.6% 5 20 0.0% 0.0% 15.0% 40.0% 45.0% 85.0% 8 20 10.0% 0.0% 20.0% 65.0% 5.0% 70.0% Science 10 16 0.0% 12.5% 18.8% 56.3% 12.5% 68.8%
431

Question 14 I learned how to do the bookmark placement as I went along, so my later ones may not be comparable to my earlier ones.
Content Area Grade N Strongly Disagree Disagree Neutral Agree
Strongly Agree
Agree + Strongly
Agree Overall 209 21.1% 42.1% 12.0% 19.6% 5.3% 24.9%
3 19 21.1% 57.9% 15.8% 5.3% 0.0% 5.3% 5 18 0.0% 50.0% 16.7% 22.2% 11.1% 33.3% 8 20 20.0% 55.0% 0.0% 25.0% 0.0% 25.0%
Mathematics
10 19 21.1% 26.3% 15.8% 31.6% 5.3% 36.9% 3 19 26.3% 21.1% 26.3% 15.8% 10.5% 26.3% 5 22 31.8% 31.8% 4.5% 31.8% 0.0% 31.8% 8 20 30.0% 45.0% 10.0% 15.0% 0.0% 15.0%
Reading/ Literature
10 16 12.5% 50.0% 12.5% 18.8% 6.3% 25.1% 5 20 35.0% 30.0% 5.0% 20.0% 10.0% 30.0% 8 20 15.0% 60.0% 10.0% 15.0% 0.0% 15.0% Science 10 16 12.5% 37.5% 18.8% 12.5% 18.8% 31.3%
Question 15 I understood how to place my bookmarks.
Content Area Grade N Strongly Disagree Disagree Neutral Agree
Strongly Agree
Agree + Strongly
Agree Overall 209 0.0% 1.9% 1.4% 52.2% 44.5% 96.7%
3 19 0.0% 5.3% 0.0% 57.9% 36.8% 94.7% 5 18 0.0% 0.0% 0.0% 72.2% 27.8% 100% 8 20 0.0% 0.0% 0.0% 50.0% 50.0% 100%
Mathematics
10 19 0.0% 0.0% 0.0% 57.9% 42.1% 100% 3 19 0.0% 0.0% 0.0% 42.1% 57.9% 100% 5 22 0.0% 4.5% 4.5% 45.5% 45.5% 91.0% 8 20 0.0% 5.0% 0.0% 40.0% 55.0% 95.0%
Reading/ Literature
10 16 0.0% 0.0% 6.3% 56.3% 37.5% 93.8% 5 20 0.0% 0.0% 0.0% 35.0% 65.0% 100% 8 20 0.0% 0.0% 5.0% 65.0% 30.0% 95.0% Science 10 16 0.0% 6.3% 0.0% 56.3% 37.5% 93.8%
432
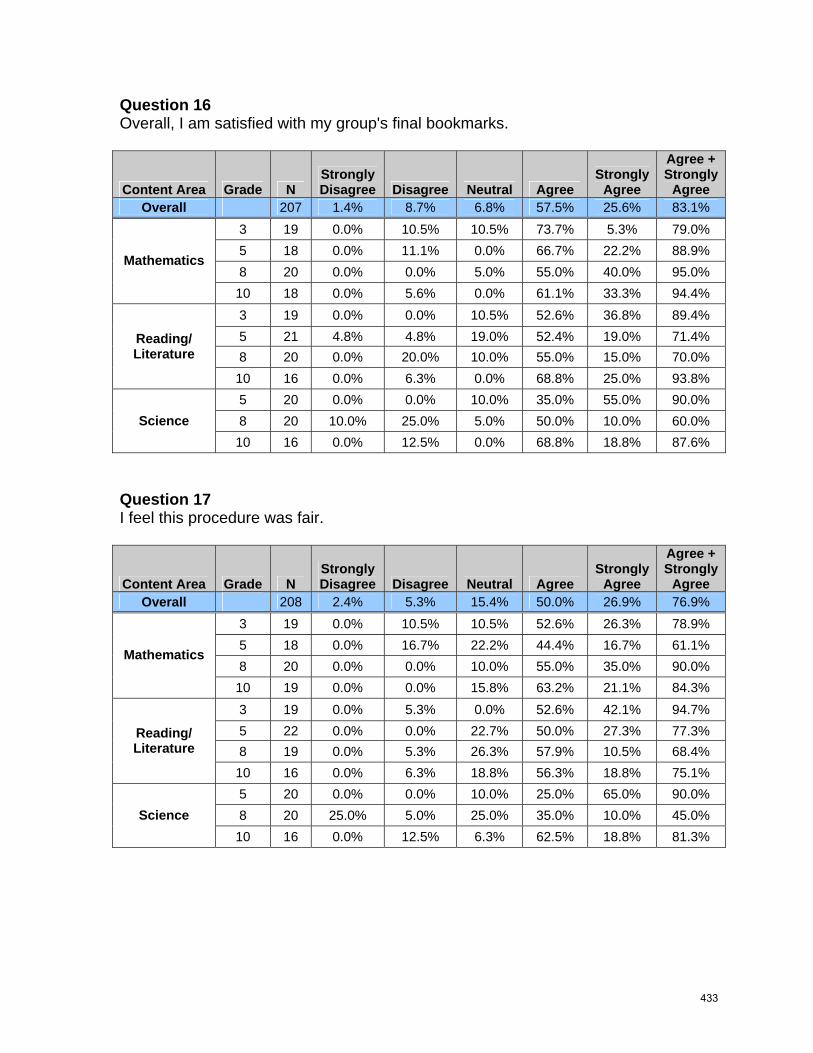
Question 16 Overall, I am satisfied with my group's final bookmarks.
Content Area Grade N Strongly Disagree Disagree Neutral Agree
Strongly Agree
Agree + Strongly
Agree Overall 207 1.4% 8.7% 6.8% 57.5% 25.6% 83.1%
3 19 0.0% 10.5% 10.5% 73.7% 5.3% 79.0% 5 18 0.0% 11.1% 0.0% 66.7% 22.2% 88.9% 8 20 0.0% 0.0% 5.0% 55.0% 40.0% 95.0%
Mathematics
10 18 0.0% 5.6% 0.0% 61.1% 33.3% 94.4% 3 19 0.0% 0.0% 10.5% 52.6% 36.8% 89.4% 5 21 4.8% 4.8% 19.0% 52.4% 19.0% 71.4% 8 20 0.0% 20.0% 10.0% 55.0% 15.0% 70.0%
Reading/ Literature
10 16 0.0% 6.3% 0.0% 68.8% 25.0% 93.8% 5 20 0.0% 0.0% 10.0% 35.0% 55.0% 90.0% 8 20 10.0% 25.0% 5.0% 50.0% 10.0% 60.0% Science 10 16 0.0% 12.5% 0.0% 68.8% 18.8% 87.6%
Question 17 I feel this procedure was fair.
Content Area Grade N Strongly Disagree Disagree Neutral Agree
Strongly Agree
Agree + Strongly
Agree Overall 208 2.4% 5.3% 15.4% 50.0% 26.9% 76.9%
3 19 0.0% 10.5% 10.5% 52.6% 26.3% 78.9% 5 18 0.0% 16.7% 22.2% 44.4% 16.7% 61.1% 8 20 0.0% 0.0% 10.0% 55.0% 35.0% 90.0%
Mathematics
10 19 0.0% 0.0% 15.8% 63.2% 21.1% 84.3% 3 19 0.0% 5.3% 0.0% 52.6% 42.1% 94.7% 5 22 0.0% 0.0% 22.7% 50.0% 27.3% 77.3% 8 19 0.0% 5.3% 26.3% 57.9% 10.5% 68.4%
Reading/ Literature
10 16 0.0% 6.3% 18.8% 56.3% 18.8% 75.1% 5 20 0.0% 0.0% 10.0% 25.0% 65.0% 90.0% 8 20 25.0% 5.0% 25.0% 35.0% 10.0% 45.0% Science 10 16 0.0% 12.5% 6.3% 62.5% 18.8% 81.3%
433

Question 18 I am confident that the Bookmark Procedure produced valid standards.
Content Area Grade N Strongly Disagree Disagree Neutral Agree
Strongly Agree
Agree + Strongly
Agree Overall 207 2.4% 11.6% 22.2% 49.3% 14.5% 63.8%
3 18 0.0% 0.0% 22.2% 61.1% 16.7% 77.8% 5 18 0.0% 11.1% 33.3% 50.0% 5.6% 55.6% 8 20 0.0% 0.0% 0.0% 85.0% 15.0% 100%
Mathematics
10 19 0.0% 26.3% 5.3% 52.6% 15.8% 68.4% 3 19 0.0% 5.3% 5.3% 68.4% 21.1% 89.5% 5 21 0.0% 14.3% 38.1% 42.9% 4.8% 47.7% 8 20 0.0% 25.0% 40.0% 30.0% 5.0% 35.0%
Reading/ Literature
10 16 6.3% 6.3% 12.5% 50.0% 25.0% 75.0% 5 20 5.0% 0.0% 20.0% 35.0% 40.0% 75.0% 8 20 15.0% 30.0% 30.0% 20.0% 5.0% 25.0% Science 10 16 0.0% 6.3% 37.5% 50.0% 6.3% 56.3%
Question 19 I would defend the Nearly Meets cut score against criticism that it is too high.
Content Area Grade N Strongly Disagree Disagree Neutral Agree
Strongly Agree
Agree + Strongly
Agree Overall 207 4.3% 8.7% 15.0% 47.3% 24.6% 71.9%
3 19 0.0% 0.0% 15.8% 57.9% 26.3% 84.2% 5 18 5.6% 0.0% 11.1% 66.7% 16.7% 83.4% 8 20 0.0% 30.0% 10.0% 45.0% 15.0% 60.0%
Mathematics
10 19 0.0% 5.3% 15.8% 47.4% 31.6% 79.0% 3 19 0.0% 0.0% 10.5% 47.4% 42.1% 89.5% 5 22 13.6% 0.0% 22.7% 36.4% 27.3% 63.7% 8 20 0.0% 20.0% 10.0% 40.0% 30.0% 70.0%
Reading/ Literature
10 16 6.3% 12.5% 12.5% 50.0% 18.8% 68.8% 5 20 10.0% 10.0% 0.0% 55.0% 25.0% 80.0% 8 18 11.1% 5.6% 50.0% 33.3% 0.0% 33.3% Science 10 16 0.0% 12.5% 6.3% 43.8% 37.5% 81.3%
434

Question 20 I would defend the Nearly Meets cut score against criticism that it is too low.
Content Area Grade N Strongly Disagree Disagree Neutral Agree
Strongly Agree
Agree + Strongly
Agree Overall 206 3.4% 6.8% 17.5% 53.9% 18.4% 72.3%
3 19 0.0% 10.5% 15.8% 52.6% 21.1% 73.7% 5 18 5.6% 0.0% 5.6% 72.2% 16.7% 88.9% 8 20 0.0% 5.0% 10.0% 70.0% 15.0% 85.0%
Mathematics
10 18 5.6% 0.0% 22.2% 55.6% 16.7% 72.3% 3 19 0.0% 0.0% 15.8% 47.4% 36.8% 84.2% 5 22 0.0% 13.6% 18.2% 36.4% 31.8% 68.2% 8 20 10.0% 15.0% 10.0% 50.0% 15.0% 65.0%
Reading/ Literature
10 16 0.0% 6.3% 18.8% 56.3% 18.8% 75.1% 5 20 10.0% 10.0% 5.0% 65.0% 10.0% 75.0% 8 18 5.6% 0.0% 55.6% 38.9% 0.0% 38.9% Science 10 16 0.0% 12.5% 18.8% 50.0% 18.8% 68.8%
Question 21 I would defend the Meets cut score against criticism that it is too high.
Content Area Grade N Strongly Disagree Disagree Neutral Agree
Strongly Agree
Agree + Strongly
Agree Overall 207 4.3% 12.6% 11.6% 46.9% 24.6% 71.5%
3 19 0.0% 10.5% 5.3% 52.6% 31.6% 84.2% 5 18 0.0% 5.6% 11.1% 77.8% 5.6% 83.4% 8 20 0.0% 15.0% 10.0% 65.0% 10.0% 75.0%
Mathematics
10 19 0.0% 10.5% 10.5% 36.8% 42.1% 78.9% 3 19 0.0% 5.3% 15.8% 47.4% 31.6% 79.0% 5 22 13.6% 31.8% 9.1% 22.7% 22.7% 45.4% 8 20 5.0% 25.0% 5.0% 40.0% 25.0% 65.0%
Reading/ Literature
10 16 0.0% 12.5% 18.8% 43.8% 25.0% 68.8% 5 20 5.0% 10.0% 0.0% 45.0% 40.0% 85.0% 8 18 16.7% 5.6% 38.9% 38.9% 0.0% 38.9% Science 10 16 6.3% 0.0% 6.3% 50.0% 37.5% 87.5%
435

Question 22 I would defend the Meets cut score against criticism that it is too low.
Content Area Grade N Strongly Disagree Disagree Neutral Agree
Strongly Agree
Agree + Strongly
Agree Overall 207 4.3% 10.1% 11.6% 51.7% 22.2% 73.9%
3 19 0.0% 5.3% 10.5% 57.9% 26.3% 84.2% 5 18 0.0% 0.0% 0.0% 77.8% 22.2% 100% 8 20 0.0% 15.0% 10.0% 65.0% 10.0% 75.0%
Mathematics
10 19 10.5% 26.3% 10.5% 26.3% 26.3% 52.6% 3 19 0.0% 0.0% 10.5% 52.6% 36.8% 89.4% 5 22 0.0% 0.0% 4.5% 54.5% 40.9% 95.4% 8 20 15.0% 30.0% 15.0% 30.0% 10.0% 40.0%
Reading/ Literature
10 16 0.0% 25.0% 6.3% 43.8% 25.0% 68.8% 5 20 5.0% 5.0% 15.0% 50.0% 25.0% 75.0% 8 18 11.1% 0.0% 33.3% 55.6% 0.0% 55.6% Science 10 16 6.3% 6.3% 12.5% 56.3% 18.8% 75.1%
Question 23 I would defend the Exceeds cut score against criticism that it is too high.
Content Area Grade N Strongly Disagree Disagree Neutral Agree
Strongly Agree
Agree + Strongly
Agree Overall 207 3.4% 6.3% 18.8% 50.2% 21.3% 71.5%
3 19 0.0% 0.0% 15.8% 63.2% 21.1% 84.3% 5 18 0.0% 11.1% 5.6% 66.7% 16.7% 83.4% 8 20 0.0% 15.0% 15.0% 55.0% 15.0% 70.0%
Mathematics
10 19 0.0% 5.3% 21.1% 52.6% 21.1% 73.7% 3 19 5.3% 5.3% 10.5% 52.6% 26.3% 78.9% 5 22 13.6% 13.6% 13.6% 36.4% 22.7% 59.1% 8 20 0.0% 10.0% 15.0% 50.0% 25.0% 75.0%
Reading/ Literature
10 16 0.0% 0.0% 43.8% 31.3% 25.0% 56.3% 5 20 5.0% 5.0% 15.0% 40.0% 35.0% 75.0% 8 18 5.6% 0.0% 38.9% 55.6% 0.0% 55.6% Science 10 16 6.3% 0.0% 18.8% 50.0% 25.0% 75.0%
436

Question 24 I would defend the Exceeds cut score against criticism that it is too low.
Content Area Grade N Strongly Disagree Disagree Neutral Agree
Strongly Agree
Agree + Strongly
Agree Overall 207 4.8% 5.8% 17.9% 53.1% 18.4% 71.5%
3 19 0.0% 0.0% 15.8% 78.9% 5.3% 84.2% 5 18 11.1% 5.6% 5.6% 72.2% 5.6% 77.8% 8 20 0.0% 15.0% 20.0% 50.0% 15.0% 65.0%
Mathematics
10 19 10.5% 5.3% 10.5% 52.6% 21.1% 73.7% 3 19 0.0% 0.0% 21.1% 52.6% 26.3% 78.9% 5 22 4.5% 9.1% 13.6% 45.5% 27.3% 72.8% 8 20 5.0% 15.0% 25.0% 40.0% 15.0% 55.0%
Reading/ Literature
10 16 6.3% 0.0% 31.3% 31.3% 31.3% 62.6% 5 20 10.0% 5.0% 5.0% 40.0% 40.0% 80.0% 8 18 5.6% 0.0% 38.9% 55.6% 0.0% 55.6% Science 10 16 0.0% 6.3% 12.5% 68.8% 12.5% 81.3%
Question 25 Participating in the Bookmark Procedure increased my understanding of the test.
Content Area Grade N Strongly Disagree Disagree Neutral Agree
Strongly Agree
Agree + Strongly
Agree Overall 209 0.0% 1.4% 7.7% 42.1% 48.8% 90.9%
3 19 0.0% 0.0% 0.0% 73.7% 26.3% 100% 5 18 0.0% 11.1% 16.7% 33.3% 38.9% 72.2% 8 20 0.0% 0.0% 5.0% 35.0% 60.0% 95.0%
Mathematics
10 19 0.0% 0.0% 15.8% 36.8% 47.4% 84.2% 3 19 0.0% 0.0% 5.3% 36.8% 57.9% 94.7% 5 22 0.0% 4.5% 9.1% 27.3% 59.1% 86.4% 8 20 0.0% 0.0% 0.0% 65.0% 35.0% 100%
Reading/ Literature
10 16 0.0% 0.0% 12.5% 37.5% 50.0% 87.5% 5 20 0.0% 0.0% 0.0% 35.0% 65.0% 100% 8 20 0.0% 0.0% 20.0% 45.0% 35.0% 80.0% Science 10 16 0.0% 0.0% 0.0% 37.5% 62.5% 100%
437

Question 26 This experience will help me target instruction for the students in my classroom.
Content Area Grade N Strongly Disagree Disagree Neutral Agree
Strongly Agree
Agree + Strongly
Agree Overall 202 1.0% 2.5% 19.3% 40.1% 37.1% 77.2%
3 18 0.0% 0.0% 33.3% 38.9% 27.8% 66.7% 5 18 0.0% 5.6% 27.8% 33.3% 33.3% 66.6% 8 20 0.0% 0.0% 5.0% 40.0% 55.0% 95.0%
Mathematics
10 19 0.0% 5.3% 5.3% 63.2% 26.3% 89.5% 3 19 0.0% 5.3% 21.1% 42.1% 31.6% 73.7% 5 22 0.0% 4.5% 22.7% 31.8% 40.9% 72.7% 8 19 5.3% 0.0% 5.3% 57.9% 31.6% 89.5%
Reading/ Literature
10 12 0.0% 0.0% 25.0% 58.3% 16.7% 75.0% 5 20 0.0% 5.0% 15.0% 15.0% 65.0% 80.0% 8 19 5.3% 0.0% 36.8% 26.3% 31.6% 57.9% Science 10 16 0.0% 0.0% 18.8% 43.8% 37.5% 81.3%
Question 27 Overall, I valued the conference as a professional development experience.
Content Area Grade N Strongly Disagree Disagree Neutral Agree
Strongly Agree
Agree + Strongly
Agree Overall 208 0.5% 1.4% 3.4% 40.9% 53.8% 94.7%
3 19 0.0% 5.3% 10.5% 36.8% 47.4% 84.2% 5 18 0.0% 5.6% 5.6% 44.4% 44.4% 88.8% 8 20 0.0% 0.0% 0.0% 30.0% 70.0% 100%
Mathematics
10 19 0.0% 0.0% 0.0% 47.4% 52.6% 100% 3 19 0.0% 0.0% 0.0% 31.6% 68.4% 100% 5 22 0.0% 0.0% 0.0% 40.9% 59.1% 100% 8 20 0.0% 5.0% 5.0% 45.0% 45.0% 90.0%
Reading/ Literature
10 15 0.0% 0.0% 0.0% 66.7% 33.3% 100% 5 20 0.0% 0.0% 5.0% 10.0% 85.0% 95.0% 8 20 5.0% 0.0% 10.0% 55.0% 30.0% 85.0% Science 10 16 0.0% 0.0% 0.0% 50.0% 50.0% 100%
438
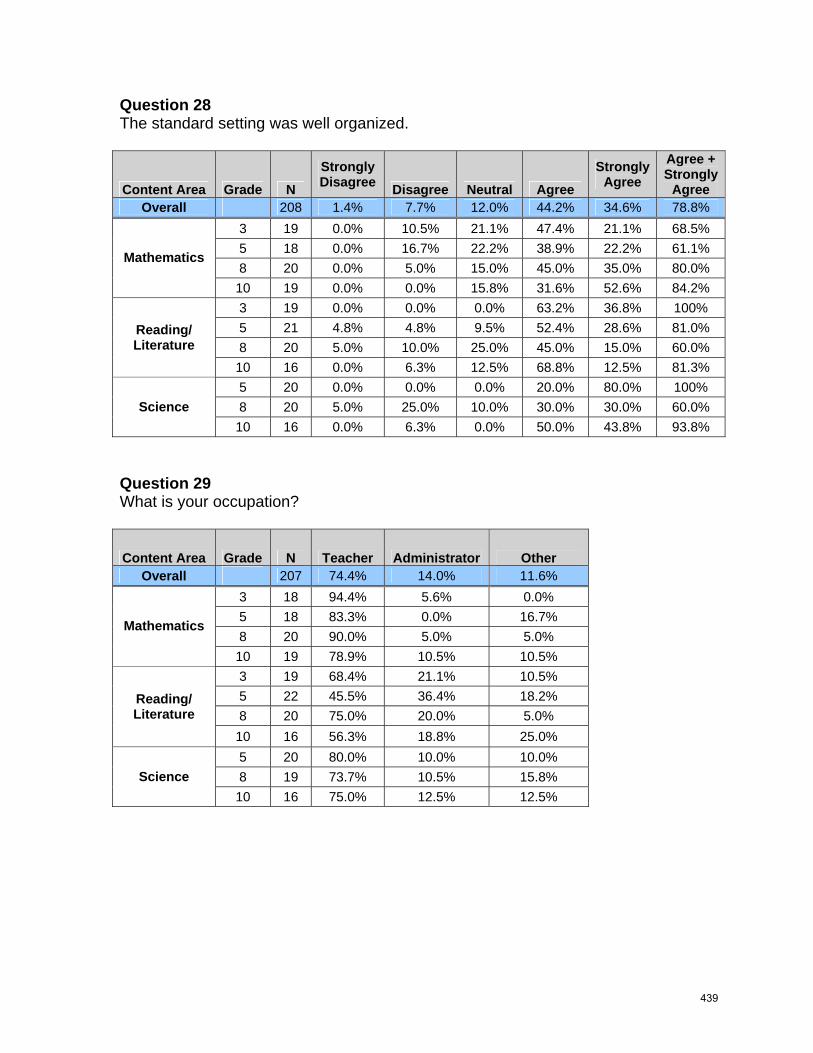
Question 28 The standard setting was well organized.
Content Area Grade N Strongly Disagree Disagree Neutral Agree
Strongly Agree
Agree + Strongly
Agree Overall 208 1.4% 7.7% 12.0% 44.2% 34.6% 78.8%
3 19 0.0% 10.5% 21.1% 47.4% 21.1% 68.5% 5 18 0.0% 16.7% 22.2% 38.9% 22.2% 61.1% 8 20 0.0% 5.0% 15.0% 45.0% 35.0% 80.0%
Mathematics
10 19 0.0% 0.0% 15.8% 31.6% 52.6% 84.2% 3 19 0.0% 0.0% 0.0% 63.2% 36.8% 100% 5 21 4.8% 4.8% 9.5% 52.4% 28.6% 81.0% 8 20 5.0% 10.0% 25.0% 45.0% 15.0% 60.0%
Reading/ Literature
10 16 0.0% 6.3% 12.5% 68.8% 12.5% 81.3% 5 20 0.0% 0.0% 0.0% 20.0% 80.0% 100% 8 20 5.0% 25.0% 10.0% 30.0% 30.0% 60.0% Science 10 16 0.0% 6.3% 0.0% 50.0% 43.8% 93.8%
Question 29 What is your occupation?
Content Area Grade N Teacher Administrator Other Overall 207 74.4% 14.0% 11.6%
3 18 94.4% 5.6% 0.0% 5 18 83.3% 0.0% 16.7% 8 20 90.0% 5.0% 5.0%
Mathematics
10 19 78.9% 10.5% 10.5% 3 19 68.4% 21.1% 10.5% 5 22 45.5% 36.4% 18.2% 8 20 75.0% 20.0% 5.0%
Reading/ Literature
10 16 56.3% 18.8% 25.0% 5 20 80.0% 10.0% 10.0% 8 19 73.7% 10.5% 15.8% Science 10 16 75.0% 12.5% 12.5%
439

Question 30 How many years in your current profession?
Content Area Grade N 1-5 6-10 11-15 16-20 21+ Overall 209 8.1% 19.1% 15.8% 21.5% 35.4%
3 19 5.3% 26.3% 5.3% 21.1% 42.1% 5 18 5.6% 16.7% 16.7% 22.2% 38.9% 8 20 10.0% 25.0% 10.0% 35.0% 20.0%
Mathematics
10 19 5.3% 21.1% 5.3% 15.8% 52.6% 3 19 0.0% 15.8% 21.1% 21.1% 42.1% 5 22 4.5% 22.7% 13.6% 22.7% 36.4% 8 20 20.0% 20.0% 30.0% 5.0% 25.0%
Reading/ Literature
10 16 18.8% 0.0% 12.5% 31.3% 37.5% 5 20 5.0% 20.0% 20.0% 25.0% 30.0% 8 20 15.0% 30.0% 5.0% 10.0% 40.0% Science 10 16 0.0% 6.3% 37.5% 31.3% 25.0%
Question 31 What is your primary role at this standard setting?
Content Area Grade N Educator Parent Community
Member Business Member
Overall 209 93.8% 3.3% 2.4% 0.5%
3 19 94.7% 0.0% 5.3% 0.0% 5 18 94.4% 5.6% 0.0% 0.0% 8 20 100% 0.0% 0.0% 0.0%
Mathematics
10 19 94.7% 0.0% 5.3% 0.0% 3 19 94.7% 0.0% 5.3% 0.0% 5 22 95.5% 0.0% 0.0% 4.5% 8 20 95.0% 5.0% 0.0% 0.0%
Reading/ Literature
10 16 87.5% 0.0% 12.5% 0.0% 5 20 95.0% 5.0% 0.0% 0.0% 8 20 90.0% 10.0% 0.0% 0.0% Science 10 16 87.5% 12.5% 0.0% 0.0%
440
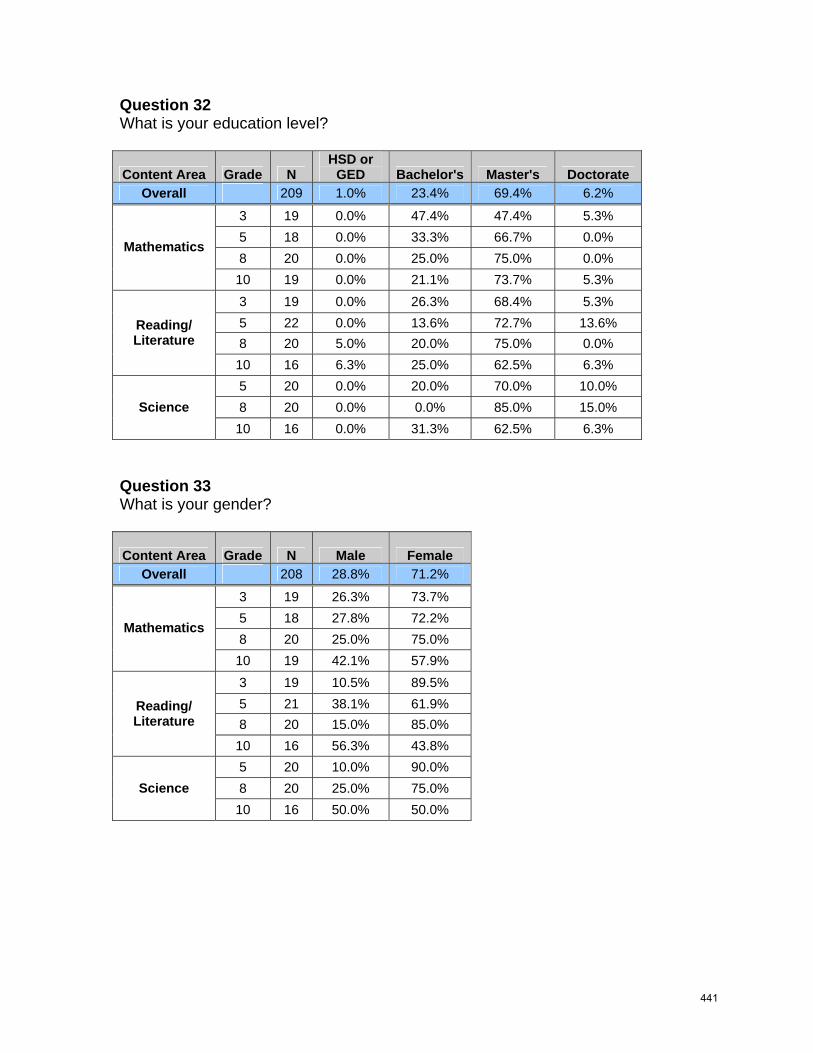
Question 32 What is your education level?
Content Area Grade N HSD or
GED Bachelor's Master's Doctorate Overall 209 1.0% 23.4% 69.4% 6.2%
3 19 0.0% 47.4% 47.4% 5.3% 5 18 0.0% 33.3% 66.7% 0.0% 8 20 0.0% 25.0% 75.0% 0.0%
Mathematics
10 19 0.0% 21.1% 73.7% 5.3% 3 19 0.0% 26.3% 68.4% 5.3% 5 22 0.0% 13.6% 72.7% 13.6% 8 20 5.0% 20.0% 75.0% 0.0%
Reading/ Literature
10 16 6.3% 25.0% 62.5% 6.3% 5 20 0.0% 20.0% 70.0% 10.0% 8 20 0.0% 0.0% 85.0% 15.0% Science 10 16 0.0% 31.3% 62.5% 6.3%
Question 33 What is your gender?
Content Area Grade N Male Female Overall 208 28.8% 71.2%
3 19 26.3% 73.7% 5 18 27.8% 72.2% 8 20 25.0% 75.0%
Mathematics
10 19 42.1% 57.9% 3 19 10.5% 89.5% 5 21 38.1% 61.9% 8 20 15.0% 85.0%
Reading/ Literature
10 16 56.3% 43.8% 5 20 10.0% 90.0% 8 20 25.0% 75.0% Science 10 16 50.0% 50.0%
441

Question 34 What is your race?
Content Area Grade N
Asian/ Pacific
Islander
Black/ African-
American American
Indian White Other Overall 205 1.5% 1.5% 0.5% 94.1% 2.4%
3 17 0.0% 0.0% 0.0% 100% 0.0% 5 18 0.0% 0.0% 0.0% 94.4% 5.6% 8 19 5.3% 0.0% 0.0% 94.7% 0.0%
Mathematics
10 19 5.3% 5.3% 0.0% 89.5% 0.0% 3 19 0.0% 0.0% 0.0% 94.7% 5.3% 5 21 0.0% 0.0% 4.8% 95.2% 0.0% 8 20 0.0% 0.0% 0.0% 95.0% 5.0%
Reading/ Literature
10 16 6.3% 0.0% 0.0% 93.8% 0.0% 5 20 0.0% 5.0% 0.0% 85.0% 10.0% 8 20 0.0% 0.0% 0.0% 100% 0.0% Science 10 16 0.0% 6.3% 0.0% 93.8% 0.0%
Question 35 Are you of Hispanic origin?
Content Area Grade N Yes No Overall 208 1.4% 98.6%
3 18 5.6% 94.4% 5 18 0.0% 100% 8 20 0.0% 100%
Mathematics
10 19 0.0% 100% 3 19 0.0% 100% 5 22 0.0% 100% 8 20 0.0% 100%
Reading/ Literature
10 16 6.3% 93.8% 5 20 5.0% 95.0% 8 20 0.0% 100% Science 10 16 0.0% 100%
442

Question 36 Have you taught Special Education?
Content Area Grade N Yes No Overall 208 17.8% 82.2%
3 19 21.1% 78.9% 5 17 5.9% 94.1% 8 20 10.0% 90.0%
Mathematics
10 19 10.5% 89.5% 3 19 21.1% 78.9% 5 22 22.7% 77.3% 8 20 20.0% 80.0%
Reading/ Literature
10 16 12.5% 87.5% 5 20 20.0% 80.0% 8 20 30.0% 70.0% Science 10 16 18.8% 81.3%
Question 37 Have you taught ESL/ELD?
Content Area Grade N Yes No Overall 208 16.8% 83.2%
3 19 26.3% 73.7% 5 18 11.1% 88.9% 8 20 20.0% 80.0%
Mathematics
10 19 5.3% 94.7% 3 19 10.5% 89.5% 5 22 27.3% 72.7% 8 20 25.0% 75.0%
Reading/ Literature
10 16 12.5% 87.5% 5 19 15.8% 84.2% 8 20 10.0% 90.0% Science 10 16 18.8% 81.3%
443

Question 38 Have you taught Vocational Education?
Content Area Grade N Yes No Overall 209 3.8% 96.2%
3 19 0.0% 100% 5 18 5.6% 94.4% 8 20 0.0% 100%
Mathematics
10 19 15.8% 84.2% 3 19 0.0% 100% 5 22 4.5% 95.5% 8 20 10.0% 90.0%
Reading/ Literature
10 16 0.0% 100% 5 20 0.0% 100% 8 20 5.0% 95.0% Science 10 16 0.0% 100%
Question 39 Have you taught Alternative Education?
Content Area Grade N Yes No Overall 209 15.3% 84.7%
3 19 5.3% 94.7% 5 18 11.1% 88.9% 8 20 20.0% 80.0%
Mathematics
10 19 26.3% 73.7% 3 19 5.3% 94.7% 5 22 18.2% 81.8% 8 20 25.0% 75.0%
Reading/ Literature
10 16 25.0% 75.0% 5 20 0.0% 100% 8 20 10.0% 90.0% Science 10 16 25.0% 75.0%
444

Question 40 Have you taught Adult Education?
Content Area Grade N Yes No Overall 209 27.3% 72.7%
3 19 10.5% 89.5% 5 18 38.9% 61.1% 8 20 20.0% 80.0%
Mathematics
10 19 42.1% 57.9% 3 19 21.1% 78.9% 5 22 31.8% 68.2% 8 20 30.0% 70.0%
Reading/ Literature
10 16 18.8% 81.3% 5 20 30.0% 70.0% 8 20 35.0% 65.0% Science 10 16 18.8% 81.3%
Question 41 Which content area did you work on during this standard setting?
Content Area Grade N Mathematics Reading/ Literature Science
Overall 209 36.4% 36.8% 26.8% 3 19 100% 0.0% 0.0% 5 18 100% 0.0% 0.0% 8 20 100% 0.0% 0.0%
Mathematics
10 19 100% 0.0% 0.0% 3 19 0.0% 100% 0.0% 5 22 0.0% 100% 0.0% 8 20 0.0% 100% 0.0%
Reading/ Literature
10 16 0.0% 100% 0.0% 5 20 0.0% 0.0% 100% 8 20 0.0% 0.0% 100% Science 10 16 0.0% 0.0% 100%
445

Question 42 Which grade did you work on during this standard setting?
Content Area Grade N Grade 3 Grade 5 Grade 8 Grade 10 Overall 209 18.2% 28.7% 28.7% 24.4%
3 19 100% 0.0% 0.0% 0.0% 5 18 0.0% 100% 0.0% 0.0% 8 20 0.0% 0.0% 100% 0.0%
Mathematics
10 19 0.0% 0.0% 0.0% 100% 3 19 100% 0.0% 0.0% 0.0% 5 22 0.0% 100% 0.0% 0.0% 8 20 0.0% 0.0% 100% 0.0%
Reading/ Literature
10 16 0.0% 0.0% 0.0% 100% 5 20 0.0% 100% 0.0% 0.0% 8 20 0.0% 0.0% 100% 0.0% Science 10 16 0.0% 0.0% 0.0% 100%
446

SECTION J
The Bookmark Standard Setting
Procedure: Methodology and Recent Implementations
447

The Bookmark Standard Setting Procedure: Methodology and Recent Implementations
Daniel M. Lewis, Donald Ross Green, Howard C. Mitzel,
Katherine Baum, Richard J. Patz
CTB/McGraw-Hill
Paper presented at the 1998 Annual Meeting of the National Council on Measurement in Education
1. Introduction
Setting performance standards has become commonplace due to the standards-based education reform movement,Title 1 requirements, and public demands for educational accountability. However, standard setting—thedetermination of the cut scores for an assessment used to measure students’ progress towards performancestandards—remains a controversial topic. Recent trends in standards and assessments have presented challenges forstandard setting techniques. First, there is a need for a standard setting procedure that efficiently accommodatesmultiple cut scores. Title 1 requires the demonstration of growth through at least three performance levels—PartiallyProficient, Proficient, and Advanced. Second, there is a need for a standard setting procedure that accommodatesmultiple item types—selected-response (SR) and constructed-response (CR). The development of new standardsetting procedures has been driven in part because the widely used Angoff procedure (Angoff, 1971) does notaccommodate these trends effectively and has been criticized as being seriously flawed (National Academy ofEducation, 1993; Mitzel, 1996).
The Bookmark Standard Setting Procedure (Lewis, Mitzel, and Green, 1996) is an item response theory-based itemmapping procedure developed to address these trends in standards and assessment and to simplify the cognitive tasksrequired of the participants setting the cut scores. This paper presents the methodology used to conduct theBookmark Procedure. Section 2 reviews item response theory (IRT) based standard setting procedures. Section 3describes the Bookmark Procedure in detail. The results of recent implementations of the Bookmark Procedure arepresented in Section 4. The paper closes with a discussion of these results in Section 5 and conclusions in Section 6.
2. Review of IRT-Based Item Mapping Procedures
Item mapping, sometimes referred to as “behavioral anchoring,” has been used for over a decade to help identifywhat students at various scale locations know and are able to do. NAEP (ETS, 1987) used scale anchoring to helpinterpret what students know and are able to do by mapping selected “anchor” points on the scale for the NAEPreading assessment. They selected items that discriminated well according to the criteria, “(a) eighty percent ormore of the students at that [anchor] point could answer the item correctly; (b) less than 50 percent of the students atthe next lower [anchor] point could answer the item correctly…” (ETS, 1987, p. 386). Item mapping, then, refers tothe general approach of mapping items to locations on the IRT scale such that students with scale scores near thelocation of specific items can be inferred to hold the knowledge, skills, and abilities required to respond successfullyto those items. NAEP continued to use scale anchoring to help interpret their results for later assessments, but thediscrimination criteria applied to anchor items was modified.
The 1991 Maryland School Performance Assessment Program (MSPAP) used an item mapping procedure to setproficiency levels (CTB Macmillan/McGraw-Hill, 1992). For this purpose, score points for performance assessmentitems were mapped to the scale at the IRT maximum information location. The proficiency levels were set byidentifying interpretable clusters of item locations on the scale and the items falling within each cluster wereanalyzed by content experts to interpret what students in each proficiency level knew and were able to do.
Both the NAEP anchor points and the 1991 MSPAP proficiency levels were intended to help interpret what studentsat various points on a scale knew and were able to do. Neither was a “true” standard setting procedure in the sensethat no judgments were made concerning what students should know and be able to do; instead, both used itemmapping as a means to interpret what students did know and could do at various scale locations.
448

The Bookmark Standard Setting Procedure 2
NAEP conducted a bona fide standard setting for the 1992 math and reading assessments using a modified Angoffprocedure (Angoff, 1971). An item mapping study was conducted as part of the review of the achievement levelsetting (National Academy of Education, 1993). Content experts evaluated the appropriateness of the cut scores andthe quality of the achievement level descriptions. Item maps, in which items were located at the point where 80% ofstudents in the appropriate grade could answer the items correctly (after allowing for guessing), were provided tofacilitate the evaluation. Although the approach used was not intended as a new or alternative standard settingmethod, several positive features of the item mapping approach were noted and contrasted with the Angoff procedurethat was used to set cut scores. For example, it was noted that participants using the item mapping approach had “...amore systematic understanding of the item pool as a whole than did participants using the Angoff approach (NationalAcademy of Education, 1993, p. 110).”
One drawback of the method was also reported—the lack of clear guidelines for the probability level at which tomap items to the scale. It was noted that the 80-percent-correct level possibly contributed to the experts setting veryhigh cut scores for some of the achievement levels, and that different cut scores would possibly have resulted had a65-percent-correct mapping criterion been used.
An “item matching” procedure was used to set proficiency levels for the 1993 MSPAP (Westat, 1994). Participantsstudied proficiency level descriptions and conceptualized what students at a higher level could do that students at thenext lower level could not do. Initial cut scores were determined by having participants match items to theproficiency level descriptions. For example, to determine the level 2 cut score, participants examined items in orderof scale location and identified the items as “clearly level 1,” “clearly level 2,” or “borderline.” When participantsidentified a “run” of “clearly level 1” items followed by a “run” of “clearly level two” items, the scale locations ofthe items constituting the two runs were used to identify the level 2 cut score. Initial cut scores for higher levels weredetermined in an analogous manner, and final cut scores were determined after several rounds of discussion andconsensus building.
Lewis and Mitzel (1995) developed an “IRT-Modified Angoff Procedure” for which SR items were mapped onto theIRT scale at the location at which a student would have a .5 probability of a correct response, with guessing factoredout. Each positive CR item score point was mapped onto the same IRT scale at the location at which a studentwould have a .5 probability of obtaining at least the given score point. To determine a proficient cut score,participants conceptualized “just barely proficient” students, studied the test items in order of scale location, andclassified each item according to whether a just barely proficient student should have greater than, less than, or equalto a .5 likelihood of success on the item. The cut score was determined by averaging the locations of items thatparticipants classified at the “equal to .5” level.
Under both the Maryland 1993 standard setting procedure (Westat, 1994) and the Lewis and Mitzel (1995)procedure participants could, and did, classify items such that the participants’ classifications were not consistentwith the scale locations. Under the Maryland procedure, participants classified some items with higher scalelocations as being associated with lower proficiency levels than other items with lower scale locations. Under theLewis and Mitzel procedure, participants judged that Proficient students should have greater success on some itemswith higher scale locations than on other items with lower scale locations. This inconsistency might in part beexplained by noting that the scaling of items is based on empirical student performance data, that is, what students doknow and can do, and that participant judgments were based on expected student performance, that is, what studentsshould know and be able to do. However, making judgments based on “what students should know and be able todo” without conditioning those judgments based on “what students do know and can do” can lead to seriousproblems in 1) interpreting the results of the assessments to which standards are applied and 2) assessing studentgrowth relative to content standards. These problems are discussed by Lewis and Green (1997).
In 1995, the Bookmark Standard Setting Procedure was developed and used to set standards for CTB/McGraw-Hill’snew standardized assessment TerraNova� and has been used to set standards in 18 states or districts from 1996 to1998. The Bookmark Procedure evolved from Lewis and Mitzel’s IRT-Modified Angoff Procedure and wasdesigned to remove the inconsistency noted above between participants’ item level judgments and the items’ scalelocations. This was accomplished by moving the level of judgment from the item level to the cut score level, that is,instead of making judgments about each item, participants considered all the items together to make judgments abouteach cut score.
449

The Bookmark Standard Setting Procedure 3
Several aspects of the IRT-Modified Angoff Procedure that were particularly successful were retained in theBookmark Procedure. Most notable are 1) the use of the ordered item booklet to help participants understand howitems work together to measure student achievement relative to specified content standards and 2) the commonframework for interpreting SR and CR items by mapping them to the same scale and at the same probability level.These two components were central to the primary goals of the Bookmark Procedure—to provide a standard settingprocedure that treats SR and CR items in a unified manner and that is based on judgments that ease the cognitiveload on participants by drawing primarily on the participants’ expertise, that is, their understanding of contentstandards, the curriculum, teaching practices, the assessment, and student performance. The fundamental tasksrequired of participants in the Bookmark Procedure are analyzing items to determine what they are measuring andspecifying which items students in the various performance levels should be expected to respond to successfully. Wenext consider the Bookmark Procedure in detail, first providing information about basic assumptions underlying thestructure of the procedure.
3. Basic Assumptions and Overview of The Bookmark Procedure
3.1 Mapping Items to the IRT Scale
Item response theory (IRT, Lord 1980) provides a framework that simultaneously characterizes the proficiency ofexaminees and the difficulty of test items. Each IRT-scaled item has an estimated item characteristic curve (ICC)that describes how the probability of success on the item depends on the proficiency or “scale score” of theexaminee. Just as it is possible to order examinees by estimated proficiency, IRT enables items to be ordered by theproficiency needed to have a specified probability of success. The facility to order items on the IRT proficiencyscale is fundamental to the Bookmark Procedure.
Selected-response (SR) items can be scaled under a variety of models, for example, the Rasch (1960) model, or the2- and 3-parameter logistic models (Birnbaum, 1968). Constructed-response (CR) items can be scaled usingpolytomous models, for example, the 2-parameter or generalized partial credit model (Yen, 1993; Muraki, 1992).The 3-parameter logistic (3PL) model and the 2-parameter partial credit (2PPC) model are the default models usedby CTB for SR and CR items, respectively.
Scaling SR and CR items together brings significant advantages to the standard setting process, most importantly, theability to order the CR score points with the SR items. This joint scaling allows participants to consider all items onwhich the standard is to be set, regardless of item format, and to directly set a single cut score for each performancelevel. The joint scaling of CR and SR items can be accomplished using commercially available computer programs(e.g., PARDUX, Burket, 1996; PARSCALE, Muraki & Bock, 1991).
For the purpose of standard setting, SR and CR items are located on the IRT scale such that the location of each itemtype is directly interpretable and conceptually similar.
Selected-Response Items. The location of an SR item is defined as the point on the ability scale at which a studentwould have a .67 (2/3) probability of success, with guessing factored out. We remove consideration of guessing as afactor because participants are asked to make complex judgments about what students should know and be able todo, and the consideration of guessing unnecessarily complicates those judgments. We also note that this approachwas used for the item mapping studies that followed the 1992 NAEP achievement level setting (National Academy ofEducation, 1993).
For the 3PL model, the probability that a student with trait or scale score θ will respond correctly to SR item j isgiven by
P c c a bj j j j j( ) ( ) / [ exp( . ( ))].θ θ= + − + − −1 1 17where a j is the item discrimination, bj is the item difficulty, and c j is the probability of a correct response by avery low-scoring student. We estimate the probability, Pj
*, of a correct response with guessing removed using theformula
).1/())(()(*jjjj ccPP −−= θθ
450

The Bookmark Standard Setting Procedure 4
The location of SR item j is θ, such that Pj* (θ) = .67.
Constructed-Response Items. Each CR score point has a unique location on the scale. The location of a given CRscore point is defined as the position on the ability scale for which students have a .67 probability of achieving atleast that score point, that is, that score point or higher. This criteria was selected so that the location of the CRscore point could be interpreted in a manner similar to the location of a SR item and in a way that is conceptuallyuseful to the participants in setting the cut score.
Using the 2PPC model for CR items, the probability that a student with trait or scale score θ will respond at scorelevel k to CR item j is given by
,)exp(/)exp()(1�
=
=jm
ijijkjk zzP θ
where �−
=
−−=1
0)1(
k
ijijjk kz γα , αj and γji , i = 1, 2, …mj-1, are the parameters estimated during calibration,
00 =jγ for all j, and mj is the number of levels for item j.
For the purpose of standard setting, the location of score point k for constructed response item j, is the scale score θ,such that Pjk
*(θ) = .67, where
Pjk*(θ) = �
=
jm
kijkP )(θ .
Although the selection of .67 as the probability level used to map items to the scale is somewhat arbitrary, this valuewas not selected capriciously. First, because the probability level must be considered by the participants whenmaking their judgments, a familiar value was desired. That is, using a probability level of .5823 would not be useful,but values such as .5 (1/2), .67 (2/3), or .75 (3/4) would be. Second, other item mapping procedures and researchhave provided some precedent. Huynh (1998) showed that for the 3PL model, the item information function ismaximized at θ for which P(θ) = (c + 2)/3. This corresponds to the value of 2/3 when guessing is factored out.Thus, the choice of 2/3 for mapping SR items corresponds to the maximum information location. Huynh states thatthe maximum information location associated with a correct response “…might serve as a signal that an examineelocated at this place would be ‘expected’ to have the skills underlying the item.”
3.2 Bookmark Standard Setting Materials
Many of the materials used for Bookmark Standard Settings are commonly used within other standard settingprocedures, such as operational test booklets, student exemplar papers, and scoring guides. The following materialsare unique to Bookmark Standard Settings and other item mapping procedures.
Ordered Item Booklets. Ordered item booklets are typically assembled using all items on which the standards are tobe based, in order of scale location. The ordered item booklet focuses the participants’ attention on one item perpage, with the “easiest” item (lowest scale location) first and the “hardest” item (highest scale location) last. Thepurpose of the ordered item booklets is to help participants’ foster an integrated conceptualization of what the testmeasures, as well as to serve as a vehicle to make cut score judgments. Studying the items one by one, from easiestto hardest, discussing what each item measures and why each item is more difficult than items that precede it in thebook, is intended to provide participants with an understanding of how the trait increases in complexity as the itemsascend the scale, and of the knowledge, skills, and abilities students must hold in order to respond successfully toitems.
The items used in the ordered item booklets can be items from single or multiple forms of an operational test oritems on a common scale from an item pool that is representative in content and difficulty of a single form of theoperational test. The use of items beyond those of a single operational form is recommended when possible, toincrease the generalizability of the standards to other forms to which the standards may be applied in future years.
451

The Bookmark Standard Setting Procedure 5
Item Map Rating Forms. The item map rating form is a guide to the ordered item booklet, and lists all itemsascending by location, that is, in the same order in which they appear in the ordered item booklets. Associated iteminformation is also included on the item map rating form, such as the items’ scale location, item number in theoperational or field test booklet, the standard or objective the item was written to measure, space for the participantsto make notes about the items, and the cut score judgments they are considering for each round.
3.3 Determining Cut Scores Under the Bookmark Procedure
The cut score for a given performance level, for example, Proficient, can be identified by a bookmark placedbetween two items in the ordered item booklet such that from the judge’s perspective, the items preceding thebookmark represent content that all proficient students should be expected to know and be able to do (with at least a2/3 likelihood of knowing the correct response for SR items or of obtaining at least the given score point for CR itemscore points). By placing the bookmark at the furthest most item for which this is true, a location on the ability scalecan be estimated as the cut score. This is computed as the scale location of the item that appears immediately prior tothe bookmark. Judgments are made at the cut score level, that is, participants consider all the items when they placetheir bookmarks, but the bookmarks define cut scores.
To set two cut scores defining three performance levels, for example, Partially Proficient, Proficient, and Advanced,each judge considers the items in the ordered booklet and places two bookmarks that define the two cut scores. Theitems that precede the first bookmark should represent content that all proficient students are expected to know andbe able to do. The items that precede the second bookmark should represent content that all advanced students areexpected to know and be able to do.
When an item precedes a judge’s bookmark, the judge is stating that all proficient students should have abilitysufficient to have at least a 2/3 likelihood of responding correctly to the SR item or of obtaining at least that scorepoint for a CR item score point. This probability level is held only by students with scale ability locations as high orhigher than the scale location of the item. Thus, all proficient students must have ability level at least as high as thescale location of each item before the bookmark. On the other hand, when an item falls after the bookmark, the judgeis stating that a student could be classified as proficient, yet have less than a 2/3 likelihood of success on the item.This means that a student could have ability lower than the location of the first item after the bookmark and still beclassified as proficient. Thus, the proficient cut score is at least the location of the item immediately prior to thebookmark but less than the location of the item following the bookmark. The location of the item immediately priorto the bookmark is used as the operational cut score.
3.4 Writing Performance Level Descriptors
Performance level descriptors are intended to be valid descriptions of the knowledge, skills, and abilities held bystudents that place in the various performance levels. Performance level descriptors emerge as an outcome of settingcut scores under the Bookmark Procedure. For example, suppose two cut scores are set defining the threeperformance levels Partially Proficient, Proficient, and Advanced. Items prior to the Proficient bookmark reflectcontent that all Proficient students are expected to know and be able to do, and therefore, the knowledge, skills, andabilities required to respond successfully to these items are synthesized to form descriptors of the Proficient student.Similarly, the items following the Proficient bookmark and prior to the Advanced bookmark are used to yielddescriptors of the additional knowledge, skills, and abilities a student must hold to be considered Advanced.
The estimated probability of a successful response for a student in a given performance level is at least .2/3 for theitems used to write the performance level descriptors. Thus, descriptors written with this approach are valid to thedegree that participants can communicate the knowledge, skills, and abilities required to successfully complete theitems attributed to the respective performance levels. Of course, because they are based on probabilities, not everystudent will have mastered all the skills attributed to them by the descriptors. The validity of performance leveldescriptors written in this manner is discussed more fully by Lewis and Green (1997).
452

The Bookmark Standard Setting Procedure 6
3.5 Bookmark Standard Setting Panel Composition and the Use of Multiple Panels
Operationally, the composition of a standard setting panel results from the sponsoring agency’s selection criteria andavailability of participants. We recommend at least 18 participants per panel. The panel of participants for a givengrade and content area are typically divided into three small groups. One participant within each small group ispredesignated to act as a small group facilitator for the process, and receives training prior to the standard setting.Small-group facilitators are selected from the pool of participants based on experience with the students, curriculum,instruction, assessment, and the ability to facilitate groups. The small-group facilitators are voting members of theirsmall group. The sponsoring agency makes recommendations for the assignment of participants to small groups suchthat the three small groups are roughly balanced in terms of the educational background and geographic location ofthe participants. The use of small groups facilitates having all participants actively involved in the discussion ofitems and expectations for student performance. A Bookmark standard setting is typically facilitated by a singlelarge group leader who is responsible for monitoring the process for a given grade and content area and the smallgroup facilitators who monitor the process within their small groups.
The use of multiple small groups is integrated into the structure of the judgment process. Prior to the first round ofjudgments, participants study the ordered item booklets within their small groups, and discuss what each itemmeasures and why each item is more difficult than the preceding items in the booklet. Following discussion,participants make individual and independent Round 1 judgments, that is they place bookmarks that indicate theitems that reflect content they expect students in each performance level to know and be able to do.
In Round 2, each small group discusses the items for which there was not consensus according to the small group’sRound 1 judgments. For a given performance level, these are the items in the ordered item booklet between the firstand last of the small group participants’ bookmarks. This appropriately narrows the discussion only to the items forwhich participants have differing opinions relative to expected student performance for a given performance level.Following discussion, Round 1 judgments may be modified with Round 2 judgments.
Prior to Round 3, a small-group judgment is computed for each small group as the median of the small group’sbookmark placements. In Round 3, the large group is presented with each small group’s Round 2 judgments and theestimated percent of students in each performance level based on the current large group median. The large groupdiscusses the reasonableness of the impact data and the items for which their was not consensus among the smallgroups. Following discussion, Round 2 judgments may be modified with Round 3 judgments.
The Bookmark Procedure is structured so that each small group works independently of the other small groups untilthe third round. The standard error estimated from each small groups’ independent Round 2 results provides ameasure of the stability of the cut scores, as discussed in the next section.
3.6 Capturing and Communicating Degrees of Consensus
The Bookmark Standard Setting Procedure is a collaborative enterprise that fosters consensus among participants asto the standards to which we hold our students accountable. However, consensus is not forced. In the resultsdiscussed in Section 4, varying degrees of consensus were attained. It is important that the degree of consensus bemeasured and reported with the recommended cut scores to the governing bodies who make final cut score decisions.
The degree of consensus is quantified by calculating a standard error for each cut score arrived at through themultiple-group, three-round process. Because the small groups act independently through the first two rounds, anappropriate standard error can be calculated by treating individual Round 2 scores as if sampled from independentclusters. Formulas for the cluster sample standard error (Cochran, 1963, p. 210) are presented in Appendix 1.
Data arising in standard setting contexts have complex dependency structures and reflect many sources of error. It isimportant to appreciate this complexity and avoid making strong conclusions based on statistical procedures whoseassumptions can not be satisfied. In Bookmark standard settings we use appropriately general statistics such as thecluster sample standard error, as well as graphics to help inform these judgments.
453

The Bookmark Standard Setting Procedure 7
4. Recent Implementations of the Bookmark Procedure
4.1 Background
Table 1 summarizes the grades, content areas, test scales, test formats, and numbers of participants associated withfour state and one district Bookmark standard settings facilitated by CTB in 1996 and 1997. A total of twenty panelsset cut scores in grades ranging from 3 to 10 in Reading, Language Arts, and Mathematics.
For thirteen of the twenty grade/content areas, the ordered item booklets used to set cut scores included more itemsthan were on the operational test forms. As Table 1 indicates, the operational test forms had an average of 67 scorepoints and the ordered item booklets used to set cut scores had an average of 111 score points. The operational testswere all composed of a mixture of SR and CR items with an average of 76 percent SR items and 24 percent CRitems. On average 59 percent of the total score points were from SR items and 41 percent were from CR items. Theordered item booklets used to set standards had an average of 73 percent SR items and 27 percent CR items. Onaverage, 54 percent of the total score points in the ordered item booklets were from SR items and 46 percent werefrom CR items.
Table 1 also shows the number of cut scores, number of small groups, and total number of judges per grade/contentarea.
4.2 An Illustrative Example
Figures 1-4 illustrate the Bookmark Standard Setting Procedure for an example selected from the recentimplementations. In this case, three cut scores were set for a Grade 8 Language Arts assessment. Figures 1, 2, and 3show the individual participants’ Proficient cut score ratings for Small Groups 1, 2, and 3, respectively. The verticalaxes indicate the test scale referenced to a mean of 0 and standard deviation of 1. The horizontal axes indicate theround (1, 2, or 3).
Figure 1 shows the Proficient cut score ratings for the four participants in Small Group 1. Note that there is areasonable amount of variability in the first round, with Group 1 participants’ cut scores ranging from .05 to .44 onthe scale. The observed variability reflects the fact that in the first round, participants make individual andindependent judgments.
In the second round, the small group participants discuss and debate the rationale and perspective that lead to each oftheir Round 1 judgments. This tends to decrease the variability within each small group. In the case of Group 1(Figure 1), a high degree of consensus has been reached in Round 2, with participants’ cut scores ranging from .41 to.44 on the scale. Three of the four Group 1 participants raised their cut scores, apparently strongly influenced by thefourth participant’s perspective.
In the third round, small-group cut scores are computed for each small group (based on small-group medians). Eachsmall group presents the rationale and perspective that lead to their Round 2 judgments, and impact data is presented.In the example indicated in Figure 1, all participants in Group 1 maintained their Round 2 judgments in Round 3.This was probably due to the fact that Small Groups 2 and 3 both made Round 2 judgments that were very similar tothose of Small Group 1, as can be observed in Figures 2 and 3.
Figures 2 and 3 illustrate the three rounds of judgments for Small Groups 2 and 3, respectively. Figure 2 indicatesthat Group 2 made judgments for each round that were very similar to those of Group 1. Figure 3 shows a differentpattern of ratings for Small Group 3. There is a reasonable amount of variability in the Round 1 ratings for SmallGroup 3, with the five participants’ cut scores ranging from .31 to .61. In the second round, we see the results ofconsensus building, however in this case, the participants tended toward the group’s median cut score. The range ofthe participants’ cut scores (.41 to .46) has decreased considerably from that of Round 1. In the third round, SmallGroup 3 reached consensus, with all five participants rating the Proficient cut score at .44.
Figure 4 illustrates the judgments for all participants, by round, for all three cut scores (Partially Proficient,Proficient, and Advanced). The middle set of lines indicate the Proficient judgments examined in Figures 1-3. Itcan easily be seen that in Round 2, each of the three groups independently arrived at the same median cut score(.44). However, this does not occur routinely. The reader need only look at the patterns for the Advanced andPartially Proficient cut scores to observe that although Round 2 does typically bring a degree of consensus, it is notas uniform for these cut scores as for the Proficient cut score.
454

The Bookmark Standard Setting Procedure 8
Also depicted in Figure 4 are confidence bands centered at the Round 3 median cut score with a width of two Round2 standard errors. The Round 3 median best captures the consensus cut score from the entire Bookmark Procedure.Round 2 standard errors are used to quantify the degree of consensus obtained across independent groups, asdiscussed in Section 3.6 Capturing and Communicating Degrees of Consensus. The type of information exemplifiedin Figure 4, is valuable to decision makers who must act on the recommendations of the standard setting panels. Inthe example depicted in Figure 4, the participants’ recommended cut scores were adopted by the sponsoring agency.
4.3 Results
The results for the proficient cut score by round for each of the 20 examples are located in Table 2 (Summary datafor all performance level cut scores are provided in Tables 3 and 4.). All statistics that are derived from theparticipants cut score judgments are presented in standardized units, that is, referenced to the standard deviation unitsof the scale. This allows statistics across scales to be compared.
The column labeled “Range (Cut)” indicates the magnitude of the range of the participants’ scale score cut scores foreach round and each cut score in scale standard deviation units (computed as the difference between the maximumand minimum of the participants’ cut scores divided by the scale standard deviation). The column “SD (Cut)”indicates the standard deviation of the participants’ scale score cut scores for each round in scale standard deviationunits.
The columns labeled “Intra Class Corr” [Intraclass Correlations] and “Round 2 SE (Cut)” [standard errors] provideinformation about the replicability of the participants’ judgments across groups. These are explained in detail inAppendix 1. The standard error is reported in scale standard deviation units.
Table 3 presents the mean SD of the participants’ cut score judgments for each cut score and round (in standardizedunits), as well as the standard deviation, minimum, and maximum of these standard deviations. For the Advancedcut scores, the mean SDs decreased from .35 (Round 1) to .16 (Round 2) to .15 (Round 3). For the Proficient cutscores, the mean standard deviations decreased from .32 (Round 1) to .14 (Rounds 2 and 3). For the PartiallyProficient cut scores, the mean standard deviations decreased from .27 (Round 1) to .16 (Round 2) to .13 (Round 3).
Table 3 also presents the mean Round 2 standard errors and intraclass correlations of the participants’ cut scorejudgments for each cut score. The mean Round 2 standard errors are .07, .08, and .07, and the mean Round 2intraclass correlations are .67, .69, and .70 for the Advanced, Proficient, and Partially Proficient cut scores,respectively.
Table 4 presents the mean difference in median cut scores between successive rounds, as well as the standarddeviation, minimum, and maximum of the mean differences. The mean differences between the median Round 2 andRound 1 cut scores were .22, .16, and .10, for the Advanced, Proficient, and Partially proficient cut scores,respectively. The mean differences between the median Round 3 and Round 2 cut scores were .04, .00, and .04, forthe Advanced, Proficient, and Partially Proficient cut scores, respectively.
5. Discussion
As would be expected in a consensus building process, the variability of participants’ judgments tended to decreasein successive rounds for each cut score. The magnitude of the variability was similar for the three performancelevels in each round. This is indicated by the mean standard deviations (Table 3) for the Advanced, Proficient, andPartially Proficient cut scores of .35, .32, and .27, respectively, in Round 1; .16, .14, and .16, respectively in Round2; and .15, .14, and .13, respectively, in Round 3. This suggests a consistency in the degree to which participants areable to translate their qualitative conceptualizations of each performance level operationally into expectedperformance on test items. The ability for participants to be able to clearly conceptualize the knowledge, skills, andabilities of students within each performance level is fundamental to any standard setting process. These resultsindicate that participants seem to be able to do so to a similar degree for three performance levels. This may nothold when there are more than three performance levels.
A pattern of decreasing variability in participants’ judgments from each round to the next is also consistent for thethree performance levels. The mean standard deviations decreased from .35 (Round 1) to .16 (Round 2) to .15(Round 3) for the Advanced performance level; from .32 to .14 to .14 for the Proficient performance level; and from.27 to .16 to .13 for the Partially Proficient performance level. A considerable reduction in variability occurs from
455

The Bookmark Standard Setting Procedure 9
Round 1 to Round 2, but there is only a nominal reduction from Round 2 to Round 3. This indicates that theparticipants perspectives change considerably from the interactions within their small groups during Round 2, but donot change as much from the interactions between the small groups or the consideration of impact data in Round 3.This is desirable from the perspective that participants should feel more confident of their judgments with eachround, and therefore, should be less likely to modify their judgments in subsequent rounds. However, the resultsmay not only reflect an increase in confidence in participants’ judgments, but also the support of other memberswithin the small group to maintain their judgments in spite of differences between the small groups.
The mean standard errors computed from Round 2 provide an estimate of the variability of the cut scores acrosspanels. The mean standard errors of .07, .08, and .07 for the Advanced, Proficient, and Partially Proficient cutscores are of similar magnitude to those reported for Math and Reading in the NAEP 1992 standard setting (ACT,1993). It is important to remember that these are estimated from the small groups’ independent Round 2 results.
The mean Round 2 intraclass correlations of .67, .69, and .70 for the Advanced, Proficient, and Partially Proficientcut scores, respectively, indicate that an appropriate degree of within-group consensus occurred in Round 2, and thatindividual judgments should not be treated as independent once group discussions have taken place.
Several conclusions can be drawn from looking at the mean differences between the median of the participants’ cutscores between Rounds 2 and 1 and between Rounds 3 and 2. The mean differences in medians between Rounds 2and 1 of .22, .16, and .10, for the Advanced, Proficient, and Partially Proficient cut scores, respectively, indicate thatparticipants’ cut scores tend to rise considerably from Round 1 to Round 2. This is somewhat surprising, as onemight expect participants’ judgments to tend toward the median, but leave the median relatively unchanged. The risemay be attributable to social pressure for high standards. For example, suppose one participant enters Round 2having placed his/her bookmark in the ordered item booklet at say, page 50, and a second participant has placedhis/her bookmark on page 60. In Round 2, the participants discuss items 50-59 in terms of whether a student shouldbe expected to master these items to be considered proficient. It may be that under these circumstances, apsychological advantage exists for “higher standards.” It is interesting to note that the increase in median cut scoresfrom Round 1 to Round 2 is greatest for the Advanced cut score, and the least for the Partially Proficient cut score.Thus, the increase is positively correlated with the performance level, suggesting that this social pressure is greatestwhen the standards are expected to be highest.
The mean differences between the median of the participants’ cut scores between Round 3 and Round 2 are .04, .00,and .04, for the Advanced, Proficient, and Partially Proficient cut scores, respectively. Thus, the increase in mediancut scores from Round 2 to Round 3 tends not to be large. This must be considered in light of the two new pieces ofinformation that are provided to participants in the third round. First, the participants view and discuss the resultsfrom the other small groups. Second, the participants discuss impact data associated with the median cut scorecomputed from all participants’ bookmarks. The results indicate that although these factors can affect participantsjudgments, they are not systematic. Again, it seems that by Round 3, participants are well grounded in theirjudgments.
6. Conclusions
In sum, the results indicate that the participants are making judgments as would be expected and desired, given thestructure of the Bookmark Procedure. The patterns of variability are particularly encouraging. The highestvariability occurs in the first round, when participants make independent ratings, and decreases significantly fromRound 1 to Round 2, but does not decrease significantly from Round 2 to Round 3. This indicates that participantslisten to each others’ perspectives and in many cases find the arguments persuasive and therefore modify theirjudgments in Round 2. The stability of the small group median scores from Round 2 to Round 3 suggest thatparticipants have developed a stable perspective by the third round. They do not react strongly to the newinformation provided in the third and final round as they did to that of the second round.
Setting standards is a complex process involving educational, psychological, statistical, and ultimately, politicalconsiderations. We have observed that the Bookmark Procedure facilitates the standard setting process by providinga framework through which informed educators come to understand how a particular test measures the skills thestudents are expected to master, and by providing a structure that fosters rational consensus building regardingexpected student performance. Participants judgments are based on well defined criteria—which items students beexpected to respond successfully to be classified in the various performance levels.
456

The Bookmark Standard Setting Procedure 10
Further studies are required to determine the degree to which cut scores arrived at through the Bookmark Procedureare consistent with other measures of student proficiency such as teacher judgment or cut scores set concurrentlywith other procedures. There is no “gold standard” for cut scores or standard setting procedures. Research hasshown that different standard setting procedures will likely lead to somewhat different cut scores (National Academyof Education, 1993). However, several aspects of the Bookmark Procedure have lead CTB to make it their defaultstandard setting method.
First, participants leave the Bookmark Standard Setting with a strong understanding of what their final cut scoresmean in terms of expected student performance for each performance level, as measured by the assessment. Thisunderstanding is fostered by the use of the ordered item booklets and the structure provided by item mappingprocedures in general. Observations during the item mapping studies that followed the 1992 NAEP standard settinghave also been observed following each Bookmark standard setting:
“...the experts or judges using the item-mapping approach had a much more direct understanding of thecontinuum for which they were attempting to devise levels...by engaging in discussions and studying the itemmaps, participants had a more systematic understanding of the item pool as a whole than did participants usingthe Angoff approach.... (National Academy of Education, 1993, p. 110).”
Second, Bookmark Standard Setting participants are able to translate this “understanding” to communicate whatstudents in each performance level know and are able to do by writing performance level descriptors based onempirical data. Teachers, parents, and students are able to use the performance level descriptors to understand thelevel of achievement required for students to place in each performance level. The sponsoring agency and the publiccan use the performance level descriptors and the percent of students in each performance level to better understandthe current state of student achievement relative to the standards.
Third, Bookmark Standard Setting participants frequently comment on how instruction would improve if everyteacher could go through a similar process. Their comments suggest that they have a unique awareness of how theassessment relates to the content standards, curriculum, and instruction. CTB is currently experimenting withmethods of capturing the participants’ perspectives to provide information to the sponsoring agency that mayimprove the alignment of content standards, curriculum, instruction, and assessment. This topic is more fullydiscussed in Lewis and Green (1998).
TerraNova is a registered trademark of The McGraw-Hill Companies, Inc.
Send requests for information to: Daniel M. Lewis
Research Department
CTB/McGraw-Hill
Monterey, CA 93940
457

The Bookmark Standard Setting Procedure 11
References
ACT (1993). Setting achievement levels on the 1992 National Assessment of Educational Progress inMathematics, Reading, and Writing: A technical report on reliability and validity.
Angoff, W. H. (1971). Scales, norms, and equivalent scores. In R. L. Thorndike (Ed.), Educationalmeasurement (pp. 508-600). Washington, DC: American Council on Education.
Birnbaum, A. (1968). Some latent trait models and their use in inferring an examinee’s ability. In F. M. Lordand M. R. Novick (Eds.), Statistical theories of mental test scores (pp. 395-479). Reading, MA: Addison-Wesley.
ETS. (1987). The NAEP 1983-84 Technical Report. Princeton, NJ: Educational Testing Service.
Burket, G. R. (1996). PARDUX [Computer program]. Monterey, CA: CTB/McGraw-Hill.
Cochran, W. G. (1963). Sampling techniques. New York: John Wiley & Sons.
CTB Macmillan/McGraw-Hill. (1992). Final technical report: Maryland School Performance AssessmentProgram, 1991. (Available from the Maryland State Department of Education, Baltimore, MD)
Huynh, H. (1998). On score locations of binary and partial credit items and their applications to item mappingand criterion-referenced interpretation. Journal of Educational and Behavioral Statistics, 23, 37-58.
Lewis, D. M., & Mitzel, H. C. (September 1995). An item response theory based standard setting procedure. InD. R. Green (Chair), Some uses of item response theory in standard setting. Symposium presented at the annualmeeting of the California Educational Research Association, Lake Tahoe, NV.
Lewis, D. M., Mitzel, H. C., & Green, D. R. (June 1996). Standard setting: A Bookmark approach. In D. R.Green (Chair), IRT-based standard setting procedures utilizing behavioral anchoring. Symposium presented at theCouncil of Chief State School Officers National Conference on Large-Scale Assessment, Phoenix, AZ.
Lewis, D. M., & Green, D. R. (June 1997). The validity of performance level descriptors. Paper presented at theCouncil of Chief State School Officers National Conference on Large-Scale Assessment, Phoenix, AZ.
Lewis, D. M., & Green, D. R. (June 1998). Assessing the state of the standards: Linking content standard,curriculum & instruction, and assessment. Paper presented at the Council of Chief State School Officers NationalConference on Large-Scale Assessment, Colorado Spring, CO.
Lord, F. M. (1980). Applications of item response theory to practical testing problems. New York: Erlbaum.
Mitzel, H. C. (1996). Standard setting as a judgment task. In D. R. Green (Chair), IRT-based standard settingprocedures utilizing behavioral anchoring. Symposium presented at the Council of Chief State School OfficersNational Conference on Large-Scale Assessment, Phoenix, AZ.
Muraki, E. (1992). A generalized partial credit model: Application of an EM algorithm. Applied PsychologicalMeasurement, 16, 159-176.
Muraki, E., & Bock, R. D. (1991). PARSCALE: Parameter scaling of rating data [Computer program].Chicago: Scientific Software, Inc.
National Academy of Education. (1993). Setting performance standards for student achievement. Stanford:Author.
Rasch, G. (1960). Probabilistic models for some intelligence and attainment tests. Copenhagen: Danish Institutefor Educational Research.
Westat. (1994). Establishing proficiency levels and descriptions for the 1993 Maryland School PerformanceAssessment Program (MSPAP). Technical Report. Rockville, MD.
Yen, W. M. (1993). Scaling performance assessments: Strategies for managing local independence. Journal ofEducational Measurement, 30, 187-213.
458

The Bookmark Standard Setting Procedure 12
Appendix 1
Calculating a Meaningful Standard Error for the Bookmark Cut Score
In the Bookmark Standard Setting Procedure for a given grade and content area, participants are assigned to roughlyequivalent small groups that work independently through Round 2. Thus, the set of Round 2 cut scores providesome information about the stability of consensus in Bookmark cut scores across independent small groupreplications. To quantify this degree of consensus, we calculate the cluster sample standard error (Cochran, 1963, p.210) of the Round 2 mean cut score. Cluster sample standard errors are appropriate when, as may be reasonablyassumed here, data are collected from groups and independence can be assumed between groups but not withingroups.
For the Bookmark Procedure, the standard error of the Bookmark cut score (SEcut) is given by the cluster samplestandard error of the Round 2 mean cut score:
( )[ ]rnNSSEcut 11
2
−+= ,
where S2 is the sample variance of individual Round 2 cut scores, r is the Round 2 intraclass correlation, N is the
number of participants, and n is the number of groups. To be precise, if ikY is the cut score from the ith participant
in the kth group, kY is the average cut score for group k, and Y is the average of all Round 2 cut scores, then
)()()(
kikk
k
YYVarYVarYVarr
−+= and ( )S
NY Ynk
n k
22
11
=−
−�,
If we have only two groups (n=2) and perfect dependence (agreement) within groups (r=1), then the cluster samplestandard error simplifies to 2/21 YYSEcut −= , which is the standard error formula employed by NAEP for two
independent replications of a modified Angoff procedure (ACT, 1983, pp. 4-8). If, on the other hand, individualparticipants acted independently of their groups (r=0), then the cluster sample standard error simplifies to the
traditional standard error of the mean for independent observations, NSSEcut
2= . In this manner, SEcut
provides a simple, flexible, and general way to quantify the amount of uncertainty associated with final Bookmarkcut scores.
It is appropriate (if statistically imprecise) to say that repeated replications of this very standard setting procedurewith different judges sampled from the same population of potential judges would result in a range of cut scores,most of which would fall in a band of width 4* SEcut. In Figures 1-4 we depict such an interval centered at themedian of the Round 3 cut score. The purpose of calculating statistics like SEcut and producing graphs of the typesdisplayed here is to effectively communicate the complex information that is gathered during a Bookmark StandardSetting Procedure.
459

Tabl
e 1.
Bac
kgro
und
Info
rmat
ion
for R
ecen
t Im
plem
enta
tions
Ope
ratio
nal T
est
Ord
ered
Item
Boo
klet
Gra
deC
onte
nt
Are
a#
of S
R
Item
s#
of C
R
Item
s
Tota
l Sc
ore
Poin
ts
# of
SR
Ite
ms
# of
CR
Ite
ms
Tota
l Sc
ore
Poin
ts
# of
C
ut
Poin
ts
# of
Sm
all
Gro
ups
# of
Jud
ges
per S
mal
l G
roup
Tota
l # o
f Ju
dges
3 R
eadi
ng
30
13
51
74
18
104
3 2
4
8
Lang
uage
20
4
31
56
10
83
3 1
6
6
Mat
h 30
8
48
96
16
132
3 2
4-5
9
6 R
eadi
ng
31
9 55
98
23
15
9 3
2 4-
5
9La
ngua
ge
24
5 43
67
12
11
4 3
1 6
6M
ath
31
11
58
95
33
176
3 1
8
8
8 R
eadi
ng
34
6 51
67
12
98
3
2 6
12La
ngua
ge
21
5 41
43
12
88
3
3 4-
5
14M
ath
31
10
54
63
20
116
3 2
5-6
11
4 R
eadi
ng
46
21
95
46
21
95
3 3
6-7
19
4 W
ritin
g 32
13
59
42
34
11
2 3
3 6-
7
20
4 M
ath
32
23
77
31
62
146
4 6
6-8
42
8 M
ath
31
20
73
31
56
145
4 7
5-6
39
10
Mat
h 25
19
73
25
43
13
3 4
8 4-
5
35
3 E
LA
46
2 55
46
2
55
1 3
6
18
6 E
LA
55
13
87
55
13
87
1 3
6-7
20
8 E
LA
72
18
113
72
18
113
1 3
5-6
17
10
ELA
69
11
10
0 69
11
10
0 1
3 6
18
10
ELA
67
13
98
67
13
98
1
4 6-
7
25
10M
ath
5922
7459
2274
14
6
24
Not
e. E
LA =
Eng
lish/
Lang
uage
Arts
, SR
= s
elec
ted
resp
onse
, CR
= c
onst
ruct
ed re
spon
se.
460

Table 2. Results
GradeContent
Area Cut Round Range (Cut)*SD
(Cut)*Intra Class
CorrRound 2 SE
(Cut)*3 Reading Proficient 1 0.45 0.15
2 0.53 0.25 0.96 0.17 3 0.31 0.11
3 Language Proficient 1 0.29 0.112 0.19 0.07 NA NA3 0.00 0.00
3 Math Proficient 1 1.09 0.372 0.24 0.08 0.37 0.04 3 0.00 0.00
6 Reading Proficient 1 0.72 0.262 0.05 0.02 0.50 0.01 3 0.00 0.00
6 Language Proficient 1 0.41 0.162 0.27 0.11 NA NA3 0.27 0.11
6 Math Proficient 1 1.32 0.362 0.67 0.19 NA NA3 0.00 0.00
8 Reading Proficient 1 0.55 0.132 0.11 0.03 0.70 0.02 3 0.00 0.00
8 Language Proficient 1 0.56 0.182 0.05 0.01 0.09 0.00 3 0.05 0.01
8 Math Proficient 1 0.89 0.232 0.38 0.15 0.81 0.10 3 0.28 0.13
4 Reading Proficient 1 0.97 0.252 0.32 0.13 0.72 0.06 3 2.07 0.56
4 Writing Proficient 1 1.52 0.692 0.51 0.12 0.16 0.04 3 2.13 0.55
4 Math Proficient 1 2.52 0.522 1.07 0.25 0.63 0.08 3 1.05 0.20
8 Math Proficient 1 2.37 0.442 1.32 0.24 0.65 0.08 3 1.32 0.24
10 Math Proficient 1 1.33 0.282 0.29 0.08 0.73 0.02 3 0.42 0.10
3 ELA** Proficient 1 0.89 0.252 0.12 0.06 1.00 0.03 3 0.10 0.02
6 ELA Proficient 1 1.53 0.292 0.18 0.08 1.00 0.05 3 0.17 0.07
8 ELA Proficient 1 2.66 0.562 0.59 0.23 0.94 0.14 3 0.09 0.02
10 ELA Proficient 1 1.45 0.432 1.13 0.43 0.98 0.25 3 1.05 0.34
10 ELA Proficient 1 1.74 0.412 1.06 0.19 0.60 0.083 1.04 0.18
10 Math Proficient 1 1.54 0.342 0.60 0.17 0.41 0.063 0.58 0.17
* Values are in scale standard deviation units. ** ELA = English/Language Arts.
461

Table 3. Summary Statistics: Meaure of Variability in Participants' Cut Score Judgments
Standardized Standard Deviation Standardized Standard Error Intra Class Correlation
Mean SD Min Max Mean SD Min Max Mean SD Min Max
Advanced
Round 1 0.35 0.16 0.17 0.73
Round 2 0.16 0.12 0.02 0.46 0.07 0.05 0.02 0.15 0.67 0.20 0.37 0.99
Round 3 0.15 0.15 0.00 0.51
Proficient
Round 1 0.32 0.16 0.11 0.69
Round 2 0.14 0.10 0.01 0.43 0.08 0.07 0.00 0.25 0.69 0.27 0.09 1.00
Round 3 0.14 0.17 0.00 0.56Partially Proficient
Round 1 0.27 0.20 0.05 0.68
Round 2 0.16 0.14 0.03 0.53 0.07 0.04 0.03 0.13 0.70 0.30 0.11 1.00
Round 3 0.13 0.10 0.00 0.28
462

Table 4. Summary Statistics: Difference Between Successive Round Medians
Round 2 - Round 1 Round 3 - Round 2
Mean SD Min Max Mean SD Min Max
Advanced 0.22 0.26 -0.16 0.78 0.04 0.15 -0.11 0.52
Proficient 0.16 0.23 -0.13 0.81 0.00 0.22 -0.73 0.24Partially Proficient 0.10 0.20 -0.11 0.66 0.04 0.16 -0.14 0.55
Note. Standardized scale score units are used.
463

464

465

466
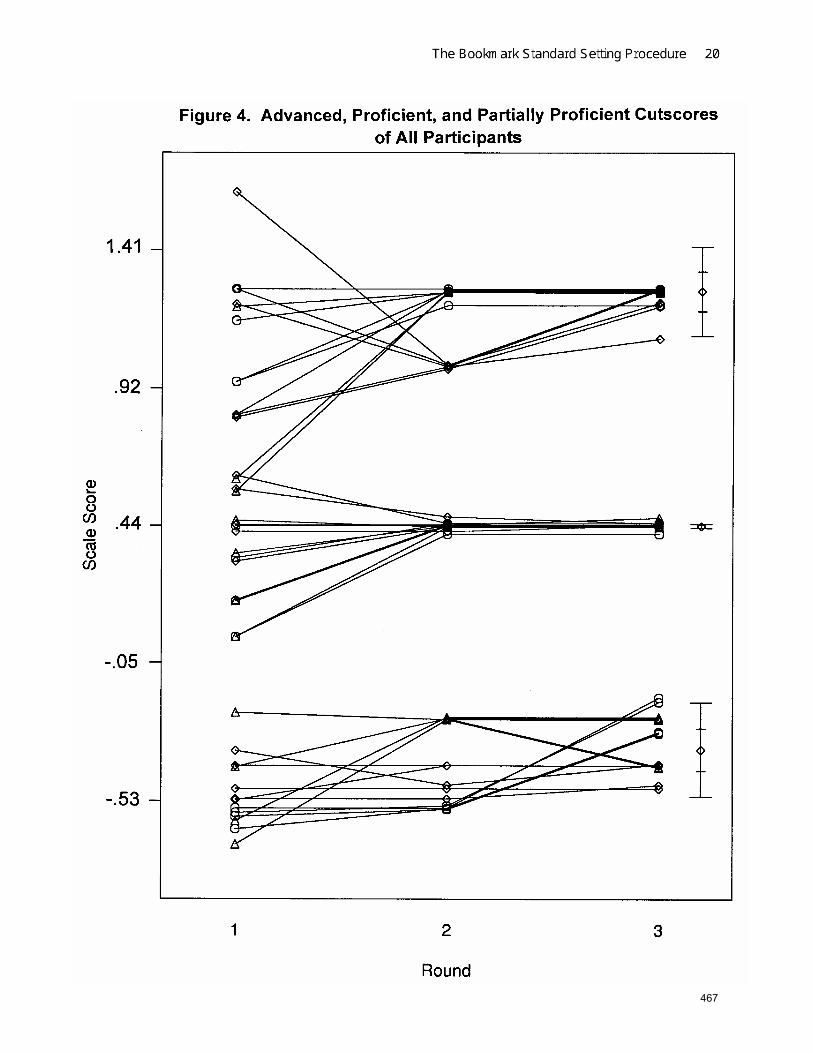
467