Oregon Early Learning Workforce: One Year Beyond Baseline ...
38
Oregon Early Learning Workforce: One Year Beyond Baseline Comparison of 2012 and 2013 Oregon Center for Career Development in Childhood Care and Education Portland State University Oregon Child Care Research Partnership Oregon State University This brief was produced jointly by:
Transcript of Oregon Early Learning Workforce: One Year Beyond Baseline ...

Oregon Early Learning Workforce: One Year Beyond Baseline
Comparison of 2012 and 2013
Oregon Center for Career Development in Childhood Care and Education Portland State University
Oregon Child Care Research Partnership
Oregon State University
This brief was produced jointly by:

Acknowledgements Funding for this work was provided through an interagency agreement with the Early Learning Division, Oregon Department of Education. The contents are solely the responsibility of the authors and do not represent the official views of the funding agencies, nor does publication in any way constitute an endorsement by the funding agency.
Special thanks go to Roni Pham of the Early Learning Division for her tireless efforts designing data collection strategies and for ensuring that the authors understood data collection processes. Both efforts greatly enhanced the value and accuracy of the data reported in this brief.

Page | 3
Table of Contents
Introduction ........................................................................................................................................................... 5 FINDINGS BASED ON DATA COLLECTED FROM INDIVIDUAL WORKFORCE MEMBERS ............................................ 6
Definition and Size of the 2013 Workforce .......................................................................................................... 6 Workforce by Type of Care and Position ............................................................................................................. 7
Number of Persons in the Workforce by Type of Care..................................................................................... 7 Number of Persons in the Workforce by Position ........................................................................................... 7
Characteristics of the 2013 Child Care Workforce ............................................................................................... 8 Demographic Characteristics of the Workforce ............................................................................................... 9 Race/Ethnicity by Type of Care ..................................................................................................................... 10 Primary Language by Type of Care ................................................................................................................ 10 Gender by Type of Care ................................................................................................................................ 11
Education of Workforce ................................................................................................................................... 12 Level of Education for the 2013 Workforce ................................................................................................... 12 Education Level by Type of Care ................................................................................................................... 13 Education Level by Type of Care and Race/Ethnicity ..................................................................................... 14 Education Level by Location ......................................................................................................................... 16 Percentage of Center Staff that have a Bachelors or Higher .......................................................................... 16
Training of the Workforce ................................................................................................................................ 17 Average Training and Child Development Hours by Position ......................................................................... 17 Training Hours By Location & Position .......................................................................................................... 18
Professional Engagement of the Workforce ...................................................................................................... 19 Engagement in Professional Development Initiatives .................................................................................... 19 Professional Development Initiatives by Type of Care ................................................................................... 20 Number of Professional Development Initiatives .......................................................................................... 21
Workforce and Oregon's Registry ..................................................................................................................... 22 Registry by Type of Care ............................................................................................................................... 22 Registry by Position ...................................................................................................................................... 22 Registry by Location ..................................................................................................................................... 23
Use of College Courses to Fulfill Training and Registry Requirements ................................................................ 24 Training Hours through Credit Courses ......................................................................................................... 24 Registry and College Credit Hours................................................................................................................. 25
Predictors of Participation in Professional Development Initiatives ................................................................... 25 FINDINGS BASED ON DATA ABOUT THE WORKFORCE COLLECTED FROM CHILD CARE FACILITIES ........................ 27
Compensation Received by the Workforce ....................................................................................................... 27 Average Low and High Hourly Wage received by Center Teachers, by Facility ............................................... 28 Association Between Teacher Education and Teacher Wages, by Facility ...................................................... 28 Benefits received by Center Teachers, by Facility .......................................................................................... 29
Teacher and Provider Retention in the Workforce ............................................................................................ 30 Percentage of Teachers who Remain in the Same Center for a Year or More, by Facility ............................... 30 Median Number of Years Home-Based Providers Provide Care in the Same Community ............................... 31
Challenge to Professionalization of the Workforce Presented by Turnover ............................................................ 32 Individual Child Care Workforce Member Measure of Retention ....................................................................... 32 Child Care Facility-Level Measure of Retention ................................................................................................. 32
Association Between Center Retention and Teacher Wages, by Facility ........................................................ 32 Reflections on Retention and Its Challenges to Professional Development ........................................................ 33
Study Limitations .................................................................................................................................................. 34 Conclusion ........................................................................................................................................................... 34 References ........................................................................................................................................................... 36

Page | 4
This page intentionally left blank.

Page | 5
Introduction In Oregon, as in the rest of the nation, increased awareness of the importance of early learning and development has been accompanied by recognition of the critical role played by those who teach and care for young children. Oregon’s ability to reach goals such as school readiness for all children entering kindergarten is linked to the knowledge and skill of its early learning workforce. Yet prior to 2012 Oregon has lacked data to answer basic questions about those who work in early learning and development programs. We have not been able to answer such basic questions as:
x How many persons work in early learning and development programs? x What positions do these persons hold? x What is their gender, race, ethnicity, and primary language? x What is their education level? How many hold postsecondary degrees? x How much training do they receive in a year? x How engaged are they in professional development?
In the late 2000s, members of the Oregon Child Care Research Partnership articulated questions they thought a state should be able to answer about its early learning workforce. The group then identified the information they would need to collect from members of the workforce in order to be able to answer these questions. The Early Learning Division (ELD), Oregon Department of Education (the Child Care Division within the Employment Department until July 2013), and the Oregon Center for Career Development in Childhood Care and Education (OCCD) at Portland State University designed a data sharing system that would link professional development and regulatory data on a daily basis. They ensured that the new system was designed to store the information needed to answer the policy-relevant questions about the workforce that partners had articulated. In 2012, ELD implemented the new system in which all staff working in regulated child care facilities submitted documentation of training hours to OCCD and that data began being linked with regulatory data managed by ELD. Electronic linking of professional qualification and licensing data has allowed Oregon to answer basic questions about the early learning workforce employed in regulated centers and home-based early learning facilities1. Baseline 2012 data on the workforce were reported in 2014 (OCCD & OCCRP, 2014). Working together, OCCD, ELD, and the Oregon Child Care Research Partnership at Oregon State University (OSU) have analyzed the data for 2013. As with the first report, this brief answers questions that partners have determined to be most critical for supporting decision makers as Oregon works to improve outcomes for its youngest children. This brief is the second of what will be annual reports on the workforce. In this second report, we compare findings with the baseline. This comparison provides a measure of the impact of early childhood investments on the workforce by viewing changes in important workforce characteristics. Findings in the first portion of the brief are based on an analysis of data collected from individual workforce members and stored in the Oregon Registry Online database (e.g., age, education, and training). In the second portion of the report, findings are based on data about the workforce collected from child care facilities (e.g., compensation and retention).
1 Home-based child care providers are typically identified by their regulatory status: a) small home-based providers are known as registered family child care and b) large home-based providers are known as certified family child care. We use the terms small and large home-based providers rather than the regulatory titles throughout this report.

Page | 6
FINDINGS BASED ON DATA COLLECTED FROM INDIVIDUAL WORKFORCE MEMBERS
Definition and Size of the 2013 Workforce
Importance of this information: The knowledge and skills of those persons who work directly with young children strongly impacts the learning and development of the young children enrolled in early learning and development programs. A critical step in supporting young children’s development is identifying and describing those who work directly with them in childhood care and education facilities.
How measured: Partners identified the positions associated with direct work with children. To be included in the 2013 workforce individuals had to be:
∎ employed in regulated facilities, and ∎ working directly with children and families, operationalized by employment in the following
positions – Aide I, Aide II, Assistant I, Assistant II, Director, Head Teacher, Provider, Teacher, Teacher’s Aide, Site Directors/Supervisor,2 and
∎ known to be working in regulated facilities in 2013. This criterion was based on the individual’s end date, hire date, and start date information.3
23,488 people worked in Oregon regulated early learning facilities in 2013. This represents an increase of 2,615 individuals. These data provide insight into movement within the workforce. Twenty percent of the 2012 workforce exited; that is they were not employed in a regulated facility in 2013 although they had been in 2012. Twenty-nine percent of the 2013 workforce entered, that is they were employed in 2013 but had not worked in a regulated facility in 2012. This increase is due to facilities adding staff and to new facilities becoming regulated. Some of the newly regulated facilities may have operated in the past as legally exempt programs.
2012 2013 Difference
20,873 23,488 2,615
Table 1
Changes in Workforce N Left Workforce (2012 only) 4,221 Entered Workforce (2013 only) 6,836 Remained in Workforce (2012 and 2013) 16,652
2 Using positions defined by the Office of Child Care for use in licensing, we determined the positions in which individuals primarily work directly with children and thus meet our definition for the child care workforce. 3 For 2013: End date needed to be greater than 12/31/12; hire date needed to be less than 12/31/13; and start date also needed to be less than 12/31/13. Hire date trumped start date because it was viewed as more accurate.

Page | 7
Workforce by Type of Care and Position Importance of this information: Members of the workforce play distinct roles and regulatory requirements vary by the position held so it is important to describe workforce characteristics by position held. Accurately describing the workforce by type of care and position within each type provides information needed for effective targeting of investments.
How measured: Workforce counts were created by type of care and by position within each type. We report counts of those employed in centers, large family homes, and small family homes.
Number of Persons in the Workforce by Type of Care
In 2013, center staff comprised the majority of the workforce with 73% of individuals working in child care centers. Large family child care homes comprised 12% of the workforce, and small family child care homes comprised 14% of the workforce. All individuals in small family homes were listed in the position of provider as small family child care home providers seldom hire staff. The data show a slight decrease in the number/percentage of persons employed in small home-based facilities and slight increases in both center and large home-based members of the workforce. Table 2
Workforce by Type of Care 2012 2013
Difference
N % of workforce
N % of workforce
N % of workforce
Center 15,069 72% 17,227 73%
2158 1% Large Home-Based 2,295 11% 2,903 12%
608 1%
Small Home-Based 3,509 17% 3,358 14%
-151 -3%
20,873
23,488
2,615
Note: Percentages throughout this brief are rounded.
Number of Persons in the Workforce by Position
Table 3 shows the number of individuals who worked in each type of care by position. Percentages are of individuals within each type of care (for example, 6% of center staff were directors in 2013). Within centers we saw an increase in head teachers and a slight decrease in the percentage that were teachers. Within large home-based facilities we saw a decrease in providers and an increase in those in the assistant II position. We also saw a decrease of 151 in the number of small home-based providers.

Page | 8
Table 3
Workforce by Position 2012 2013
Difference
N % of persons within type
of care N
% of persons within type
of care N %
Center Staff
Director 1,176 8% 968 6%
-208 -2%
Site Director / Supervisor 41 0% 139 1%
98 1% Head Teacher 2,283 15% 3,338 19%
1055 4%
Teacher 7,672 51% 7,832 46%
160 -5% Aide II 1,071 7% 1,231 7%
160 0%
Aide I 2,826 19% 3,719 22%
893 3% Large Home-Based Staff
Provider 745 33% 727 25%
-18 -8% Assistant II 735 32% 1,196 41%
461 9%
Assistant I 815 36% 980 34%
165 -2% Small Home-Based Staff
Provider 3,509 100% 3,358 100%
-151
Characteristics of the 2013 Child Care Workforce
Importance of this information: Oregon’s young children are increasingly diverse in terms of race, ethnicity, and primary language (Ryan, 2013; U.S. Census, 2011). There is growing evidence of the importance of young children being cared for by persons with knowledge and experience of the child’s culture and language (McCabe et al., 2014). It is important to describe the race, ethnicity, and primary language of members of the early learning workforce in order to assess the extent to which children from diverse backgrounds have access to teachers and providers with shared culture and language.
How measured: Data on race, ethnicity, and primary language were asked of providers on the Oregon Registry Online database (ORO) Enrollment form. Completion of this form was optional for those who did not participate in a program managed by OCCD (e.g., Betty Gray Early Childhood Training and Certification Scholarships, or Education Awards). In addition, completion of questions about race/ethnicity and primary language was optional due to the nature of the information. Thus, confidence in the estimates is limited by being based on incomplete data.
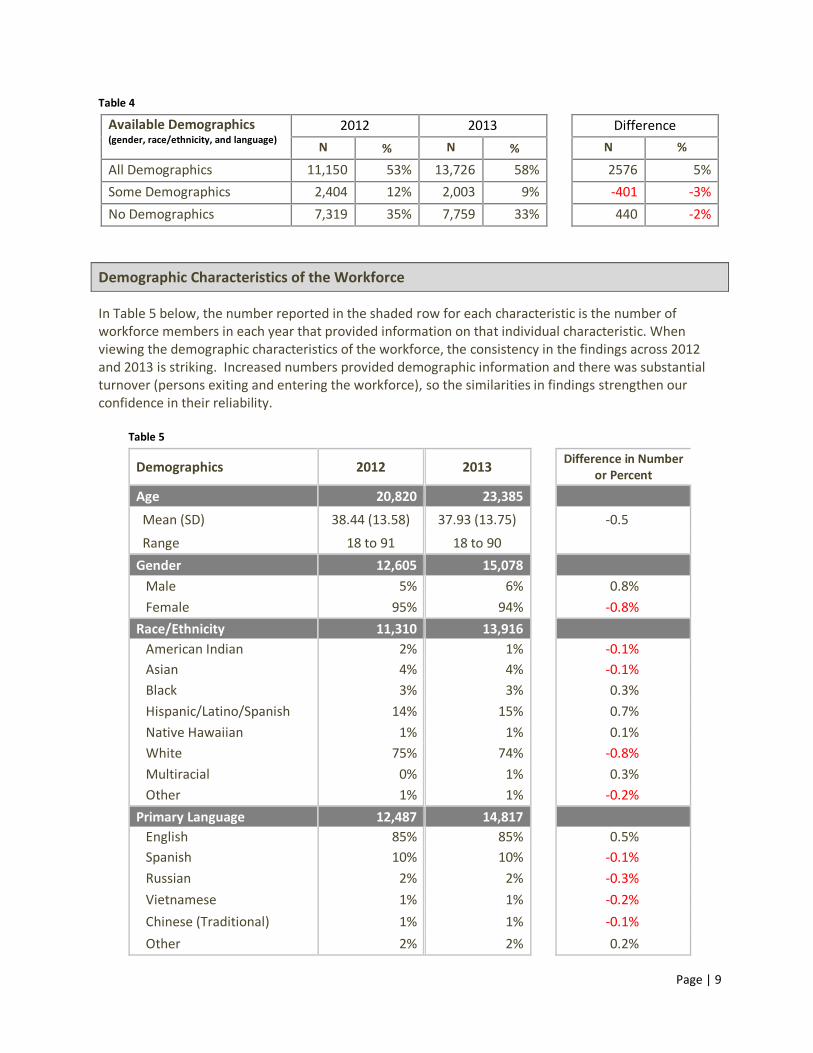
Findings on workforce demographics were based on data from those workforce members who provided that information. As can be seen in Table 4, slightly over 50% of workforce members provided all data for gender, race/ethnicity, and primary language in each year, with a slight increase in the number reporting demographic data in 2013. Since 99% of individuals had age data, age was not included in the analysis of missing data in the following table.
Page | 9
Table 4
Available Demographics (gender, race/ethnicity, and language)
2012 2013
Difference N % N %
N %
All Demographics 11,150 53% 13,726 58%
2576 5% Some Demographics 2,404 12% 2,003 9%
-401 -3%
No Demographics 7,319 35% 7,759 33%
440 -2%
Demographic Characteristics of the Workforce In Table 5 below, the number reported in the shaded row for each characteristic is the number of workforce members in each year that provided information on that individual characteristic. When viewing the demographic characteristics of the workforce, the consistency in the findings across 2012 and 2013 is striking. Increased numbers provided demographic information and there was substantial turnover (persons exiting and entering the workforce), so the similarities in findings strengthen our confidence in their reliability. Table 5
Demographics 2012 2013
Difference in Number or Percent
Age 20,820 23,385
Mean (SD) 38.44 (13.58) 37.93 (13.75)
-0.5%
Range 18 to 91 18 to 90
Gender 12,605 15,078
Male 5% 6%
0.8% Female 95% 94%
-0.8%
Race/Ethnicity 11,310 13,916
American Indian 2% 1%
-0.1%
Asian 4% 4%
-0.1% Black 3% 3%
0.3%
Hispanic/Latino/Spanish 14% 15%
0.7% Native Hawaiian 1% 1%
0.1%
White 75% 74%
-0.8% Multiracial 0% 1%
0.3%
Other 1% 1%
-0.2% Primary Language 12,487 14,817
English 85% 85%
0.5% Spanish 10% 10%
-0.1%
Russian 2% 2%
-0.3% Vietnamese 1% 1%
-0.2%
Chinese (Traditional) 1% 1%
-0.1% Other 2% 2%
0.2%

Page | 10
Race/Ethnicity by Type of Care
Approximately one-fourth (25%) of Oregon's workforce are Non-White. Small home-based providers are slightly more likely to be Non-White. Although the overall number of individuals in the workforce increased, the distribution of White to Non-White remained consistent from 2012 to 2013. Again, as in 2012, the workforce is more diverse than the general adult population in Oregon. Table 6
White/Non-White by Type of Care
2012 N = 11,255
2013 N = 13,809
Difference
White Non-White White Non-White
White Non-White
Center 76% 24% 75% 25% -1% 1% Large Home-Based 78% 22% 77% 23% -1% 1% Small Home-Based 73% 27% 73% 27% 0% 0%
Figure 1
Primary Language by Type of Care As seen in Table 7, the difference between small home-based providers and the rest of the workforce remained substantial with almost a third of small home-based members having a primary language other than English. Although the overall number of individuals in the workforce increased, the distribution of primary language spoken remained consistent from 2012 to 2013
0%10%20%30%40%50%60%70%80%90%
100%
Center LargeHome
SmallHome
Oregon
75% 77% 73% 81%
25% 23% 27% 19%
Non-White
White
Source: U.S. Census Bureau; American Community Survey, Oregon, Table S01 2011-2013 3-Year Estimate and B01001A-I 2011-2013 3-Year Estimate and B03002.
2013

Page | 11
Table 7
Primary Language by Type of Care
2012 N = 12,487
2013 N = 14,817
Difference
English Non-English English Non-
English
English Non-English
Center 89% 12% 88% 12% 0% 0% Large Home-Based 90% 10% 90% 10% 0% 0% Small Home-Based 71% 29% 71% 29% 0% 0%
Figure 2
Gender by Type of Care As seen in Table 8, the workforce continued to be predominantly female although there was a slight increase in males, especially in large home-based facilities. Table 8
Gender by Type of Care 2012
N = 12,605 2013
N = 15,078
Difference
Male Female Male Female
Male Female
Center 6% 94% 6% 94% 1% -1% Large Home-Based 6% 94% 8% 92% 2% -2% Small Home-Based 1% 99% 1% 99% 0% 0%
0%10%20%30%40%50%60%70%80%90%
100%
Center LargeHome
SmallHome
Oregon
88% 90% 71%
85%
12% 10% 29%
15%
Non-English
English
Source: U.S. Census Bureau; American Community Survey, Table S01, 2011 3-year estimate for Oregon.
2013

Page | 12
Figure 3
Education of Workforce
Importance of this information: Research has consistently found large positive associations between level of education of parents and teachers and the achievements and behavior of young children (Shonkoff & Phillips, 2000). Research has not yet identified a specific level of education (i.e. bachelors) associated with more positive outcomes (Early et al., 2006; Early et al., 2007; Vu, Jeon, & Howes, 2008). Yet, having less than high school has been found to be associated with less positive outcomes and more education with more positive ones (Ryan & Whitebook, 2012).
How measured: Data on education level was entered into ORO from multiple sources and verified by OCCD. In order to earn a step on the Oregon Registry Career Lattice (Registry) persons reported education and submitted documentation of coursework as well as degrees. Other workforce members self-reported education through the ORO Enrollment form when they applied for a program managed by OCCD or when they submitted information needed to meet regulatory requirements for the position they held. A final group submitted documentation of college credits to meet regulatory training requirements. In light of the fact that the Registry and other programs at OCCD are voluntary, this process resulted in missing education data on 37% (8,742) of the 2013 workforce. This was similar to 2012, in which education data was missing on 38% (7,905) of the workforce. Therefore, our confidence in the estimate of level of education is limited.
Level of Education for the 2013 Workforce Although we observed a slight increase in the percentage of the workforce with a bachelor’s degree or higher, the percentage with some college or more (some college, associate’s, or bachelor’s) dropped slightly from 69% to 67% of the workforce. As seen in Table 9, two-thirds of the workforce had education levels beyond a high school diploma or GED.
0%10%20%30%40%50%60%70%80%90%
100%
Center Large Home Small Home
94% 92% 99%
6% 8% 1%
Male
Female
2013

Page | 13
Table 9
Education of Workforce 2012 2013
Difference N % N %
N %
Less than High School Diploma/GED 418 3% 546 4%
128 1% High School Diploma or GED 3,521 27% 4,368 30%
847 2%
Some college, certificate, or foreign degree 2,910 22% 2,736 19%
-174 -4% Associate’s degree 1,933 15% 1,919 13%
-14 -2%
Bachelor’s degree or higher 4,186 32% 5,177 35%
991 3%
12,968
14,746
1,778
Education Level by Type of Care
As can be seen in Table 10, in 2013 there continued to be wide differences in education levels across types of care, with 72% of center staff having more than a high school diploma or GED compared with 63% of those in large home-based and 40% of those in small home-based facilities. We observed a drop in the percentages with some college or an associate’s degree, but the drop in percentage represented small numbers of workforce members except in the case of small home-based workforce members where the number with some college or an associate’s degree was substantially smaller. Table 10
Education by Type of Care 2012 2013
Difference
N % of persons within type
of care N
% of persons within type
of care N %
Center
Less than High School Diploma/GED 178 2% 239 2%
61 0%
High School Diploma or GED 2,335 24% 2,907 26%
572 2% Some college, certificate, or foreign degree 2,018 21% 2,023 18%
5 -3%
Associate’s degree 1,544 16% 1,543 14%
-1 -2% Bachelor’s degree or higher 3,581 37% 4,458 40%
877 3%
Large Home-Based
Less than High School Diploma/GED 44 3% 73 4%
29 1%
High School Diploma or GED 402 29% 552 33%
150 4% Some college, certificate, or foreign degree 381 28% 377 23%
-4 -5%
Associate’s degree 169 12% 178 11%
9 -2% Bachelor’s degree or higher 371 27% 473 29%
102 1%
Continued on next page

Page | 14
Table 10 (continued)
Education by Type of Care 2012 2013
Difference
N % of persons within type
of care N
% of persons within type
of care N %
Small Home-Based
Less than High School Diploma/GED 196 10% 234 12%
38 2%
High School Diploma or GED 784 40% 909 47%
125 7% Some college, certificate, or foreign degree 511 26% 336 17%
-175 -9%
Associate’s degree 220 11% 198 10%
-22 -1% Bachelor’s degree or higher 234 12% 246 13%
12 1%
Note: No data on education were available for 6,057 (35%) individuals in centers, 1,250 (43%) in large home-based care, and 1,435 (43%) in small home-based care in 2013.
Figure 4
Education Level by Type of Care and Race/Ethnicity
In 2013, the percentage of the workforce with a bachelor's or higher degree ranged from 43% of White staff working in centers to 7% of Non-White providers in small home-based settings.
0%
10%
20%
30%
40%
50%
60%
70%
80%
90%
100%
Center Large Home Small Home
Bachelor’s degree or higher Associate’s degree
Some college, certificate,or foreign degreeHigh School Diploma orGEDLess than High SchoolDiploma/GED
2013

Page | 15
In Figure 5, the difference in education level for each type of care are shown by White and Non-White.
Figure 5
In Figure 6, the difference in education level between White and Non-White are shown for each type of care. In each case, Non-White workforce members have lower levels of education.
Figure 6
0%
10%
20%
30%
40%
50%
60%
70%
80%
90%
100%
Center Large Home Small Home Center Large Home Small Home
White Non-White
High School or Less Some College Associate's Degree Bachelor's Degree or Higher
0%
10%
20%
30%
40%
50%
60%
70%
80%
90%
100%
White Non-White White Non-White White Non-White
Center Large Home Small Home
High School or Less Some College Associate's Degree Bachelor's Degree or Higher
2013
2013

Page | 16
Education Level by Location
When examining education levels across metropolitan and non-metropolitan areas we again saw little difference between 2012 and 2013 (see Table 11). Workforce members in metropolitan areas were more likely to have a bachelor’s degree or higher but there was a slight increase in the percentage with a bachelor’s degree or higher in non-metropolitan areas. Non-metropolitan individuals were slightly more likely to have less than a high school degree or only a high school diploma or GED. Table 11
Education by Location 2012 2013
Difference
Metro (10,838)
Non-Metro (2,027)
Metro (12,055)
Non-Metro (2,293)
Metro Non-Metro
Less than High School Diploma/GED 3% 3% 4% 4% 1% 1% High School Diploma or GED 26% 31% 29% 34% 3% 3% Some college, certificate, or foreign degree 22% 27% 18% 23% -4% -4% Associate’s degree 14% 20% 12% 17% -2% -3% Bachelor’s degree or higher 35% 20% 37% 23% 2% 3%
Note: In 2013, there were 595 individuals who could not be given a metropolitan/nonmetropolitan distinction because they lived out of state. An additional 8,545 were missing education data.
Note: We use the Office of Management and Budget Core Based Statistical Area classification for counties to distinguish between individuals who live in urban and rural areas. Counties are classified as metropolitan if they include an urbanized area of 50,000 inhabitants or more, plus outlying counties with close economic or social ties to the central county. Nonmetropolitan counties include two groups: micropolitan and noncore. Micropolitan counties include at least one urban cluster of between 10,000 and 49,000 people, plus outlying counties. Noncore counties have no population cluster larger than 10,000.
Percentage of Center Staff that have a Bachelor’s Degree or Higher
When we examined the percentage of center directors and teachers with a bachelor’s degree or higher (Table 12), we saw that teachers and directors were more likely to have a bachelor’s degree than were other center staff and that the percentages with bachelor’s degrees increased slightly between 2012 and 2013. Table 12
Percent with Bachelor’s or Higher 2012 2013
Difference
N % of position N % of
position N %
Directors 463 51% 435 58%
-28 7% Teachers/Head Teachers 2,698 39% 3,510 42%
812 3%
Note: There were 2,992 (27%) center teachers and 218 (23%) directors who had not submitted data on education.

Page | 17
Training of the Workforce
Importance of this information: Studies have shown recent training to predict quality in both centers and home-based facilities (Raikes et al., 2005) and may be especially important to the quality of family child care (Burchinal, Howes, & Kontos, 2002; Hughes-Belding et al., 2012).
How measured: Providers submitted documentation of training hours to OCCD in order to meet regulatory requirements. We reported training hours only for those positions for which training hours were required. Hours may be underrepresented due to transitions in the data collection and how safety set training hours were entered.
Average Training and Child Development Hours by Position
Training hour requirements varied by type of care and by position, with not all positions required to have training hours. In Table 13 below, the positions with shaded rows were required to have 15 hours of training annually with the exception of small home-based workforce members who were required to have 8 hours over two years. Those site directors/supervisors who also served as teachers were counted in these data as teachers. Those who served only as a site director/supervisor (without teaching responsibility) were described in the line below. They were not required to have training hours and the same was true for aides in centers and assistants in large home-based facilities. It is interesting to note that the individuals in positions with required hours all exceeded what was required and that those in position without required hours had substantial numbers of training hours. Table 13
Average Training Hours by Position 2012 2013
Difference in Hours
Total Child Deva Total Child Deva
Total Child Deva
Center Staff
Director (N = 710)b 22.8 17.9 25.4 18.6
2.6 0.7
Site Director/Supervisor (N = 109) 17.2 14.7 22.0 16.1
4.8 1.4 Head Teacher (N = 2,829) 20.7 18.7 23.5 20.2
2.8 1.5
Teacher (N = 5,443) 18.8 17.4 19.6 17.2
0.7 -0.2 Aide II (N = 835) 15.5 14.1 17.0 17.7
1.5 3.6
Aide I (N = 1,438) 14.3 12.9 15.0 13.2
0.7 0.2 Large Home-Based Staff
Provider (N = 619) 22.5 20.2 27.8 22.4
5.3 2.3 Assistant II (N = 801) 18.3 17.0 22.1 19.3
3.8 2.4
Assistant I (N = 300) 12.3 11.9 12.8 11.9
0.5 -0.1 Small Home-Based Staff
Providerc (N = 2,090) 12.9 11.8 13.9 12.4
1.0 0.6 a The Office of Child Care categorizes training hours directly related to work with children as Child Development Hours. We show these hours separately from total hours. b N = the number of individuals in each position that had training hours for 2013. c Includes all small home-based providers regardless of renewal cycle. Small home-based providers are on a two-year licensing cycle, the training hours listed are for the 2013 calendar year.

Page | 18
Training Hours By Location & Position
As can be seen in Table 14, the number of training hours increased in both metropolitan and non-metropolitan areas. The pattern of more training hours in non-metropolitan than metropolitan areas was found in both years. For the most part, the average number of training hours and percentage increases between 2012 and 2013 were greater in non-metropolitan than in metropolitan areas. Table 14
Average Training Hours by Location and Position
2012 2013
Difference in Hours
Metro Non-
Metro Metro
Non-Metro
Metro Non-
Metro
Center Staff
Director 22.2 26.1 24.3 29.8
2.1 3.7
Site Director/Supervisor 16.9 19.3 22.1 23.1
5.1 3.8 Head Teacher 20.1 24.1 22.3 31.1
2.2 7.0
Teacher 18.2 22.7 18.5 25.6
0.3 2.8 Aide II 14.5 19.3 15.3 22.2
0.8 2.9
Aide I 13.5 18.0 14.3 17.9
0.8 -0.1 Large Home-Based Staff
Provider 22.9 20.2 28.1 25.8
5.2 5.7 Assistant II 18.2 20.2 22.0 21.1
3.8 0.9
Assistant I 12.5 12.1 12.4 12.9
-0.1 0.7 Small Home-Based Staff
Providera 12.6 14.1 13.3 16.1
0.7 2.0 a Includes all small home-based providers regardless of renewal cycle. Small home-based providers are on a two-year licensing cycle, the training hours listed are for the 2013 calendar year.

Page | 19
Professional Engagement of the Workforce Importance of this information: Perceiving oneself as a member of a profession (in a career or following a calling) has been shown to predict observed quality (Kontos, Howes, Shinn, & Galinsky, 1995). Oregon has three major professional development initiatives for which data were available: a) Registry4, b) Education Award (monetary award based on achieving a step on the Registry), and c) Betty Gray Early Childhood Training and Certification (BGECTC) scholarship program. Engaging in one or more of these professional development initiatives indicated a teacher or caregiver’s engagement in professional activity.
How measured: Oregon’s three major professional development initiatives are managed by OCCD. Participation in each of the initiatives was documented in the workforce member's record. To further understand participation in these professional development initiatives, we calculated the percentage of the workforce who participated in these initiatives by type of care.
Persons were considered enrolled in the Registry when they applied, documented competency, and were awarded a step. This does not include those that were automatically assigned a step 1 or 2 because of their participation in a program such as the one to earn an enhanced subsidy rate that did not require applying for a step. Although the vast majority of enrolled persons earned a step 3-12, a small number earned a step 1-2.
Engagement in Professional Development Initiatives
As can be seen in Table 15, workforce members were more likely to have enrolled in the Registry or received an Education Award than to have received a Betty Gray Early Childhood Training and Certification scholarship in 2013. We saw an increase of almost 600 workforce members who received an Education Award or enrolled in the Registry. Although due to growth in the workforce itself, this did not result in an increased percentage in either category. Table 15
Engagement in Professional Development Initiatives
2012 2013
Difference
N % of workforce N % of
workforce
N %
Enrolled in the Registrya 4,601 22% 5,202 22%
601 0% Received one or more Education Awards 3,838 18% 4,434 19%
596 0%
Received one or more BGECTC scholarships 2,044 10% 2,012 9%
-32 -1% a Does not include individuals who were automatically assigned a step 1 or 2.
4 In addition to those who work directly with children in a regulated facility, the Registry includes others employed in the field of early childhood such as trainers, home visitors, staff of Child Care Resource and Referral agencies, and others. Thus enrollment is far greater than the workforce members whose participation is reported in this brief.
Page | 20
Professional Development Initiatives by Type of Care
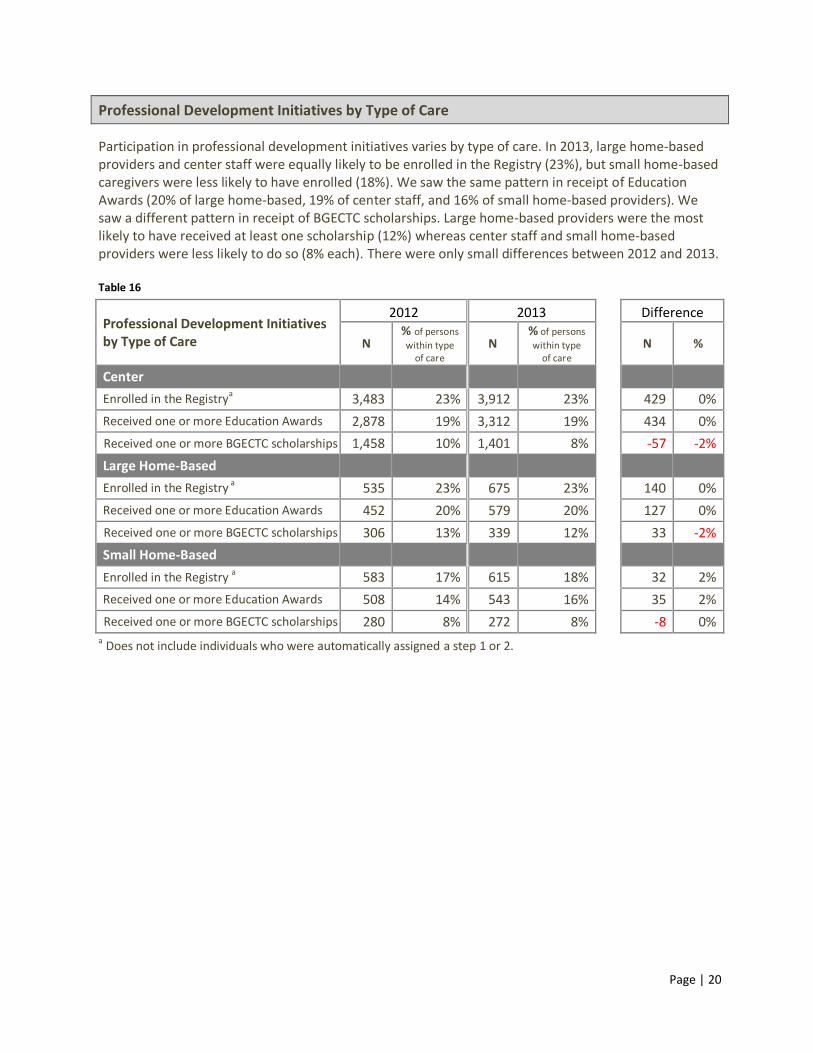
Participation in professional development initiatives varies by type of care. In 2013, large home-based providers and center staff were equally likely to be enrolled in the Registry (23%), but small home-based caregivers were less likely to have enrolled (18%). We saw the same pattern in receipt of Education Awards (20% of large home-based, 19% of center staff, and 16% of small home-based providers). We saw a different pattern in receipt of BGECTC scholarships. Large home-based providers were the most likely to have received at least one scholarship (12%) whereas center staff and small home-based providers were less likely to do so (8% each). There were only small differences between 2012 and 2013. Table 16
Professional Development Initiatives by Type of Care
2012 2013
Difference
N % of persons within type
of care N
% of persons within type
of care
N %
Center
Enrolled in the Registrya 3,483 23% 3,912 23%
429 0%
Received one or more Education Awards 2,878 19% 3,312 19%
434 0% Received one or more BGECTC scholarships 1,458 10% 1,401 8%
-57 -2%
Large Home-Based
Enrolled in the Registry a 535 23% 675 23%
140 0%
Received one or more Education Awards 452 20% 579 20%
127 0% Received one or more BGECTC scholarships 306 13% 339 12%
33 -2%
Small Home-Based
Enrolled in the Registry a 583 17% 615 18%
32 2%
Received one or more Education Awards 508 14% 543 16%
35 2% Received one or more BGECTC scholarships 280 8% 272 8%
-8 0%
a Does not include individuals who were automatically assigned a step 1 or 2.

Page | 21
Number of Professional Development Initiatives
Just under a quarter of the workforce (23%) participated in one or more professional development supports in 2013, with 6% participating in all three. Only small percentages of the workforce participated in only the Registry, only the BGECTC scholarship program, or a combination of those two programs (3%, 2%, and 1% respectively). Almost half of those who participated in at least one of the professional development initiatives combined enrollment of the Registry with receipt of an Education Award.
Table 17
Combinations of Professional Development Initiatives
2012 N = 20,873
2013 N = 23,488
Difference
N % N %
N %
None 15,826 76% 17,920 76%
2094 0% All Three 1,419 7% 1,488 6%
69 0%
Betty Gray & Registry Step 194 1% 158 1%
-36 0% Education Award & Registry Step 2,403 12% 2,946 13%
543 1%
Betty Gray only 430 2% 366 2%
-64 -1% Registry Step Only 585 3% 610 3%
25 0%
Note: Percentages are rounded.
1% [N = 158] Participated in BGECTC + Registry
Of the 24% who participated in at least one initiative in 2013:
3% [N = 610]
2% [N = 336]
Participated in Registry only
Participated in BGECTC only
13% [N = 2,946] Participated in Registry + Ed Award
6% [N = 1,488] Participated in ALL three initiatives
76% (17,920) participated in no
PD initiative
24% (5,568) participated in
at least 1 of the initiatives
2013 Workforce N = 23,488
Figure 7

Page | 22
Workforce and Oregon's Registry
Importance of this information: Oregon aims to enroll each member of the workforce in the Registry. Not only does enrollment support professionalism, but having staff with steps on the Registry is required for a facility’s achievement of a level 3, 4, or 5 in the Quality Rating and Improvement System. The step level of staff affects how high a rating a program can achieve.
How measured: Persons were considered enrolled in the Registry when they applied, documented competency, and were awarded a step. This does not include those that were automatically assigned a step 1 or 2 because of their participation in a program such as the one to earn an enhanced subsidy rate that did not require applying for a step. Although the vast majority of enrolled persons earned a step 3-12, a small number earned a step 1-2.
Enrollment in the registry was explored by type of care, position, and location (metro/non-metro). We also measured the percentage of those who used college credits or degrees to document professional development required for a step.
Registry by Type of Care
Overall, 22% of the entire workforce (5,202 individuals) were enrolled in the Registry in 2013 but as can be seen in Table 18, participation varied by type of care. Table 18
Registry Participation by Type of Care
2012 2013
Difference
N % of persons within type
of care N
% of persons within type
of care
N %
Center 3,483 23% 3,912 23%
429 0% Large Home-Based 535 23% 675 23%
140 0%
Small Home-Based 583 17% 615 18%
32 2% Total 4,601 22% 5,202 22% 601 0%
Note: Does not include individuals who were automatically assigned a step 1 or 2. Registry by Position
The 2013 data showed that although 23% of the center-based workforce participated in the Registry, participation varied by position. Forty percent of center directors and head teachers and 24% of teachers had enrolled in the Registry whereas only 5-9% of aides in centers did. As seen in Table 19, 52% of large home-based providers had enrolled in the Registry whereas only 5-21% of their assistants did. Only 18% of small home-based providers had enrolled in the Registry. This was a slight increase in participation for small home-based providers.

Page | 23
Viewing participation in the Registry by position showed little change between 2012 and 2013 except for Site Directors/Supervisors whose participation jumped from 17% in 2012 to 30% in 2013 and large home-based assistant IIs whose participation went from 14 to 21% over the two years. Table 19
Registry Participation by Position
2012 2013
Difference
N % of persons
in that position
N % of persons
in that position
N %
Center Staff
Director 446 38% 389 40%
-57 2%
Site Director/Supervisor 7 17% 42 30%
35 13% Head Teacher 888 39% 1,349 40%
461 2%
Teacher 1,875 24% 1,853 24%
-22 -1% Aide II 92 9% 109 9%
17 0%
Aide I 175 6% 170 5%
-5 -2% Large Home-Based Staff
Provider 364 49% 375 52%
11 3% Assistant II 106 14% 249 21%
143 6%
Assistant I 65 8% 51 5%
-14 -3% Small Home-Based Staff
Provider 583 17% 615 18%
32 2% Total 4,601 22% 5,202 22%
601 0
Note: Percentages are rounded. Registry by Location
In both 2012 and 2013, workforce members in non-metropolitan areas were more likely to have a step on the Oregon Registry than those in metropolitan areas. Table 20
Registry Participation by Location
2012 2013
Difference N % N %
N %
Metropolitan 3,707 22% 4,110 21%
403 0% Non-Metropolitan 884 26% 946 26%
62 0%
Notes: Metropolitan and non-metropolitan were determined using Office of Management and Budget Core Based Statistical Area classification for counties, see note for Table 11 for more information. In 2013, there were 146 Registry participants who could not be given a metropolitan/nonmetropolitan designation because they lived out of state.
Page | 24
Use of College Courses to Fulfill Training and Registry Requirements
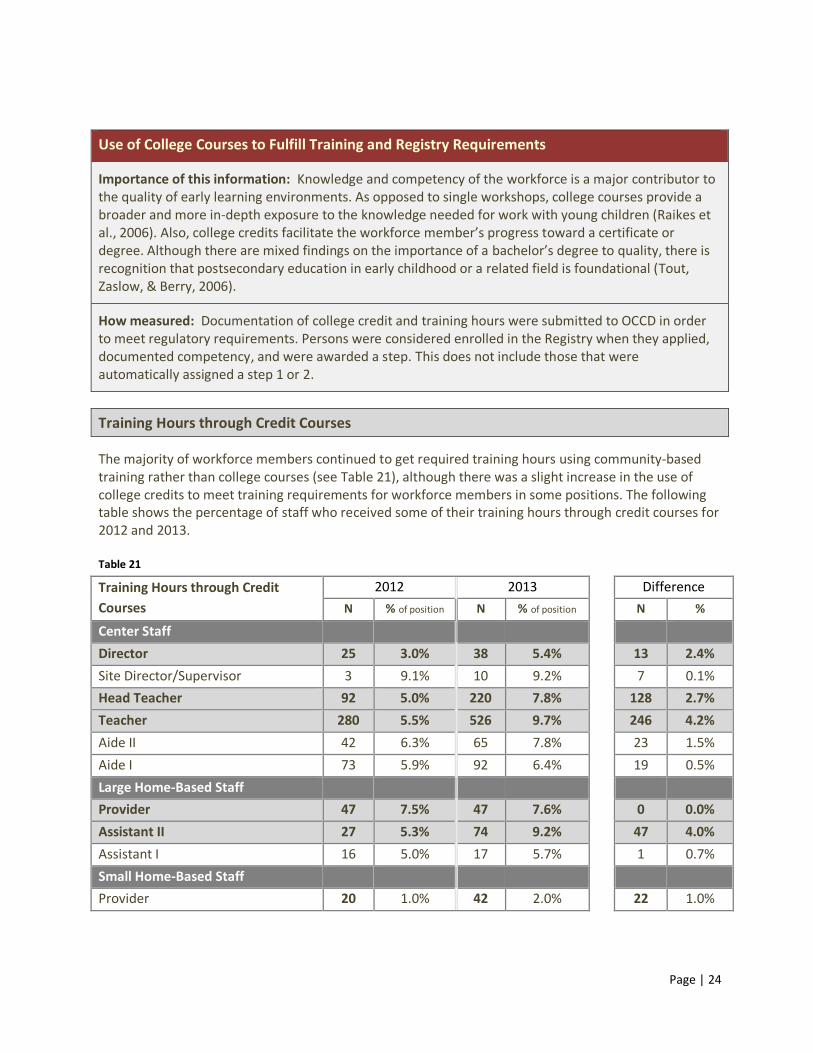
Importance of this information: Knowledge and competency of the workforce is a major contributor to the quality of early learning environments. As opposed to single workshops, college courses provide a broader and more in-depth exposure to the knowledge needed for work with young children (Raikes et al., 2006). Also, college credits facilitate the workforce member’s progress toward a certificate or degree. Although there are mixed findings on the importance of a bachelor’s degree to quality, there is recognition that postsecondary education in early childhood or a related field is foundational (Tout, Zaslow, & Berry, 2006).
How measured: Documentation of college credit and training hours were submitted to OCCD in order to meet regulatory requirements. Persons were considered enrolled in the Registry when they applied, documented competency, and were awarded a step. This does not include those that were automatically assigned a step 1 or 2.
Training Hours through Credit Courses
The majority of workforce members continued to get required training hours using community-based training rather than college courses (see Table 21), although there was a slight increase in the use of college credits to meet training requirements for workforce members in some positions. The following table shows the percentage of staff who received some of their training hours through credit courses for 2012 and 2013. Table 21
Training Hours through Credit Courses
2012 2013
Difference N % of position N % of position
N %
Center Staff
Director 25 3.0% 38 5.4%
13 2.4%
Site Director/Supervisor 3 9.1% 10 9.2%
7 0.1% Head Teacher 92 5.0% 220 7.8%
128 2.7%
Teacher 280 5.5% 526 9.7%
246 4.2% Aide II 42 6.3% 65 7.8%
23 1.5%
Aide I 73 5.9% 92 6.4%
19 0.5% Large Home-Based Staff
Provider 47 7.5% 47 7.6%
0 0.0% Assistant II 27 5.3% 74 9.2%
47 4.0%
Assistant I 16 5.0% 17 5.7%
1 0.7% Small Home-Based Staff
Provider 20 1.0% 42 2.0%
22 1.0%

Page | 25
Registry and College Credit Hours
In 2012 and 2013, about half of workforce members who were enrolled in the Registry had college credit hours (see Table 22). Table 22
Registry and College Credit Hours 2012
(N = 4,601) 2013
(N = 5,202)
Difference
N % N %
N %
Percent of Registry enrollees with college credit hours
2,514 55% 2,598 50%
84 -5%
Predictors of Participation in Professional Development Initiatives
What workforce member characteristics predict that a person participates in one or more of the following: Registry, Betty Gray Early Childhood Training and Certification scholarship, Education Awards?
Importance of this information: Increased understanding of who does and does not participate in professional development initiatives can strengthen efforts to target limited professional development resources. Findings from this analysis will assist in identifying those we are reaching as well as those we are not reaching.
How measured: We used a logit analysis to model how workforce members’ characteristics predicted engagement in professional development initiatives. Professional engagement was measured as a 1 if workforce members had engaged in at least one initiative (Registry, BGECTC, Education Awards), and a 0 if they had participated in no initiatives.
The characteristics associated with participation in at least one professional development initiative are discussed and presented in the table below. The numbers in Table 23 describe the probability of engaging in an initiative associated with a change in that characteristic, controlling for the values on other characteristics. This enables us to assess the impact of each particular characteristic on probability of participating in professional development. Asterisks note the significance of the association. For example, in 2013 if the workforce member were an aide in a center the probability of engaging in an initiative was 17.9% less than the probability of a small home-based provider participating in professional development. The two asterisks show an association is highly significant, meaning it very unlikely that the difference was due to chance and highly likely to represent a real difference indicating a characteristic is associated with the probability of participating.

Page | 26
Table 23
Variable description 2012 2013
(N = 10,898) (N = 13,255)
Age 0.003** 0.004** Aide at a center -0.158** -0.179** Director at a center 0.096** 0.076** Teacher at a center 0.052** 0.023** Assistant at large home-based care -0.065** -0.001** Provider at large home-based care 0.196** 0.181** Non-Metro [1=Non-Metro, 0=Metro] 0.071** 0.035** Training 1-8 hours -0.017** -0.008** Training 9-15 hours 0.007** 0.036** Training 16-25 hours 0.043** 0.090** Training >25 hours 0.175** 0.193** Gender [1=Female, 0=Male] 0.117** 0.094** Race/Ethnicity [1=Non-White, 0=White] -0.032** -0.026** Primary language [1=Non-English, 0=English] -0.008** -0.001** Some college, Certificate, foreign degree 0.155** 0.203** Associate’s Degree 0.242** 0.185** Bachelor’s Degree 0.174** 0.154**
* Significant at the .05 level; ** Significant at the .01 level Note: Marginal effects reflect the predicted probability of engaging in an initiative for a change in a characteristic. The sample size for the model is significantly lower than the 23,488 (2013) total sample due to significant missing data on education, ethnicity, and primary language. Since in 2012 the results of an imputed missing data model yielded similar results to a model run without imputation, we did not impute missing values in 2013.
Age Older members of the workforce were significantly more likely to participate in an initiative than were younger members of the workforce. As age increased, the likelihood of participating in an initiative also increased. There was no change in the size or significance of this predictor between 2012 and 2013.
Position All positions were compared to a small home-based provider. In 2012, aide at a center and assistant at large home-based care facility were significantly less likely to participate in any initiative, while center directors, center teachers and providers at large home-based care facilities had a greater probability of participating in at least one initiative. In 2013, only being an aide at a center made a workforce member significantly less likely to participate in any initiative. Center teachers and assistants in large-based homes were no longer significantly more likely to participate in any initiative, although center directors and providers in large home-based care were. Non-Metropolitan Those living in non-metropolitan areas of Oregon were more likely than those living in metropolitan areas to engage in an initiative in both 2012 and 2013.

Page | 27
Training Hours Those with training hours were compared to those with no training hours. In 2012, those with training hours greater than 15 hours were significantly more likely to have participated in an initiative than were those without any training hours. In 2013, those with greater than 8 training hours earned in that year were significantly more likely to have participated in an initiative than were those with no training hours. Gender Being female was significantly associated with participating in an initiative in both 2012 and 2013. If the workforce member was female they were about 12% more likely to participate in one or more initiatives in 2012 and about 9% more likely to do so in 2013.
Race/Ethnicity Race/ethnicity was significantly and negatively associated with engagement in an initiative in both 2012 and 2013. If the workforce member was Non-White, the probability of engaging in an initiative was 3% less in both years. Primary Language Having a primary language other than English was not significantly associated with participation in professional engagement although the direction was negative in both 2012 and 2013.
Education Education comparisons were to those with a high school diploma or less. In both 2012 and 2013, workforce members who had some college, a certificate, or a degree higher than a high school diploma were significantly more likely to participate in at least one initiative compared to those with a high school diploma or less. FINDINGS BASED ON DATA ABOUT THE WORKFORCE COLLECTED FROM CHILD CARE FACILITIES The following section of the brief contains findings based on analysis of data collected from child care facilities about their employees. Compensation data were only collected from centers. Home-based providers have business income, but not typically wages. Therefore, compensation is not an appropriate characteristic for describing home-based providers.
Compensation Received by the Workforce
Importance of this information: Lower levels of compensation have been shown to be associated with higher teacher turnover, lower teacher morale, and lower levels of observed quality (Cochran, 2007; Torquati, Raikes, & Huddleston-Casas, 2007; Peisner-Feinberg et al., 2000). Stability of teachers and caregivers affects children both directly and indirectly. Directly, continuity in teachers is critical for children’s ability to feel secure and to ensure that the adult knows the children. Indirectly, children are affected negatively when teachers and caregivers leave because of the negative impacts on staff morale and increased difficulty for remaining staff to train and integrate new teachers into the program. Nationally, as in Oregon, childhood care and education teacher wages are substantially lower than those occupations held by persons with similar education and experience (U.S. Bureau of Labor Statistics, 2013).

Page | 28
Average Low and High Hourly Wage received by Center Teachers, by Facility
How measured: At the time of the annual recertification visit, Licensing Specialists had center directors fill out a form that provided information on wages and benefits. Directors were asked to report the lowest and highest teacher/head teacher wage and the benefits they provided to any of the staff. Thus, data were available at the facility-level rather than that of the individual teacher level.
Between 2012 and 2013, the workforce experienced a slight increase in average wages, greater at the entry level than for those earning higher wages. It is important to note that a smaller percentage of centers reported wages in 2013 than did in 2012. Table 24
Teacher/Head Teacher Wages
2012 2013
Difference Low High Low High
Low High
Median 9.50 13.61 10.00 13.75
0.50 0.14 Mean 10.33 14.96 10.63 15.13
0.30 0.17
Range (Lowest Low - Highest High) 8.00 45.00 8.00 45.00
--- ---
Number of Centers Reporting 805 814 546 540
-259 -274 Percent of Centers Reporting 83% 84% 56% 55%
-27% -29%
Association Between Teacher Education and Teacher Wages, by Facility
How measured: To answer the question of whether teacher education and wages in centers were related we relied on facility-level data. At the facility-level, we used highest wages paid and the percent of teachers who had an associate’s degree or higher. These estimates were then divided into three equal parts for both variables. The table below shows how teacher education and wages were related. The results indicated a relationship between higher education levels and wages. It is important to note that we viewed both teacher education and wages from a center level. For each center, we used the highest teacher wage paid and the percentage of teachers with a degree (associate’s degree or higher) to create three equal groups: lowest, mid, and highest. We then looked to see if there was an association – Did centers that paid lower wages also have teachers with lower levels of education? As can be seen in Figure 8 below, we found an association between teacher wages and teacher education. Centers who paid the lowest wages had smaller percentages of teachers with degrees whereas those who paid the highest wages had larger percentages of teachers with associate’s degrees or higher. Further, correlation results confirmed this association as median education was significantly correlated with the highest center wage (0.234, p-value = .001). This correlation would likely be stronger if data were available at the individual-level.

Page | 29
Figure 8
Benefits received by Center Teachers, by Facility
Importance of this information: Access to health and other benefits is vital to family well-being. It has also been linked to retention and staff morale, both of which have been linked to program quality (Whitebook, Sakai, Gerber, & Howes, 2001; Howes & Hamilton, 1993).
How measured: As noted above, center directors were asked to list the benefits they provided to at least some of their staff.
The 2013 data showed improved provision of benefits to center staff. However, smaller numbers of centers reported in 2013 than in 2012 so we cannot be confident that this is a real improvement. Table 25
Benefit Counts for Reporting Facilities
2012 2013
Difference
N % of facilities N % of
facilities
N %
0 benefits 146 17% 86 13%
-60 -4% 1 benefits 269 32% 159 25%
-110 -7%
2 benefits 220 26% 154 24%
-66 -2% 3 benefits 144 17% 95 15%
-49 -2%
4 benefits 50 5% 68 10%
18 5% 5 benefits 23 3% 87 13%
64 10%
*Benefit information reported for 852 (88%) of centers in 2012 and 649 (66%) of centers in 2013.
58%
36% 28%
23%
36% 36%
20%
28%
36%
0%
10%
20%
30%
40%
50%
60%
70%
Lowest Wage$9.05-12.81
Mid Wage$13.00-15.20
Highest Wage$15.21-45.00
Perc
ent o
f Fac
ilitie
s Center Wages Based on Percent of Teachers with Degrees
Low Teachers with Degrees(0 - 33%)
Mid Teachers with Degrees(35-67%)
High Teachers with Degrees(69-100%)

Page | 30
In 2013, we saw substantial improvement in provision of health insurance and, to a lesser extent, other benefits. Again we cannot know if this improvement is due to real change or having fewer facilities report on benefits in 2013. Table 26
Type of Benefits for Reporting Facilities
2012 N = 852
2013 N = 649
Difference
N % of facilities N % of
facilities
N %
Medical/Health Insurance 533 37% 443 68%
-90 31% Paid Time Off 351 41% 353 54%
2 13%
Retirement Options 197 23% 244 38%
47 15% Training/Education 221 26% 228 35%
7 9%
Free/Reduced Child Care 154 18% 191 29%
37 11% Membership Professional Org* 0 0% 0 0%
0 0%
*No facilities reported providing professional membership for staff, however, this was not asked directly on the form. Future data collection will include all categories.
Teacher and Provider Retention in the Workforce
Importance of this characteristic: A higher percentage of teachers who remain in the same center for a year or more provides stability and continuity for children. As noted above teacher turnover negatively impacts children both directly by disrupting the child’s relationship with the adult and indirectly by negatively impacting remaining staff and program.
Percentage of Teachers who Remain in the Same Center for a Year or More, by Facility
How measured: Administrative data enabled us to measure retention of the workforce employed in centers and home-based care. For each type of care we created the measure at the facility level. For center staff, we calculated a facility-level percentage of teaching staff whose hire date was one or more years prior to the most recent licensing renewal. In addition to the facility-level measure, we also calculated a workforce measure of retention by analyzing the percentage of total teachers who were at their facility for a year or more.
At a facility-level, in the average center, 80% of teachers were at their center for more than one year in 2013. As seen in Table 27, just over half of centers (53%) retained 75% or more of their teaching staff. Low level of stability (less than 25% of teaching staff retained) was an issue for 5% of facilities in 2013. At a workforce level, 74% of teachers in the state were at their center for more than one year at the time of licensing [6,309 of 8,471] in 2013.

Page | 31
Table 27
Center Retention: Percent of Centers at Each Level of Teacher Retention
Percent of Teachers Retained at Centers
2012 2013
Difference N of
facilities % of
facilities N of
facilities % of
facilities
N of facilities
% of facilities
0% of teachers over a year 71 8% 48 5%
-23 -3% 1% – <25% of teachers over a year 17 2% 17 0%
0 -2%
25% – <50% of teachers over a year 126 15% 107 12%
-19 -3% 50% – <75% of teachers over a year 187 22% 243 27%
56 5%
75% – 99% of teachers over a year 141 17% 226 25%
85 9% 100% of teachers over a year 308 36% 251 28%
-57 -8%
850 facilities 892 facilities
*In 2013, 85 facilities did not have any teachers reported and therefore retention was unable to be calculated.
Median Number of Years Home-Based Providers Provide Care in the Same Community
How measured: Calculating retention for home-based providers was more complicated because home-based providers could move within their own community, thus not disrupting the child’s relationship with the provider. Thus, unless a provider moved outside a 10-mile radius or had more than a 30 day gap in service, we did not count the move as a disruption. Years of operation were determined by subtracting the date the facility was certified or registered from the date of the most recent renewal. Note this retention measure is not a measure of how long the average home-based provider continuously maintains their child care business as it does not capture those who enter, stay a limited period of time, and exit. We measure the time that those currently providing care have been providing that care at that home or a home within a 10-mile radius of the original home.
The median number of years providing care remained consistent from 2012 to 2013. Large home-based providers averaged 4.7 years of care and small home-based providers averaged 7.9 years of providing care in 2013. It is important to note that Oregon created large home-based providers in 2002 and there has been a steady increase in their number since that time. Oregon has had registered small home-based providers since 1993.
2012 2013
Difference Large Home-Based Providers (N = 522)
Median Number of Years 5.0 4.7
-0.30 Range of Years 2 - 10 1 - 27
---
Small Home-Based Providers (N = 2,551)
Median Number of Years 8.0 7.9
-0.10
Range of Years 0 - 46 0 - 32
---

Page | 32
Challenge to Professionalization of the Workforce Presented by Turnover From a policy perspective it is important that investments have long-lasting effects. Child care workforce turnover therefore threatens the value of investments in the workforce. Data allow us to examine the extent to which this is a challenge in Oregon. We have two distinct although related measures of teacher retention: an individual workforce member measure and facility-level measures by type of facility. In this section, we look at retention from both perspectives and then discuss possible implications of the findings. Individual Child Care Workforce Member Measure of Retention As noted at the beginning of this report, 20% of the 2012 workforce had left the workforce by 2013. In addition, the workforce had grown by over 2,600 people from 20,873 to 23,488 in 2013. One question we asked was, “What effect did turnover and growth have on the percentage of workforce members who had participated in professional development?” As can be seen in Table 28, the effect of turnover on professionalization of the workforce is complex. Those who remained in the workforce (“stayers”) had the highest percentages of participation in professional development. Surprisingly, some of the “enterers” had also participated in professional development even though they had not been in the workforce the previous year. Table 28
Professional Engagement “Leavers” N = 4,221
“Enterers” N = 6,836
“Stayers”* N = 16,652
N % of Leavers N % of
Enterers N % of Stayers
Enrolleda in the Registry 540 13% 520 8% 4,682 28%
Received one or more Education Awards 425 10% 376 6% 4,058 24% Received one or more BGECTC scholarships 269 6% 137 2% 1,875 11%
*Note: If person in both years, data reported in 2013 were used.
Child Care Facility-Level Measure of Retention At the facility level, we asked if there were an association between wages paid at the center and level of retention.
Association Between Center Retention and Teacher Wages, by Facility
How measured: To answer the question of whether retention levels and wages in centers were related we relied on facility-level data on highest wage paid and the percent of teachers who were at the center for more than one year at the time of licensing renewal. These estimates were then divided into three equal parts for both variables. The table below shows how retention scores and wages were related. To look at the association between teacher retention and wages we viewed both retention and wages from a facility or center level. For each center, we had teacher wages and a measure of the percent of teachers who had been at the center for a year or more. We looked for a relationship between teacher retention (percent retained) in a center and the wages the center paid teachers. Using retention scores we created three equal groups: lowest, mid, and highest. We then looked to see if there was an association – Did those centers that had lower levels of retention also pay lower wages?

Page | 33
As can be seen in Figure 9 below, we found an association between teacher wages and teacher retention. In centers with the lowest level of retention, the largest percentage (41%) also paid the lowest wages. In centers in the group with the highest level of retention, the largest percentage (40%) also paid the highest wage. Interestingly, the centers in the mid group in terms of retention were similar to those in the high retention group in terms of wages paid. Further, correlation results confirmed this association as teacher retention level was significantly correlated with the highest center wage (0.186, p-value = .001).
Figure 9
Reflections on Retention and Its Challenges to Professional Development Oregon aims to professionalize the workforce and to have all workforce members enroll in the Registry. Turnover or low retention rates challenge achievement of these goals to the extent that we lose those in whom we have made professional development investments. Luckily the group that exited the workforce (leavers) had lower levels of participation in professional development than did those who remained (stayers). But maintaining and hopefully growing the overall percentage of the workforce that has participated in professional development and enrolled in the Registry requires reaching large numbers of workforce members, especially if retention rates remain low and growth in the size of the workforce high. When viewing retention from the level of the individual, we found that 80% of the total 2012 workforce (all types of care and all position who work with children included) were still in the 2013 workforce—a 80% retention rate. The same rate for K-12 school teachers nationally was 92% in the 2012-2013 academic year. However, that rate was only 85% in schools where the base salary rate was less than $30,000 (Goldring, Taie, & Riddles, 2014). When viewing retention from the facility level, we found an interesting relationship between retention and wages paid. Centers that had teacher retention rates below 68% were far more likely to pay the
42%
23%
30% 34% 35%
31%
24%
42% 40%
0%5%
10%15%20%25%30%35%40%45%
Low Retention (0 - 67%) Mid Retention (68-90%) High Retention (91-100%)
Perc
ent o
f Fac
ilitie
s
Center Wages Based on Teacher Retention Level
Lowest Wage$9.05-12.81
Mid Wage$13.00-15.20
Highest Wage$15.21-45.00
Retention is the percentage of teaching staff who were at the center for one year or more as of the 2013 licensing date. 2013
Page | 34
lowest wage. The differences in wages paid were similar between the two groups that fell into the mid and high range of retention. With both early learning centers and K-12 schools, low salaries are associated with low rates of retention. For early learning, an additional challenge is that only about one third of centers appear to have a base salary of around $30,000 (an annualized estimate of $15.21 per hour), the amount associated with low rates of retention in K-12 (Goldring, Taie, & Riddles, 2014). Low levels of retention challenge stability for children as well as efforts to professionalize the workforce. In order to reach Oregon’s goal of a stable professionalized workforce it seems clear that compensation issues need to part of the conversation. It would also seem that different strategies are needed to reach facilities with higher levels of education, higher wages, and high levels of retention from those targeted at facilities with the combination of lower levels of education, lower wages, and lower levels of retention. It seems unlikely that one strategy will work with facilities with such different conditions. Study Limitations The data used in this study were collected in the second year of a major transformation of Oregon’s early learning system. Creation of the Oregon Registry Online (ORO) has enabled the state to collect workforce training and other data from all persons working in regulated child care facilities starting in 2012. Linking individual data with facility licensing data on a daily basis allowed Oregon to associate each person with the facility in which they were employed at the time that facility was licensed. As with any major system transformation, there were challenges and these challenges likely resulted in missing or incomplete data. Missing data on key descriptors such as education, race, ethnicity, gender, and primary language were a major limitation since policy decision making would be strengthened by having this information. In addition, data were available only for the members of the workforce employed in regulated facilities. Thus, it did not include data on those employed in programs exempt from licensing such as part-day preschools. Similarly, data at the facility-level were collected only from regulated facilities. Data were collected at the time of license renewal. The data captured a characteristic related to the workforce but was based on a characteristic of the facility. Compensation provided an example that was related to the workforce but measured at the facility level. The findings represent facility averages such as the lowest teacher wage paid or the highest teacher wage paid by centers. Were such data to be collected from individuals, more analyses could be conducted as the characteristic would be associated with an individual workforce member rather than with the facility which employs these workforce members. Conclusion As of 2012, Oregon has had in place a system that allows it to answer policy-relevant questions about the early learning workforce employed in regulated child care and education facilities. This brief describes the 2013 workforce and compares it with the 2012 workforce. Having a measure of turnover provides critical information for designing the training system. The 2013 workforce has 2,615 more members than did the 2012 workforce. Twenty percent of the 2012 workforce exited; that is they were not employed in a regulated facility in 2013. Twenty-nine percent of the 2013 workforce entered, that is they were employed in 2013 but had not worked in a regulated facility in 2012. The 20% turnover rate in early learning facilities compares with a 8% national teacher turnover rate in K-12 and a 15% rate in K-12 schools with a base salary of $30,000 or less. Low wages are associated with high turnover rates in both early learning and K-12. High turnover rates harm children and challenge professional development investments; although in Oregon’s early learning workforce we find that those in whom we made professional development investments were mainly in the group who remained in the workforce.

Page | 35
Findings also support assessment of quality improvement efforts. In 2013, Oregon launched its Quality Rating and Improvement System (QRIS) and QRIS includes investments in individuals and facilities. Having 2012 baseline data allows Oregon to measure the impact of those investments on critical measures of workforce characteristics. This 2013 report is the first measure of the impact of these investments. Workforce members earned higher numbers of training hours and slightly more of these hours were from college courses. Percentages of the workforce with education higher than a high school diploma/GED and with a step on the Oregon Registry remained the same even though they are percentages of a larger workforce. Numbers participating in professional development increased substantially with almost 600 more workforce members having steps on the Oregon Registry in 2013 than did in 2012.These findings enable decision makers to assess both the strengths and weaknesses of this workforce as well as change over time, information that is critical for making informed decisions about investments in professional development.

Page | 36
References Burchinal, M., Howes, C., & Kontos, S. (2002). Structural predictors of child care quality in child care homes. Early Childhood Research Quarterly, 17, 87–105.
Cochran, M. (2007, September). Teacher and caregiver compensation: A crisis in the making. Zero to Three, 28(1), 42-47.
Early, D., Bryant, D. M., Pianta, R. C., Clifford, R. M., Burchinal, M. R., Ritchie, S., Howes, C., & Barbarin, O. (2006). Are teachers’ education, major, and credentials related to classroom quality and children’s academic gains in pre-kindergarten? Early Childhood Research Quarterly, 21, 174–195.
Early, D., Maxwell, K., Burchinal, M., Bender, R., Ebanks, C., & Henry, G. (2007). Teachers' education, classroom quality, and young children's academic skills: Results from seven studies of preschool program. Child Development, 78(2), 558-580.
Goldring, R., Taie, S., & Riddles, M. (2014, September). Teacher attrition and mobility: Results from the 2012-13 Teacher Follow-Up Survey. Washington, DC: IES National Center for Education Research. Retrieved on August 10, 2015 from http://nces.ed.gov/pubs2014/2014077.pdf
Hughes-Belding, K., Hegland, S., Stein, A., Sideris, J., & Bryant, D. (2012). Predictors of global quality in family child care homes: Structural and belief characteristics. Early Education and Development, 23(5), 697-712.
Kontos, S., Howes, C., Shinn, M., & Galinsky, E. (1995). Quality in family child care and relative care. New York, NY: Teachers College Press.
McCabe, A., Tamis-LeMonda, C. S., Bornstein, M. H., Cates, C. B., Golinkoff, R., Guerra, A. W., Hirsh-Pasek, K., Hoff, E., Kurchirko, Y., Melzi, G. , Mendelsohn, A., Paez, M., & Song, L. (2014). Multilingual children: Beyond myths and toward best practices. Social Policy Report of the Society for Research in Child Development, 27(4).
Oregon Center for Career Development in Childhood Care and Education (OCCD) and Oregon Child Care Research Partnership (OCCRP). (2014). Retrieved on July 6, 2015 from http://health.oregonstate.edu/sites/default/files/occrp/pdf/ccerr-2012-workforce-findings-final-10-24-2014.pdf
Peisner-Feinberg, E. S., Burchinal, M. R., Clifford, R. M., Yazekian, N., Culkin, M. L., Zelazo, J., Howes, C., Byler, P., Kagan, S. L., & Rustici, J. (1999). The children of the cost, quality, and outcomes study go to school. (Technical Report). Retrieved on July 3, 2014 from http://files.eric.ed.gov/fulltext/ED449883.pdf
Raikes, H., Wilcox, B., Peterson, C., Hegland, S., Atwater, J., Summers, J., Thornburg, K., Torquati, J., et.al. (2003). Child care quality and workforce characteristics in four Midwestern states. Lincoln, NE: The Gallup Organization.
Ryan, C. (2013). Language Use in the United States: 2011. US Department of Commerce, Economics and Statistics Administration, U.S. Census Bureau. American Community Survey Briefs, ACSBR/22. Retrieved from http://www.census.gov/prod/2013pubs/acs-22.pdf

Page | 37
Raikes, H., Torquati, J. C., Hegland, S., Raikes, A., Scott, J., Messner, L., et al. (2006). Studying the culture of quality early care and education. In M. Zaslow & I. Martinez-Beck (Eds.), Critical issues in early childhood professional development (pp. 111-136). Baltimore, MD: Brookes Publishing.
Ryan, S., & Whitebook, M. (2012). More than teachers: The early care and education workforce. In R. C. Pianta (Ed.), Handbook of early childhood education (pp. 92-110). New York: Guilford Press.
Shonkoff, J., & Phillips, D. E. (2000). From Neighborhoods to Neurons. Washington, D.C.: National Academy Press.
Tran, H., & Winsler, A. (2011). Teacher and center stability and school readiness among low-income, ethnically diverse children in subsidized, center-based child care. Children and Youth Services Review, 33, 2241-2252.
Torquati, J., Raikes, H., & Huddleston-Casas, C. A. (2007). Teacher education, motivation, compensation, workplace support, and quality of center-based child care and teachers' intention to stay in the early childhood profession. Early Childhood Research Quarterly, 22(2), 261-275.
Tout, K., Zaslow, M., & Berry, D. (2006). Quality and qualifications: Links between professional development and quality in early care and education settings. In M. Zaslow and I. Martinez-Beck (Eds), Critical issues in early childhood professional development. Baltimore, MD: Brookes Publishing.
U.S. Department of Labor, Bureau of Labor Statistics. (2013). May 2013 National Occupational Employment and Wage Estimates. Retrieved on July 5, 2014 from http://www.bls.gov/oes/2013/may/oes_nat.htm#25-0000
U.S. Census Bureau; American Community Survey, Table S01, 2011 3-year estimate for Oregon.
U.S. Census Bureau; American Community Survey, Table S01 2011-2013 3-Year Estimate and B01001A-I 2011-2013 3-Year Estimate and B03002.
Vu, J. A., Jeon, H-J., & Howes, C. (2008). Formal education, credential, or both: Early childhood program classroom practices. Early Education and Development, 19(3), 479-504.

For additional copies of this report, contact: Oregon Child Care Research Partnership,
OSU Family Policy Program 231 Hallie Ford Center
Corvallis, Oregon 97331 Telephone: (541) 737-9243
Email: [email protected]