Ore Geology Reviews -...
21
Contents lists available at ScienceDirect Ore Geology Reviews journal homepage: www.elsevier.com/locate/oregeorev Formation of epizonal gold mineralization within the Latimojong Metamorphic Complex, Sulawesi, Indonesia: Evidence from mineralogy, fluid inclusions and Raman spectroscopy Andy Yahya Al Hakim a,b, ⁎ , Frank Melcher a , Walter Prochaska a , Ronald Bakker a , Gerd Rantitsch a a Department of Applied Geosciences and Geophysics, Montanuniversität Leoben, Peter Tunner Strasse 5, 8700 Austria b Research Group of Earth Resources Exploration, Faculty of Mining and Petroleum Engineering, Bandung Institute of Technology, Ganesha 10, Bandung, 40132, Indonesia ARTICLE INFO Keywords: Orogenic gold Fluid inclusions Raman spectroscopy of carbonaceous material Awak Mas Salu Bullo ABSTRACT The gold deposits within the Latimojong Metamorphic Complex of Sulawesi, Indonesia, including Awak Mas and Salu Bulo, are estimated to host 50 tonnes Au with an average grade of 1.41 g/t. They are located within the metamorphic basement consisting of pumpellyite- to greenschist-facies metasedimentary and metavolcanic rocks, where gold precipitated in quartz veins that fill north-south striking normal faults and extensional frac- tures. The mineral assemblage is dominated by pyrite, chalcopyrite, galena, minor tetrahedrite-tennantite and sphalerite; gold is electrum with a low silver content (Au:Ag ratio of 8.5 to 9.1). Albite, dolomite-ankerite, siderite, chlorite, and white mica are the main alteration minerals. Quartz, albite and carbonate veins hosting H 2 O-bearing fluid inclusions with minor aqueous-carbonic phases (CO 2 ±N 2 ) were detected (mole frac- tion < 0.15). Raman microspectroscopy, microthermometry, and crush leach analysis of gold-bearing quartz veins and associated host rocks provide evidence for processes resembling those described for epizonal gold mineralization. The gold bearing fluids have salinities between 1.4 and 7.3 eq. mass% NaCl and were trapped in quartz at about 180–250 °C and < 1.27 kbar, corresponding to depths less than 5 km. Trapping conditions of barren veins are about 190–390 °C and < 1.15 kbar with salinities ranging from 2.2 and 6.1 eq. mass% NaCl. Halogen and alkali ratios (Na/Cl/Br/I) from crush leach analyses correspond to deposits originating from me- tamorphic fluids with a strong albitization signature during ore formation. Isothermal decompression during the retrogression stage mobilized large volumes of fluids, leading to significant gold mineralization within the Awak Mas District. 1. Introduction The Cretaceous Latimojong Metamorphic Complex (LMC) of Sulawesi, Indonesia, is host to several gold deposits. These include the Awak Mas, Salu Bullo, Tarra, and other satellite prospects (collectively referred to as the Awak Mas District, Querubin and Walters, 2012), with total indicated and inferred resources of 38.4 Mt at 1.41 g/t Au (Cube, 2017). There have been numerous models for the origin of the Awak Mas District, including orogenic gold deposit models (Hakim, 2017; Hakim et al., 2017; Hakim and Melcher, 2017b, 2016b, 2015; Harjanto, 2017; Harjanto et al., 2016a,b; Harjanto et al., 2015; Querubin and Walters, 2012; Tuakia et al., 2016). Several authors also invoked the role of intrusions and suggested a genetic model for intrusion-related gold deposits (Archibald et al., 1996; Meyer, 2016; van Leeuwen and Pieters, 2011). The most recent feasibility study also considered a high level, low-sulphidation epithermal system (Cube, 2017). Despite the fact that a number of studies have been undertaken in the Awak Mas District, many questions remain unanswered. These include the role of fluids in gold precipitation, the metamorphic history, the genetic model and timing of mineralization. Raman spectroscopy is an effective method to calculate the evolu- tion of carbonaceous material (CM) during regional metamorphism (Beyssac et al., 2002; Lünsdorf, 2015; Rantitsch et al., 2004). During metamorphism, CM transforms to anthracite, meta-anthracite, semi- graphite and graphite (Kwiecińska and Petersen, 2004; Rantitsch et al., 2016). Such materials are commonly associated with gold deposits in metamorphic basement, i.e. the Otago-Alpine Schists and the Macraes orogenic gold deposits, New Zealand (Craw and MacKenzie, 2016; Hu et al., 2015; Pitcairn et al., 2005) and the Suurikuusikko gold deposit- Kittilä, Northern Finland (Wyche et al., 2015). The presence of CM in https://doi.org/10.1016/j.oregeorev.2018.05.001 Received 9 January 2018; Received in revised form 29 April 2018; Accepted 1 May 2018 ⁎ Corresponding author at: Research Group of Earth Resources Exploration, Faculty of Mining and Petroleum Engineering, Bandung Institute of Technology, Ganesha 10, Bandung, 40132, Indonesia. E-mail address: [email protected] (A.Y.A. Hakim). Ore Geology Reviews 97 (2018) 88–108 0169-1368/ © 2018 Elsevier B.V. All rights reserved. T
Transcript of Ore Geology Reviews -...

Contents lists available at ScienceDirect
Ore Geology Reviews
journal homepage: www.elsevier.com/locate/oregeorev
Formation of epizonal gold mineralization within the LatimojongMetamorphic Complex, Sulawesi, Indonesia: Evidence from mineralogy,fluid inclusions and Raman spectroscopy
Andy Yahya Al Hakima,b,⁎, Frank Melchera, Walter Prochaskaa, Ronald Bakkera, Gerd Rantitscha
a Department of Applied Geosciences and Geophysics, Montanuniversität Leoben, Peter Tunner Strasse 5, 8700 Austriab Research Group of Earth Resources Exploration, Faculty of Mining and Petroleum Engineering, Bandung Institute of Technology, Ganesha 10, Bandung, 40132, Indonesia
A R T I C L E I N F O
Keywords:Orogenic goldFluid inclusionsRaman spectroscopy of carbonaceous materialAwak MasSalu Bullo
A B S T R A C T
The gold deposits within the Latimojong Metamorphic Complex of Sulawesi, Indonesia, including Awak Mas andSalu Bulo, are estimated to host 50 tonnes Au with an average grade of 1.41 g/t. They are located within themetamorphic basement consisting of pumpellyite- to greenschist-facies metasedimentary and metavolcanicrocks, where gold precipitated in quartz veins that fill north-south striking normal faults and extensional frac-tures. The mineral assemblage is dominated by pyrite, chalcopyrite, galena, minor tetrahedrite-tennantite andsphalerite; gold is electrum with a low silver content (Au:Ag ratio of 8.5 to 9.1). Albite, dolomite-ankerite,siderite, chlorite, and white mica are the main alteration minerals. Quartz, albite and carbonate veins hostingH2O-bearing fluid inclusions with minor aqueous-carbonic phases (CO2 ± N2) were detected (mole frac-tion < 0.15). Raman microspectroscopy, microthermometry, and crush leach analysis of gold-bearing quartzveins and associated host rocks provide evidence for processes resembling those described for epizonal goldmineralization. The gold bearing fluids have salinities between 1.4 and 7.3 eq. mass% NaCl and were trapped inquartz at about 180–250 °C and< 1.27 kbar, corresponding to depths less than 5 km. Trapping conditions ofbarren veins are about 190–390 °C and < 1.15 kbar with salinities ranging from 2.2 and 6.1 eq. mass% NaCl.Halogen and alkali ratios (Na/Cl/Br/I) from crush leach analyses correspond to deposits originating from me-tamorphic fluids with a strong albitization signature during ore formation. Isothermal decompression during theretrogression stage mobilized large volumes of fluids, leading to significant gold mineralization within the AwakMas District.
1. Introduction
The Cretaceous Latimojong Metamorphic Complex (LMC) ofSulawesi, Indonesia, is host to several gold deposits. These include theAwak Mas, Salu Bullo, Tarra, and other satellite prospects (collectivelyreferred to as the Awak Mas District, Querubin and Walters, 2012), withtotal indicated and inferred resources of 38.4 Mt at 1.41 g/t Au (Cube,2017). There have been numerous models for the origin of the AwakMas District, including orogenic gold deposit models (Hakim, 2017;Hakim et al., 2017; Hakim and Melcher, 2017b, 2016b, 2015; Harjanto,2017; Harjanto et al., 2016a,b; Harjanto et al., 2015; Querubin andWalters, 2012; Tuakia et al., 2016). Several authors also invoked therole of intrusions and suggested a genetic model for intrusion-relatedgold deposits (Archibald et al., 1996; Meyer, 2016; van Leeuwen andPieters, 2011). The most recent feasibility study also considered a high
level, low-sulphidation epithermal system (Cube, 2017). Despite thefact that a number of studies have been undertaken in the Awak MasDistrict, many questions remain unanswered. These include the role offluids in gold precipitation, the metamorphic history, the genetic modeland timing of mineralization.
Raman spectroscopy is an effective method to calculate the evolu-tion of carbonaceous material (CM) during regional metamorphism(Beyssac et al., 2002; Lünsdorf, 2015; Rantitsch et al., 2004). Duringmetamorphism, CM transforms to anthracite, meta-anthracite, semi-graphite and graphite (Kwiecińska and Petersen, 2004; Rantitsch et al.,2016). Such materials are commonly associated with gold deposits inmetamorphic basement, i.e. the Otago-Alpine Schists and the Macraesorogenic gold deposits, New Zealand (Craw and MacKenzie, 2016; Huet al., 2015; Pitcairn et al., 2005) and the Suurikuusikko gold deposit-Kittilä, Northern Finland (Wyche et al., 2015). The presence of CM in
https://doi.org/10.1016/j.oregeorev.2018.05.001Received 9 January 2018; Received in revised form 29 April 2018; Accepted 1 May 2018
⁎ Corresponding author at: Research Group of Earth Resources Exploration, Faculty of Mining and Petroleum Engineering, Bandung Institute of Technology, Ganesha 10, Bandung,40132, Indonesia.
E-mail address: [email protected] (A.Y.A. Hakim).
Ore Geology Reviews 97 (2018) 88–108
0169-1368/ © 2018 Elsevier B.V. All rights reserved.
T

organic-matter (OM)-rich shales can contribute to the sequestration ofmetals during sediment dewatering and ore deposition, because CM actas sources for metals during subsequent metamorphic processes (Huet al., 2015; Large et al., 2011). Alternatively, CM may also form fromhydrothermal fluids containing volatile organic compounds during golddeposit formation (Craw, 2002; Gu et al., 2012). However, links be-tween Raman spectra of carbonaceous material, pressure-temperature-depth estimation and the gold mineralization processes have receivedless attention.
It is the aim of this paper to use a combination of Raman and pet-rographic analysis to document the metamorphic temperature-pressureevolution within the LMC. We present results of a detailed investigationof the ore-related mineral assemblages and the fluid inclusion datacharacterizing the fluids involved in ore precipitation. Crush leachanalysis of quartz, carbonate and electron microprobe analysis ofchlorite and mica provide an insight into the physical and chemicalfactors controlling the ore-forming processes. The objectives of thispaper are (i) to trace the origin of ore-forming fluids, (ii) to construct agenetic model for the development of gold mineralization, and (iii) toreconstruct the metamorphic and post-metamorphic P-T path of the ore-hosting formation.
2. Geological setting
The Latimojong Metamorphic Complex (LMC, Fig. 1) is situated inthe Western Sulawesi arc, as part of a Late Cretaceous accretionarycomplex (van Leeuwen and Muhardjo, 2005; Wakita, 2000; White et al.,2017). It consists of moderately to strongly folded metamorphic rocks(phyllite, chlorite schist, metasandstone), tectonically mixed with vol-canic rocks (metamafic, volcaniclastic rocks) (Fig. 1b-c). Limited pa-leontological and radiometric data and comparison with the Bantimalaand Barru metamorphic complexes (South Sulawesi) suggest that thesedimentary protoliths of the LMC formed in the Early Cretaceous andaccreted to the Sundaland margin in the mid-Cretaceous (White et al.,2017), when the complex was deformed, underwent partly high-pres-sure metamorphism and became uplifted above sea level before theEocene (Bergman et al., 1996; Parkinson, 1998; White et al., 2017).
Electron microprobe analyses of clinopyroxene and chromian spinelphenocrysts hosted by metamafic and metatuffite in the LMC and wholerock analyses by XRF and ICP-MS indicate a strong island-arc basaltaffinity (Hakim, 2017). In multi-element spider diagrams, these maficmetavolcanic rocks show an extreme enrichment of Pb, Large Ion Li-thopile Elements (LILE, i.e. Cs, Rb, Ba) with respect to High FieldStrength Elements (HFSE, including Nb, Ta, Ti, P), Light REE (LREE, i.e.La, Ce, …) and Heavy REE (HREE, i.e., Yb, Lu, …). The protolith ofthese rocks appears to be equivalent to eclogites and blueschists ofBantimala, South Sulawesi, part of the thicker-crust environments(Oceanic Island Basalt-OIB or Island Arc Basalt-IAB) that were sub-ducted under the southeast margin of Sundaland Craton (Maulanaet al., 2013; Parkinson et al., 1998; Wakita et al., 1996).
The topography in the Awak Mas District is moderately to extremelyrugged, ranging from 800 to 1400m above sea level. The highest levelin close proximity to the area of Awak Mas is the summit of MountRantemario (3478m above sea level) on the Western margin of theproject area. Slope gradients are steepest within the southern to westernportions grading to moderate towards the northern and eastern sec-tions. Dense primary forest exists in the northern region and is generallyless accessible in regions of higher elevation. Major drainage systemsare Salu Siwa, Salu Lombok, and Salu Tolobo. The Salu Siwa is the mostdominant river and forms a north-south trending valley that appears tocoincide with a major suture zone dividing the Eastern Latimojongsequence from the Lamasi Complex (Fig. 1b-c).
The Lamasi Complex, part of the East Sulawesi Ophiolite (ESO)(Bergman et al., 1996; Kadarusman et al., 2004; Parkinson, 1998; Whiteet al., 2017), is situated east of the LMC (Fig. 1b-c). It is composed ofdioritic plutons, basaltic sheeted dykes, pillow lavas, greenstones and
tuff. The Lamasi Complex is intensely deformed, altered by ocean-floormetamorphism, and bounded by thrust faults. Generally, the maficcomponents of the Lamasi Complex have depleted Sr-Nd isotopes,MORB-like geochemistry, and possibly represent obducted MORB orback-arc oceanic crust (Bergman et al., 1996). Isotopic data (K-Ar,40Ar-39Ar, Rb-Sr and Sm-Nd) suggest Cretaceous to Eocene formationages (Bergman et al., 1996; Parkinson, 1998; Priadi et al., 1994). TheESO was obduction onto the Sundaland Craton at 30Ma, based on an K-Ar age of the metamorphic sole (Parkinson, 1998). By contrast, Whiteet al. (2017) suggested that the timing of ophiolite obduction was be-tween Early to Middle Miocene, and the Lamasi Complex may representEocene-Oligocene arc/back-arc volcanic rocks.
The Late Cenozoic magmatism in Western Sulawesi has been thesubject of much debate. The hypotheses proposed can be divided intotwo groups: (i) a collision event caused crustal/lithospheric thickening,followed by melting in the lower crust to give rise to magmatism(Bergman et al., 1996; Polve et al., 2001; Polvé et al., 1997; Priadi et al.,1994), and (ii) an extensional tectonic regime in the mid-Miocenecausing astenospheric mantle uprising, resulting in shoshonitic to ultra-potassic magmatism and CAK magmatism in Central West and NorthWestern Sulawesi, underlain by a Cretaceous continental fragment andsubjected to strong uplift in the Pliocene (Hall and Wilson, 2000;Maulana et al., 2016; van Leeuwen et al., 2010; White et al., 2017).Based on our fieldwork campaign and drill hole observations in theAwak Mas District, intrusive rocks within this complex are rare. Most ofthe rocks are metamorphosed and none of the above scenarios aresupported by the outcrop evidence. Pumpellyite, epidote and actinoliteobserved in clinopyroxene-phyric metamafic and metatuffite from theSalu Bullo deposit are indicator minerals for high-pressure low-tem-perature metamorphism, and most likely represent subduction-relatedmetamorphism processes during the Cretaceous (Hakim and Melcher,2017a).
Soesilo (1998) distinguished three deformational phases in the La-timojong Mountains. (i) Initial deformation and metamorphism of si-liciclastic, volcanic and carbonate rocks. Metamorphism in the zeoliteto pumpellyite – actinolite facies reached temperatures of 310–350 °Cand pressures of 3–4.5 kbar, corresponding to a depth of> 9 km. (ii)Ductile deformation, blueschist- to greenschist-facies metamorphism ofmetasedimentary and metavolcanic rocks, characterized by pumpel-lyite-actinolite and glaucophane in metavolcanic rocks. The estimatedtemperature and pressure of> 350° C and> 6 kbar and further in-creased up to 550 °C in the low amphibolite facies (Soesilo, 1998). Finalstage (iii) brittle deformation comprised the formation of chlorite andcalcite as crack fillings.
During exploration work since the early 1990s in the LMC, morethan a thousand drill-holes with a total aggregated length of 118,081myielded estimated total resources of 38.4Mt (cut-off grade of 0.5 g/t)(One Asia Resources, 2017). Total gold contents of 50 tonnes at 1.41 g/tAu exceed the gold exploited in several historic gold mines in Indonesia(Garwin et al., 2005). Gold in the Awak Mas and Salu Bullo deposits(Fig. 1c) precipitated as laminated veins or lenses within obliquenormal faults, extensional shears and fractures as well as in the hostmetasediments and metavolcanic rocks (Fig. 2). Early and late-mineralfaulting dominates within the structures, with late-mineralization faultsas host to the main veins.
The Awak Mas deposit (average grade 1.4 g/t) consists of five orebodies dipping between 15° and 50° towards the north and dissected bythree major N-S-trending faults. The ore bodies at Awak Mas can betraced along strike for up to 800m and range from several meter up to70m thick (One Asia Resources, 2017). The mineralized zone cuts ametasedimentary sequence (phyllite, carbonaceous phyllite, chloriteschist; Fig. 3a-b) with associated brecciation and stockwork quartz veindevelopment.
The Salu Bullo deposit, situated 2 km to the southeast of the AwakMas deposit, is considered to be analogous to the Awak Mas deposit, butwith a more dominant sub-vertical structural control. Accretion of
A.Y.A. Hakim et al. Ore Geology Reviews 97 (2018) 88–108
89

ophiolite rocks onto metasedimentary sequences by the major, north-northwest striking Lamasi-Latimojong thrust are the main structuralfeatures in the Salu Bullo region. The host rocks are metamafic, meta-tuff, hematitic mudstone, with some relics of preserved magmatic mi-nerals in metamafic (clinopyroxene, chromian spinel). Mafic meta-volcanic rocks and hematite mudstone alteration are abundant in SaluBullo and serve as important indicators to distinguish between theAwak Mas and Salu Bullo deposits.
The four ore bodies at Salu Bullo (Freddie, Bandoli, Biwa andLelating veins) overprint ductile deformation and are related to (i)quartz vein stockworks and (ii) quartz – albite – pyrite – chlorite al-teration. The Salu Bullo deposit has an average grade of 2.5 g/t, typi-cally associated with pinch-and-swell vein systems varying in widthbetween<1 and 30m, that are commonly parallel in fissures along a1.5 km strike length. There are zones of carbonatization (side-rite+ ankerite), chloritization and albitization, with high Au/Ag ratio
(8.5:1 to 9:1) in gold based on electron microprobe observations(Hakim and Melcher, 2016a). Currently (early 2018) the gold project isin an advanced feasibility study stage.
3. Samples and methods
Representative vein and host rock samples from the Awak Mas andSalu Bullo deposits were collected from outcrops and twelve drill holes(Fig. 2 and Appendix A).
3.1. Petrography
Sixty-two polished thin sections of the the gold-bearing veins andtheir host rocks have been studied from the LMC and the overlyingLamasi Ophiolite unit. Petrographic descriptions of veins and host rockswere performed at the Chair of Resource Mineralogy,
Fig. 1. (a) Simplified geological map of the Latimojong Metamorphic Complex and its surrounding (Djuri et al., 1988). Research area is highlighted by square. (b)General map of the Latimojong metamorphic complex in South Sulawesi with location of the studied ore deposits (modified after Archibald et al. 1996; One AsiaResources Limited, 2013).
A.Y.A. Hakim et al. Ore Geology Reviews 97 (2018) 88–108
90

Montanuniversität Leoben using an Olympus BX60 microscope. Themineralogical composition was determined using a scanning electronmicroscope ZEISS EVO MA 10 equipped with a secondary electron (SE)and a back-scattered electron (BSE) detector at the Chair of Geologyand Economic Geology, Montanuniversität Leoben. The scanning elec-tron microscope (SEM) was equipped with a BRUKER Nano Xflash430M energy dispersive X-ray (EDX) detector. The instrument operatedat 15–20 keV accelerating voltage, a 30 µm aperture size and a10–11mm free working distance.
3.2. Electron microprobe analysis
The electron microprobe analyses were conducted using a JEOL JXA8200 at the Chair of Resource Mineralogy, MU Leoben, to determine thechemical composition of chlorite and mica. The electron beam was setto 15 keV with 10 nA beam current and a beam diameter of 1 µm. Thefollowing diffracting crystals were selected: TAP for Na and Al; PETJ forCa, Mg and Si; PETH for K; and LIFH for Fe, Ti and Mn. As a referencematerial for mica, sanidine is used for Na and K, albite for Al and Si,wollastonite for Ca, kaersutite for Mg, almandine for Fe, rutile for Ti,rhodonite for Mn. For chlorite, albite is used for Na and Al, wollastonite
for Ca, sanidine for K and Si, phlogopite for Mg, kaersutite for Fe, rutilefor Ti, rhodonite for Mn and synthetic Cr2O3 for Cr. The acquisitiontime of analysis is 20 s for peak and 10 s for background. The Solarissystem software provided by JEOL is used to perform the ZAF correc-tion.
3.3. Raman spectroscopy on carbonaceous materials and fluid inclusions
Nine samples of carbonaceous material from graphitic schist andcarbonaceous breccias (Table 1) were separated chemically from othermineral phases (Rantitsch et al., 2004). Raman measurements wereperformed using a Jobin Yvon LABRAM Raman microprobe using anNd-YAG laser with the wavelength 532 nm and a 10x objective. Toobtain a better signal to noise ratio, five scans with an acquisition timeof 30 s in the 700–2000 cm−1 region were summed to a compositespectrum. Ten spectra were recorded for each sample. Numerical ana-lysis of the Raman spectrum was performed using the fitting procedureof Lünsdorf et al. (2014).
Vapour and liquid phases of single inclusions within quartz werealso analysed using the laser Raman probe. The laser spot on thesamples was focused approximately to a diameter of one µm. For the
Fig. 2. Bore hole sample distribution used for this study.
A.Y.A. Hakim et al. Ore Geology Reviews 97 (2018) 88–108
91

analysis of CO2, N2, and CH4 vapour phases, spectra were recorded from1000 to 3800 cm−1 using a single 20-s integration time per spectrum.All inclusions for microthermometric analysis were observed carefullyusing Raman spectroscopy to confirm the composition of the vapourphases. Fityk 0.9.8 open-source software was used to deconvolve theRaman spectra of inclusions.
3.4. Microthermometry
Samples were taken from representative drill core profiles andoutcrop through the ore zones. Twenty-two double-polished sections,which represent the various hydrothermal alteration systems with andwithout gold mineralization were examined petrographically, and ofthese nine samples were selected for microthermometric analysis(Appendix A).
A transmitted light microscope was used to obtain information onthe relative formation chronology and paragenetic sequences of the FI.
Microthermometric data were collected using a Linkam THSMG 600heating and freezing stage equipped with a microscope with objectivemagnification of 100×. Calibration was done by using synthetic fluidinclusions with a melting point of CO2 at−56.6 °C, the melting of waterat 0.0 °C and the critical homogenization temperature of water at374.0 °C. The precision within the low temperature range is estimatedto be 0.1 °C.
The volume fraction of fluid inclusions was determined by mea-suring the vapour bubble diameter at room temperature using the100× magnification objective lens. Calculation of perimeter and areaof vapour was obtained by drawing the fluid inclusion along the peri-meters of the inclusion and vapour bubble using ImageJ software(Bakker and Diamond, 2006). For optimal measurements, large, regularand near-surface inclusions were considered to minimize the error. Forirregular shaped inclusions, volume fractions were calculated using thePVTX properties as an input of the BULK software (Bakker, 2003).
The software package CLATHRATES (Bakker, 1997) and FLUIDS
Fig. 3. Photographs of diamond drill core samples of the host rocks and mineralization. (a) Phyllite consisting of quartz – siderite – muscovite with carbonatealteration. This sample is mineralized with abundant sulphide and sulphosalt. (b) Carbonaceous phyllite composed of carbonaceous material, carbonate, quartz andalbite. (c) Mineralized hematitic mudstone crosscut by late carbonate veinlets. Silica alteration. (d) Quartz veins with carbonate – albite alteration in metabasite. (e)Quartz – pyrite ± hematite veinlet in breccia veins. (f) Breccias composed of quartz clasts, containing coarse grained sulphides. (g) A photograph of lithologicalcontact between phyllite and carbonaceous phyllite. Sulphides are abundant in graphite band.
A.Y.A. Hakim et al. Ore Geology Reviews 97 (2018) 88–108
92

(version 1) (Bakker, 2003) were used to calculate fluid properties offluid inclusions from Raman spectroscopy, microthermometry and vo-lume fraction based on optical measurements. Program ICE from thepackage CLATHRATES (Bakker, 1997) was used to calculate bulk fluidproperties at Q1 conditions based on Tm(ice), Tm(clathrate), gas com-position and volume-fraction composition. The properties of low-den-sity gas mixtures are calculated with the equations from Peng andRobinson (1976). Furthermore, the equation of state of Duan et al.(1995, 1992a,b) was selected for fugacity calculations in clathrateequilibrium. The isochores that result from the output of ICE and BULKsoftware were further calculated using software ISOC (Bakker, 2003).The equations of state of Anderko and Pitzer (1993) and Duan et al.(1995) were used to calculate the isochores in the H2O-CO2-CH4-NaClfluid system.
3.5. Crush leach analysis on bulk samples
Sixty-three quartz and fourteen carbonate samples were selected forcrush leach analysis as described in Banks and Yardley (1992), Bankset al. (2000) and Gleeson (2003). Quartz samples were treated withHNO3 in a sand bath to remove possible contaminations. 1- to 2-mmquartz and carbonate grains were cleaned by boiling and washing threetimes in milli-Q water. About 1 g dried sample was transferred to anagate mortar, 5 mL of milli-Q water was added and samples were cru-shed for 2min for carbonate and 3min for quartz. The solutions werefiltered through 0.2-µm nylon filters prior to analysis. The leachateswere analysed for F−, Cl−, Br−, I−, SO4
2− by ion chromatography(Dionex DX-500) with a micro membrane suppressor. Cations (Li+,Na+, K+, Mg2+, Ca2+) were analysed in aliquots of the same solutionby a Dionex DX-120 system.
4. Results
4.1. Petrography
All rocks were petrographically and mineralogically studied in po-lished thin sections. The samples have been subdivided into two majorgroups: metasedimentary and metavolcanic rocks. The list of samplesand details petrographical observations from the Awak Mas and SaluBullo are available in Appendix A.
4.1.1. Metasedimentary rockThe metasedimentary unit in the Awak Mas region includes phyllite,
carbonaceous phyllite, chlorite-phengite schist and metasandstone-metasiltstone, whereas metasedimentary rocks in Salu Bullo are domi-nated by hematitic mudstone and metasandstone-metasiltstone.
Phyllite is composed of well-orientated quartz, white mica (phen-gite), siderite and albite (Fig. 3a). Augen, mottled and flaser texturesare commonly observed. Rutile, apatite, zircon, monazite, xenotime andtourmaline occur as accessory minerals. Some of the apatite has acoarse grain size up to 1mm in diameter; monazite and zircon are lessthan 40 µm and 80 µm, respectively. Sulphide and sulphosalt mineralsare preserved either parallel to or cutting foliation.
Carbonaceous phyllite contains thin carbonaceous layers (less than1 cm; Fig. 3b) and is commonly deformed with notable angular lithicclasts of quartz, chlorite and calcite (Fig. 3 g). The constituent mineralsare graphite, quartz, albite, phengitic mica, with small amounts ofsiderite, apatite and opaque minerals with framboidal along the folia-tion planes. Carbonaceous phyllite may contain gold, galena, mercuriantetrahedrite, sphalerite. Deformed carbonaceous phyllite is altered bychlorite.
Chlorite-phengite schist is a highly deformed rock, composed ofchlorite, phengitic mica, with porphyroclasts of quartz, Fe-chlorite(chamosite) and pyrite. The foliation is intense and phengite showsremarkable parallelism to foliation. In addition, the rock is segregatedinto chlorite-rich and phengite-rich domains parallel to schistosity.
Minor apatite, calcite and rutile are observed as accessory minerals. Theabundance of chlorite and albite as well as the absence of quartz andmuscovite may imply a protolith with a mafic composition. Opaqueminerals are pyrite, chalcopyrite and galena.
Metamorphosed quartz sandstone (metasandstone to metasiltstone)is a massive crystalline rock essentially composed of quartz. The mi-neral assemblage is quartz, albite and minor hematite, and the rock iscommonly altered by carbonate and/or sericite.
Hematitic mudstone is a red to brown fine-grained rock (Fig. 3c)amd the mineralogy comprises albite+ quartz+ calcite+ ru-tile+ apatite+monazite with abundant sulphide (pyrite, chalcopyrite,sphalerite), sulphosalt (tetrahedrite-tennantite), galena, sphalerite andgold. This lithology has high gold grades (i.e. 8.94 ppm Au). It may beinferred that the hematitic mudstone is a product of intensive hydro-thermal alteration.
4.1.2. Metavolcanic rocksThe most striking host rocks difference between the Awak Mas and
Salu Bullo is the presence of mafic metavolcanic rocks, which are re-stricted to the upper part of the sequence at Salu Bullo. These areclinopyroxe- or plagioclase-phyric metamafics, chlorite-actinolite schistor greenschist, metatuff and meta-andesite. Volcanoclastic materials areincluded in this description because most magmatic components(clinopyroxene, chromian spinel) are often still preserved.
Clinopyroxene- or plagioclase-phyric metamafics retain some relicigneous minerals and textures, including primary magmatic mineralssuch as pyroxene (augite), plagioclase, Fe-Ti oxide and chromiumspinel. Primary clinoyproxene is commonly observed as coarse grains,sometimes up to 1mm and is partially altered by chlorite or actinolite.Chromium spinel forms euhedral – subhedral grains with variable sizeranging from<10 µm up to 80 µm in diameter; they occur as inclusionsin clinopyroxene phenocrysts or in silicate matrix (Hakim and Melcher,2017a). Plagioclase is altered to pure albite, chlorite, epidote or sericite.
The greenschist (Fig. 3d) described in this study is a metamaficcommonly composed of pumpellyite+ epidote+ actino-lite+ quartz+ albite+ sphene+ calcite. Chromian spinel is highlydeformed, anhedral, generally less than 50 µm in diameter and com-monly surrounded by chlorite and pumpellyite.
Metatuffite is characterized by a variable concentration of compo-nents, including tuff and bioclastic materials. These rocks have greenishto gray colors and are fine-grained with veins filled by late-stage calcite,quartz or albite. Petrographic observations indicate that the volcani-clastic rocks are metamorphosed to greenschist facies. This rock con-tains well preserved relic clinopyroxene and chromian spinel that arereplaced by chlorite, quartz, albite, with minor actinolite, sericite andclay minerals.
Meta-andesite is a medium greenish-gray fine grained rock in whichno quartz can be seen macroscopically. Thin sections show that meta-andesite consists mainly of albite, minor quartz, calcite, siderite-an-kerite (confirmed by SEM-EDS) and hematite. Albite is altered to ser-icite. The meta-andesite sometimes preserves augite relics and epidote,and can be best classified as basaltic meta-andesite.
4.2. Hydrothermal alteration and mineralization
All rocks from drill core are moderately to intensely hydrothermallyaltered, strongly influenced by the host rock composition. Silica, car-bonate, white mica and albite alteration are distinguished.Sericitization is observed in mafic metavolcanic rocks. The proximalalteration is mainly albite and silica whereas most distal alteration isdominated by secondary chlorite, calcite and lacks hydrothermal sul-phide minerals. Chlorite and dolomite-ankerite occur in the alteredmafic host rocks (Fig. 4c).
Silicification is characterized by the replacement of initial mineralsby quartz accompanied by the deposition of sulphides (mainly pyrite-chalcopyrite) and extends from the veins outward into the host rock.
A.Y.A. Hakim et al. Ore Geology Reviews 97 (2018) 88–108
93

Minor siderite is also present as thin rims around sulphides (Fig. 4e).Albite alteration is observed in host rocks of all compositions (Fig. 4f).Argillic alteration (kaolinite) is less common.
The presence of oxide and sulphide – sulphosalt assemblages inaddition to disseminated pyrite provides a diagnostic feature to dis-tinguish three vein types in a chronological order as: (i) quartz – pyrite
Au veins, (ii) quartz – pyrite ± sulphosalt Au veins, and (iii) barrenveins.
Quartz – pyrite Au veins. The first type of gold mineralization is foundin stockworks of pyrite with lesser amount of hematite (Fig. 4g); galenaand sphalerite are minor sulphides with gold enclosed in coarse-grained(> 100 μm) pyrite. Based on crosscutting relations, quartz – pyrite Au
Fig. 4. Photomicrographs of borehole samples. (a) XPL image of three generations of pyrite observed in phyllite: framboidal pyrite (py1) and euhedral pyrite (py2)parallel to foliation; py3 crosscutting foliation. (b) XPL image of framboidal pyrite in mica schist. (c) Electron back-scattered image of galena associated withframboidal pyrite. Silicate is albite. (d) Back-scattered image of chromian spinel grains surrounded by chlorite – pumpellyite – actinolite – albite. Chlorite contains upto 0.78 wt% Cr2O3. (e) PPL image of complex sulphide ± sulphosalt assemblage rimmed by siderite. (f) Back-scattered image of Hg-tetrahedrite containing up to16.71 wt% Hg. (g) Veinlet of platy hematite host in phyllite. (h) Gold (bright phases) inclusions in pyrite. Abbreviations after Whitney, Evans (2010). Ab:albite,Act:actinolite; Au:electrum; Car:carrolite; Ccp:chalcopyrite; Chl(Cr): chromian chlorite; Chr:chromian spinel; Cv:covellite; Dol:dolomite; En: enargite; Hem:hematite;Hg-Ttr: mercurian tetrahedrite; Ph:phengite; Py:pyrite; Sd:siderite; Tnt:tennantite; Ttr:tetrahedrite; Pmp:pumpellyite; Qz:quartz.
A.Y.A. Hakim et al. Ore Geology Reviews 97 (2018) 88–108
94

veins are often cut by later generations of barren veins, (i.e. calcite –hematite veinlets). Hematite is tabular, disseminated, and homo-geneous without any exsolution textures. Rutile and sphene occurcommonly in this vein type, associated with a silica+ albite alteration.
Quartz – sulphide (sulphosalt) Au veins. The second type of gold mi-neralization is characterized by disseminated pyrite with Cu-As-Sb-Zn-Fe-(Pb) minerals (i.e. chalcopyrite, tetrahedrite-tennantite, sphalerite).Almost all gold occurs as inclusions in pyrite with less free gold inquartz, and the grain size of gold ranging from 2 to 50 μm (average of10 μm). This type of vein often hosts high gold grades (up to 10–15 g/t).Both vein types (quartz – pyrite Au veins and quartz – sulphide (sul-phosalt) Au veins) are structurally controlled.
Barren veins. Barren veins consist of open-space fillings by quartzand/or albite+ carbonate (mainly dolomite). Data indicate that theseveins contain less than 0.5 ppm of Au and are of little economic interest.Barren veins are widespread in all mineralization stages.
Beside the ores described above, high-grade gold also occurs in theoxidation zone near the surface at Salu Bullo, in hematitic mudstone,breccia quartz-albite veins, and in thin quartz veins within the carbo-naceous phyllite at Awak Mas. Processes of surficial oxidation haveextensively altered iron sulphides, so that much of the gold was re-leased from the sulphides. Supergene gold grade reaches up to 13 ppmin this zone with most gold occurring as a free gold, mainly in quartz. Incarbonaceous phyllite at Awak Mas, sulphides commonly occur withingraphite layers, with gold contents generally lower than 1 ppm.Sulphides mainly consist of pyrite, chalcopyrite, galena, tetrahedritewith minor sphalerite and rare native bismuth.
Three pyrite generations are observed. The first phase (Py1,
Fig. 4a–c) comprises finely disseminated grains of diagenetic, fram-boidal pyrite within gray to dark mica schist, phyllite or carbonaceousphyllite. The size of Py1 ranges from 10 to 50 μm, with some framboidalpyrite is partially replaced by galena (Fig. 4c). The second phase pyrite(Py2) shows euhedral to subhedral cubic shapes, ranging from 20 μm upto several hundred microns (Fig. 4a). This type of pyrite consists ofpyrite bands that are coarse grained and parallel to bedding. The thirdphase (Py3) is a late hydrothermal pyrite that mainly occurs as largecubes up to millimeter size; it is idiomorphic, crosscutting bedding, ordisseminated and associated with quartz veins (Fig. 4a). Hydrothermalpyrite (Py3) often over-grows earlier pyrite generations. The results ofelectron microprobe and in situ laser ablation-inductively coupled massspectrometry in different types of pyrite provide evidence for traceelement enrichment of Co, Ni, As with low Cu, Zn, Se, Bi, Au, and Ag(Hakim, 2017).
Chalcopyrite in the Awak Mas and Salu Bullo deposits occurs asdifferent textural types: (i) as inclusions in pyrite, (ii) as free grains insilicates (quartz, albite, pumpellyite) or carbonates, or (iii) as randomlydispersed blebs in sphalerite (“chalcopyrite disease” of Barton Jr. andBethke, 1987. Chalcopyrite is often replaced by tetrahedrite-tennantiteand covellite (Fig. 4b). Bornite is a trace mineral (less than 5 μm inlength) and is replaced by pyrite.
Chalcopyrite is found to have a strong correlation with sulphosaltminerals. Minor and trace sulphosalt minerals are tennantite, tetra-hedrite, and enargite (Fig. 4h). They show a wide compositional var-iation, ranging between the As and Sb end-members. The disseminated,anhedral grains usually are intensely zoned due to Sb-As substitution.Based on electron-microprobe analyses of sulphosalts, tetrahedritess
Fig. 5. Simplified paragenetic sequence of main ore and alteration minerals in the Awak Mas and Salu Bullo deposits.
A.Y.A. Hakim et al. Ore Geology Reviews 97 (2018) 88–108
95

shows replacement of Cu by Hg, with some samples containing elevatedHg contents up to 17.28 wt% (Hakim and Melcher, 2016a) (Fig. 4f).Enargite/luzonite forming grains up to 100 µm in size is also notable inthis vein type. The stoichiometry of enargite/luzonite calculated fromthe electron microprobe ranges from Cu3.06As0.93Sb0.07S4 toCu3.08Sb0.84As0.20S4 (Hakim and Melcher, 2016a). Carrolite and covel-lite occur as trace minerals (Fig. 4e). Rare bismuthinite (3 µm in dia-meter) hosted by chalcopyrite and one grain of native bismuth (4 µm indiameter) surrounded by kaolinite are also reported from the studiedsamples (Appendix A). However, it is important to note that bismuth,bismuthinite and kaolinite are uncommon minerals in the Awak MasDistrict. The ore mineral paragenesis and mineral abundances are givenin Fig. 5.
4.3. Electron microprobe analysis of chlorite and mica
The chlorite occurs as vesicle fillings or in veinlets, mostly in mafichost rock or chlorite schist. In the optical microscope, the chlorites haveblue and green birefringence colours. In total, eighty-two electron mi-croprobe analyses were obtained from seven samples. Chlorite fromSalu Bullo has higher Mg-number [100×Mg/(Mg+Fetot)= 43.6–73.6] than at Awak Mas (Mg-number= 27–54.1)(Table 1a). Silica contents vary from 5.28 to 6.24 cations per 28 oxy-gens. The ternary diagram of the relative atomic proportions of Al, Fe,and Mg shows that chlorite from Salu Bullo falls into the chlinochlorefield, while chlorite in Awak Mas is classified as chamosite (Fig. 6a).Some samples (S53-50.20; greenschist and A687-157.90; chloriteschist) contain elevated amount of Cr2O3 (up to 0.78 wt%) and TiO2
(average of 1.67 wt%, n= 5).SEM and electron microprobe analyses show that much of the
phyllite consists of fine-grained white mica interlayered withAb+Qz+Sid ± Cc ± graphite. Twenty-four spot analyses of whitemica were performed. The Si content in mica ranges between 3.2 and3.51 per formula unit (average of 3.37 per formula unit) and Al be-tween 1.91 and 2.58, indicating a strong phengitic substitution(Table 1b and Fig. 6b). The complete chlorite and mica datasets aregiven in the Electronic Appendix B.
4.4. Fluid inclusion petrography
Fluid inclusions in various assemblages occur in quartz, dolomiteand plagioclase (albite). We focus on quartz and dolomite because mostinclusions in albite occur as cloudy, irregular inclusions less than 5 µmin diameter, which may be regarded as secondary inclusions.
4.4.1. Fluid inclusions in quartz – pyrite Au veinsPyrite ± hematite-Au quartz veins are represented by samples
MP01.1, MP02 and MP03 (Table 2). Based on the compositional types
of fluid inclusion, three different types are distinguished: low salinityaqueous inclusions with CO2 (type I), H2O-NaCl (type II) and H2O-NaClcontaining solid phases (type III).
Quartz: inclusion type I. The inclusions contain liquid-vapour CO2 orvapour CO2-liquid H2O at room temperature with sizes between 5 and15 µm (Fig. 7a–c). Inclusions occur isolated and scattered in quartzveins, which may imply a primary origin (Fig. 7a). H2O with minoramounts of CO2 are the main volatiles in the measured fluid inclusions(Fig. 8a-b). Quartz from the early-stage veins (sample MP02) is char-acterized by strong deformation textures and shows polygonal grainswith grain boundaries meeting at 120-degree angles. Regular shapedinclusions are less common (Fig. 7b).
The volume fraction of vapour is about 0.14–0.15 with CO2 withmole fraction less than 0.15 (χvap= 0.10 to 0.144) (Table 2). Minor N2
was detected in some of the inclusions with some low-ordered graphite(Fig. 8b).
Quartz: inclusion type II. Type II inclusions are one-phase (LH2O) ortwo-phase (VH2O + LH2O) liquid-rich aqueous inclusions (Fig. 7d andFig. 8b). They generally have round (Fig. 7d), irregular (Fig. 7i) to el-liptical shapes, ranging from 5 to 40 µm in diameter. These mostabundant inclusions occur in clusters and sometimes as trails alonghealed fractures, which do not cut across the crystal boundaries ofquartz. These features suggest a primary or pseudo-secondary origin.
Quartz: inclusion type III. These inclusions are one-phase inclusionswith locally small opaque mineral inclusions that were identified asanatase (5 µm in size) using Raman spectroscopy (sample MP02). Theinclusions contain about 10 vol% liquid phase at room temperature(Table 2).
4.4.2. Fluid inclusions in quartz – sulphide (sulphosalt) Au veinsQuartz: inclusion type-II. Observations for this type of inclusions are
based on samples A685-5, A676-73.10 and A685-20. The inclusions arerelatively large, 5 to 20 µm in diameter and have regular shapes. Thevolume fraction of vapour ranges from 0.12 to 0.21 (Table 2).
Quartz: inclusions type-III. Type III inclusions are one-phase (LH2O)inclusions with small trapped solid phases; they reach up to 12 µm(Fig. 7f) and have irregular shapes. The inclusions are randomly dis-tributed in the quartz crystals. Solid phases were identified as quartz,calcite or tourmaline by Raman spectroscopy (Fig. 8d). These mineralsmay be regarded as accidentally trapped crystals.
4.4.3. Fluid inclusions in barren veinsQuartz: inclusion type II. Inclusions in sample GRS08 range from 5 to
20 µm in size and have regular to irregular elongated shapes. SampleA687-235 also contains barren veins. Volume fractions of FI frombarren quartz veins in samples GRS08 and A687-235 are highly vari-able, ranging from 0.15 to 0.25 and from 0.10 to 0.38, respectively(Table 2). Fig. 7g illustrates type-II fluid inclusions in quartz with
Table 1aChemical parameters (mean and range) of Mg-rich chlorite in the Salu Bullo and Fe-rich chlorite in the Awak Mas.
Salu Bullo S66-122.50 S68-84.55 S68-69 S68-47 S53-50.20 S68-39.10 S68-34.90
Number of analyses 6 2 10 12 13 15 10Elevation (m) 948.26 971.14 984.48 1002.5 1005.88 1008.97 1012.41Depth (m) 106.90 118.53 56.52 38.50 41.12 32.03 28.59wt% TiO2 0.02 (0–0.08) 0.16 (0–0.3) 0.02 (0–0.06) 0.01 (0–0.05) 0.02 (0–0.06) 0.01 (0–0.03) 0–0.04Mg-number 49.5 (43.4–53.3) 55.4 (54.6–56.1) 66.2 (61.9–71.8) 72.2 (70–73.6) 72.1 (71.1–72.9) 69 (66–72.2) 71.6 (69.3–73.1)T (°C) 308 (296–325) 300 (291–308) 272 (252–289) 257 (234–280) 260 (236–276) 253 (227–272) 260 (243–276)
Awak Mas A685-171 A687-157.90 A192-155.70
Number of analyses 4 5 5Elevation (m) 1033.91 1043.25 1059.51Depth (m) 148.09 136.75 135.19wt% TiO2 0.48 (0.09–1.10) 1.67 (0.01–5.47) 0.38 (0–1.36)Mg-number 31.6 (27–32) 47.4 (45.5–52.9) 37.3 (34.1–39)T (°C) 372 (362–376) 321 (269–346) 359 (347–373)
A.Y.A. Hakim et al. Ore Geology Reviews 97 (2018) 88–108
96

variable volume fractions.Dolomite: inclusion type II. Fluid inclusions in dolomite are regular
shaped inclusions between 5 and 10 µm in diameter (Fig. 7e). SampleA687-235-dol contains two-phase (VH2O+ LH2O) liquid-rich aqueousinclusions (type II), with a highly variable volume area fraction be-tween 0.12 and 0.46 (Fig. 7h).
4.5. Microthermometry
4.5.1. Fluid inclusion in quartz – pyrite Au veinsThe melting temperature of solid CO2 in type I inclusions [Tm
(CO2)] ranges between −57.5 and –56.6 °C (Fig. 9a, see ElectronicAppendix D). This is close to the triple point of pure CO2 (−56.6 °C)and indicates that the gas phase is mainly composed of CO2 with somecontribution of N2 (Fig. 8b). Clathrate completely dissolves (Tm clath-rate) at temperatures between 8.6 and 9.9 °C (Fig. 8b) with the presenceof liquid and vapour CO2. Homogenization temperatures of aqueous-carbonic CO2 [Th (CO2)] ranges from 25.4 to 31 °C (Fig. 8c).
The final dissolution of ice (Tm ice) occurs in a narrow temperaturerange between −3.6 and −2.8 °C (Fig. 8b). Liquid and vapour phaseshomogenize from 146.3 to 177.5 °C (Fig. 9a). Densities of the bulk typeI inclusions are relatively homogenous, between 0.96 and 0.99 g/cm3
Fig. 6. Composition of chlorite and mica obtained by electron microprobe analyses. (a) Ternary diagram of chlorite. (b) Classification of representative white micaphases in the diagram Si vs. Al. (c) Graphical chlorite geothermometer after Bourdelle and Cathelineau (2015). (d) Chlorite geothermometer based on Kranidiotis andMacLean (1987) for bore hole SBD068.
Table 1bChemical parameters (mean and range) of Mg-rich mica in the Salu Bullo and Awak Mas deposits.
S68-47 A192-155.70 A683-53.60 A149-81.15
Number of analyses 1 9 5 5Elevation (m) 1002.5 1059.1 1079.91 1119.87K/(K+Ca+Na) 0.99 0.97 (0.95–0.98) 0.97 (0.94–0.99) 0.96 (0.95–0.98)wt% K2O 10.49 9.99 (8.39–10.95) 9.44 (7.36–10.93) 9.30 (9.09–9.62)Si (a.p.f.u) 6.84 6.63 (6.39–6.86) 6.75 (6.52–6.92) 6.97 (6.91–7.02)Al (a.p.f.u) 3.79 4.69 (4.34–4.83) 4.59 (4.13–5.17) 4.56 (4.52–4.60)Mg-number 70.8 56.1 (42.7–65.7) 59.5 (49.3–66.1) 98.8 (97.5–99.9)Pressure (kbar)* 8.2 (7.8–8.5) 7.3 (4.2–9.7) 7.9 (4.6–11.1) 11.1 (10.4–13.1)Temperature (°C) 257 (234–280)1 360 (327–377)2 395 (361–405)2 372 (339–393)3
* Calculated using phengite barometry of Massonne and Schreyer (1987).1 Chlorite geothermometry from the same sample (this study).2 Graphite thermometry from the same sample (this study).3 Graphite thermometry of phyllite from the sample A192-155.50 (this study).
A.Y.A. Hakim et al. Ore Geology Reviews 97 (2018) 88–108
97

(Table 2), with calculated salinities ranging from 4.70 to 5.94 eq. mass% NaCl (Table 2, Fig. 11).
During quantification of CO2 inclusions, several difficulties were
encountered. The CO2 bearing FIs are irregular (Fig. 7c) and most of theinclusions are less than 5 μm in size. Only sample S69-25 containsregular shaped fluid inclusions (Fig. 7b). Gaseous species could be
Table 2Summary of microthermometric data for fluid inclusions at gold deposits within Latimojong.
Sample n Volume Inclusion Size Bulk density Tm(CO2) Tm(ice) Tm(clath) Th(total) Salinityfraction (vap) type (µm) (g/cc) (°C) (°C) (°C) (°C) (eq% NaCl)
Barren quartz veinsGRS08 29 0.15–0.25 II 5 to 20 0.78 to 0.87 −3.80 to −1.60 180.60 to 284.00 2.74 to 6.16A687-235 22 0.10–0.39 II 10 to 40 0.63 to 0.94 −2.40 to −1.30 165.60 to 344.70 2.24 to 4.03
Barren dolomiteA687-235dol 21 0.12–0.46 II 5 to 10 0.55 to 0.89 −2.50 to −1.60 191.30 to 386.90 2.74 to 4.18Quartz pyrite-Au veinsMP01.1 25 0.10–0.13 II 5 to 10 0.92 to 0.93 −3.30 to −2.90 164.60 to 194.70 4.80 to 5.41MP02 14 0.10–0.15 II,III 10 to 20 0.89 to 0.94 −3.80 to −2.70 157.70 to 211.30 4.49 to 6.16MP02 5 0.14–0.15 I 3 to 8 0.85 to 0.99 −57.50 to −56.60 −3.60 to −2.80 8.60 to 9.90 146.30 to 177.50 4.70 to 5.94MP3 46 0.10–0.18 II 10 to 40 0.87 to 0.93 −5.20 to −0.80 157.80 to 241.70 1.40 to 8.14
Quartz sulphide (sulphosalt)-Au veinsA685-5 48 0.12–0.19 II, III 10 to 20 0.86 to 0.92 −3.60 to −2.40 184.60 to 243.20 4.02 to 5.86A676-7310 26 0.13–0.15 II 10 to 20 0.88 to 0.89 −3.20 to −1.20 158.40 to 212.30 2.07 to 5.26A685-20 18 0.15–0.21 II 5 to 10 0.83 to 0.90 −3.20 to −1.60 175.40 to 257.00 2.73 to 5.26
Inclusion type-I: H2O-(CO2)-NaCl, type-II: H2O-NaCl; type-III: H2O+NaCl with solid daughter minerals.
Fig. 7. Photomicrographs of fluid inclusions trapped in quartz at room temperature. (a) Isolated CO2 bearing fluid inclusion hosted in quartz. (b). Enlargement ofFigure 85A. A big isolated fluid inclusion containing liquid H2O and vapour CO2 at room temperature. Sample S69-25. (c) Type I inclusion hosted in quartz fromsample MP02. (d) Primary aqueous inclusion of type II hosted in quartz grain from sample MP03. (e) Photomicrograph of type-II inclusions hosted in dolomite (A683-4680) (f) highly irregular shaped inclusion with calcite daughter crystal (inclusion type-III). (g-h) Photomicrograph of fluid inclusion type-II from sample A687-235with variable volume fractions of the vapour phase hosted in quartz (g) and dolomite (h). (i) Irregular aqueous inclusions host in quartz.
A.Y.A. Hakim et al. Ore Geology Reviews 97 (2018) 88–108
98
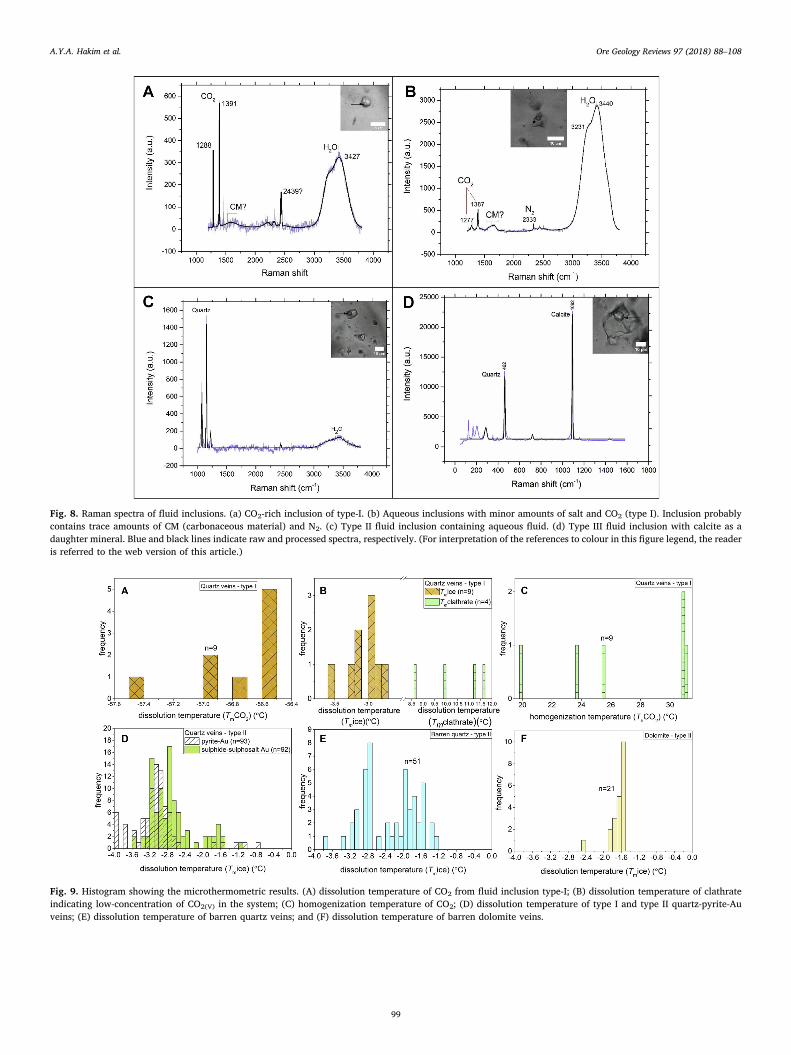
Fig. 8. Raman spectra of fluid inclusions. (a) CO2-rich inclusion of type-I. (b) Aqueous inclusions with minor amounts of salt and CO2 (type I). Inclusion probablycontains trace amounts of CM (carbonaceous material) and N2. (c) Type II fluid inclusion containing aqueous fluid. (d) Type III fluid inclusion with calcite as adaughter mineral. Blue and black lines indicate raw and processed spectra, respectively. (For interpretation of the references to colour in this figure legend, the readeris referred to the web version of this article.)
Fig. 9. Histogram showing the microthermometric results. (A) dissolution temperature of CO2 from fluid inclusion type-I; (B) dissolution temperature of clathrateindicating low-concentration of CO2(V) in the system; (C) homogenization temperature of CO2; (D) dissolution temperature of type I and type II quartz-pyrite-Auveins; (E) dissolution temperature of barren quartz veins; and (F) dissolution temperature of barren dolomite veins.
A.Y.A. Hakim et al. Ore Geology Reviews 97 (2018) 88–108
99

assessed using laser Raman spectroscopy (Fig. 8a-b) but observationand quantification using the heating freezing stage remains proble-matic. The FI are likely of type-I; results are shown in Fig. 9a–c andFig. 10a.
Quartz: inclusion type II. The final dissolution temperatures of type IIaqueous inclusions are bimodally distributed: (i) from −4.0 to −2.5 °Cand (ii) from−1.8 to−0.8 °C (Fig. 9d). This data corresponds to a widerange of salinities between 1.4 and 7.3 eq. mass% NaCl (Fig. 11). Thetemperature of homogenization to the liquid phase is between 157.7and 241.7 °C (Fig. 10a). Densities of the bulk inclusions range from 0.85to 0.94 g/cm3 (Table 2).
4.5.2. Fluid inclusion in quartz – sulphide (sulphosalt) Au veinsQuartz: inclusion type II. The final dissolution temperature of ice in
sulphide ± sulphosalt-Au quartz veins has a bimodal distribution with(i) ranging from −3.6 to −2.4 °C, and (ii) from −2.4 to −1.2 °C at an
average value of −2.76 °C (s.d. ± 0.78, mode at -2.8, see Fig. 9d),which produces calculated salinities between 2.1 and 5.9 eq. mass%NaCl (Fig. 11). The bulk density is between 0.83 and 0.92 g/cm3
(Table 2) and the total homogenization is between 158.4 and 243.2 °C,with a mode at 207.4 °C (Fig. 10b).
4.5.3. Fluid inclusion in barren veinsQuartz: inclusion-type II. Final ice dissolution temperatures are at a
mode of −2.8 °C (ranging from −3.8 to −1.3 °C, Fig. 9e), corre-sponding to salinities ranging from 2.24 to 6.16 eq. mass% NaClequivalent (Fig. 11). Total homogenization of vapour phases occursfrom 165.60 to 344.70 °C (Fig. 10c). The bulk density of FI in sample687–235 is highly variable, between 0.63 and 0.94 g/cm3 (Table 2).
Dolomite: inclusion type II. Type II inclusions hosted in dolomite yieldfinal melting temperatures from −2.5 to −1.6 °C (Fig. 9f), corre-sponding to salinities between 2.74 and 4.18 eq. mass% NaCl equiva-lent (Table 2). The total homogenization temperatures of FI in dolomiteare highly variable, between 191.3 and 386.9 °C, with an average of304.3 °C (Fig. 10c). These conditions define the maximum homo-genization temperatures in this study. Densities of the bulk inclusions indolomite range from 0.55 to 0.89 g/cm3 (Table 2).
4.6. Crush-leach analyses
The chemical composition of fluids extracted from quartz and car-bonate from the drill core samples is summarized in ElectronicAppendix E. The ratios of (I/Cl) versus (Br/Cl) discriminate the resultsinto two groups based on lithology (Fig. 12a). Quartz yields log (I/Cl)averaging to −3.59 ± 0.31 (ranging from −4.48 to −3.26), whereasthe average composition of barren carbonate is−3.36 ± 0.40 (rangingfrom −4.50 to −3.01) (Fig. 12a). The ratios of (Na/Cl) versus (Cl/Br)(Fig. 12b) from veins are distributed into two groups: (i) Na/Cl molarratios< 1.8 with Cl/Br ratio ranging from 1068 to 5433; and (ii) Na/Clmolar ratios > 1.8 with Cl/Br ratio ranging between 734 and 2874.Furthermore, materials barren with respect to gold are characterized byNa/Cl and Cl/Br molar ratios> 0.68 and< 3065, respectively(Fig. 12b and Electronic Appendix E).
Fig. 10. Histogram showing the homogenization temperature from microthermometric observation of (A) type-I and type-II inclusion hosted in quartz-pyrite-Auveins; (B) sulphide-sulphosalt Au veins; (C) barren quartz-dolomite veins. Scatter plot of homogenization temperature versus dissolution temperature of (D) quartz-pyrite-Au veins. (E) sulphide-sulphosalt veins and (F) barren quartz-dolomite veins.
Fig. 11. Scatter plot of homogenization temperature versus salinity of miner-alized and barren veins.
A.Y.A. Hakim et al. Ore Geology Reviews 97 (2018) 88–108
100

4.7. Raman spectroscopy on carbonaceous materials
The extracted spectral parameters (Fig. 12 and Appendix C) are theGmax (graphite band) and Dmax (defect band) band positions and STA(scaled total area, Lünsdorf and Lünsdorf, 2016). The Dmax and Gmaxbands are the highest pseudo-Voigt values in the D- and G-band region,respectively. In addition, D_STA and G_STA represent the parameter thesum of the scaled sum-curve values of the Raman shift interval from1000 to 1800 cm−1 (Lünsdorf et al., 2017). The D1 band is observedbetween 1344 and 1354 cm−1, whereas the G band occurs between1580 and 1600 cm−1 (Fig. 12a and b; Appendix C). Peak fitting de-monstrates the presence of the D2 band at ca. 1,60 cm−1 (Fig. 12a).
5. Geothermometry
5.1. Chlorite geothermometer
The chlorite geothermometer of Kranidiotis and MacLean (1987),which is based on the calculated Al(IV) and corrected Fe/(Fe+Mg)ratio, indicate an average temperature of 268 °C (ranging from 227 to372 °C, n= 82) (Table 1a). A similar result is obtained using thechlorite geothermometer of Bourdelle and Cathelineau (2015). A plot ofT-R2+-Si (R2+ refer to divalent cations Fe2+ and Mg2+) diagrams in-dicates temperatures ranging from 200 to 350 °C (Fig. 6c).
The high amount of chromium in chlorite (i.e. S53-50.20 and S50-39.10, up to 0.8 wt% Cr2O3, Appendix B) correlates well with thepresence of altered chromian spinel as an accessory mineral in maficrock; thus, Cr may be interpreted as a mobile element during meta-morphism. Sample A687-157.90 contains abundant titanium in chlorite(average of 1.7 wt% TiO2, n=5, Appendix B). This sample is char-acterized by an abundance of Ti-bearing minerals, including sphene andrutile, contributing to the high concentration of titanium in chlorite.Consequently, the high content of titanium in this chlorite will decreasethe Al2O3 content due to the cation occupancy. As a result, the chlorite
geothermometer of Kranidiotis and MacLean (1987) in that samplegives a wide range of temperatures (from 269 to 346 °C, Table 1a).
Titanium-bearing chlorite has been reported from various localitiesin subgreenschist and lower greenschist facies rocks (AbdullahAtherton, 1964 in Force, 1991). Force (1991) suggests that the pre-dominant titanium carrier in subgreenschist- and lower greenschist-facies rocks is mostly sphene, in upper greenschist-facies rock biotiteand in the lower amphibolite facies hornblende (in mafic rocks) andsphene (all lithologies).
5.2. Cation geothermometer
Different geothermometers using cations in fluid leachates wereapplied. These are the Na-K geothermometer of Giggenbach (1988); theNa-K, Na-Li and Mg-Li geothermometer of Kharaka and Mariner (1989)
Fig. 12. Halogen data for quartz and carbonate. (A) Log (I/Cl) vs. log (Br/Cl) mole ratios for crush leach analyses obtained on gold bearing quartz-carbonate veinsfrom the Latimojong metamorphic complex. Literature data for other crustal fluids: Frape, Fritz, 1987; Yardley, 1993; Boiron et al., 2001, 2003; Kendrick et al., 2012.(B) Molar Na/Cl vs. Cl/Br plot of fluid inclusion extracts from quartz and carbonate (Landis, Hofstra 2012). The black line shows the evaporation path along theseawater evaporation trend (SET). (C) The Br/Cl molar ratios of veins in the Latimojong Metamorphic Complex compared to literature data.
Table 3Various geothermometers based on cation data.
Na-K1 Na-K2 Na-Li1 Mg-Li1
°C °C °C °C
Calcite min 219.4 217.0 178.6 56.5(n= 3) max 257.3 248.5 233.3 98.4
average 232.7 228.0 207.3 72.7S.D. 21.4 17.8 27.4 22.5
Dolomite-Ankerite min 92.4 105.8 77.4 29.8(n= 13) max 454.7 401.2 248.5 136.6
average 258.2 247.4 156.1 82.0S.D. 89.1 72.9 57.7 26.0
Quartz min 148.6 156.2 102.8 50.1(n= 46) max 430.0 383.0 236.2 133.7
average 294.5 277.5 164.6 93.6S.D. 69.1 55.9 30.9 22.9
1 Kharaka and Mariner (1989).2 Giggenbach (1988).
A.Y.A. Hakim et al. Ore Geology Reviews 97 (2018) 88–108
101

(Table 3 and Appendix E). The Na-K geothermometer yields highlyvariable results; the Na-K of Kharaka and Mariner (1989) yields220–257 °C for calcite, 92–450 °C for dolomite-ankerite and 150–430 °Cfor quartz. Some samples have been excluded from calculations becausethey give unrealistic calculated temperature (i.e. the foraminiferasample has 1400 ppb K, 1100 ppb Na and 1.2 ppb Li, which gives Na-Ktemperature of> 600 °C, by contrast, Na-Li and Mg-Li geothermometergive low temperature of 150 °C and 40 °C, respectively). The resultsshow that the Na-K and Na-Li geothermometers yield higher tempera-ture than the Mg-Li geothermometer.
Petrographical observations show that dolomite-ankerite and side-rite are associated with ore minerals (gold, sulphide and sulphosalt),
and therefore yield higher temperature than barren calcite whichcommonly occurs as crack- or vesicle-filling, and crosscutting miner-alized veins. The calculated temperatures (Na-K, Na-Li) are comparableto the microthermometric results (see Section 4.5). Calculated tem-peratures above 400 °C may be interpreted as a metamorphic tem-perature of the greenschist-facies in the Latimojong MetamorphicComplex.
5.3. Formation temperature based on carbonaceous materials
The transformation of carbonaceous material to graphite is mon-itored by Raman spectra on carbonaceous materials (RSCM) in responseto rising metamorphic conditions. With increasing structural order, theG and D2 peaks are clearly distinguishable. The D2 band appears on theside of the G band (Fig. 13a), similar to the spectra of semi-graphite oflower greenschist-facies metamorphic samples (Rantitsch et al., 2016),and also a blueschist-facies metamorphic sample from the SchistesLustreés in the Western Alps (Beyssac et al., 2002). With increasingmetamorphic rank, both, the D1 and the D2 intensities decrease,whereas the G band increases (Fig. 13a, Appendix C; Lünsdorf andLünsdorf, 2016). The results indicate that the carbonaceous phyllite ofthe Latimojong Metamorphic Complex is composed of poorly orderedcarbonaceous material. Formation temperature calculations using theapproach of Lünsdorf et al. (2017) suggest metamorphic temperaturesbetween 296 and 414 °C (± 25 °C) (n=86, Fig. 13b and Appendix C).Samples containing ore minerals yield higher temperature compared tobarren samples (Fig. 13b).
6. Discussion
In the discussion, the question as to what degree the rocks haveexperienced metamorphism will be approached first. Fluid trappingconditions, pressure estimation and depth of formation will be calcu-lated from the properties of fluid inclusion. Halogen data obtained fromcrush leach analysis are used to model the source of mineralizing fluids.The characteristics of the Awak Mas District will be presented in the oredeposit section. Finally, a genetic model of the Awak Mas District inrelation to metamorphism and magmatism is proposed.
6.1. Pressure-temperature estimates
Phengite barometry (Massonne and Schreyer, 1987) and chloritegeothermometry (Bourdelle and Cathelineau, 2015; Kranidiotis andMacLean, 1987) in combination with temperature estimation on car-bonaceous materials (Lünsdorf, 2015) are used to establish a possible P-T path, assuming that coarse white mica and semi-graphite reflect themaximum P-T conditions in the Awak Mas District. Isochores obtainedfrom fluid inclusions illustrate the timing of mineralization related tometamorphism. It is important to mention that petrographic observa-tions indicate that white mica from the studied samples is not alwaysequilibrated with the rest of the minerals of the rocks. For example, themineral assemblages are Ph+Qz+Ab+Gr in carbonaceous phylliteand Chl+ Pmp – Ph with augite relics in greenschist. As noted byMassonne and Schreyer (1987), equilibrium problems of white mica innature are commonly observed. These authors indicated that homo-genization and re-equilibration of phengitic mica is an extremelysluggish process within geologic times scales; therefore, white mica stillcould be the key to unraveling the earlier stages of the metamorphicrock.
White mica in carbonaceous phyllites with Si contents of 3.19–3.48a.p.f.u. (average of 3.37 a.p.f.u.) yields a huge pressure range of ca.3.45–12.3 kbar (average of 7.9 kbar, Table 1b and Fig. 14a) (Massonneand Schreyer, 1987) at an estimated temperature of 300–415 °C (gra-phite geothermometer, Section 5.3). These values may represent thesubduction between the Indo-Australian and Eurasian plates during theLate Cretaceous. Elevated pressure signatures are also recorded by the
Fig. 13. Nomenclature of CM Raman Spectra and compilation of the most in-dicative Raman parameters obtained on the samples from the Latimojong. (A)Output of IFORS software (Lünsdorf and Lünsdorf, 2016). (b) Summary offormation temperature data of carbonaceous phyllite and carbonaceous breccia.
A.Y.A. Hakim et al. Ore Geology Reviews 97 (2018) 88–108
102
mineral assemblage of some greenschist samples (Pmp+Act+Epi).The latter mineral assemblage is important in petrogenetic studies inthis region, since it represents key minerals of the blueschist-facies andlikely the metamorphic peak in the Latimojong Metamorphic Complex.This will be discussed below.
In a low-grade metamorphic terrain, rocks containing al-bite+ quartz may have, in addition, chlorite+ pumpellyite in moreferroan compositions, chlorite+ actinolite in magnesian bulk compo-sitions, and prehnite in a low aluminium and ferric iron bulk rock
composition (Beiersdorfsser and Day, 1995). The first appearance ofcalcic amphibole as overgrowth on relict clinopyroxene and as acicularcrystals in quartz marks the beginning of the Pmp+Act+Epi facies.The minerals prehnite, laumontite, lawsonite, and glaucophane areabsent in the studied samples. The absence of these minerals providesimportant information, because they bound the stability field ofPmp+Epi+Act (Fig. 14a). Prehnite and laumontite are restricted tolow pressures, whereas lawsonite and glaucophane are restricted tohigh pressures. With increasing temperature, the disappearance of
Fig. 14. (a) General P-T reconstruction of the conditions prevailing in the Latimojong Metamorphic Complex using the phengite barometer diagram from Massonneand Schreyer (1987), graphite geothermometry based on IFORS software (Lünsdorf and Lünsdorf, 2016), chlorite geothermometry according to Kranidiotis andMacLean (1987). The stability field of pumpellyite-actinolite is based on Liou et al. (1987). (b) Mechanism of structurally-controlled ore precipitation in theLatimojong metamorphic complex during retrograde metamorphism.
A.Y.A. Hakim et al. Ore Geology Reviews 97 (2018) 88–108
103

pumpellyite and prehnite and the appearance of albite – chlorite – ac-tinolite – epidote – sphene mark the transition to greenschist faciesassemblages. According to the stability field of Pmp+Epi+Act sug-gested by Beiersdorfsser and Day (1995), and the absence of prehnite,laumontite, lawsonite and glaucophane correspond to a wide pressurerange, from 4 to 9 kbar at temperature between 200 and 350 °C.
6.2. Fluid trapping conditions
Most of the fluid inclusion assemblages described in this study areH2O-NaCl fluids in type-II inclusions. Type-I inclusions were specifiedonly in sample MP02 and are intersected by a later vein generation andfluid inclusions type-II. Quartz forms polygonal grains showing 120degree angles indicating dynamic recrystallization in quartz at elevatedtemperature (Pettijohn et al., 1987). The presence of minor N2 con-tributes to the melting of CO2 below its melting point.
In order to illustrate the fluid evolution, a plot of total homo-genization versus dissolution temperature has been constructed(Fig. 10d–f). Some aqueous-carbonic inclusions represent the minimumhomogenization temperatures observed in this study (146–177 °C)(Fig. 10d), whereas dolomite yields the maximum homogenizationtemperature of 387 °C (Fig. 10f). Homogenization temperatures ofquartz-pyrite-Au veins yield maximum temperatures of 241 °C atmoderate salinity up to 7.3 eq. mass% NaCl (Fig. 11). Sulphide-sul-phosalt quartz veins display an average homogenization temperature of209 °C at low salinity averaging to 4.6 eq. mass% NaCl (Fig. 11). In-clusions in dolomite veins yield interesting results, i.e. a wide range ofhomogenization temperature (190 to 387 °C, Fig. 10f) and variabledensities of bulk inclusion (0.55 – 0.9 g/cm3). The salinity of inclusionsin dolomite is relatively low (average of 3.1 eq. mass% NaCl, Fig. 11).This variability may reflect the gradual evolution of fluid trappingconditions in dolomite. Mineralized vein data are clustered and yieldhomogenization temperatures lower than 250 °C, whereas barren veinsscatter (Fig. 10d–f).
The properties of fluid inclusion (i.e. volume fraction) and micro-thermometric data from different types of fluids and host minerals wereused to construct the isochores with the program ISOC (Bakker, 2003).The isochores of the quartz pyrite – Au veins are slightly above those ofthe quartz sulphide- ± sulphosalt – Au veins. The estimated trappingconditions of the quartz pyrite – Au veins are at about 180–250 °Cand<1.27 kbar, which corresponds to a depth of 4.8 km (assuminglithostatic overburden). The quartz sulphide ± sulphosalt Au veins areat similar temperatures and slightly lower pressures of less than0.84 kbar (Fig. 14a). Both veins have similar dip directions and thus areparallel. The presence of minor amounts of CO2 in inclusion type I re-sults in flatter slopes which overlap with the quartz sulphide ±sulphosalt Au isochore field (Fig. 14a). The inferred trapping condi-tions of Type-II fluid inclusions in barren quartz-carbonate veins rangefrom 374 °C and 1.15 kbar to 300 °C and 0.24 kbar (Fig. 14a). Theparallel isochores may reflect a gradual evolution of trapping condi-tions for each fluid generation. Fluids are continuously trapped inquartz-carbonate during cooling and exhumation of the rock.
The fluid characteristics at Awak Mas District are similar to othergold deposit elsewhere, for example, the Racetrack deposit in theYilgarn block of Western Australia is an example of a shallow orogenicgold system deposited from CO2-poor fluids in lower greenschist-faciesrocks at depths< 2.5 km. This deposit has hydrothermal alteration si-milar to orogenic deposits, whereas the quartz-vein texture and the oremineralogy are more characteristic of epithermal deposits (Gebre-Mariam et al., 1993). The ore mineralogy consists of arsenopyrite,pyrite, chalcopyrite, sphalerite, galena, freibergite, tetrahedrite, ten-nantite, electrum and gold, with fluid salinity of 1–8 (average 4 eq%NaCl), CO2 content of< 0.85 molal and homogenization temperaturesranging from 190 to 260 °C. Similar textures were described from theWiluna deposits; there, δ18Oquartz of 4.4‰ ± 2.3‰ relative to SMOWindicates contribution of near-surface waters in an orogenic gold
deposit (Hagemann et al., 1994).
6.3. Interpretation of halogen data
The halogen ratios (Cl/Br/I) can be used to detect sources of sali-nity, fluid mixing relations and water-rock reactions, because halogensare strongly fractionated by evaporation and organic activity (Böhlkeand Irwin, 1992). Literature data have been plotted as fields for com-parison (Fig. 12).
In Fig. 12a, the values of I/Cl versus Br/Cl are plotted for all in-vestigated samples. The log Br/Cl values of the gold deposits in Lati-mojong (−3.38 to 2.51) overlap with the ore fluids circulating inorogenic deposits of Brusson, NW Italy (Yardley, 1993), Mokrsko, Bo-hemian Massif (Boiron et al., 2001) and Laurie’ras, French MassifCentral (Boiron et al., 2003). Data overlap only somewhat at the lowend of their range with the magmatic deposits in SW England (Böhlkeand Irwin, 1992) and with MORB fields (Kendrick et al., 2012).
The Na/Cl/Br diagrams based on Landis and Hofstra (2012) de-monstrate that the halogen data of Latimojong scatter over a largerange and plot into several fields (Fig. 12b). They are similar to meta-morphic fluids from Phanerozoic orogenic gold deposit with some datashifting into the albitization field (blue arrow, Fig. 12b). The in-troduction of sodium-rich minerals through an albitization process maybe regarded as metasomatic alteration during the cooling process andmetal deposition. Data points also differ from residual evaporativebrines of Mississippi Valley-type (MVT) Pb-Zn deposits (light blue);therefore, dissolution or precipitation of halite are considered to be lessimportant factors in the present study (Landis and Hofstra, 2012).
The Br/Cl diagram (Fig. 12c) supports the evidence of different fluidsources in the Latimojong Metamorphic Complex. The Br/Cl valuesfrom this study are comparable to orogenic gold deposits of Otagoschist, New Zealand (Goodwin, 2010), Muruntau, Uzbekistan(Graupner et al., 2006) and porphyry Cu deposits in USA (Kendricket al., 2001). By contrast, the values are different to carbonate-hostedZn-Pb deposits in Poland (Heijlen et al., 2003) and the Baia Mare epi-thermal gold polymetallic district, Romania (Grancea et al., 2002).
It is suggested that there is no contribution of the Neogene intrusiverocks in Western Sulawesi to the gold mineralization, as the halogendata (Fig. 12a and c) do not indicate magmatic sources. It is inferredthat the halogen ratios of fluids trapped within quartz grains are inagreement with metamorphic fluids, which probably mixed with me-teoric water. Metamorphic reactions in the metasedimentary rocksduring the retrogression stage are considered as the main source ofascending fluids for the formation of the economic gold mineralizationat Latimojong.
While single inclusion analysis always is preferable, bulk analyticalmethods are sufficiently sensitive for many ions and halogens of in-terest. Bulk extraction techniques suffers from several complications: (i)solid inclusions can interfere with the signal from fluid inclusions, (ii)leaching larger sample volumes yields results from multiple, possiblyunrelated fluid inclusion generations (Banks and Yardley, 1992).Therefore, the results of this study must be checked further using laserablation techniques, or by the selection of crystals with only one type offluid inclusions.
6.4. Gold transport and precipitation mechanism
In a system with a temperatures lower than 350 °C, gold solubility ismostly controlled by the bisulphide ion (HS−) with AuHS° pre-dominating at lower pH and Au(HS)2− at higher pH (Gammons andWilliams-Jones, 1997). At temperatures higher than 350 °C, gold mostlyoccurs as AuCl2- species. Based on the homogenization temperaturesobtained in this study, the bisulphide complex (HS−) is considered asthe main ligand for gold deposition in the Latimojong MetamorphicComplex. Mineral assemblages and fluid inclusion composition withinAwak mas and Salu Bullo are consistent with a relatively reduced fluid.
A.Y.A. Hakim et al. Ore Geology Reviews 97 (2018) 88–108
104

The halogen data of fluid inclusions from Awak Mas and Salu Bulloare comparable to other gold deposits formed by fluid-mixing betweendeeply sourced fluids with some contribution of shallow water (me-teoric water), i.e. gold deposits in the Variscan belt of western Europe(Boiron et al., 2003) and epizonal orogenic gold deposits in WesternAustralia (i.e. Wiluna and Racetrack gold deposits, Hagemann et al.,1992). Mikucki (1998) suggested that phase separation and fluidmixing reactions also appear as an effective gold depositional me-chanism in shallow Archean orogenic gold deposits. Other mechanismsfor gold precipitation from hydrothermal ore fluids include (i) pressure-temperature changes, (ii) interaction between ore fluids and sur-rounding host rocks, (iii) phase separation in response to decreasingpressures during the rise of the ore fluid, or (iv) mixing of two or moredifferent fluids (Mikucki, 1998).
Mineralized quartz veins in Awak Mas and Salu Bullo are related tomajor structures, including shear-zone, extensional veins and brecciaveins. Gold grains are observed locally in pyrite grains within graphiterich layer (carbonaceous phyllite, i.e. sample A198-241) and iron-richhost rock (hematitic mudstone, i.e. sample S69-25). The presence ofcarbonaceous material in metasedimentary host rocks may have actedas a reducing agent for fluid carrying gold as bisulphide complexes,resulting in gold precipitation via reaction (1) (Hu et al., 2015):
+ + + = + +− +4Au(HS) C 4H 2H O 4Au CO 4H S2 2 2 2 (aq) (1)
Carbonaceous materials may also be deposited from hydrothermalfluids containing volatile organic compounds during gold deposit for-mation. Hydrothermal carbonaceous materials precipitate from fluidswith sulphides via reaction (2), causing loss of sulphur from solutionwhich results in gold deposition via destabilization of aqueous Au-sul-phide complexes.
Rocks with high Fe/Fe+Mg are good traps for epigenetic gold, i.e.iron formations, iron-rich tholeiites in Archean greenstone belts, andfelsic igneous rock types, because iron forms as an important ore sinkduring desulphidation reactions with the gold-transporting fluids(Goldfarb et al., 2005). This observation is similar to the observation inthe Awak Mas District, where some gold grains are trapped withinhydrothermal pyrite in hematitic mudstone (Fig. 3c).
+ + = + +2FeO 4H S CO 2FeS C 4H O(in silicates/rocks) 2 (aq) 2(aq) 2(s) (s) 2 (l) (2)
The evidence from crush leach analyses, the intimate associationbetween high gold grades and carbonaceous/iron-bearing host rockshighlight the fact that the fluid mixing, fluid-wallrock interaction andwallrock sulphidation are the most important mechanisms in pre-cipitating gold from solution in the Awak Mas and Salu Bullo golddeposits.
6.5. Ore deposit type
The Awak Mas District is characterized by low silver contents ingold (gold fineness ranging from 842 to 936, average of 907, n= 87)(Hakim, 2017; Hakim and Melcher, 2016a; Harjanto et al., 2016b) andthese ratios do not change significantly with depth, unlike in epithermalgold deposits. Gold of lower fineness commonly forms at shallow epi-thermal levels (Corbett and Leach, 1998; White, 1981). By contrast,gold deposited under low pH conditions will have a high fineness, si-milar to the high sulphidation deposits in the southwest Pacific (Leachand Corbett, 2008).
The ore mineralogy at Awak Mas mainly consists of pyrite, chal-copyrite and galena with minor tetrahedrite-tennantite. The proximalalteration is mainly albite and silica whereas most distal alteration isrepresented by secondary chlorite, calcite and lacks hydrothermal sul-phide minerals. Although some minerals (i.e. covellite, enargite/luzo-nite) are typical of epithermal mineralization, their typical alterationassemblages (i.e. high-sulphidation: alunite, barite, kaolinite, diapore,pyrophyllite; low-sulphidation: adularia, illite) are absent (Hakim et al.,2017).
Depth and pressure estimation are the major evidence arguingagainst an epithermal style. Epithermal ores form in a shallow en-vironment under low pressure, from the surface to as deep as 2 km andpressures at about 0.5 kbar (Cooke and Simmons, 2000; Corbett andLeach, 1998; Gemmell and Simmons, 2007; White and Hedenquist,1995). By contrast, the mineralizing veins at Awak Mas District formedat about 4.8 km (see Section 6.2). Considering that pressures and depthsof ore deposition exceed 0.5 kbar and 2 km, gold deposits in the AwakMas District are not comparable to the epithermal style. Moderatesalinity of fluid inclusions (3–8 eq. wt% NaCl, average of 5 eq. wt%NaCl) and the presence of aqueous-carbonic inclusions (CO2 ± N2) arediagnostic features for orogenic gold systems and reflect a near-neutralpH, reduced environment, low-salinity H2O-CO2 fluids with arsenic asminor constituents. They represent fluids that are able to mobilize goldunder greenschist-facies conditions. Halogen data (Br/Cl/I ratios) forhydrothermal ore fluids at Awak Mas District are in agreement withmetamorphic fluids (this study and Harjanto et al., 2016b) with little orno magmatic signature.
The results of in situ laser ablation-inductively coupled mass spec-trometry and electron microprobe analyses for different types of pyriteprovide evidence for trace element enrichment of Co, Ni, As and lowCu, Zn, Se, Bi, Au, Ag (Hakim 2017). Cobalt, nickel and arsenic en-richment in pyrite may indicate that these elements are availableduring particular phases of metamorphism (Craig, 2001).
A number of features at the Awak Mas District thus provide evi-dence that the gold deposits within belong to the epizonal orogenic goldgroup (Groves et al., 1998). This epizonal level of orogenic gold em-placement is consistent with the high As-Sb concentrations, the dom-inance of brittle structures and the open-space filling textures (Goldfarbet al., 2005).
6.6. Mineralization related to metamorphism and genetic model
The Awak Mas District is hosted in rocks metamorphosed fromblueschist- to greenschist-facies conditions. The mineralization historyof Awak Mas is comparable to gold deposits in the Otago and Alpineschists, New Zealand. The maximum pressure and temperature of me-tamorphism for the Otago schists are estimated at 450 °C and between4.5 and 8 kbar (Pitcairn et al., 2010), and locally, amphibolite-faciesconditions have been reached. In comparison, the Latimojong Meta-morphic Complex underwent pressure-dominated pumpellyite-actino-lite to greenschist-facies metamorphism. We have observed an orthog-neiss boulder (± 2m in diameter) in the detachment zone of LMC andLamasi Complex (coordinates S3°20′08.8″ E120°07′59.5″), however,high-grade metamorphic rocks are not present in the drill hole samplesat Awak Mas District. The orthogneiss has green porphyroclasts(probably amphibole) and shows a ductile texture, and is underlain bymetavolcanic rocks within the ophiolite unit. Our field observationssuggest that the orthogneiss probably represents a metamorphic sole ofthe Lamasi Complex, which was obducted onto the metamorphiccomplex. Alternatively, White et al. (2017) suggested that the meta-igneous rocks (i.e. amphibolites, meta-gabbro and meta granitoids)were tectonically juxtaposed within parts of the LMC and representyounger rocks.
Prograde metamorphism of sedimentary rocks has been shown tomobilize elements, including Au and As, to form world-class orogenicgold deposits, such as in the metasedimentary schist belt of southernNew Zealand (Large et al., 2011; Pitcairn et al., 2006). The trace ele-ments were released from those rocks into metamorphic fluids that aregenerated by metamorphic dehydration reactions (Large et al., 2011).These authors considered that carbonaceous metasedimentary rocks arerequired to form large deposits in metasedimentary host rocks (Carlin-type and orogenic gold deposits), where gold and arsenic are in-troduced early into black shale and turbidites during sedimentation anddiagenesis, and later concentrated to ore grade by hydrothermal, tec-tonic or magmatic processes.
A.Y.A. Hakim et al. Ore Geology Reviews 97 (2018) 88–108
105

Pitcairn et al. (2015) evaluated the effects of increasing meta-morphic grade on the concentration of Au and related elements (As, Sb,Se and Hg) in metabasaltic samples in the Otago and Alpine schists,New Zealand. The results prove that metasedimentary rocks are moresuitable source rocks for fluids and metals in orogenic gold depositsthan metabasaltic rocks, as they show mobility during metamorphismof all elements commonly enriched in this style of deposit.
We propose the following model for the gold mineralization for theAwak Mas District:
The Late Cretaceous LMC may have experienced high-pressure low-temperature metamorphism during the subduction of Indo-Australianplate into the Sundaland Craton (Bergman et al., 1996; Parkinson et al.,1998; van Leeuwen and Muhardjo, 2005; White et al., 2017). This high-pressure metamorphism caused limited fluid circulation, the break-down of volatile-bearing minerals and the release of water rich fluid,followed by cooling and isothermal decompression to a maximum of 3kbar (based on the ore fluids isochores, Fig. 14a), giving rise to goldprecipitation. Gold and arsenic were mobile during regional meta-morphism (Pitcairn et al., 2006) and the brittle faults acted as fluidconduits for ore precipitation at shallow depth during retrogression.Metamorphic reactions in the metasedimentary rocks during the ret-rogression stage are considered as the main source of ascending meta-morphic fluids to form the Au-mineralization at Latimojong (Fig. 14b).More support for this is provided by δ18O values of 17.9‰ and 20.6‰obtained from mineralized quartz veins at Awak Mas deposit (Harjantoet al., 2016a), which was interpreted as fluids from metamorphic de-watering reactions.
During the retrogression stage, hydrothermal alteration affectedlarge volumes of rocks; therefore, most rocks studied are hydro-thermally altered. This observation is based on the mineralogy of hostrocks, which indicates typical greenschist facies mineral assemblages ofquartz+ albite+ calcite ± chlorite ± sphene. The pumpellyite – ac-tinolite facies is observed only in more mafic host rocks, with mineralassemblages of Pmp+Act+Chl+Ep+Cal ± Spn ± Qz, sometimeswith relic clinopyroxene. The rocks of the Lamasi Complex are un-mineralized with gold, and we therefore suspect that the mineralizationmust be earlier than the obduction and/or movement of these rocksonto the metamorphic basement. If the mineralization took place laterthan the obduction of ophiolite and the Lamasi Complex acted as abarrier for mineralizing fluids, we would expect vein system at thecontact between the metamorphic complex and the Lamasi Complex.
Archibald et al. (1996) in van Leeuwen and Pieters (2011) inferredthat the flysch sequence in the Awak Mas district is unlikely to be asource of the gold owing to the low gold contents generally inherent tothis sediment type. Those authors suggested that the source of fluids inLatimojong is the basement blueschists and associated serpentinitesand/or adjacent ophiolites, where intense albite metasomatism ac-companied by low- to moderate-temperature seafloor hydrothermalalteration is inferred to have leached the gold from the basaltic-gab-broic rocks (Archibald et al., 1996). Those authors postulated that thegold mineralization took place between 8 and 6Ma, which is based oncross-cutting relationships, radiometric dating and superimposition offluid temperatures on fission track uplift curve data from Bergman et al.(1996).
Intrusion-related gold (IRG) has been suggested as an alternativescenario for the mineralization at the Awak Mas District (Meyer, 2016;van Leeuwen and Pieters, 2011). van Leeuwen and Pieters (2011)suggest that Mid-Miocene extension and an associated heating eventwere the main fluid drivers for gold mobilization, followed by deposi-tion during uplift. Meyer (2016) reviews several orogenic gold miner-alization in the world, including the Awak Mas deposit. Based on thespatial-temporal associations with granitoids and oxygen-sulphur iso-tope data of Harjanto (2017), Meyer (2016) inferred that melts andfluids were both inherent products of thermal events during orogenicprocesses and suggests that the mineralization history in the Awak MasDistrict is not directly related to regional metamorphism.
Despite this controversy, there are no earlier reports on the relativetiming of gold mineralization to the structural evolution in the studiedarea. The timing of mineralization can potentially be dated usingradioactive minerals, including monazite, xenotime and zircon. In theAwak Mas and Salu Bullo deposits, monazite is abundant, whereasxenotime, baddeleyite and rutile are minor. Those minerals are asso-ciated with mineralized ore veins, and have irregular grain shapes. Thesize of minerals is generally less than 30 µm in diameter; therefore,mineral separation is needed for age dating. In-situ geochronologicalinvestigations on these minerals should provide more clarity about thetiming of mineralization.
7. Conclusions
Petrographical, mineralogical, and geochemical methods have beenused to construct the genetic model for gold mineralization hosted bymetasedimentary and metavolcanic rocks in the LatimojongMetamorphic Complex. Different geothermometers (chlorite, cationleachates and carbonaceous material) applied are consistent with theresults obtained using microthermometric techniques. The results ofthis study indicate that the formation temperature is comparable withmetamorphic temperatures of the greenschist facies.
Gold deposits formed from H2O-CO2-NaCl (type I) and H2O-NaCl(type II, type III) fluids. The estimated trapping conditions of the goldare between 180 and 250 °C at pressures of 0.84 to 1.3 kbar. Trappingconditions of the barren veins are at about 300–374 °C and< 1.15 kbar.The fluid pressure estimation corresponds to a depth lower than 5 km,assuming lithostatic conditions, providing evidence for epizonal goldmineralization. Considering the homogenization and salinity data, thebisulphide complex (HS−) is considered as the main ligand for golddeposition. Halogen data (Br/Cl/I ratios) for hydrothermal ore fluids atAwak Mas District are in agreement with metamorphic fluids with littleor no magmatic signature.
The high-pressure low-temperature metamorphism during the sub-duction processes caused limited fluid circulation, the breakdown ofvolatile-bearing minerals and the release of water rich fluid, followedby cooling and isothermal decompression, giving rise to gold pre-cipitation. Metamorphic reactions in the metasedimentary rocks duringthe retrogression stage are considered as the main source of ascendingmetamorphic fluids to form the Au-mineralization at Latimojong. Inaddition, the accretionary complex may also have contributed in sev-eral ways to the formation of the mineralization as favourable host and/or as a driver of fluid generation during the retrograde stage of meta-morphism.
Acknowledgements
We thank the mining company PT Masmindo Dwi Area, Indonesiafor their help during field work. Analytical help from FedericaZaccarini, Maik Zimmermann and sample preparation by SabineFeuchter are much appreciated. The authors wish to acknowledge tworeviewers Greg Corbett and Theo van Leeuwen for their constructivecriticism of various aspect of this manuscript. Research reported in thispublication was supported by the ASEAN-European AcademicUniversity Network (ASEA-UNINET) as part of PhD research to the firstauthor. Franco Pirajno is also thanked for editorial handling.
Appendix A. Supplementary data
Supplementary data associated with this article can be found, in theonline version, at http://dx.doi.org/10.1016/j.oregeorev.2018.05.001.
References
Anderko, A., Pitzer, K.S., 1993. Equation-of-state representation of phase equilibria andvolumetric properties of the system NaCl-H2O above 573 K. Geochimica et
A.Y.A. Hakim et al. Ore Geology Reviews 97 (2018) 88–108
106

Cosmochimica Acta 57 (8), 1657–1680. http://dx.doi.org/10.1016/0016-7037(93)90105-6.
Archibald, N.J., Power, W.L., Ketelaar, P.B., Utley, D.C., Panizza, N., Nicholas, S., 1996.Geology Geology of the Awak Mas prospect area, South Central Sulawesi. Indonesia,Report prepared for PT Masmindo Eka Sakti.
Bakker, R.J., 1997. Clathrates: computer programs to calculate fluid inclusion V-Xproperties using clathrate melting temperatures. Comput. Geosci. 23 (1), 1–18.http://dx.doi.org/10.1016/S0098-3004(96)00073-8.
Bakker, R.J., 2003. Package FLUIDS 1. Computer programs for analysis of fluid inclusiondata and for modelling bulk fluid properties. Chem. Geol. 194 (1–3), 3–23. http://dx.doi.org/10.1016/S0009-2541(02)00268-1.
Bakker, R.J., Diamond, L.W., 2006. Estimation of volume fractions of liquid and vaporphases in fluid inclusions, and definition of inclusion shapes. Am. Mineral. 91 (4),635–657. http://dx.doi.org/10.2138/am.2006.1845.
Banks, D., Gleeson, S., Green, R., 2000. Determination of the origin of salinity in granite-related fluids: Evidence from chlorine isotopes in fluid inclusions. J. Geochem.Explor. 69–70, 309–312. http://dx.doi.org/10.1016/S0375-6742(00)00076-5.
Banks, D., Yardley, B., 1992. Crush-leach analysis of fluid inclusions in small natural andsynthetic samples. Geochim. Cosmochim. Acta 56 (1), 245–248. http://dx.doi.org/10.1016/0016-7037(92)90129-7.
Barton Jr., P.B., Bethke, P.M., 1987. Chalcopyrite disease in sphalerite: Pathology andepidemiology. Am. Mineral. 72 (5–6), 451–467.
Beiersdorfsser, R.E., Day, H.W., 1995. Mineral paragenesis of pumpellyite in low-grademafic rocks. In: In: Schiffman, P., Day, H.W. (Eds.), Low-grade Metamorphism ofMafic Rocks, vol. 296. Geological Society of America, Boulder, Colo., pp. 5–28.
Bergman, S.C., Coffield, D.Q., Talbot, J.P., Garrard, R.A., 1996. Tertiary tectonic andmagmatic evolution of western Sulawesi and the Makassar Strait, Indonesia: evidencefor a Miocene continent-continent collision. Geol. Soc. London Spec. Publ. 106 (1),391–429. http://dx.doi.org/10.1144/GSL.SP.1996.106.01.25.
Beyssac, O., Goffé, B., Chopin, C., Rouzaud, J.N., 2002. Raman spectra of carbonaceousmaterial in metasediments: a new geothermometer. J. Metamorph. Geol. 20 (9),859–871. http://dx.doi.org/10.1046/j.1525-1314.2002.00408.x.
Böhlke, J., Irwin, J., 1992. Laser microprobe analyses of Cl, Br, I, and K in fluid inclusions:Implications for sources of salinity in some ancient hydrothermal fluids. Geochimicaet Cosmochimica Acta 56 (1), 203–225. http://dx.doi.org/10.1016/0016-7037(92)90127-5.
Boiron, M.-C., Barakat, A., Cathelineau, M., Banks, D.A., Durisová, J., Morávek, P., 2001.Geometry and P–V–T–X conditions of microfissural ore fluid migration: the Mokrskogold deposit (Bohemia). Chem. Geol. 173 (1–3), 207–225. http://dx.doi.org/10.1016/S0009-2541(00)00276-X.
Boiron, M.-C., Cathelineau, M., Banks, D.A., Fourcade, S., Vallance, J., 2003. Mixing ofmetamorphic and surficial fluids during the uplift of the Hercynian upper crust:consequences for gold deposition. Chem. Geol. 194 (1–3), 119–141. http://dx.doi.org/10.1016/S0009-2541(02)00274-7.
Bourdelle, F., Cathelineau, M., 2015. Low-temperature chlorite geothermometry: a gra-phical representation based on a T-R2+–Si diagram. Eur. J. Mineral. 27 (5), 617–626.http://dx.doi.org/10.1127/ejm/2015/0027-2467.
Cooke, D.R., Simmons, S.F., 2000. Characteristics and genesis of epithermal gold deposits.Rev. Econ. Geol. 13, 221–244.
Corbett, G.J., Leach, T.M., 1998. Southwest Pacific Rim gold-copper systems: Structure,alteration and mineralization. Soc. Econ. Geol. Spec. Publ. 6, 240.
Craig, J.R., 2001. Ore-mineral textures and the tales they tell. Can. Mineral. 39 (4),937–956. http://dx.doi.org/10.2113/gscanmin.39.4.937.
Craw, D., 2002. Geochemistry of late metamorphic hydrothermal alteration and graphi-tisation of host rock, Macraes gold mine, Otago Schist, New Zealand. Chem. Geol. 191(4), 257–275. http://dx.doi.org/10.1016/S0009-2541(02)00139-0.
Craw, D., MacKenzie, D., 2016. Macraes Orogenic Gold Deposit (New Zealand): Originand Development of a World Class Gold Mine. Springer, Switzerland, pp. 12783.
Cube, 2017. Awak Mas and Salu Bullo Deposits Summary Reports – May 2017. NusantaraResources.
Djuri, Sudjatmiko, Bachri, S., Sukido, 1988. Geological Map of the Majene and WesternPart of the Palopo sheets (1:250,000). Geological Research and Development Centre,Bandung, Indonesia.
Duan, Z., Møller, N., Weare, J.H., 1992a. An equation of state for the CH4-CO2-H2Osystem: I. Pure systems from 0 to 1000 °C and 0 to 8000 bar. Geochim. Cosmochim.Acta 56 (7), 2605–2617. http://dx.doi.org/10.1016/0016-7037(92)90347-L.
Duan, Z., Møller, N., Weare, J.H., 1992b. An equation of state for the CH4-CO2-H2Osystem: II. Mixtures from 50 to 1000 °C and 0 to 1000 bar. Geochimica etCosmochimica Acta 56 (7), 2619–2631. 10.1016/0016-7037(92)90348-M.
Duan, Z., Møller, N., Weare, J.H., 1995. Equation of state for the NaCl·H2O·CO2 system:prediction of phase equilibria and volumetric properties. Geochimica etCosmochimica Acta 59 (14), 2869–2882. http://dx.doi.org/10.1016/0016-7037(95)00182-4.
Force, E.R. (Ed.), 1991. Geology of Titanium-mineral Deposits. Geological Society ofAmerica, Boulder, Colo.
Gammons, C.H., Williams-Jones, A.E., 1997. Chemical mobility of gold in the porphyry-epithermal environment. Econ. Geol. 92 (1), 45–59. http://dx.doi.org/10.2113/gsecongeo.92.1.45.
Garwin, S., Hall, R., Watanabe, Y., 2005. Tectonic setting, geology, and gold and coppermineralization in Cenozoic magmatic arcs of Southeast Asia and the West Pacific.Economic Geology 100th Anniversary Volume, 891–900.
Gebre-Mariam, M., Groves, D.I., McNaughton, N.J., Mikucki, E.J., Vearncombe, J.R.,1993. Archaean Au−Ag mineralisation at Racetrack, near Kalgoorlie, WesternAustralia: a high crustal-level expression of the Archaean composite lode-goldsystem. Mineral. Deposita 28 (6), 375–387. http://dx.doi.org/10.1007/BF02431597.
Gemmell, J.B., Simmons, S.F., 2007. A group of papers devoted to epithermal Au-Ag
deposits: preface. Econ. Geol. 102 (5), 783. http://dx.doi.org/10.2113/gsecongeo.102.5.783.
Giggenbach, W.F., 1988. Geothermal solute equilibria. Derivation of Na-K-Mg-Ca geoin-dicators. Geochimica et Cosmochimica Acta 52 (12), 2749–2765. http://dx.doi.org/10.1016/0016-7037(88)90143-3.
Gleeson, S.A., 2003. Bulk analyses of electrolytes in fluid inclusions: In: Samson, I.,Anderson, A., Marshall, D. (Eds.), Fluid Inclusions: Analysis and Interpretation.Mineralogical Association of Canada, Short Course 32, pp. 233–247.
Goldfarb, R.J., Baker, T., Dube, B., Groves, D.I., Hart, C.J.R., Gosselin, P., 2005.Distribution, character, and genesis of gold deposits in metamorphic terranes.Economic Geology 100th anniversary volume 40.
Goodwin, N.R.J., 2010. A combined noble gas and halogen study of orogenic gold mi-neralisation in the Alpine and Otago Schists, New Zealand.
Grancea, L., Bailly, L., Leroy, J., Banks, D., Marcoux, E., Milési, J., Cuney, M., André, A.,Istvan, D., Fabre, C., 2002. Fluid evolution in the Baia Mare epithermal gold/poly-metallic district, Inner Carpathians, Romania. Mineralium Deposita 37 (6–7),630–647. http://dx.doi.org/10.1007/s00126-002-0276-5.
Graupner, T., Niedermann, S., Kempe, U., Klemd, R., Bechtel, A., 2006. Origin of orefluids in the Muruntau gold system: constraints from noble gas, carbon isotope andhalogen data. Geochimica et Cosmochimica Acta 70 (21), 5356–5370. http://dx.doi.org/10.1016/j.gca.2006.08.013.
Groves, D., Goldfarb, R., Gebre-Mariam, M., Hagemann, S., Robert, F., 1998. Orogenicgold deposits: a proposed classification in the context of their crustal distribution andrelationship to other gold deposit types. Ore Geol. Rev. 13 (1–5), 7–27. http://dx.doi.org/10.1016/S0169-1368(97)00012-7.
Gu, X.X., Zhang, Y.M., Li, B.H., Dong, S.Y., Xue, C.J., Fu, S.H., 2012. Hydrocarbon- andore-bearing basinal fluids: a possible link between gold mineralization and hydro-carbon accumulation in the Youjiang basin, South China. Miner. Deposita 47 (6),663–682. http://dx.doi.org/10.1007/s00126-011-0388-x.
Hagemann, S.G., Gebre-Mariam, M., Groves, D.I., 1994. Surface-water influx in shallow-level Archean lode-gold deposits in Western, Australia. Geology 22 (12), 1067.http://dx.doi.org/10.1130/0091-7613(1994) 022<1067:SWIISL>2.3.CO;2.
Hagemann, S.G., Groves, D.I., Ridley, J.R., Vearncombe, J.R., 1992. The Archean lodegold deposits at Wiluna, Western Australia; high-level brittle-style mineralization in astrike-slip regime. Econ. Geol. 87 (4), 1022–1053. http://dx.doi.org/10.2113/gsecongeo.87.4.1022.
Hakim, A.Y.A., 2017. Genesis of Orogenic Gold in the Latimojong District, SouthSulawesi, Indonesia (Ph.D. thesis). Montanuniversität Leoben, Austria, pp. 355.
Hakim, A.Y.A., Melcher, F., 2015. Mineralogical study of the Awak Mas Deposit: aContribution to the Ore Genesis of Disseminated Gold Deposits in South Celebes,Indonesia. Mitteilungen der Österreichischen Mineralogischen Gesellschaft 161, 43(abstract).
Hakim, A.Y.A., Melcher, F., 2016a. The composition of gold and mercurian rich tetra-hedrite from the sedimentary hosted disseminated gold in Latimojong mountain,South Sulawesi, Indonesia. 1st Postgraduate conference on Geology of Ore Deposits.Freiberg 1, 12 (abstract).
Hakim, A.Y.A., Melcher, F., 2016b. The Sallu Bulo Mesothermal Gold Deposit in SouthSulawesi, Indonesia. GeoTirol 2016, 98 (abstract).
Hakim, A.Y.A., Melcher, F., 2017a. Magmatic chromian spinel in metabasite from theLatimojong Mountains, Sulawesi, Indonesia. Mitteilungen der ÖsterreichischenMineralogischen Gesellschaft 163, 42 (abstract).
Hakim, A.Y.A., Melcher, F., 2017b. Timing of mineralization and origin of hydrothermalcarbonate at the gold deposits within the Latimojong Complex, Indonesia. 2ndPostgraduate conference on Geology of Ore Deposits. Hannover 2, 22 (abstract).
Hakim, A.Y.A., Melcher, F., Prochaska, W., Bakker, R.J., Rantitsch, G., 2017. The originand evolution of fluids associated with gold deposits in the basement of Sulawesi,Indonesia. Proceedings of the 14th SGA Biennial Meeting, 20–23 August 2017,Québec City, Canada, 355–358.
Hall, R., Wilson, M., 2000. Neogene sutures in eastern Indonesia. J. Asian Earth Sci. 18(6), 781–808. http://dx.doi.org/10.1016/S1367-9120(00)00040-7.
Harjanto, E., 2017. Hydrothermal alteration and gold mineralization of the Awak Masgold deposit, Sulawesi Island, Indonesia. Mainz, G, Aachen, 200 Seiten.
Harjanto, E., Meyer, F.M., Idrus, A., 2015. Geology and mineralization of Awak Mas golddeposit and challenges for new exploration targeting in the metamorphic rock terrainof eastern Indonesia. In: Proceeding of the 13th Biennial SGA Meeting, Nancy,France.
Harjanto, E., Meyer, F.M., Idrus, A., 2016a. Hydrothermal alteration and gold miner-alization of the meta-sedimentary rock hosted gold deposit Awak Mas, SulawesiIsland, Indonesia. In: Proceeding of the 35th International Geological Congress. CapeTown, South Africa.
Harjanto, E., Meyer, F.M., Idrus, A., Widyanarko, H., Endrasari, N.L., 2016b. An update ofkey characteristics of Awak Mas mesothermal gold deposit, Sulawesi Island,Indonesia. MGEI Annual Meeting 2016. 4–6 October 2016.
Heijlen, W., Muchez, P., Banks, D.A., Schneider, J., Kucha, H., Keppens, E., 2003.Carbonate-hosted Zn-Pb deposits in Upper Silesia, Poland: origin and evolution ofmineralizing fluids and constraints on genetic models. Econ. Geol. 98 (5), 911–932.http://dx.doi.org/10.2113/gsecongeo.98.5.911.
Hu, S., Evans, K., Craw, D., Rempel, K., Bourdet, J., Dick, J., Grice, K., 2015. Ramancharacterization of carbonaceous material in the Macraes orogenic gold deposit andmetasedimentary host rocks, New Zealand. Ore Geol. Rev. 70, 80–95. http://dx.doi.org/10.1016/j.oregeorev.2015.03.021.
Kadarusman, A., Miyashita, S., Maruyama, S., Parkinson, C.D., Ishikawa, A., 2004.Petrology, geochemistry and paleogeographic reconstruction of the East SulawesiOphiolite, Indonesia. Tectonophysics 392 (1–4), 55–83. http://dx.doi.org/10.1016/j.tecto.2004.04.008.
Kendrick, M.A., Burgess, R., Pattrick, R., Turner, G., 2001. Fluid inclusion noble gas and
A.Y.A. Hakim et al. Ore Geology Reviews 97 (2018) 88–108
107

halogen evidence on the origin of Cu-Porphyry mineralising fluids. Geochim.Cosmochim. Acta 65 (16), 2651–2668. http://dx.doi.org/10.1016/S0016-7037(01)00618-4.
Kendrick, M.A., Woodhead, J.D., Kamenetsky, V.S., 2012. Tracking halogens through thesubduction cycle. Geology 40 (12), 1075–1078. http://dx.doi.org/10.1130/G33265.1.
Kharaka, Y.K., Mariner, R.H., 1989. Chemical geothermometers and their application toformation waters from sedimentary basins. In: Nancy, D.N., McCulloh, T.H. (Eds.),Thermal History of Sedimentary Basins. Methods and Case Histories, pp. 99–117. 10.1007/978-1-4612-3492-0_6.
Kranidiotis, P., MacLean, W.H., 1987. Systematics of chlorite alteration at the PhelpsDodge massive sulfide deposit, Matagami, Quebec. Econ. Geol. 82 (7), 1898–1911.http://dx.doi.org/10.2113/gsecongeo.82.7.1898.
Kwiecińska, B., Petersen, H., 2004. Graphite, semi-graphite, natural coke, and naturalchar classification—ICCP system. Int. J. Coal Geol. 57 (2), 99–116. http://dx.doi.org/10.1016/j.coal.2003.09.003.
Landis, G.P., Hofstra, A.H., 2012. Ore genesis constraints on the Idaho Cobalt Belt fromfluid inclusion gas, noble gas isotope, and ion ratio analyses. Econ. Geol. 107 (6),1189–1205. http://dx.doi.org/10.2113/econgeo.107.6.1189.
Large, R.R., Bull, S.W., Maslennikov, V.V., 2011. A carbonaceous sedimentary source-rockmodel for carlin-type and orogenic gold deposits. Econ. Geol. 106 (3), 331–358.http://dx.doi.org/10.2113/econgeo.106.3.331.
Leach, T.M., Corbett, G.J., 2008. Fluid mixing as a mechanism for bonanza grade epi-thermal gold formation. Paper presented at the Terry Leach Symposium.
Liou, J.G., Maruyama, S., Cho, M., 1987. Very low-grade metamorphism of volcanic andvolcaniclastic rocks-mineral assemblages and mineral facies: Low temperature me-tamorphism. Blackie and Son, London.
Lünsdorf, N.K., 2015. Geothermometry by Raman Spectroscopy of Dispersed OrganicMatter (Ph.D. thesis). University Göttingen.
Lünsdorf, N.K., Dunkl, I., Schmidt, B.C., Rantitsch, G., von Eynatten, H., 2014. Towards ahigher comparability of geothermometric data obtained by Raman spectroscopy ofcarbonaceous material. Part I: evaluation of biasing factors. Geostand Geoanal. Res.38 (1), 73–94. http://dx.doi.org/10.1111/j.1751-908X.2013.12011.x.
Lünsdorf, N.K., Dunkl, I., Schmidt, B.C., Rantitsch, G., von Eynatten, H., 2017. Towards ahigher comparability of geothermometric data obtained by Raman spectroscopy ofcarbonaceous material. Part 2: a revised geothermometer. Geostand Geoanal. Res.172 (Suppl. 1), 617. http://dx.doi.org/10.1111/ggr.12178.
Lünsdorf, N.K., Lünsdorf, J.O., 2016. Evaluating Raman spectra of carbonaceous matterby automated, iterative curve-fitting. Int. J. Coal Geol. 160–161, 51–62. http://dx.doi.org/10.1016/j.coal.2016.04.008.
Massonne, H.-J., Schreyer, W., 1987. Phengite geobarometry based on the limiting as-semblage with K-feldspar, phlogopite, and quartz. Contr. Mineral. Petrol. 96 (2),212–224. http://dx.doi.org/10.1007/BF00375235.
Maulana, A., Christy, A.G., Ellis, D.J., Imai, A., Watanabe, K., 2013. Geochemistry ofeclogite- and blueschist-facies rocks from the Bantimala Complex, South Sulawesi,Indonesia: Protolith origin and tectonic setting. Isl. Arc 22 (4), 427–452. http://dx.doi.org/10.1111/iar.12037.
Maulana, A., Imai, A., van Leeuwen, T., Watanabe, K., Yonezu, K., Nakano, T., Boyce, A.,Page, L., Schersten, A., 2016. Origin and geodynamic setting of Late Cenozoicgranitoids in Sulawesi, Indonesia. J. Asian Earth Sci. 124, 102–125. http://dx.doi.org/10.1016/j.jseaes.2016.04.018.
Meyer, F.M., 2016. Orogenic Gold Deposits-From Hypozonal to Epizonal Systems.Unconventional Exploration Target & Latest Technique and New Tools in Mineral andCoal Exploration MGEI 8th Annual Convention 2016, 15–18.
Mikucki, E.J., 1998. Hydrothermal transport and depositional processes in Archean lode-gold systems: a review. Ore Geol. Rev. 13 (1–5), 307–321. http://dx.doi.org/10.1016/S0169-1368(97)00025-5.
One Asia Resources, 2013. Awak Mas and Salu Bulo Gold Projects Sulawesi, Indonesia:Technical Report (unpublished report) by Tetra Tech.
One Asia Resources, 2017. Awak Mas gold project resource update: Awak Mas and SaluBullo Deposits Summary Report – May 2017: Mineral resource (JORC 2012) – 1.74Moz new Geological Model.
Parkinson, C., 1998. Emplacement of the East Sulawesi Ophiolite: evidence from sub-ophiolite metamorphic rocks. J. Asian Earth Sci. 16 (1), 13–28. http://dx.doi.org/10.1016/S0743-9547(97)00039-1.
Parkinson, C.D., Miyazaki, K., Wakita, K., Barber, A.J., Carswell, D.A., 1998. An overviewand tectonic synthesis of the pre-Tertiary very-high-pressure metamorphic and as-sociated rocks of Java, Sulawesi and Kalimantan. Indonesia. Isl Arc 7 (1–2), 184–200.http://dx.doi.org/10.1046/j.1440-1738.1998.00184.x.
Peng, D.-Y., Robinson, D.B., 1976. A new two-constant equation of state. Ind. Eng. Chem.Fund. 15 (1), 59–64. http://dx.doi.org/10.1021/i160057a011.
Pettijohn, F.J., Potter, P.E., Siever, R., 1987. Sand and Sandstone, second ed. Springer,New York, NY, pp. 553.
Pitcairn, I.K., Craw, D., Teagle, D.A.H., 2015. Metabasalts as sources of metals in orogenic
gold deposits. Miner. Deposita 50 (3), 373–390. http://dx.doi.org/10.1007/s00126-014-0547-y.
Pitcairn, I.K., Olivo, G.R., Teagle, D.A.H., Craw, D., 2010. Sulfide evolution during pro-grade metamorphism of the otago and alpine schists, New Zealand. Can. Mineral. 48(5), 1267–1295. http://dx.doi.org/10.3749/canmin.48.5.1267.
Pitcairn, I.K., Roberts, S., Teagle, D.A.H., Craw, D., 2005. Detecting hydrothermal gra-phite deposition during metamorphism and gold mineralization. J. Geol. Soc. 162 (3),429–432. http://dx.doi.org/10.1144/0016-764904-139.
Pitcairn, I.K., Teagle, D.A.H., Craw, D., Olivo, G.R., Kerrich, R., Brewer, T.S., 2006.Sources of metals and fluids in orogenic gold deposits: insights from the Otago andAlpine Schists, New Zealand. Econ. Geol. 101 (8), 1525–1546. http://dx.doi.org/10.2113/gsecongeo.101.8.1525.
Polve, M., Maury, R.C., Vidal, P., Priadi, B., Bellon, H., Soeria-Atmadja, R., Joron, J.-L.,Cotten, J., 2001. Melting of lower continental crust in a young post-collision setting; ageochemical study of Plio-Quaternary acidic magmatism from central Sulawesi(Indonesia). Bull. Soc. Geol. Fr. 172 (3), 333–342. http://dx.doi.org/10.2113/172.3.333.
Polvé, M., Maury, R.C., Bellon, H., Rangin, C., Priadi, B., Yuwono, S., Joron, J.L.,Atmadja, R., 1997. Magmatic evolution of Sulawesi (Indonesia): Constraints on theCenozoic geodynamic history of the Sundaland active margin. Tectonophysics 272(1), 69–92. http://dx.doi.org/10.1016/S0040-1951(96)00276-4.
Priadi, B., Polve, M., Maury, R.C., Bellon, H., Soeria-Atmadja, R., Joron, J.L., Cotten, J.,1994. Tertiary and quaternary magmatism in Central Sulawesi: chronological andpetrological constraints. J. SE Asian Earth Sci. 9 (1–2), 81–93. http://dx.doi.org/10.1016/0743-9547(94)90067-1.
Querubin, C.D., Walters, S., 2012. Geology and Mineralization of Awak Mas: a sedi-mentary Hosted Gold Deposit, South Sulawesi, Indonesia. Majalah Geologi Indonesia27 (2), 69–85.
Rantitsch, G., Grogger, W., Teichert, C., Ebner, F., Hofer, C., Maurer, E.-M., Schaffer, B.,Toth, M., 2004. Conversion of carbonaceous material to graphite within theGreywacke Zone of the Eastern Alps. Int. J. Earth Sci. (Geol. Rundsch) 93 (6),959–973. http://dx.doi.org/10.1007/s00531-004-0436-1.
Rantitsch, G., Lämmerer, W., Fisslthaler, E., Mitsche, S., Kaltenböck, H., 2016. On thediscrimination of semi-graphite and graphite by Raman spectroscopy. Int. J. CoalGeol. 159, 48–56. http://dx.doi.org/10.1016/j.coal.2016.04.001.
Soesilo, J., 1998. Metamorphism in the Latimojong Complex, South Sulawesi and itstectonic significances. Unpublished Magister thesis.
Tuakia, M.Z., Takahashi, R., Imai, A., 2016. Fluid Inclusion and Sulfur Isotope Studies onthe Salu Bulo Prospect, South Sulawesi, Indonesia: A Metasedimentary Rock-HostedGold Deposit. In: SEG 2016 Conference Tethyan Tectonics and Metallogeny.
van Leeuwen, T.M., Muhardjo, 2005. Stratigraphy and tectonic setting of the Cretaceousand Paleogene volcanic-sedimentary successions in northwest Sulawesi, Indonesia:Implications for the Cenozoic evolution of Western and Northern Sulawesi. J. AsianEarth Sci. 25 (3), 481–511. http://dx.doi.org/10.1016/j.jseaes.2004.05.004.
van Leeuwen, T.M., Pieters, P.E., 2011. Mineral deposits of Sulawesi. In: Proceedings ofthe Sulawesi Mineral Resources 2011. 10.13140/2.1.3843.2322.
van Leeuwen, T.M., Susanto, E.S., Maryanto, S., Hadiwisastra, S., Sudijono, Muhardjo,Prihardjo,, 2010. Tectonostratigraphic evolution of Cenozoic marginal basin andcontinental margin successions in the Bone Mountains, Southwest Sulawesi,Indonesia. J. Asian Earth Sci. 38 (6), 233–254. http://dx.doi.org/10.1016/j.jseaes.2009.11.005.
Wakita, K., 2000. Cretaceous accretionary–collision complexes in central Indonesia. J.Asian Earth Sci. 18 (6), 739–749. http://dx.doi.org/10.1016/S1367-9120(00)00020-1.
Wakita, K., Sopaheluwakan, J., Miyazaki, K., Zulkarnain, I., Munasri,, 1996. Tectonicevolution of the Bantimala Complex, South Sulawesi, Indonesia. Geol. Soc. LondonSpec. Publ. 106 (1), 353–364. http://dx.doi.org/10.1144/GSL.SP.1996.106.01.23.
White, D.E., 1981. Active geothermal systems and hydrothermal ore deposits. In: Skinner,B.J. (Ed.), Seventy-Fifth Anniversary Volume. Economic Geology PublishingCompany.
White, L.T., Hall, R., Armstrong, R.A., Barber, A.J., Fadel, M.B., Baxter, A., Wakita, K.,Manning, C., Soesilo, J., 2017. The geological history of the Latimojong region ofwestern Sulawesi. J. Asian Earth Sci. http://dx.doi.org/10.1016/j.jseaes.2017.02.005.
White, N.C., Hedenquist, J.W., 1995. Epithermal gold deposits: styles, characteristics andexploration. SEG Newsletter 23 (1), 9–13.
Wyche, N.L., Eilu, P., Koppström, K., Kortelainen, V.J., Niiranen, T., Välimaa, J., 2015.The Suurikuusikko Gold Deposit (KittilÄ Mine), Northern Finland. In: Maier, W.D.,Lahtinen, R., O'Brien, H. (Eds.), Mineral Deposits of Finland. Elsevier, Amsterdam,Boston, pp. 411–433.
Yardley, B.W.D., 1993. Post-Metamorphic Gold-Quartz Veins from N.W. Italy: the com-position and origin of the ore fluid. Mineral. Mag. 57 (388), 407–422. http://dx.doi.org/10.1180/minmag.1993.057.388.05.
A.Y.A. Hakim et al. Ore Geology Reviews 97 (2018) 88–108
108