Order intake and net sales developed well in the · Anchor Order intake and net sales developed...
26
Transcript of Order intake and net sales developed well in the · Anchor Order intake and net sales developed...

Anchor
Order intake and net sales developed well in theOrder intake and net sales developed well in theequipment businessesequipment businesses
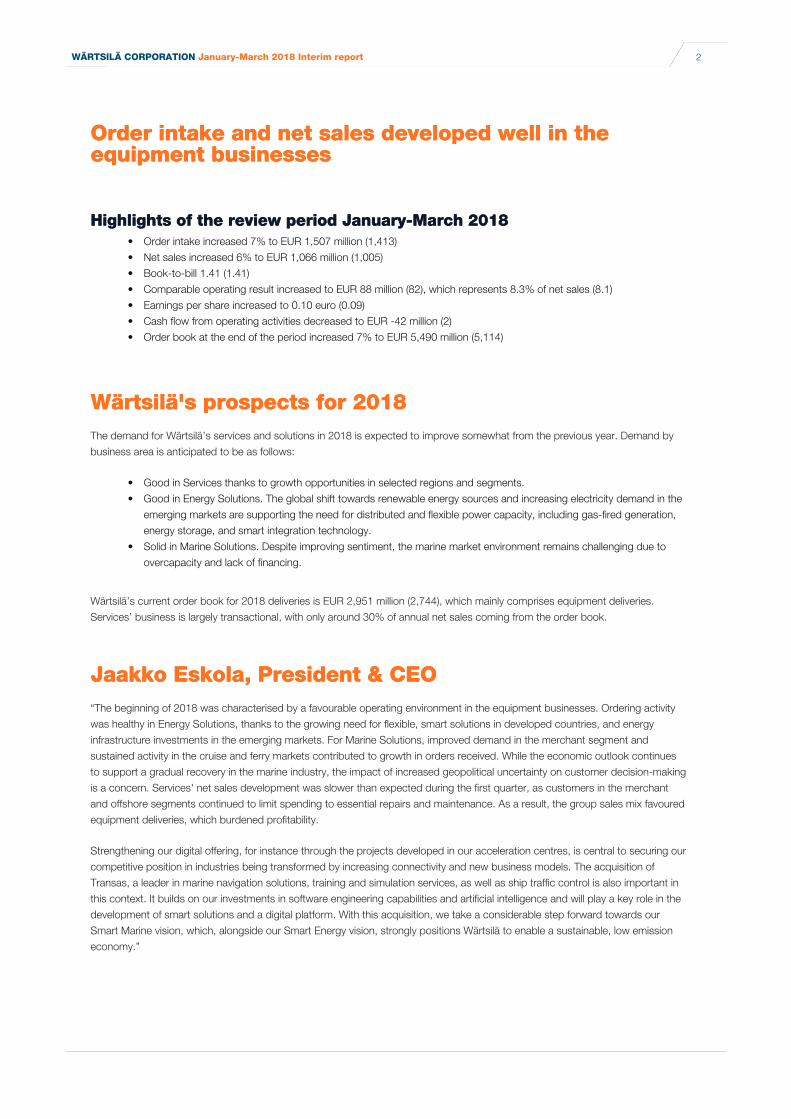
Highlights of the review period January-March 2018Highlights of the review period January-March 2018• Order intake increased 7% to EUR 1,507 million (1,413)
• Net sales increased 6% to EUR 1,066 million (1,005)
• Book-to-bill 1.41 (1.41)
• Comparable operating result increased to EUR 88 million (82), which represents 8.3% of net sales (8.1)
• Earnings per share increased to 0.10 euro (0.09)
• Cash flow from operating activities decreased to EUR -42 million (2)
• Order book at the end of the period increased 7% to EUR 5,490 million (5,114)
Anchor
Wärtsilä's prospects for 2018Wärtsilä's prospects for 2018The demand for Wärtsilä’s services and solutions in 2018 is expected to improve somewhat from the previous year. Demand by
business area is anticipated to be as follows:
• Good in Services thanks to growth opportunities in selected regions and segments.
• Good in Energy Solutions. The global shift towards renewable energy sources and increasing electricity demand in the
emerging markets are supporting the need for distributed and flexible power capacity, including gas-fired generation,
energy storage, and smart integration technology.
• Solid in Marine Solutions. Despite improving sentiment, the marine market environment remains challenging due to
overcapacity and lack of financing.
Wärtsilä’s current order book for 2018 deliveries is EUR 2,951 million (2,744), which mainly comprises equipment deliveries.
Services’ business is largely transactional, with only around 30% of annual net sales coming from the order book.
Anchor
Jaakko Eskola, President & CEOJaakko Eskola, President & CEO“The beginning of 2018 was characterised by a favourable operating environment in the equipment businesses. Ordering activity
was healthy in Energy Solutions, thanks to the growing need for flexible, smart solutions in developed countries, and energy
infrastructure investments in the emerging markets. For Marine Solutions, improved demand in the merchant segment and
sustained activity in the cruise and ferry markets contributed to growth in orders received. While the economic outlook continues
to support a gradual recovery in the marine industry, the impact of increased geopolitical uncertainty on customer decision-making
is a concern. Services' net sales development was slower than expected during the first quarter, as customers in the merchant
and offshore segments continued to limit spending to essential repairs and maintenance. As a result, the group sales mix favoured
equipment deliveries, which burdened profitability.
Strengthening our digital offering, for instance through the projects developed in our acceleration centres, is central to securing our
competitive position in industries being transformed by increasing connectivity and new business models. The acquisition of
Transas, a leader in marine navigation solutions, training and simulation services, as well as ship traffic control is also important in
this context. It builds on our investments in software engineering capabilities and artificial intelligence and will play a key role in the
development of smart solutions and a digital platform. With this acquisition, we take a considerable step forward towards our
Smart Marine vision, which, alongside our Smart Energy vision, strongly positions Wärtsilä to enable a sustainable, low emission
economy.”
WÄRTSILÄ CORPORATION January-March 2018 Interim report 2

Anchor
Key figures
MEURMEUR 1-3/20181-3/2018RestatedRestated1-3/20171-3/2017 ChangeChange
RestatedRestated20172017
Order intake 1 5071 507 1 413 7% 5 644
Order book at the end of the period 5 4905 490 5 114 7% 5 100
Net sales 1 0661 066 1 005 6% 4 911
Operating result¹ 8585 76 12% 538
% of net sales 8.08.0 7.5 11.0
Comparable operating result 8888 82 8% 576
% of net sales 8.38.3 8.1 11.7
Comparable adjusted EBITA 9898 90 9% 612
% of net sales 9.29.2 9.0 12.5
Profit before taxes 7676 70 491
Earnings/share, EUR 0.100.10 0.09 0.63
Cash flow from operating activities -42-42 2 430
Net interest-bearing debt at the end of the period 438438 260 234
Gross capital expenditure 3737 9 255
Gearing 0.210.21 0.13 0.10
¹Items affecting comparability in the first quarter of 2018 included costs related to restructuring programmes of EUR 3 million (6).
As of 1 January 2018, Wärtsilä has adopted the IFRS 15 Revenue from Contracts with Customers standard by using the full
retrospective method. This interim report is published according to the new standard and comparison periods for 2017, including
the opening balance sheet, have been restated accordingly. Wärtsilä has also restated the 2017 figures for Marine Solutions and
Services, due to an internal transfer of certain service activities. This transfer has no impact on Group totals.
The share issue without payment approved by Wärtsilä’s Annual General Meeting on 8 March 2018 increased the total number of
Wärtsilä shares to 591,723,390. The share related figures in the comparison periods have been adjusted to reflect the increased
number of shares.
Anchor
Market developmentMarket development
Steady development in the service marketsSteady development in the service marketsService market activity during the first quarter of 2018 was in line with the previous year. In the marine markets, continued
momentum in the cruise segment compensated for lower service demand from merchant customers and steady activity in
offshore. The demand for scrubber retrofit projects improved, as customers prepare themselves for compliance with the
approaching global sulphur regulations. In the energy markets, service activity remained on last year’s level.
Power generation markets shifting towards smart and flexiblePower generation markets shifting towards smart and flexibletechnologiestechnologiesThe demand for Wärtsilä’s energy solutions was solid in the first quarter of 2018. The need for flexible power capacity and smart
solutions is growing, as solar and wind become increasingly cost competitive and utilities assess how to integrate such energy
sources into their asset base. These trends are particularly noticeable in the USA and Australia. In the emerging markets, countries
continue to invest in new power generation capacity to support economic growth and to alleviate power shortages.
WÄRTSILÄ CORPORATION January-March 2018 Interim report 3

Energy Solutions’ market shareEnergy Solutions’ market share
The strong demand for Wärtsilä’s energy solutions in 2017 supported market share growth, despite declining global power plant
investments in the up to 500 MW market segment. Wärtsilä’s market share increased to 19% (15), while global orders for natural
gas and liquid fuel power plants of up to 500 MW decreased by 20% to 20.1 GW for the twelve months ending in December (25.2
at the end of September). Global orders include all gas turbine and Wärtsilä orders with prime movers over 5 MW in size.
Solid activity in the marine marketsSolid activity in the marine marketsDuring the first quarter of 2018, 192 contracts for new vessels were registered (231, including late contracting). Market conditions
in the merchant segment have improved along with economic growth and growth in seaborne trade. The contracting of LNG
carriers was healthy, thanks to growing demand for LNG in the emerging markets and increasing exports from the USA and
Australia. High earnings supported continued activity in the cruise and ferry segment. Cruise customers are showing increased
interest in expedition vessels, while ageing fleets are creating replacement demand in the ferry segment. Despite some signs of
improving sentiment in offshore production, the investment appetite in the overall offshore industry remains limited. Planned
regulatory developments are driving demand for environmental solutions in the newbuild markets.
In terms of compensated gross tonnage, South Korea and China remain the largest shipbuilding nations with 42% and 31% of all
confirmed contracts respectively. Japan and Germany accounted for 13% and 6% of the global total.
Financial performanceAnchor
Order intakeOrder intakeWärtsilä’s first quarter order intake totalled EUR 1,507 million (1,413), an increase of 7% over the corresponding period last year.
The first quarter book-to-bill ratio was 1.41 (1.41).
Order intake for the Services business was stable at EUR 737 million (735). During the quarter, Wärtsilä signed a 5-year optimised
maintenance agreement with Hidrovias do Brasil for a fleet of eight pusher tugs operating in the challenging rivers of South
America. Wärtsilä also received a sizeable order to equip a fleet of 30 container vessels with Wärtsilä open loop scrubber systems.
Order intake for Energy Solutions increased by 2% to EUR 414 million (405). The most active markets were Asia and the
Americas. Significant orders received from these regions included a 211 MW smart power generation plant in South Australia, a
128 MW gas plant in New Orleans, and two new liquid fuel projects in Bangladesh of 100 and 105 MW. In addition to power
generation solutions, energy storage and grid management software orders were received for projects in Hungary and Portugal.
Marine Solutions’ order intake totalled EUR 357 million (273), an increase of 31% compared to the corresponding period last year.
Among the orders received was the supply of volatile organic compounds (VOC) recovery technology, LNG fuel gas handling
systems, and the auxiliary engines for two new shuttle tankers being built for Singapore based AET Tankers. The ships will operate
primarily on liquefied natural gas (LNG), enabling a significant reduction in CO2 emissions. VOC – the gas evaporating from the oil
cargo tanks – will also be utilised as fuel by mixing it with the LNG, thereby reducing the vessels’ bunkering needs. The first
quarter order intake also included solutions for the remaining two shuttle tankers from an order received in December 2017 to
supply four such vessels to TEEKAY. The vessels will feature a wide range of Wärtsilä’s latest technology innovations, which
enables them to reach a new level of economic and ecological performance. The conventional merchant segment accounted for
43% of the first quarter order intake, while cruise and ferry represented 40%. The navy segment's share was 6%. The gas carrier
segment’s share represented 5%, special vessels 5%, and offshore 2% of the total.
WÄRTSILÄ CORPORATION January-March 2018 Interim report 4

Order intake by business
MEURMEUR 1-3/20181-3/2018RestatedRestated1-3/20171-3/2017 ChangeChange
RestatedRestated20172017
Services 737737 735 0% 2 670
Energy Solutions 414414 405 2% 1 685
Marine Solutions 357357 273 31% 1 288
Order intake, total 1 5071 507 1 413 7% 5 644
Due to the internal reorganisation of service activities, EUR 49 million was transferred from Marine Solutions to Services in the figures for the firstquarter of 2017 and EUR 190 million for the full year.
Order intake Energy Solutions
MW 1-3/20181-3/2018 1-3/20171-3/2017 ChangeChange 20172017
Oil 399399 210 90% 1 838
Gas 429429 622 -31% 1 938
Order intake, total 828828 832 0% 3 775
Order intake in joint venturesOrder intake in joint venturesOrder intake in the Wärtsilä Hyundai Engine Company Ltd joint venture in South Korea, and in the Wärtsilä Qiyao Diesel Company
Ltd and CSSC Wärtsilä Engine Company Ltd joint ventures in China totalled EUR 49 million (24) during the review period January-
March 2018. The results of these companies are reported as a share of the result of associates and joint ventures.
Anchor
Order bookOrder bookThe total order book at the end of the review period amounted to EUR 5,490 million (5,114). The Services order book totalled EUR
1,401 million (1,234), which is 14% higher than at the same time last year thanks to the increased demand for long-term service
agreements. The Energy Solutions order book increased by 9%, totalling EUR 2,012 million (1,847), while the Marine Solutions
order book increased by 2% to EUR 2,077 million (2,033).
WÄRTSILÄ CORPORATION January-March 2018 Interim report 5

Order book by business
MEURMEUR 31.3.201831.3.2018RestatedRestated
31.3.201731.3.2017 ChangeChangeRestatedRestated
31.12.201731.12.2017
Services 1 4011 401 1 234 14% 1 220
Energy Solutions 2 0122 012 1 847 9% 1 871
Marine Solutions 2 0772 077 2 033 2% 2 009
Order book, total 5 4905 490 5 114 7% 5 100
Due to the internal reorganisation of service activities, EUR 47 million was transferred from Marine Solutions to Services in the figures for the firstquarter of 2017 and EUR 49 million for the full year.
Anchor
Net salesNet salesWärtsilä’s net sales for the review period January-March 2018 increased by 6% to EUR 1,066 million (1,005) compared to the
corresponding period last year. Net sales from the Services business was stable at EUR 535 million (534). Net sales for Energy
Solutions increased by 12% to EUR 267 million (239). Strategically important deliveries included the world's largest solar hybrid
power plant in Burkina Faso. The hybridisation of an existing 57 MW diesel power plant with a 15 MWp solar PV plant will enhance
plant performance, reduce fuel consumption, and lower CO2 emissions. Marine Solutions’ net sales totalled EUR 264 million (233),
which is 13% higher than in the corresponding period last year. Of the total net sales, Services accounted for 50%, Energy
Solutions for 25%, and Marine Solutions for 25%.
Of Wärtsilä’s net sales for the period January-March 2018, approximately 67% was EUR denominated, 20% USD denominated,
with the remainder being split between several currencies.
Net sales by business
MEURMEUR 1-3/20181-3/2018RestatedRestated1-3/20171-3/2017 ChangeChange
RestatedRestated20172017
Services 535535 534 0% 2 407
Energy Solutions 267267 239 12% 1 401
Marine Solutions 264264 233 13% 1 104
Net sales, total 1 0661 066 1 005 6% 4 911
Due to the internal reorganisation of service activities, EUR 39 million was transferred from Marine Solutions to Services in the figures for the firstquarter of 2017 and EUR 177 million for the full year.
Anchor
Operating result and profitabilityOperating result and profitabilityThe operating result for the review period January-March 2018 was EUR 85 million (76), which represents 8.0% of net sales (7.5).
The comparable operating result was EUR 88 million (82), or 8.3% of net sales (8.1). Items affecting comparability in the first
WÄRTSILÄ CORPORATION January-March 2018 Interim report 6

quarter of 2018 included costs related to restructuring programmes of EUR 3 million (6). The comparable adjusted EBITA was
EUR 98 million (90), or 9.2% of net sales (9.0). Purchase price allocation amortisation amounted to EUR 10 million (9).
Wärtsilä’s operating result was affected by a provision of EUR 3 million (11) related to long-term incentive schemes. The provision
covers all three ongoing programmes. Wärtsilä’s three-year long-term incentive schemes are tied to the development of the
company's share price, and they apply to approximately 100 company executives.
Financial items amounted to EUR -9 million (-5). Net interest totalled EUR -2 million (-2). Profit before taxes amounted to EUR 76
million (70). Taxes amounted to EUR 19 million (16), implying an effective tax rate of 24.5% (22.7). Earnings per share were 0.10
euro (0.09) and the equity per share was 3.62 euro (3.52). Return on investments (ROI) was 19.7% (16.8). Return on equity (ROE)
was 17.6% (16.9).
Measures of profit and items affecting comparability
MEURMEUR 1-3/20181-3/2018RestatedRestated1-3/20171-3/2017
RestatedRestated20172017
Comparable adjusted EBITA 9898 90 612
Purchase price allocation amortisation -10-10 -9 -36
Comparable operating result 8888 82 576
Items affecting comparability -3-3 -6 -37
Operating result 8585 76 538
Anchor
Balance sheet, financing and cash flowBalance sheet, financing and cash flowWärtsilä’s cash flow from operating activities amounted to EUR -42 million (2) during the review period January-March 2018. Cash
flow was negatively affected by the timing of tax payments and the increase in working capital. Working capital totalled EUR 726
million (561) at the end of the review period, an increase of EUR 163 million from the end of the previous quarter in preparation for
deliveries later this year. Advances received at the end of the period totalled EUR 582 million (554). At the end of December 2017,
advances totalled EUR 522 million. Cash and cash equivalents at the end of the period amounted to EUR 282 million (403) and
unutilised Committed Credit Facilities totalled EUR 792 million (640), which includes a EUR 152 million long-term loan that remains
undrawn. A dividend of EUR 0.69 per share (0.65) corresponding to a total of EUR 136 million (128) was paid during the first
quarter. The second dividend instalment of equal size will be paid in September.
Wärtsilä had interest-bearing debt totalling EUR 726 million (670) at the end of March 2018. At the end of December 2017, the
interest-bearing debt totalled EUR 619 million. The total amount of short-term debt maturing within the next 12 months was EUR
103 million. Long-term loans amounted to EUR 623 million. Net interest-bearing debt totalled EUR 438 million (260) and gearing
was 0.21 (0.13).
WÄRTSILÄ CORPORATION January-March 2018 Interim report 7

Liquidity preparedness
MEURMEUR 31.3.201831.3.2018 31.12.201731.12.2017
Cash and cash equivalents 282282 379
Unutilised committed credit facilities 792792 765
Liquidity preparedness 1 0741 074 1 144
% of net sales (rolling 12 months) 2222 23
Less Commercial Papers -- -
Liquidity preparedness excluding Commercial Papers 1 0741 074 1 144
% of net sales (rolling 12 months) 2222 23
On 31 March 2018, the average maturity of the total loan portfolio was 49 months and the average maturity of the long-term debt was 50 months.
Anchor
Capital expenditureCapital expenditureCapital expenditure related to intangible assets and property, plant and equipment amounted to EUR 17 million (8) during the
review period January-March 2018. Capital expenditure related to acquisitions and investments in joint ventures totalled EUR 20
million (1). Depreciation, amortisation, and impairment for the review period amounted to EUR 30 million (33).
In 2018, capital expenditure related to intangible assets and property, plant and equipment is expected to be below depreciation
and amortisation.
Strategic developmentsAnchor
Strategic projects, acquisitions and joint venturesStrategic projects, acquisitions and joint venturesIn January, Wärtsilä and Schneider Electric signed an agreement to collaborate on data centre projects. The objective of the
agreement is to work together to open markets for innovative data centre energy optimisation solutions, focusing on hyperscale
projects having an electrical load of at least a 10 MW. Wärtsilä will provide the power generation plants, whereas Schneider
Electric will focus on energy distribution optimisation.
In February, Wärtsilä announced the expansion of its QuantiServ service offering with the acquisition of Lock-n-Stitch Inc., an
American engineering company specialised in cast iron repairs. The acquisition strengthens Wärtsilä’s service portfolio for
customers operating multiple brands. Wärtsilä also completed the acquisition of Trident BV, a Netherlands based company
specialised in underwater ship maintenance, inspection, and repair services. The acquisition enables Wärtsilä to become a leading
global operator in the underwater services market.
In March, Wärtsilä announced the acquisition of Transas, a global market leader in marine navigation solutions, professional
training and simulation services, ship traffic control, as well as monitoring and support. Transas leverages the latest in machine
learning and artificial intelligence to create a unified cloud-based platform for managing operations across the entire marine
ecosystem. The company’s large base of software engineers will play a key role in assisting Wärtsilä with the development of
smart products and a digital platform. The acquisition will also speed delivery on Wärtsilä’s promise to disrupt the industry by
establishing an ecosystem that is digitally connected across the entire supply chain, through applications that are secure, smart
and cloud-based. It represents a considerable step forward towards the realisation of Wärtsilä’s Smart Marine vision, whereby
smart vessels connect with smart ports and beyond to deliver three fundamental industry benefits: maximising the use of
resources and operational efficiency, minimising environmental impact and risk, and achieving the highest levels of safety and
security. The transaction is valued at EUR 210 million (enterprise value) and is expected to be closed during the second quarter of
2018.
WÄRTSILÄ CORPORATION January-March 2018 Interim report 8

Anchor
Research and development, product launchesResearch and development, product launchesDuring the first quarter Eniram, a Wärtsilä company, launched Eniram SkyLight 3.0 for fleet performance monitoring, and Eniram
Mobile to offer real-time decision-making support via mobile notifications. The latter solution was created to support situational
awareness based on collected historical and real-time data coupled with predictive analytics. Mobile technology makes these
insights transparent, giving captains, fleet managers, and senior executives instant access to the information needed for effective
and timely decision-making.
Anchor
PersonnelPersonnelWärtsilä had 18,182 (17,832) employees at the end of March 2018. On average, the number of personnel for January-March 2018
totalled 18,125 (17,802). Services employed 11,328 (11,067) people, Energy Solutions 1,084 (913), and Marine Solutions 5,197
(5,317).
Of Wärtsilä’s total number of employees, 20% (19) were located in Finland and 38% (38) elsewhere in Europe. Personnel
employed in Asia represented 26% (28) of the total, personnel in the Americas 11% (10), and personnel in other countries 4% (4).
Anchor
Sustainable developmentSustainable developmentThanks to its various technologies and specialised services, Wärtsilä is well positioned to reduce exhaust emissions and the use of
natural resources, and to support its customers in preparing for new regulatory requirements. Wärtsilä’s R&D efforts continue to
focus on the development of advanced environmental technologies and solutions. The company is committed to supporting the
UN Global Compact and its principles with respect to human rights, labour, the environment, and anti-corruption.
During the first quarter, Wärtsilä submitted its Aquarius Electro-Chlorination Ballast Water Management System for US Coast
Guard (USCG) type approval after successfully completing all the testing procedures required. Wärtsilä received type approval
from the International Maritime Organization (IMO) in 2013 for the Electro-Chlorination system and the same design was used for
the USCG application. This current testing has again proven the consistent performance of the Wärtsilä solution, and
demonstrates the high reliability, robustness and effectiveness of the system.
In March, Wärtsilä’s Seals & Bearings business and the Green Award Foundation announced their co-operation efforts in
environmental protection. Wärtsilä Seals & Bearings has joined the Green Award scheme as an incentive provider to further
encourage the reduction of emissions and a clean, sustainable future.
Personnel health and safety is a priority for Wärtsilä. Wärtsilä’s fourth global safety day was arranged in March under the theme
‘On the Road’. The aim was to raise awareness of risks and to support employees in making safer choices when travelling.
Wärtsilä’s share is included in several sustainability indices. During the first quarter, Wärtsilä was reconfirmed as a constituent of
the Ethibel Sustainability Index (ESI) Excellence Europe. Wärtsilä was also included in the annual Global 100 list of the most
sustainable large corporations in the world compiled by Corporate Knights.
Shares and AGMAnchor
Shares and shareholdersShares and shareholdersDuring January-March 2018, the volume of trades on Nasdaq Helsinki was 72,818,201 shares, equivalent to a turnover of EUR
1,354 million. Wärtsilä's shares are also traded on alternative exchanges, such as Turquoise, BATS CXE, and BATS BXE. The total
trading volume on these alternative exchanges was 71,375,280 shares.
WÄRTSILÄ CORPORATION January-March 2018 Interim report 9

Shares on Nasdaq Helsinki
Number ofNumber of Number ofNumber of
shares andshares and shares tradedshares traded
31.3.201831.3.2018 votesvotes 1-3/20181-3/2018
WRT1V 591 723 390 72 818 201
1.1. - 31.3.20181.1. - 31.3.2018 HighHigh LowLow AverageAverage 11 CloseClose
Share price 19.88 17.48 18.60 17.95
1 Trade-weighted average price
31.3.201831.3.2018 31.3.201731.3.2017
Market capitalisation, EUR million 10 621 9 892
Foreign shareholders, % 55.1 55.1
Flagging notificationsFlagging notificationsDuring the review period January-March 2018, BlackRock Inc. informed Wärtsilä of the following changes in ownership.
Release dateRelease date Transaction dateTransaction date ShareholderShareholder ThresholdThreshold Direct holding, %Direct holding, % Total holding, %Total holding, %
22.3.2018 21.3.2018 BlackRock InvestmentManagement (UK) Limited
Above 5% 5.07 6.03
19.3.2018 16.3.2018 BlackRock, Inc. Below 10% 8.22 9.66
14.3.2018 13.3.2018 BlackRock, Inc. Above 10% 6.69 10.04
9.3.2018 8.3.2018 BlackRock, Inc. Below 10% 6.60 9.97
8.3.2018 6.3.2018 BlackRock, Inc. Above 10% 6.64 10.01
2.3.2018 1.3.2018 BlackRock, Inc. Below 10% 7.13 9.98
28.2.2018 27.2.2018 BlackRock InvestmentManagement (UK) Limited
Below 5% onshares and votingrights
4.85 6.10
26.2.2018 23.2.2018 BlackRock, Inc. Above 10% 9.88 10.04
Anchor
Decisions taken by the Annual General MeetingDecisions taken by the Annual General MeetingWärtsilä Corporation’s Annual General Meeting, held on 8 March 2018, approved the financial statements and discharged the
members of the Board of Directors and the company’s President & CEO from liability for the financial year 2017.
The Annual General Meeting decided that the Board of Directors shall have eight members. The following were elected to the
Board: Maarit Aarni-Sirviö, Kaj-Gustaf Bergh, Karin Falk, Johan Forssell, Tom Johnstone, Mikael Lilius, Risto Murto and Markus
Rauramo.
The audit firm PricewaterhouseCoopers Oy was elected as the company’s auditor for the year 2018.
WÄRTSILÄ CORPORATION January-March 2018 Interim report 10
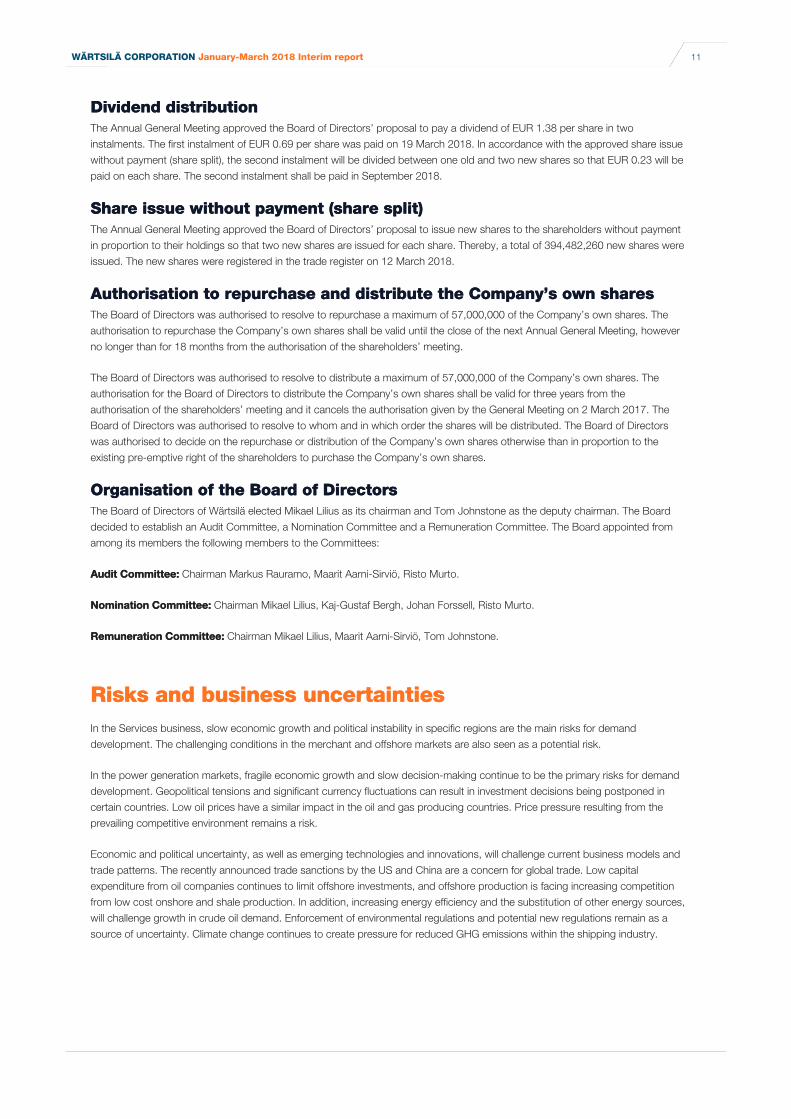
Dividend distributionDividend distributionThe Annual General Meeting approved the Board of Directors’ proposal to pay a dividend of EUR 1.38 per share in two
instalments. The first instalment of EUR 0.69 per share was paid on 19 March 2018. In accordance with the approved share issue
without payment (share split), the second instalment will be divided between one old and two new shares so that EUR 0.23 will be
paid on each share. The second instalment shall be paid in September 2018.
Share issue without payment (share split)Share issue without payment (share split)The Annual General Meeting approved the Board of Directors’ proposal to issue new shares to the shareholders without payment
in proportion to their holdings so that two new shares are issued for each share. Thereby, a total of 394,482,260 new shares were
issued. The new shares were registered in the trade register on 12 March 2018.
Authorisation to repurchase and distribute the Company’s own sharesAuthorisation to repurchase and distribute the Company’s own sharesThe Board of Directors was authorised to resolve to repurchase a maximum of 57,000,000 of the Company’s own shares. The
authorisation to repurchase the Company’s own shares shall be valid until the close of the next Annual General Meeting, however
no longer than for 18 months from the authorisation of the shareholders’ meeting.
The Board of Directors was authorised to resolve to distribute a maximum of 57,000,000 of the Company’s own shares. The
authorisation for the Board of Directors to distribute the Company’s own shares shall be valid for three years from the
authorisation of the shareholders’ meeting and it cancels the authorisation given by the General Meeting on 2 March 2017. The
Board of Directors was authorised to resolve to whom and in which order the shares will be distributed. The Board of Directors
was authorised to decide on the repurchase or distribution of the Company’s own shares otherwise than in proportion to the
existing pre-emptive right of the shareholders to purchase the Company’s own shares.
Organisation of the Board of DirectorsOrganisation of the Board of DirectorsThe Board of Directors of Wärtsilä elected Mikael Lilius as its chairman and Tom Johnstone as the deputy chairman. The Board
decided to establish an Audit Committee, a Nomination Committee and a Remuneration Committee. The Board appointed from
among its members the following members to the Committees:
Audit Committee:Audit Committee: Chairman Markus Rauramo, Maarit Aarni-Sirviö, Risto Murto.
Nomination Committee:Nomination Committee: Chairman Mikael Lilius, Kaj-Gustaf Bergh, Johan Forssell, Risto Murto.
Remuneration Committee:Remuneration Committee: Chairman Mikael Lilius, Maarit Aarni-Sirviö, Tom Johnstone.
Anchor
Risks and business uncertaintiesRisks and business uncertaintiesIn the Services business, slow economic growth and political instability in specific regions are the main risks for demand
development. The challenging conditions in the merchant and offshore markets are also seen as a potential risk.
In the power generation markets, fragile economic growth and slow decision-making continue to be the primary risks for demand
development. Geopolitical tensions and significant currency fluctuations can result in investment decisions being postponed in
certain countries. Low oil prices have a similar impact in the oil and gas producing countries. Price pressure resulting from the
prevailing competitive environment remains a risk.
Economic and political uncertainty, as well as emerging technologies and innovations, will challenge current business models and
trade patterns. The recently announced trade sanctions by the US and China are a concern for global trade. Low capital
expenditure from oil companies continues to limit offshore investments, and offshore production is facing increasing competition
from low cost onshore and shale production. In addition, increasing energy efficiency and the substitution of other energy sources,
will challenge growth in crude oil demand. Enforcement of environmental regulations and potential new regulations remain as a
source of uncertainty. Climate change continues to create pressure for reduced GHG emissions within the shipping industry.
WÄRTSILÄ CORPORATION January-March 2018 Interim report 11

Wärtsilä emphasises a holistic approach to the management of cyber and physical security risks in its internal operations and
customer offerings. The company’s cyber security team carries out its operational, governance and compliance activities in line
with the IEC62443 and ISO 27k protocols. Such activities include cyber assurance, risk management, detection, a secure
software development lifecycle, training, endpoint protection, network security, and cyber advisory services. Wärtsilä is
implementing new procedures for storing, processing and using data in the company’s systems so as to comply with the
upcoming General Data Protection Regulation. Cyber security is taken into consideration in this implementation.
The Group is a defendant in a number of legal cases that have arisen out of, or are incidental to, the ordinary course of its
business. These lawsuits mainly concern issues such as contractual and other liability, labour relations, property damage, and
regulatory matters. The Group receives from time to time claims of different amounts and with varying degrees of substantiation.
There is currently one unusually sizeable claim. It is the Group’s policy to provide for amounts related to the claims, as well as for
litigation and arbitration matters, when an unfavourable outcome is probable, and the amount of the loss can be reasonably
estimated.
The annual report contains a more detailed description of Wärtsilä’s risks and risk management.
TablesAnchor
Wärtsilä Interim Report January-March 2018Wärtsilä Interim Report January-March 2018This interim financial report is prepared in accordance with IAS 34 (Interim Financial Reporting) using the same accounting policies
and methods of computation as in the annual financial statements for 2017, except for the IFRS amendments stated below. All
figures in the accounts have been rounded and consequently the sum of individual figures can deviate from the presented sum
figure.
Use of estimatesUse of estimatesThe preparation of the financial statements in accordance with IFRS requires management to make estimates and assumptions
that affect the valuation of the reported assets and liabilities and other information, such as contingent liabilities and the recognition
of income and expenses in the statement of income. Although the estimates are based on the management’s best knowledge of
current events and actions, actual results may differ from the estimates.
IFRS amendmentsIFRS amendmentsIn 2018, the Group has adopted the following new standards and interpretation issued by the IASB.
As of 1 January 2018, Wärtsilä has adopted the IFRS 15 Revenue from Contracts with CustomersIFRS 15 Revenue from Contracts with Customers standard by using the full
retrospective method. This Interim Report for January-March 2018 is published according to the new standard, and comparison
periods for 2017, including opening balance sheet, have been restated accordingly.
IFRS 15 establishes a new five-step model that will apply to revenue arising from contracts with customers. It replaces IAS 18
Revenue, and IAS 11 Construction Contracts, and related interpretations, providing a new basis for revenue recognition. IFRS 15
is based on the principle that revenue is recognised when control of a good or service transfers to a customer in an amount that
reflects the consideration to which the entity expects to be entitled in exchange for those goods or services.
IFRS15 has an impact on the timing of recognition of revenue in two business lines: long-term service and maintenance
agreements, and gas solutions related construction contracts. The changes and impact caused by the standard are described
below.
In long-term service and maintenance agreements, customer value is created over time during the contract period. The revenue
recognition method changes from an output method (percentage of completion based on the proportion of the contracted
services performed) to an input method (percentage of completion based on costs incurred). Due to standard maintenance
schedules, this typically delays the revenue recognition in a contract. In construction contracts related to gas solutions, the key
value drivers are engineering, procurement, and project management, and the manufacturing is usually outsourced. The revenue
recognition method changes from an output method (percentage of completion based on the progress measured by surveys of
work performed) to an input method (percentage of completion based on costs incurred).
WÄRTSILÄ CORPORATION January-March 2018 Interim report 12

In the project business, contracts usually have clauses for liquidated damages which were previously accounted as provisions for
cost when their probability was more likely than not to occur. Liquidated damages are treated as a variable consideration
according to IFRS 15 and are required to be estimated at contract inception. According to IFRS 15, the net sales will be reduced
by late delivery penalties and liquidated damages, which have been expensed under IAS 18 and IAS 11. The restatement impact
of reclassification of penalties is insignificant.
Arising from the change of revenue recognition in long-term service and maintenance agreements, and gas solutions related
construction contracts from output method to input method, an adjustment of EUR -13 million has been made to Group’s retained
earnings as at 1 January 2017.
The restatement of financials 2017 result in a decrease in net sales of EUR 11 million, an increase in material and services
expenses of EUR 3 million, a decrease in income taxes of EUR 5 million, and a decrease in profit for the financial period of EUR 9
million. From the consolidated statement of financial position perspective, the application of the new principles impact the deferred
tax assets, other receivables, and other liabilities. Deferred tax assets increased by EUR 8 million and other receivables increased
by EUR 33 million. Other liabilities increased by EUR 60 million mainly due to changes in accrued expenses and deferred income.
These changes do not have an impact on cash flows.
Amendments to IFRS 2 Share-based PaymentIFRS 2 Share-based Payment - Clarification and Measurement of Share-based Payment Transactions (effective
for financial periods beginning on or after 1 January 2018). The amendments are intended to eliminate the diversity in the
classification and measurement of particular share-based payment transactions (accounting for cash-settled share-based
payment transactions that include a performance condition, share-based payments in which the manner of settlement is
contingent on future events, share-based payments settled net of tax withholdings and modification of share-based payment
transactions from cash-settled to equity-settled). The amendments have no impact on consolidated financial statements.
Amendments to IFRS 4 Insurance ContractsIFRS 4 Insurance Contracts - Applying IFRS 9 Financial Instruments with IFRS 4 Insurance Contracts (effective
for financial periods beginning on or after 1 January 2018): Applying IFRS 9 Financial Instruments with IFRS 4. The amendments
bring certainty to insurers on whether, and how, they should apply IFRS 9 before they apply the forthcoming insurance contracts
standard. The amendments have no impact on consolidated financial statements.
IFRIC 22: Foreign Currency Transactions and Advance ConsiderationIFRIC 22: Foreign Currency Transactions and Advance Consideration (effective for financial periods beginning on or after 1
January 2018). The interpretation considers how to determine the date of the transaction when applying the standard on foreign
currency transactions IAS 21. The guidance aims to reduce diversity in practice. The interpretation has no impact on consolidated
financial statements.
Internal transfer of service activitiesInternal transfer of service activitiesWärtsilä has decided to transfer certain service activities from Marine Solutions to Services as of 1 January 2018. The aim is to
strengthen the focus on the development of these activities. The comparison periods for 2017 have been restated, resulting in
EUR 177 million in net sales, EUR 190 million in order intake, and EUR 49 million in order book being transferred from Marine
Solutions to Services for the financial period 2017. This transfer has no impact on Group totals.
This interim report is unaudited.
WÄRTSILÄ CORPORATION January-March 2018 Interim report 13

Anchor
Condensed statement of income
RestatedRestated RestatedRestated
MEURMEUR 1–3/20181–3/2018 1–3/20171–3/2017 20172017
Net sales 1 0661 066 1 005 4 911
Other operating income 77 13 60
Expenses -960-960 -911 -4 312
Depreciation, amortisation and impairment -30-30 -33 -134
Share of result of associates and joint ventures 33 1 13
Operating resultOperating result 8585 76 538
Financial income and expenses -9-9 -5 -47
Profit before taxesProfit before taxes 7676 70 491
Income taxes -19-19 -16 -117
Profit for the reporting periodProfit for the reporting period 5757 54 375
Attributable to:
Equity holders of the parent company 5858 53 375
Non-controlling interests -1-1 1 -1
5757 54 375
Earnings per share attributable to equity holders of the parent company (basic anddiluted):
Earnings per share (EPS), basic and diluted, EUR 0.100.10 0.09 0.63
Earnings per share for comparison periods have been restated to reflect the increased number of shares.
Anchor
Statement of other comprehensive income
RestatedRestated RestatedRestated
MEURMEUR 1–3/20181–3/2018 1–3/20171–3/2017 20172017
Profit for the reporting periodProfit for the reporting period 5757 54 375
Other comprehensive income, net of taxes:Other comprehensive income, net of taxes:
Items that will not be reclassified to the statement of incomeItems that will not be reclassified to the statement of income
Remeasurements of defined benefit liabilities 7
Total items that will not be reclassified to the statement of incomeTotal items that will not be reclassified to the statement of income 7
WÄRTSILÄ CORPORATION January-March 2018 Interim report 14

Items that may be reclassified subsequently to the statement of incomeItems that may be reclassified subsequently to the statement of income
Exchange rate differences on translating foreign operations
for equity holders of the parent company -4-4 1 -73
for non-controlling interests -1 -2
Associates and joint ventures, share of other comprehensive income -1-1 3 -1
Cash flow hedges 1515 9 37
Tax on items that may be reclassified to the statement of income -2-2 -2 -9
Total items that may be reclassified to the statement of incomeTotal items that may be reclassified to the statement of income 77 12 -48
Other comprehensive income for the reporting period, net of taxesOther comprehensive income for the reporting period, net of taxes 77 11 -41
Total comprehensive income for the reporting periodTotal comprehensive income for the reporting period 6464 66 334
Total comprehensive income attributable to:
Equity holders of the parent company 6565 65 337
Non-controlling interests -1-1 1 -3
6464 66 334
Anchor
Condensed statement of financial position
RestatedRestated RestatedRestated
MEURMEUR 31.3.201831.3.2018 31.3.201731.3.2017 31.12.201731.12.2017
Non-current assetsNon-current assets
Intangible assets 1 5861 586 1 421 1 577
Property, plant and equipment 346346 393 349
Investments in associates and joint ventures 6868 76 83
Other investments 1313 14 13
Deferred tax assets 120120 147 131
Other receivables 109109 46 132
Total non-current assetsTotal non-current assets 2 2422 242 2 096 2 285
Current assetsCurrent assets
Inventories 1 1681 168 1 184 1 051
Other receivables 1 9411 941 1 723 1 933
Cash and cash equivalents 282282 403 379
Total current assetsTotal current assets 3 3913 391 3 310 3 363
Total assetsTotal assets 5 6325 632 5 406 5 648
WÄRTSILÄ CORPORATION January-March 2018 Interim report 15

EquityEquity
Share capital 336336 336 336
Other equity 1 8091 809 1 744 2 016
Total equity attributable to equity holders of the parent company 2 1452 145 2 080 2 352
Non-controlling interests 2222 34 24
Total equityTotal equity 2 1672 167 2 114 2 376
Non-current liabilitiesNon-current liabilities
Interest-bearing debt 623623 592 517
Deferred tax liabilities 104104 90 102
Other liabilities 270270 276 270
Total non-current liabilitiesTotal non-current liabilities 997997 958 889
Current liabilitiesCurrent liabilities
Interest-bearing debt 103103 78 102
Other liabilities 2 3652 365 2 256 2 281
Total current liabilitiesTotal current liabilities 2 4682 468 2 334 2 383
Total liabilitiesTotal liabilities 3 4653 465 3 292 3 272
Total equity and liabilitiesTotal equity and liabilities 5 6325 632 5 406 5 648
Anchor
Condensed statement of cash flows
MEURMEUR 1–3/20181–3/2018 1–3/20171–3/2017 20172017
Cash flow from operating activities:Cash flow from operating activities:
Profit for the reporting period 5757 54 375
Adjustments for:
Depreciation, amortisation and impairment 3030 33 134
Financial income and expenses 99 5 47
Gains and losses on sale of intangible assets and property, plant and equipmentand other changes -3 -17
Share of result of associates and joint ventures -3-3 -1 -13
Income taxes 1919 16 117
Cash flow before changes in working capitalCash flow before changes in working capital 112112 104 643
Changes in working capital -108-108 -91 -87
Cash flow from operating activities before financial items and taxesCash flow from operating activities before financial items and taxes 44 13 555
Financial items and paid taxes -46-46 -12 -126
Cash flow from operating activitiesCash flow from operating activities -42-42 2 430
Cash flow from investing activities:Cash flow from investing activities:
Investments in shares and acquisitions -20-20 -1 -191
Net investments in property, plant and equipment and intangible assets -17-17 -4 -47
WÄRTSILÄ CORPORATION January-March 2018 Interim report 16

Proceeds from sale of shares in associated companies and other investments 2
Cash flow from other investing activities 1
Cash flow from investing activitiesCash flow from investing activities -37-37 -5 -235
Cash flow from financing activities:Cash flow from financing activities:
Proceeds from non-current debt 125125 90 90
Repayments and other changes in non-current debt -15-15 -45 -101
Changes in current loans and other changes -2-2 1 -2
Dividends paid -126-126 -114 -264
Cash flow from financing activitiesCash flow from financing activities -17-17 -67 -278
Change in cash and cash equivalents, increase (+)/decrease (-)Change in cash and cash equivalents, increase (+)/decrease (-) -96-96 -70 -83
Cash and cash equivalents at the beginning of the reporting period 379379 472 472
Exchange rate changes -3-3 1 -10
Cash and cash equivalents at the end of the reporting period 282282 403 379
Anchor
Consolidated statement of changes in equity
Total equity attributable to equity holders of the parent companyTotal equity attributable to equity holders of the parent company
Non-Non-controllingcontrolling
interestsinterestsTotalTotal
equityequity
MEURMEURShareShare
capitalcapitalShareShare
premiumpremium
Transla-Transla-tion dif-tion dif-ferenceference
FairFairvaluevalue
reservereserve
Remea-Remea-sure-sure-
ments ofments ofdefineddefinedbenefitbenefit
liabilitiesliabilitiesRetainedRetainedearningsearnings
Equity on 31 December 2016Equity on 31 December 2016 336336 6161 -57-57 -39-39 -45-45 2 0322 032 3434 2 3212 321
Restatement due to IFRS 9 -3-3 -3-3
Restatement due to IFRS 15 -13-13 -13-13
Equity on 1 January 2017Equity on 1 January 2017 336336 6161 -57-57 -39-39 -45-45 2 0162 016 3434 2 3052 305
Restated total comprehensive income for the financialperiod -74-74 2828 77 376376 -3-3 333333
Dividends paid -256-256 -6-6 -263-263
Equity on 1 January 2018Equity on 1 January 2018 336336 6161 -132-132 -10-10 -38-38 2 1352 135 2424 2 3762 376
Total comprehensive income for the reporting period -5-5 1212 5858 -1-1 6464
Dividends paid -272-272 -273-273
Equity on 31 March 2018Equity on 31 March 2018 336336 6161 -136-136 22 -39-39 1 9211 921 2222 2 1672 167
WÄRTSILÄ CORPORATION January-March 2018 Interim report 17

Total equity attributable to equity holders of the parent companyTotal equity attributable to equity holders of the parent company
Non-Non-controllingcontrolling
interestsinterestsTotalTotal
equityequity
MEURMEURShareShare
capitalcapitalShareShare
premiumpremium
Transla-Transla-tion dif-tion dif-ferenceference
FairFairvaluevalue
reservereserve
Remea-Remea-sure-sure-
ments ofments ofdefineddefinedbenefitbenefit
liabilitiesliabilitiesRetainedRetainedearningsearnings
Equity on 31 December 2016Equity on 31 December 2016 336 61 -57 -39 -45 2 032 34 2 321
Restatement due to IFRS 9 -3 -3
Restatement due to IFRS 15 -13 -13
Equity on 1 January 2017Equity on 1 January 2017 336 61 -57 -39 -45 2 016 34 2 305
Restated total comprehensive income for thereporting period 5 8 53 1 66
Dividends paid -256 -257
Equity on 31 March 2017Equity on 31 March 2017 336 61 -52 -31 -45 1 812 34 2 114
Anchor
Acquisitions
Trident Group and LOCK-N-STITCH Inc.Trident Group and LOCK-N-STITCH Inc.
In February, Wärtsilä acquired 100% of Trident B.V. and LOCK-N-STITCH Inc.
Trident B.V. is a Netherland based company specialised in underwater ship maintenance, inspection, and repair services. With this acquisition,Wärtsilä builds in-house competence, captures the full potential of services’ product synergies, and strengthens its position in the market.
LOCK-N-STITCH Inc. is an American engineering company serving customers within the marine and energy sectors as well as other industries. Itspecialises in cast iron repairs. The acquisition strengthens Wärtsilä’s service portfolio for customers operating multiple brands.
The following tables summarise the preliminary amounts for the consideration paid, the cash flow from the acquisitions and the amounts of theassets acquired and liabilities assumed recognised at the acquisition dates.
Preliminary considerationPreliminary consideration MEURMEUR
Consideration transferred 2525
Total consideration transferredTotal consideration transferred 2525
Preliminary cash flow from the acquisitionsPreliminary cash flow from the acquisitions MEURMEUR
Consideration paid in cash 2020
Contingent consideration 44
Cash and cash equivalents of the acquired companies -1-1
Total cash flow from the acquisitionsTotal cash flow from the acquisitions 2424
WÄRTSILÄ CORPORATION January-March 2018 Interim report 18

Provisional values of the assets and liabilities arising from the acquisitionProvisional values of the assets and liabilities arising from the acquisition MEURMEUR
Intangible assets 1111
Property, plant and equipment 22
Inventories 11
Trade and other receivables 55
Cash and cash equivalents 11
Total assetsTotal assets 1919
Trade payables and other liabilities 33
Deferred tax liabilities 22
Total liabilitiesTotal liabilities 66
Total net assetsTotal net assets 1414
Preliminary goodwillPreliminary goodwill 1111
The preliminary fair values of acquired identifiable intangible assets at the dates of acquisitions (including technology, customer relations, and trademarks) amounted to EUR 11 million. The fair value of current trade receivables and other receivables is approximately EUR 5 million. The fair valueof trade receivables does not include any significant risk.
The preliminary goodwill of EUR 11 million reflects the value of know-how and expertise in advanced underwater services.
During 2018, the acquisition-related costs the Group incurred related to external legal fees and due diligence costs were insignificant. The costshave been included in the other operating expenses in the condensed statement of income.
Pro formaPro forma
If the acquisitions had occurred on 1 January 2018, management estimates that consolidated net sales would have been EUR 1,067 million. Theimpact in the consolidated operating result would not have been significant. In determining these amounts, management has assumed that the fairvalue adjustments, which arose on the dates of acquisitions would have been the same if the acquisitions had occurred on 1 January 2018.
Anchor
Net sales by geographical areas
RestatedRestated RestatedRestated
MEURMEUR 1–3/20181–3/2018 1–3/20171–3/2017 20172017
Europe 340340 320 1 526
Asia 366366 366 1 933
The Americas 246246 253 1 132
Other 114114 67 321
TotalTotal 1 0661 066 1 005 4 911
Anchor
WÄRTSILÄ CORPORATION January-March 2018 Interim report 19

Disaggregation of revenue
Revenue from the contracts with customers is derived over time and at a point in time in the following revenue types.
Net sales by revenue typeNet sales by revenue type
MEURMEUR 1–3/20181–3/2018 1–3/20171–3/2017 20172017
Products 261261 289 1 149
Goods and services 111111 117 567
Projects 569569 516 2 785
Long-term agreements 125125 84 410
TotalTotal 1 0661 066 1 005 4 911
Timing of satisfying performance obligationsTiming of satisfying performance obligations
MEURMEUR 1–3/20181–3/2018 1–3/20171–3/2017 20172017
At a point in time 771771 688 3 522
Over time 295295 317 1 389
TotalTotal 1 0661 066 1 005 4 911
Product sales consist of sales of spare parts and standard equipment for which the revenue is recognised at a point in time when the control of theproducts has transferred to customer, in general at the delivery of the goods.
Goods and services -type of revenue involves short-term field service jobs, which includes the delivery of a combination of service and equipment.The revenue is recognised at a point in time when service is rendered.
Projects contain short-term and long-term projects. Depending on the contract terms and the duration of the project, the revenue is recognised ata point in time or over time. Revenue related to long-term projects, such as construction contracts, integrated solutions projects, ship design, andenergy solutions contracts, is recognised over time. Revenue for tailor-made equipment delivery projects is recognised at a point in time.
Long-term agreements contain long-term operating and maintenance agreements for which the revenue is recognised over time.
Anchor
Measures of profit and items affecting comparability
RestatedRestated RestatedRestated
MEURMEUR 1–3/20181–3/2018 1–3/20171–3/2017 20172017
Comparable adjusted EBITAComparable adjusted EBITA 9898 90 612
Purchase price allocation amortisation -10-10 -9 -36
WÄRTSILÄ CORPORATION January-March 2018 Interim report 20

Comparable operating resultComparable operating result 8888 82 576
Items affecting comparability:Items affecting comparability:
Social plan costs -2-2 -1 -10
Impairment and write-downs -2 -18
Transfer costs -3
Other restructuring costs -3 -7
Items affecting comparability, totalItems affecting comparability, total -3-3 -6 -37
Operating resultOperating result 8585 76 538
Anchor
Intangible assets and property, plant & equipment
MEURMEUR 1–3/20181–3/2018 1–3/20171–3/2017 20172017
Intangible assetsIntangible assets
Carrying amount on 1 January 1 5771 577 1 434 1 434
Changes in exchange rates -4-4 -1 -39
Acquisitions 2222 1 217
Additions 77 2 25
Amortisation and impairment -16-16 -15 -60
Carrying amount at the end of the reporting periodCarrying amount at the end of the reporting period 1 5861 586 1 421 1 577
Property, plant and equipmentProperty, plant and equipment
Carrying amount on 1 January 349349 405 405
Changes in exchange rates -1-1 -12
Acquisitions 22
Additions 1010 6 39
Depreciation and impairment -14-14 -18 -75
Disposals and reclassifications -10
Carrying amount at the end of the reporting periodCarrying amount at the end of the reporting period 346346 393 349
Anchor
Gross capital expenditure
MEURMEUR 1–3/20181–3/2018 1–3/20171–3/2017 20172017
Investments in securities and acquisitions 2020 1 191
Intangible assets and property, plant and equipment 1717 8 64
TotalTotal 3737 9 255
WÄRTSILÄ CORPORATION January-March 2018 Interim report 21
Anchor
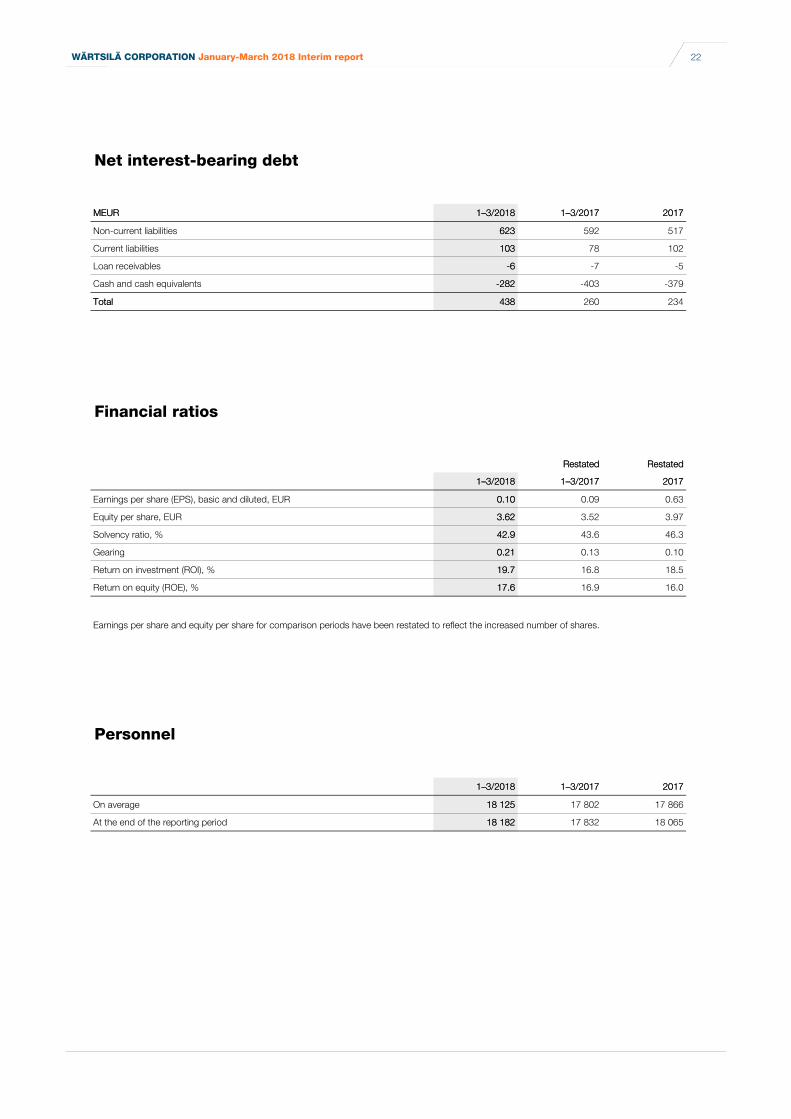
Net interest-bearing debt
MEURMEUR 1–3/20181–3/2018 1–3/20171–3/2017 20172017
Non-current liabilities 623623 592 517
Current liabilities 103103 78 102
Loan receivables -6-6 -7 -5
Cash and cash equivalents -282-282 -403 -379
TotalTotal 438438 260 234
Anchor
Financial ratios
RestatedRestated RestatedRestated
1–3/20181–3/2018 1–3/20171–3/2017 20172017
Earnings per share (EPS), basic and diluted, EUR 0.100.10 0.09 0.63
Equity per share, EUR 3.623.62 3.52 3.97
Solvency ratio, % 42.942.9 43.6 46.3
Gearing 0.210.21 0.13 0.10
Return on investment (ROI), % 19.719.7 16.8 18.5
Return on equity (ROE), % 17.617.6 16.9 16.0
Earnings per share and equity per share for comparison periods have been restated to reflect the increased number of shares.
Anchor
Personnel
1–3/20181–3/2018 1–3/20171–3/2017 20172017
On average 18 12518 125 17 802 17 866
At the end of the reporting period 18 18218 182 17 832 18 065
WÄRTSILÄ CORPORATION January-March 2018 Interim report 22

Anchor
Contingent liabilities
MEURMEUR 1–3/20181–3/2018 1–3/20171–3/2017 20172017
Mortgages 1010 10 10
Chattel mortgages and other pledges and securities 1818 25 19
TotalTotal 2828 35 29
Guarantees and contingent liabilities
on behalf of Group companies 750750 975 737
Nominal amount of rents according to leasing contracts
payable within one year 3333 31 35
payable between one and five years 9292 80 101
payable later 6363 26 48
TotalTotal 938938 1 112 922
Anchor
Nominal values of derivative instruments
MEURMEUR Total amountTotal amount of which closedof which closed
Interest rate swaps 285285
Cross currency swaps 7676
Foreign exchange forward contracts 2 4302 430 1 0141 014
TotalTotal 2 7922 792 1 0141 014
In addition, the Group had copper futures and swaps amounting to 213 tons.
Anchor
Fair values
Fair value measurements at the end of the reporting period:Fair value measurements at the end of the reporting period:
MEURMEUR
Carrying amountsCarrying amountsof the statementof the statement
of financialof financialposition itemsposition items
FairFairvaluevalue
Financial assetsFinancial assets
Other investments (level 3) 1313 1313
Interest-bearing investments, non-current (level 2) 66 66
Other receivables, non-current (level 2) 33 33
WÄRTSILÄ CORPORATION January-March 2018 Interim report 23

Derivatives (level 2) 4040 4040
Financial liabilitiesFinancial liabilities
Interest-bearing debt, non-current (level 2) 623623 630630
Derivatives (level 2) 2828 2828
Anchor
Events after the balance sheet date
On 19 March 2018, Wärtsilä signed an agreement to acquire Transas, a global company headquartered in the U.K. Transas is a global marketleader in marine navigation solutions that include complete bridge systems, digital products and electronic charts. The company is also a leader inprofessional training and simulation services, ship traffic control, as well as monitoring, and support.
Transas’ current annual net sales are in the region of EUR 140 million. The company has 22 regional offices worldwide and a distribution networkthat spans 120 countries. It has a workforce of approximately 1,000 employees who will be integrated within Wärtsilä’s market area MarineSolutions.
This acquisition takes Wärtsilä a significant step closer to achieving its mission of enabling sustainable societies with smart technologies. It will alsospeed delivery on the company’s promise to disrupt the industry by establishing an ecosystem that is digitally connected across the entire supplychain, through applications that are secure, smart and cloud-based.
The transaction is valued at EUR 210 million (enterprise value) and is expected to be closed during the second quarter of 2018.
Anchor
Quarterly figures
RestatedRestated RestatedRestated RestatedRestated RestatedRestated
MEURMEUR1–3/1–3/
2018201810–12/10–12/
201720177–9/7–9/
201720174–6/4–6/
201720171–3/1–3/
2017201710–12/10–12/
201620167–9/7–9/
201620164–6/4–6/
201620161–3/1–3/
20162016
Order intakeOrder intake
Services 737737 696 598 641 735 565 522 527 580
Energy Solutions 414414 501 418 361 405 501 330 304 312
Marine Solutions 357357 316 339 361 273 258 287 362 379
TotalTotal 1 5071 507 1 514 1 354 1 363 1 413 1 324 1 139 1 194 1 271
Order book at the end of the reporting periodOrder book at the end of the reporting period
Services 1 4011 401 1 220 1 249 1 239 1 234 999 1 031 1 048 1 017
Energy Solutions 2 0122 012 1 871 1 839 1 764 1 847 1 680 1 676 1 547 1 491
Marine Solutions 2 0772 077 2 009 2 018 2 087 2 033 2 017 2 317 2 488 2 595
TotalTotal 5 4905 490 5 100 5 107 5 089 5 114 4 696 5 024 5 083 5 103
WÄRTSILÄ CORPORATION January-March 2018 Interim report 24

Net salesNet sales
Services 535535 710 569 594 534 636 512 542 500
Energy Solutions 267267 425 324 412 239 414 177 220 132
Marine Solutions 264264 305 282 284 233 509 390 433 335
TotalTotal 1 0661 066 1 441 1 175 1 290 1 005 1 559 1 079 1 196 967
Share of result of associates and joint ventures 33 6 3 3 1 5 2 4 3
Comparable adjusted EBITA 9898 250 141 130 90 262 132 131 93
as a percentage of net sales 9.29.2 17.4 12.0 10.1 9.0 16.8 12.3 10.9 9.6
Depreciation, amortisation and impairment -30-30 -42 -30 -30 -33 -34 -31 -42 -31
Purchase price allocation amortisation -10-10 -10 -9 -9 -9 -9 -9 -9 -9
Comparable operating result 8888 241 131 122 82 253 123 122 84
as a percentage of net sales 8.38.3 16.7 11.2 9.5 8.1 16.3 11.4 10.2 8.7
Items affecting comparability, total -3-3 -19 -4 -8 -6 -22 -2 -26 -1
Operating result 8585 222 127 114 76 231 122 96 83
as a percentage of net sales 8.08.0 15.4 10.8 8.8 7.5 14.8 11.3 8.0 8.6
Financial income and expenses -9-9 -10 -17 -14 -5 -5 -7 -38 -3
Profit before taxes 7676 211 110 99 70 226 115 58 80
Income taxes -19-19 -47 -28 -26 -16 -55 -31 -17 -20
Profit for the reporting period 5757 165 82 73 54 172 84 41 60
Earnings per share (EPS), basic and diluted, EUR 0.100.10 0.28 0.14 0.12 0.09 0.29 0.14 0.06 0.10
Gross capital expenditure 3737 79 156 11 9 20 55 60 11
Investments in securities and acquisitions 2020 45 145 1 42 49
Cash flow from operating activities -42-42 276 150 2 2 235 189 202 -13
Working capital (WCAP) at the end of the reportingperiod 726726 563 632 658 561 490 540 602 709
Personnel at the end of the reporting periodPersonnel at the end of the reporting period
Services 11 32811 328 11 234 11 135 11 059 11 067 10 567 10 648 10 575 10 331
Energy Solutions 1 0841 084 1 038 1 017 928 913 903 920 945 958
Marine Solutions 5 1975 197 5 235 5 167 5 257 5 317 6 074 6 305 6 443 6 681
Other 573573 559 540 539 533 467 464 465 457
TotalTotal 18 18218 182 18 065 17 859 17 783 17 832 18 011 18 337 18 428 18 427
Earnings per share for comparison periods have been restated to reflect the increased number of shares.
Comparison periods for 2017 have been restated due to the internal transfer of service activities.
WÄRTSILÄ CORPORATION January-March 2018 Interim report 25

Anchor
Calculation of financial ratios
Earnings per share (EPS), basic and dilutedEarnings per share (EPS), basic and diluted
Profit for the reporting period attributable to equity holders of the parent company
Adjusted number of shares over the reporting period
Equity per shareEquity per share
Equity attributable to equity holders of the parent company
Adjusted number of shares at the end of the reporting period
Solvency ratioSolvency ratio
Equity
Total equity and liabilities – advances receivedx 100
GearingGearing
Interest-bearing liabilities – cash and cash equivalents
Equity
Return on investment (ROI)Return on investment (ROI)
Profit before taxes + interest and other financial expenses
Total equity and liabilities – non-interest-bearing liabilities – provisions, average over the reporting periodx 100
Return on equity (ROE)Return on equity (ROE)
Profit for the reporting period
Equity, average over the reporting periodx 100
Working capital (WCAP)Working capital (WCAP)
(Inventories + trade receivables + income tax receivables + other non-interest-bearing receivables)– (trade payables + advances received + pension obligations + provisions + income tax liabilities + other non-interest-bearingliabilities – dividend payable)
Comparable adjusted EBITAComparable adjusted EBITA
Operating result – items affecting comparability – purchase price allocation amortisation
Comparable operating resultComparable operating result
Operating result – items affecting comparability
Items affecting comparabilityItems affecting comparability
Items affecting comparability are related to restructuring measures and one-time charges for events or activities, which are not part ofthe normal business operations
Anchor23 April 2018
Wärtsilä Corporation
Board of Directors
WÄRTSILÄ CORPORATION January-March 2018 Interim report 26