ORAU Team Document Number: Dose Reconstruction … Reconstruction Project for NIOSH ... In this...
55
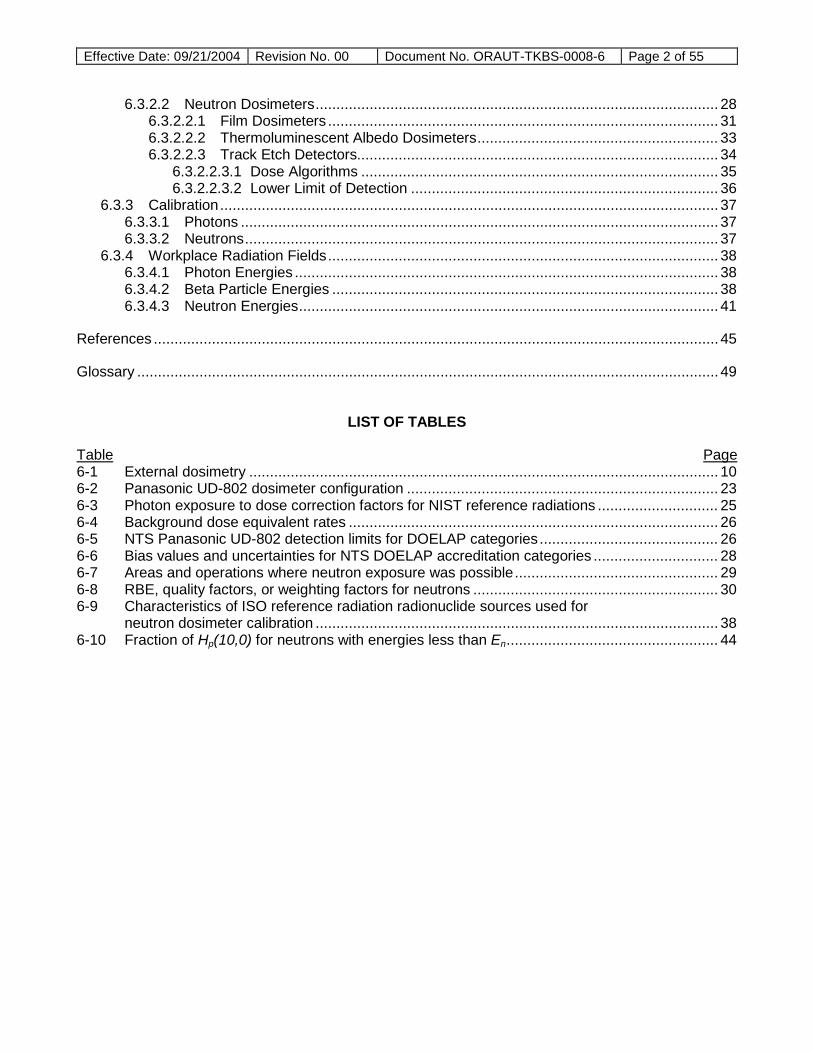
ORAU Team Dose Reconstruction Project for NIOSH Technical Basis Document for the Nevada Test Site – Occupational External Dose Document Number: ORAUT-TKBS-0008-6 Effective Date: 09/21/2004 Revision No.: 00 Controlled Copy No.: ________ Page 1 of 55 Subject Expert: Eugene M. Rollins Document Owner Approval: Signature on File Date: 09/16/2004 Eugene M. Rollins, TBD Team Leader Approval: Signature on File Date: 09/16/2004 Judson L. Kenoyer, Task 3 Manager Concurrence: Signature on File Date: 09/13/2004 Richard E. Toohey, Project Director Approval: Signature on File Date: 09/21/2004 James W. Neton, Associate Director for Science Supersedes: None TABLE OF CONTENTS Section Record of Issue/Revisions ................................................................................................................... Page 4 Acronyms and Abbreviations ............................................................................................................... 5 6.1 Introduction ................................................................................................................................. 7 6.2 Dosimetric Basis of Comparison ................................................................................................. 7 6.2.1 Photon Measurement Quantities ........................................................................................ 8 6.2.2 Beta Measurement Quantities ............................................................................................ 9 6.2.3 Neutron Measurement Quantities ....................................................................................... 9 6.3 Dose Reconstruction Parameters ............................................................................................... 9 6.3.1 Administrative Practices ................................................................................................... 12 6.3.2 Dosimetry Technology...................................................................................................... 14 6.3.2.1 Beta/Gamma Dosimeters......................................................................................... 14 6.3.2.1.1 Photographic Film Dosimeters ........................................................................ 15 6.3.2.1.2 Beta Dosimetry with Film Badges.................................................................... 17 6.3.2.1.3 Evaluating Photon Doses with Film Badge Dosimetry ..................................... 18 6.3.2.1.4 Estimation of Beta Doses from Film Badge Results ........................................ 19 6.3.2.1.5 Thermoluminescent Dosimeters...................................................................... 19 6.3.2.1.5.1 NRDS Thermoluminescent Dosimeters ................................................... 19 6.3.2.1.5.2 REECo Thermoluminescent Dosimeters .................................................. 20 6.3.2.1.5.3 Energy Response .................................................................................... 23 6.3.2.1.5.3.1 Dose Measurement ....................................................................... 24 6.3.2.1.5.3.2 Detection Limits ............................................................................. 25 6.3.2.1.5.3.3 Calibration ..................................................................................... 26 6.3.2.1.5.3.4 Quality Assurance.......................................................................... 27
Transcript of ORAU Team Document Number: Dose Reconstruction … Reconstruction Project for NIOSH ... In this...
ORAU Team Dose Reconstruction Project for NIOSH
Technical Basis Document for the Nevada Test Site – Occupational External Dose
Document Number: ORAUT-TKBS-0008-6
Effective Date: 09/21/2004 Revision No.: 00 Controlled Copy No.: ________ Page 1 of 55
Subject Expert: Eugene M. Rollins Document Owner Approval: Signature on File Date: 09/16/2004 Eugene M. Rollins, TBD Team Leader
Approval: Signature on File Date: 09/16/2004 Judson L. Kenoyer, Task 3 Manager
Concurrence: Signature on File Date: 09/13/2004 Richard E. Toohey, Project Director
Approval: Signature on File Date: 09/21/2004 James W. Neton, Associate Director for Science
Supersedes:
None
TABLE OF CONTENTS
Section
Record of Issue/Revisions ...................................................................................................................
Page
4
Acronyms and Abbreviations ............................................................................................................... 5
6.1 Introduction ................................................................................................................................. 7
6.2 Dosimetric Basis of Comparison ................................................................................................. 7 6.2.1 Photon Measurement Quantities ........................................................................................ 8 6.2.2 Beta Measurement Quantities ............................................................................................ 9 6.2.3 Neutron Measurement Quantities ....................................................................................... 9
6.3 Dose Reconstruction Parameters ............................................................................................... 9 6.3.1 Administrative Practices ................................................................................................... 12 6.3.2 Dosimetry Technology ...................................................................................................... 14
6.3.2.1 Beta/Gamma Dosimeters......................................................................................... 14 6.3.2.1.1 Photographic Film Dosimeters ........................................................................ 15 6.3.2.1.2 Beta Dosimetry with Film Badges.................................................................... 17 6.3.2.1.3 Evaluating Photon Doses with Film Badge Dosimetry ..................................... 18 6.3.2.1.4 Estimation of Beta Doses from Film Badge Results ........................................ 19 6.3.2.1.5 Thermoluminescent Dosimeters ...................................................................... 19
6.3.2.1.5.1 NRDS Thermoluminescent Dosimeters ................................................... 19 6.3.2.1.5.2 REECo Thermoluminescent Dosimeters .................................................. 20 6.3.2.1.5.3 Energy Response .................................................................................... 23
6.3.2.1.5.3.1 Dose Measurement ....................................................................... 24 6.3.2.1.5.3.2 Detection Limits ............................................................................. 25 6.3.2.1.5.3.3 Calibration ..................................................................................... 26 6.3.2.1.5.3.4 Quality Assurance.......................................................................... 27
Effective Date: 09/21/2004 Revision No. 00 Document No. ORAUT-TKBS-0008-6 Page 2 of 55
6.3.2.2 Neutron Dosimeters ................................................................................................. 28 6.3.2.2.1 Film Dosimeters .............................................................................................. 31 6.3.2.2.2 Thermoluminescent Albedo Dosimeters .......................................................... 33 6.3.2.2.3 Track Etch Detectors....................................................................................... 34
6.3.2.2.3.1 Dose Algorithms ...................................................................................... 35 6.3.2.2.3.2 Lower Limit of Detection .......................................................................... 36
6.3.3 Calibration ........................................................................................................................ 37 6.3.3.1 Photons ................................................................................................................... 37 6.3.3.2 Neutrons .................................................................................................................. 37
6.3.4 Workplace Radiation Fields .............................................................................................. 38 6.3.4.1 Photon Energies ...................................................................................................... 38 6.3.4.2 Beta Particle Energies ............................................................................................. 38 6.3.4.3 Neutron Energies ..................................................................................................... 41
References ........................................................................................................................................ 45
Glossary ............................................................................................................................................ 49
LIST OF TABLES
Table 6-1 External dosimetry .................................................................................................................
Page 10
6-2 Panasonic UD-802 dosimeter configuration ........................................................................... 23 6-3 Photon exposure to dose correction factors for NIST reference radiations ............................. 25 6-4 Background dose equivalent rates ......................................................................................... 26 6-5 NTS Panasonic UD-802 detection limits for DOELAP categories ........................................... 26 6-6 Bias values and uncertainties for NTS DOELAP accreditation categories .............................. 28 6-7 Areas and operations where neutron exposure was possible ................................................. 29 6-8 RBE, quality factors, or weighting factors for neutrons ........................................................... 30 6-9 Characteristics of ISO reference radiation radionuclide sources used for
neutron dosimeter calibration ................................................................................................. 38 6-10 Fraction of Hp(10,0) for neutrons with energies less than En ................................................... 44

Effective Date: 09/21/2004 Revision No. 00 Document No. ORAUT-TKBS-0008-6 Page 3 of 55
LIST OF FIGURES
Figure 6-1 Security badge for NRDS TLD ...............................................................................................
Page 20
6-2 REECo badge holder ............................................................................................................. 21 6-3 REECo security badge holder with Panasonic UD-802 dosimeter .......................................... 21 6-4 Typical photon energy response curves for Li2B4O7 and CaSO4 TLD
elements ................................................................................................................................ 23 6-5 Panasonic UD-802 energy responses .................................................................................... 24 6-6 Ratio of fluence to dose conversion coefficients for personal dose
equivalent Hp(10, 0°) to conversion coefficients for dose equivalent H ................................... 31 6-7 NTA film neutron energy response ......................................................................................... 32 6-8 Neutron energy response of NTS albedo dosimeters ............................................................. 33 6-9 Neutron energy response of NTS TED ................................................................................... 34 6-10 Electrochemically etched CR-39 dose response .................................................................... 36 6-11 Lethargy neutron spectra for 252Cf calibration source with and without
room scatter ........................................................................................................................... 42 6-12 Lethargy neutron spectra for 252Cf with various thickness moderators .................................... 42 6-13 Lethargy neutron spectra for an 241Am-Be calibration source with and
without room scatter ............................................................................................................... 43 6-14 Fraction of Hp(10,0) due to neutrons with energies less than En ............................................. 43

Effective Date: 09/21/2004 Revision No. 00 Document No. ORAUT-TKBS-0008-6 Page 4 of 55
RECORD OF ISSUE/REVISIONS ISSUE AUTHORIZATION DATE
EFFECTIVE DATE
REV. NO. DESCRIPTION
Draft
12/30/2003
00-A
Information contained in Revision 00 is applicable only to employment periods after 1962 (post-atmospheric testing phase) and to workers not
1. BLANCA (October 30, 1958)
identified as involved with drillback activities prior to 1965. In addition, Revision 00 is not applicable to dose reconstruction for (1) workers involved with weapons testing at locations other than the NTS (South Pacific, Alaska, etc.); (2) workers affected by any of the following 10 underground tests that resulted in unexpected release of radioactive material:
2. DES MOINES (June 13, 1962) 3. BANEBERRY (December 18, 1970) 4. CAMPHOR (June 29, 1971) 5.. DIAGONAL LINE (November 24, 1971) 6. RIOLA (September 25, 1980) 7. AGRINI (March 31, 1984) 8. MIDAS MYTH (February 15, 1984) 9. MISTY RAIN (April 6, 1985)
10. MIGHTY OAK (April 10, 1986) It is also assumed that, because they were such a rarity, it would be likely that if a claimant was involved in one of these events, he [or his survivor] would mention it in his CATI. All of these conditions are likely verifiable by careful examination of the DOL, DOE (incident reports and dosimetry records), and OCAS documents. Initiated by Eugene M. Rollins.
Draft 02/23/2004 00-B Incorporates internal and NIOSH comments. Initiated by Eugene M. Rollins.
Draft 05/21/2004 00-C Incorporates additional internal and NIOSH comments. Initiated by Eugene M. Rollins.
Draft 08/04/2004 00-D Incorporates additional internal and NIOSH comments. Initiated by Eugene M. Rollins.
09/21/2004 09/21/2004 00 First approved issue. Initiated by Eugene M. Rollins.
Effective Date: 09/21/2004 Revision No. 00 Document No. ORAUT-TKBS-0008-6 Page 5 of 55
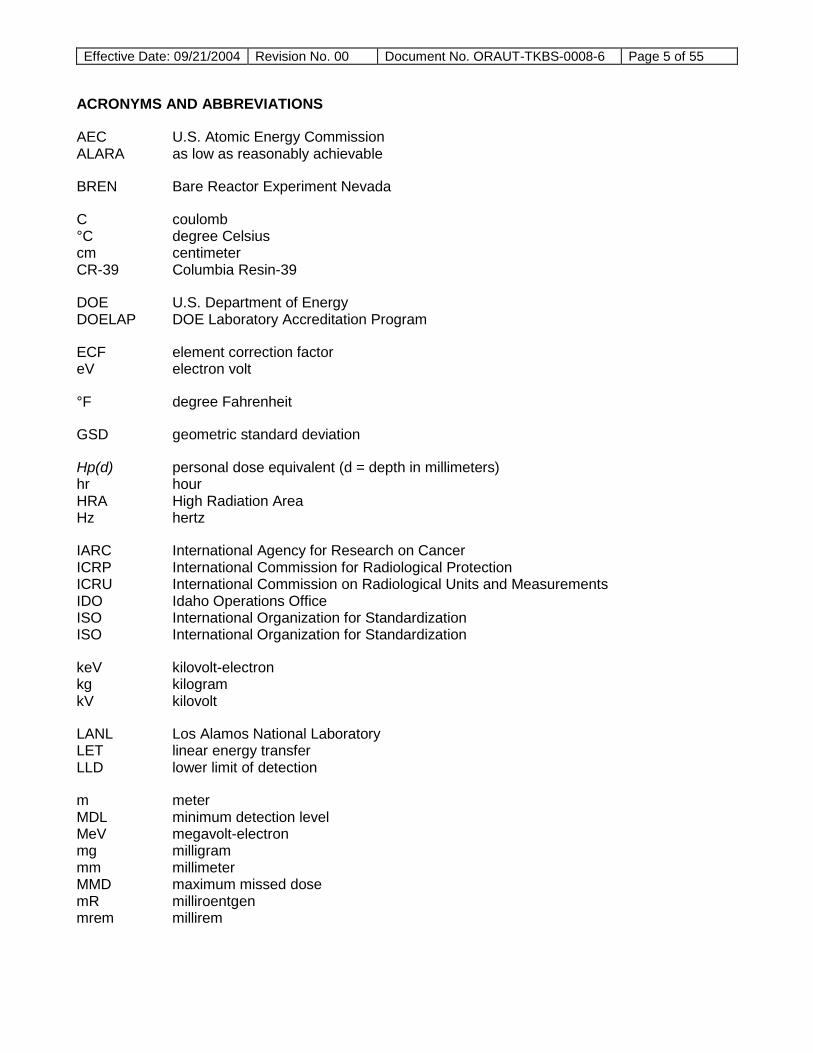
ACRONYMS AND ABBREVIATIONS
AEC U.S. Atomic Energy Commission ALARA as low as reasonably achievable
BREN Bare Reactor Experiment Nevada
C coulomb °C degree Celsius cm centimeter CR-39 Columbia Resin-39
DOE U.S. Department of Energy DOELAP DOE Laboratory Accreditation Program
ECF element correction factor eV electron volt
°F degree Fahrenheit
GSD geometric standard deviation
Hp(d) personal dose equivalent (d = depth in millimeters) hr hour HRA High Radiation Area Hz hertz
IARC International Agency for Research on Cancer ICRP International Commission for Radiological Protection ICRU International Commission on Radiological Units and Measurements IDO Idaho Operations Office ISO International Organization for Standardization ISO International Organization for Standardization
keV kilovolt-electron kg kilogram kV kilovolt
LANL Los Alamos National Laboratory LET linear energy transfer LLD lower limit of detection
m meter MDL minimum detection level MeV megavolt-electron mg milligram mm millimeter MMD maximum missed dose mR milliroentgen mrem millirem

Effective Date: 09/21/2004 Revision No. 00 Document No. ORAUT-TKBS-0008-6 Page 6 of 55
NBS National Bureau of Standards NCRP National Council on Radiation Protection and Measurements NIOSH National Institute for Occupational Safety and Health NIST National Institute of Standards and Technology NRC National Research Council NRDS Nuclear Rocket Development Station NRTS National Reactor Testing Station NTA neutron track emulsion, type A NTS Nevada Test Site
OW open window
Pan Am Pan American Airways PIC pocket ionization chamber
QA quality assurance QC quality control
R roentgen RadCon radiation control radex controlled radiation exclusion areas RBE relative biological effectiveness RCF run calibration factor REECo Reynolds Electrical and Engineering Company
TBD technical basis document TED track etch detector TEDE total effective dose equivalent TLD thermoluminescent dosimeter TRU transuranic
VHRA Very High Radiation Area
wk week
YMP Yucca Mountain Project yr year
Z atomic number

Effective Date: 09/21/2004 Revision No. 00 Document No. ORAUT-TKBS-0008-6 Page 7 of 55
6.1 INTRODUCTION
Technical Basis Documents and Site Profile Documents are general working documents that provide guidance concerning the preparation of dose reconstructions at particular sites or categories of sites. They will be revised in the event additional relevant information is obtained about the affected site(s). These documents may be used to assist the National Institute for Occupational Safety and Health (NIOSH) in the completion of the individual work required for each dose reconstruction.
In this document the word “facility” is used as a general term for an area, building, or group of buildings that served a specific purpose at a site. It does not necessarily connote an “atomic weapons employer facility” or a “Department of Energy facility” as defined in the Energy Employee Occupational Illness Compensation Program Act of 2000 [42 U.S.C. Sections 7384l(5) and (12)].
Operations at the Nevada Test Site (NTS) involved atmospheric and underground weapons tests, experimental reactor tests intended for aircraft and rocket propulsion, and low-level transuranic (TRU) waste disposal. NTS workers received exposures from a range of fission and activation products from test programs conducted from the early 1950s. Exposure venues of particular significance include sample and measurement device recovery to assess weapon yields, terrestrial and airborne fallout plume tracking, aircraft operations (when used) for weapon assembly deployment and surveillance, and post-event decontamination processes.
Radiation monitoring and control programs instituted with the mission of NTS included personal dosimetry, area monitoring, source term characterization, and measurements of fallout (contamination) dispersion. As NTS test programs progressed, efforts to measure exposures and limit dose improved. The atmospheric nuclear test series consisted of a number of operations between 1951 and 1958, and again from 1961 to 1963. Each operation consisted of a number of individual tests. Underground nuclear tests occurred at NTS from 1961 to 1992.
6.2 DOSIMETRIC BASIS OF COMPARISON
Since the start of the Manhattan Engineering District program in the early 1940s, various dosimetric concepts and quantities have been used to measure and record occupational exposure from external radiation sources. The selection of the measurement quantities to be used for radiation protection was initially based on the radiation interaction properties of the primary radiations of interest – photons (X- and gamma rays), electrons (beta particles), and neutrons – and the measurement methods employed. Sections 6.2.1 to 6.2.3 discuss these quantities briefly.
The problem with the use of different quantities for different radiations is that it prevented direct comparison of measurements of the three primary radiation qualities. In the 1950s the industry recognized a need for a special quantity to facilitate comparison of measurements of the various radiation qualities. The concepts of quality factor and dose equivalent were formally introduced by the International Commission for Radiological Protection (ICRP) and the International Commission on Radiation Units and Measurements (ICRU) in 1962 (ICRU 1962). The special unit of dose equivalent was the rem. As early as 1961, NTS radiation exposure criteria and guidance were given in rem (AEC 1961).
In 1985, ICRU defined a new set of operational quantities defined as radiation quantities for operational radiation protection measurement purposes (ICRU 1993). These quantities have a common definition for the three primary radiation qualities, so they have the advantage that they provide a means of direct comparison of measurements of these radiations.
Effective Date: 09/21/2004 Revision No. 00 Document No. ORAUT-TKBS-0008-6 Page 8 of 55
The operational quantity recommended for individual or personal monitoring is the personal dose equivalent Hp(d) where d is the depth (in millimeters) and represents the point of reference for dose in tissue. For weakly penetrating radiation of significance to skin dose, d is 0.07 mm and the operational quantity is noted as Hp(0.07). For strongly penetrating radiation of significance to whole-body dose, d is 10 mm and the operational quantity is noted as Hp(10). Both Hp(0.07) and Hp(10) are recommended as the operational quantities to be recorded for radiological protection proposed by the ICRU (1993).
These personal dose equivalents, Hp(0.07) and Hp(10), have been used in the U.S. Department of Energy (DOE) Laboratory Accreditation Program (DOELAP) for accreditation of the Department’s personnel dosimetry systems since the 1980s (DOE 1986). The International Agency for Research on Cancer (IARC) Three Country Combined Study (Fix et al. 1997; Fix, Wilson, and Baumgartner 1997) and IARC Collaborative Study (Thierry-Chef et al. 2002) selected Hp(10) as the quantity to assess error in recorded whole-body dose for workers in IARC nuclear worker epidemiologic studies.
6.2.1
From the beginning of operations at NTS, exposure was used as the basis of photon measurement. When in italics, the term exposure designates a radiation measurement quantity based on the electrical charges created in air due to interaction of photons. It is specific to air and photon measurement. The unit of exposure is coulomb per kilogram, and the special unit of exposure is the roentgen (1 R = 2.58 x 10⁻⁴ C/kg). Although the term exposure dose was used in the mid-1950s, exposure is not dose because it is not a measure of energy deposition in mass of material. ICRU recommended the use of exposure in 1962 (ICRU 1962). However, dose in soft tissue can be determined from exposure by the following relationship,
Photon Measurement Quantities
D = fR
where f is a constant that relates the exposure R in roentgen for a given photon energy to dose in soft tissue, and was typically taken to be 0.877 rad/R. Because 1 R is numerically slightly greater than 1 rad, it is claimant-favorable to assume a numerical equivalence of the two quantities. Therefore, if the energy and hence the constant f of the exposing photon radiation are unknown, it is appropriate to assume that 1 R equals 1 rad, which equals 10 milligray.
Instrument and dosimeter calibrations, dose measurements, and dose records were made in terms of exposure in units of milliroentgen. However, as noted above, from 1961 quarterly and annual limits were specified in millirem (AEC 1961), where the general term dose was used without specific reference to dose equivalent. As a result, individual monitoring results at NTS were recorded in millirem, although the measurements had been made in terms of exposure. However, for photons, the values of exposure and dose equivalent were considered to be essentially the same (Brady 2004; Brady and Iverson 1968). In effect, a de facto conversion factor of 1 rem/R was used for dose recording purposes.
Until July 1970 individual monitoring at the Nuclear Rocket Development Station (NRDS) was provided by the Reynolds Electrical and Engineering Company (REECo) using the standard NTS film dosimeter. From July 1970 until NRDS operations ceased in January 1973, individual monitoring was conducted by Pan American World Airways (Pan Am) using thermoluminescent dosimeters (TLDs) (Boone, Bennett, and Adams 1970). However, throughout NRDS operations, dosimeters were calibrated in terms of exposure and doses were recorded in millirem.

Effective Date: 09/21/2004 Revision No. 00 Document No. ORAUT-TKBS-0008-6 Page 9 of 55
Beginning in 1987, NTS occupational exposures were recorded in terms of personal dose equivalent, Hp(d). From 1962 to 1986, dose reconstructors should use the recorded photon dose values in terms of exposure, together with the Exposure to Organ Dose coefficients in Appendix B of NIOSH (2002) to determine organ dose. From 1987 on, the recorded values are in terms of Hp(10), and the Deep dose Equivalent to Organ Dose conversion factors (of NIOSH 2002, Appendix B) should be used.
6.2.2
As was common practice, NTS beta particle measurements were made in terms of absorbed dose, D. Until introduction of the ICRU defined operational quantities in 1985, beta doses were recorded as millirad. Because the quality factor for electrons (beta particles) was set at 1, the absorbed dose values are considered numerically equivalent to dose equivalent.
Beta Measurement Quantities
6.2.3
The basis for comparison for neutron radiation is complex because, historically, the calibration of dosimeters to measure neutron dose was based on different dosimetric quantities (such as first collision dose and multiple collision dose). However, the neutron dose equivalent specified by the National Council on Radiation Protection and Measurements (NCRP) has been used since 1971. Evaluation of the numerical difference in comparison with the Hp(10) dose used in DOELAP performance testing is used to establish relative values of the dose conversion factors for the dose quantities in conjunction with characteristics of the respective neutron dosimeter response characteristics and workplace radiation fields.
Neutron Measurement Quantities
Dose reconstructors should convert recorded neutron dose to Hp(10) using the factors in Table 6-1, and use the Deep Dose Equivalent to Organ Dose conversion factors from Appendix B of NIOSH (2002) to calculate the appropriate organ doses.
6.3 DOSE RECONSTRUCTION PARAMETERS
Examinations of the beta and photon (X- and gamma rays) radiation type, energy and geometry of exposure in the workplace, and characteristics of the dosimeter response are crucial to assessment of bias and uncertainty of the original recorded dose. Bias and uncertainty for current DOE dosimetry systems are well documented for Hp(0.07) and Hp(10) under DOELAP. The performance of current dosimeters can be compared to performance characteristics of historical dosimetry systems in the same, or highly similar, workplaces. In addition, current performance testing techniques can be applied to earlier dosimetry systems to achieve a consistent evaluation of those systems. Dosimeter response characteristics for radiation types and energies in the workplace are crucial to the overall analysis of error in recorded dose.
Overall accuracy and precision of the original recorded individual worker doses and their comparability to be considered in using NIOSH (2002) guidelines depend on the following factors (Fix et al. 1997; Fix, Wilson, and Baumgartner 1997):
• Administrative practices adopted by facilities to calculate and record personnel dose based on technical, administrative, and statutory compliance considerations
• Dosimetry technology, which includes physical capabilities of the dosimetry system such as the response to different types and energies of radiation, in particular to mixed radiation fields

Effective D
ate: 09/21/2004 R
evision No.: 00
Docum
ent No. O
RA
UT-TK
BS-0008-6 Page 10 of 55
Table 6-1. External dosimetry. Photon- beta dosimeters
Dosimeter Dates Operation Description Issue and exchange Measurement Quantity Bias GSD MDL MMD
DuPont 559 Packet
1961 to 1966 All of NTS
DuPont 301-4 packet, including: Type 508 low-range element (0.03 to 5 R) Type 834 high-range element (5 to 800 R) Lead filters, 0.028-in. thick, (symmetrical coverage on both sides) Packet covered with 0.004-in.-thick plastic bag.
Exchanged monthly for general exposures and on exit from radiation areas for exposures likely to exceed 100 mR.
Photon: Exposure 1. 1.23b Photon: 40
mR
Photon: 240 mR
DuPont Type 556 Packet
1966 to 1971 All of NTS
DuPont Type 556 film pack Type 508 (519 also referenced) low-range element (0.03 to 5 R) Type 834 high-range element (10 to 1,000 R) Four-area filter described: tantalum-cadmium, tantalum, Teflon, open With fast neutron pack, dosimeter was sensitive to mixed fields with thermal and fast neutrons, X-rays, beta, and gamma
Exchanged monthly for general exposures and on exit from radiation areas for exposures likely to exceed 100 mR.
Photon: Exposure Beta: Absorbed dosea
1. 1.23b,d
Photon: 40 mR Beta: 40 mreme
Photon: 240 mR Beta: 240 mrem
Kodak Type III
1971 to 1987 All of NTS Low-range element (0.03 to 10 R)
High-range element (10 to 800 R)
Exchanged monthly for general exposures and on exit from radiation areas for exposures likely to exceed 100 mR.
Photon: Exposure Beta: Absorbed dosea
1. 1.23d
Photon: 30 mRg
Beta: 30 mremg
Photon: 240 mR Beta: 240 mrem
Pan Am TLD 1970 to 1972 NRDS Two-element LiF, Type 700 Quarterly
Photon: Exposure Beta: Absorbed dosea
1.25 c 1.23d
Photon: 15 mRh Beta: 15 mremh
Photon: 30 mR Beta: 30 mrem
Panasonic 802
1987 to 2001 All of NTS
Four-element TLD – two Li2B4O7:Cu chips and two CaSO4:Tm chips. Filtration provided to determine gamma, deep dose, shallow dose, beta, and eye dose. NTS badge holder used from 1987
Quarterly Personal dose equivalent, Hp(d)f
1.1 c 1.23d 15 mrem 30 mrem
Panasonic 809
2001 to present All of NTS
Multi-element TLD containing four elements. E1 - gamma sensitive 7Li211B4O7(Cu), enriched to 99.99% in 7Li. E2, E3 and E4 – neutron-sensitive 6Li210B4O7(Cu) chips. Li-6 enriched to 95.33% and B-10 enriched to 94.64%. Elements are shielded with tin and cadmium on front and back, in various combinations.
Quarterly Personal dose equivalent, Hp(d)f
1.1 c 1.23d 15 mremh 30 mrem

Effective D
ate: 09/21/2004 R
evision No.: 00
Docum
ent No. O
RA
UT-TK
BS-0008-6 Page 11 of 55
Table 6-1 (Continued). External dosimetry. Neutron dosimeters
Dosimeter Dates Operation Description Issue and exchange Measurement Quantity Bias GSD MDL MMD
Kodak NTA 1966 to 1979
Areas where potential for neutron exposure existed
Responds to neutrons with energies above 0.8 MeV; range under near-ideal conditions 0.1 to few rem of neutrons; high gamma doses might mask neutron tracks
Exchanged monthly for general exposures and on exit from radiation areas for exposures likely to exceed 100 mR.
Dose equivalenti 5.c,j 1.52d 250 mremj,k 1,500 mrem
Albedo Dosimeter
1979 to 1986
Areas where potential for neutron exposure existed
Hankins type albedo dosimeter. Consists of four pairs of TLD 600 and TLD 700 (6LiF and 7LiF) in cadmium pillbox for thermal neutron suppression. High sensitivity to low-energy neutrons, with decreasing response as energy increases.
Monthly Issued only to individuals with potential for exposure to neutrons Dose equivalenti 2.c,j 1.23d 20 mremj,k 120 mrem
Panasonic Track Edge Detector (TED)
1987 to 2001
Areas where potential for neutron exposure existed
Three pieces of CR-39 plastic used to detect neutrons with energies above 100 keV.
Quarterly, except for limited number of workers (radiographers, well loggers, and personnel routinely entering HRAs). Issued only to individuals with potential for exposure to neutrons
Dose equivalenti 2.5 c,j 1.23d 80 mremj,k 150 mrem
Panasonic 809
2001 to present
Areas where potential for neutron exposure existed
Multi-element TLD containing four elements. E1 - gamma sensitive 7Li211B4O7(Cu), enriched to 99.99% in 7Li. E2, E3 and E4 – neutron-sensitive 6Li210B4O7(Cu) chips. Li-6 enriched to 95.33% and B-10 enriched to 94.64%. Elements are shielded with tin and cadmium on front and back, in various combinations.
Quarterly, except for limited number of workers (radiographers, well loggers, and personnel routinely entering HRAs). Issued only to individuals with potential for exposure to neutrons
Dose equivalenti 2. c,j 1.23d 40 mremj,k 80 mrem
a. Numerically equivalent to dose equivalent (Q = 1). b. Based on uncertainty values provided by NRC (1989) and ORAU (2004a, Equation 4-1) for the 95th-percentile estimate. c. Claimant-favorable assumption based on professional judgment. d. Based on a claimant-favorable assumption of a sigma (standard deviation) equal to ±20% and 95th-percentile values enveloped by 2 sigma. e. Assumed to be the same as for DuPont Type 502 and 508 films (NRC 1989). f. Deep dose equivalent = Hp(10). g. From NTS Fact Sheets (by M. DeMarre). h. Assumed to be the same as Panasonic 802 dosimeter. i. Source: NCRP (1971). j. See discussion in Section 6.3.4.3. k. Based on reported values, corrected for potential energy dependent underresponse (NTA film and Panasonic TED) and ratio of the conversion coefficients for personal dose equivalent,
Hp(10), to those for dose equivalent, H, (NCRP 1971) in the 100-2,000 keV energy range.
Effective Date: 09/21/2004 Revision No. 00 Document No. ORAUT-TKBS-0008-6 Page 12 of 55
• Calibration of monitoring systems and similarity of the methods of calibration to sources of exposure in the workplace
• Workplace radiation fields that could include mixed types of radiation, variations in exposure geometries, and environmental conditions
An evaluation of the original recorded doses based on these parameters is likely to provide the best estimate of the actual doses received, including Hp(10) and Hp(0.07) as necessary, for individual workers with the least relative overall uncertainty.
6.3.1
When the testing program at NTS began in January 1951, the Los Alamos Scientific Laboratory [now named Los Alamos National Laboratory (LANL)] was responsible for administering the external dosimetry program. While contractor organizations and the military were involved in issuing and collecting badges for some of the early operations at NTS, LANL performed calibration, processing, and interpretation work. In July 1955, REECo assumed responsibility for most onsite radiological safety functions.
Administrative Practices
During the 7-yr period (1951 to 1958) of these testing operations, the allowable external exposure limits for occupational workers at NTS were generally consistent with National Council on Radiation Protection and Measurements (NCRP) recommendations. During the 1951 to 1952 test series, participants could receive up to 3 R of gamma exposure for a 13-wk period. Pilots and crew could receive up to 3.9 R of exposure. For the 1953 and 1955 series, workers could receive up to 3.9 R. Beginning in 1957 and through the 1958 series, the maximum permissible exposure for test participants was limited to 3 rem per 13-wk period and 5 rem per calendar year.
After the Soviet Union ended the testing moratorium in the summer of 1961, the United States resumed the nuclear testing program at NTS on September 15, 1961. Most tests occurred underground. After the signing of the Limited Test Ban Treaty on August 5, 1963, all tests were underground.
The film badge dosimeter used from 1961 through 1965 at NTS was a modification of the premoratorium version. The film packet, a DuPont type 301-4, consisted of a type 508 low-range component (30 mR to 10 R) and a type 834 high-range component (10 to 1,000 R) wrapped with a 28-mil (0.028-in.)-thick lead strip covering an area 0.5 in. by 1 in. on each side. The packet was in a 4-mil (0.04-in.)-thick plastic bag sealed with colored tape to indicate the month of validity. The bag was clipped to the security badge, and all personnel entering NTS wore this dosimeter.
The film badges were exchanged monthly for all individuals and on exit from radiation areas if an exposure of 100 mR or more was measured (or suspected). In addition to film badges, self-reading pocket dosimeters were issued to persons entering controlled radiation exclusion (radex) areas, which were controlled locations at which an exposure was usually expected. The purpose of issuing pocket ionization (PIC) chambers to persons entering a radex area was to provide an action alert. A high reading of a PIC triggered the action of collecting and processing the personnel dosimeter being used at the time. PIC results were not used unless the personnel dosimeter had somehow been compromised. The PIC result would have been included in a special investigation of the incident. Although PIC results were only used as dose-of-record when film badge results were not available, because of their typical overresponse characteristic, the dose reconstructor should use the claimant-favorable assumption that the PIC results are treated in the same manner as the film badge results.
Effective Date: 09/21/2004 Revision No. 00 Document No. ORAUT-TKBS-0008-6 Page 13 of 55
The U.S. Atomic Energy Commission (AEC) Standard Operating Procedure, Nevada Test Site Organization (NTSO), Chapter 0524, Radiological Safety (AEC 1961), stated that the radiation exposure criteria for NTS personnel were 3 rem per quarter and 5 rem/yr. However, with the approval of the Test Manager, an NTS worker could receive as much as 12 rem/yr.
In 1966, NTS began using a combination personnel dosimeter and security credential holder (Brady and Iverson 1968) to provide the increased personnel dosimetry capability necessary to meet radiation exposure problems associated with nuclear rocket testing and underground nuclear detonations. The holder was designed to accommodate a DuPont type 556 film packet, a fast neutron packet [containing Kodak nuclear track emulsion, type A (NTA) film], an identification plate, criticality accident components, the security credential, and a snap-type clip. The complete package could measure beta, gamma, X-ray, thermal neutron, fast neutron, high-range gamma, and high-range neutron exposures.
In March 1971, when the use of DuPont film ended, NTS dosimetry operations converted to Kodak Type Ill film packets. This two-component packet contained low-range (30 mR to 10 R) and high-range (10 to 800 R) films. The other components of the badge remained essentially the same. Between 1971 and 1979, NTA film was only issued to personnel who were identified as working in areas were neutron exposure was a possibility. This assessment was based on evaluation of the individual’s work assignment.
In 1979, NTS adopted use of the albedo neutron dosimeter, a TLD component system. This dosimeter was superior to NTA film because it was more sensitive and responded to a much wider neutron energy range. The albedo dosimeter was not part of the film dosimeter packet but, as with NTA film, was issued only to personnel who had a potential for exposure to a neutron source. It had its own holder, which had to be worn flush with the body at all times. This system was used from 1979 through 1986.
Until 1966, there was no determination of shallow or skin dose from the film badges. With the introduction of a new multielement film dosimeter in 1966 until the conversion to TLDs in January 1987, the open window (OW) was used to make a separate determination of shallow dose and deep dose. Shallow dose was determined by comparing the OW and closed-window readings and, therefore, did not include the penetrating photon component. This same type of determination was used for TLDs used by Pan Am at the NRDS from 1970 to 1972. Therefore, for these years and dosimeter types, the total skin dose should be determined by adding the reported deep (or whole-body) dose and the shallow (or beta) dose. On the NV-185 form used for dose records at NTS, the shallow dose was incorrectly called the "Skin of the Whole-Body" dose when it was, in fact, only the beta and low-energy photon components. Therefore, the total skin dose can be estimated based on the NV-185 form from 1966 to 1987 by adding the "Whole-Body Gamma" dose (column 5) to the "Skin of the Whole-Body" dose (column 7).
Until January 1987, film badges were exchanged routinely each month for all individuals and on exit from a radex area if there was suspicion that an individual had received 100 mR or more of exposure. In addition, personnel entering radex areas received self-reading PICs. Following the introduction of TLDs in January 1987, dosimeters were issued on a quarterly basis unless a particular job assignment indicated the need for more frequent issue and readout. Measured exposures were added to the yearly and quarterly accumulated exposures. DOE (1982), Radiological Safety, set 3 rem per quarter and 5 rem/yr as limits for exposure for occupational workers.

Effective Date: 09/21/2004 Revision No. 00 Document No. ORAUT-TKBS-0008-6 Page 14 of 55
Beginning in 1987, with the introduction of Panasonic TLDs, the deep (or whole-body) dose and the shallow (or skin) dose were reported but the shallow dose included the penetrating photon component and can therefore be considered the total skin dose.
Table 6-1 lists the chronology of NTS external dosimetry measures beginning in 1961. The parameters of significance are the bias, geometric standard deviation (GSD), minimum detectable level (MDL), and the potential maximum missed dose (MMD).
The bias factors listed in Table 6-1, are the factors by which recorded values in the dosimetry records should be multiplied to provide the best estimate of the measurement quantity. The value of measurement quantity multiplied by the dose conversion factors in Appendix B of NIOSH (2002) yields the organ dose. The bias values for neutrons include an estimate of potential underresponse due to the inherent energy response of the detector and spectral differences between the calibration sources and operational spectra (Section 6.3.4). Potential detector overresponse (e.g., for TLD albedos) maintains claimant-favorability.
The uncertainty in the best estimate of the measurement quantity is accounted for in the GSD. The GSD is discussed in more detail in ORAU (2004a), and defined in Equation 4-1 of that document presented as follows:
)(
)( .6558511
percentile 50thpercentile 95thGSD =
The MDL is typically established at the point where the laboratory uncertainty of the readings at the 95% confidence level is ±100% in normal distribution terms. The MMD is equal to one-half the MDL multiplied by the number of exchange or monitoring periods.
6.3.2
The dosimetry methods employed initially at NTS were adopted from techniques implemented at LANL from the beginning of the atmospheric weapons testing program (NRC 1989; Boone, Bennett, and Adams 1970). As the various atmospheric test series progressed, dosimeter configurations improved in relation to the radiation fields encountered, and the responsibility for dosimetry programs was delegated among the participating agencies and military organizations. In 1955, the site contractor, REECo, assumed responsibility for most onsite radiological safety functions; this included a site-wide service based on the use of film dosimetry for photons, betas, and neutrons. These methods evolved and eventually gave way to other methods including TLD and nuclear track detection or track etch detectors (TEDs). From the beginning, PICs were used if necessary to augment the passive dosimeters issued to NTS workers and visitors.
Dosimetry Technology
6.3.2.1 Beta/Gamma Dosimeters
During atmospheric test operations, beta/gamma dosimetry was accomplished with photographic film and subsequent densitometry measurements to quantify exposure. Individual dosimeters included multiple film types appropriate for the ranges of exposure considered and metallic filters to adjust film response to the associated photon spectra. Attempts to assess beta dose from comparisons of filtered and open areas of exposed film were abandoned due to unknown relative contributions attributable to the photon and beta fields present.

Effective Date: 09/21/2004 Revision No. 00 Document No. ORAUT-TKBS-0008-6 Page 15 of 55
In the late 1960s, trials were conducted with TLDs that led to implementation of a TLD-based personnel monitoring program at NRDS in 1970. Large-scale use of TLD dosimetry at NTS began in 1987 with introduction of a Panasonic dosimetry system.
6.3.2.1.1 Photographic Film Dosimeters
Photographic emulsions of various types and in various holders (i.e., film badges) were used at NTS for personnel monitoring from the start of operations in January 1951 until 1987. The basic principles, theory, and practice of photographic film dosimetry for beta and photon radiation are well known and have been described in a number of standard texts and references (Becker 1966; Dudley 1966; Ehrlich 1954, 1962; Kathren 1987; NRC 1989). The following paragraphs discuss factors related to film dosimetry that provide a general background to the interpretation and reconstruction of dosimetry results at NTS.
The term film badge, or film badge dosimeter, as used in this document, refers to the entire dosimeter issued to personnel, which typically consisted of a dental-size film packet housed in a holder of varying sophistication designed to improve the response characteristics and measurement capabilities. The film consisted of a plastic base covered on one or both sides with a layer of a suitable photographic emulsion. One or two pieces of film were wrapped in a light-tight paper package to comprise the packet, which in turn was placed in a holder containing metallic filter(s) to compensate for the photon energy dependence of the film. The sensitivity of the film to ionizing radiation was largely a function of the size of the AgBr grains in the emulsion. Because the typical photographic emulsion for dosimetry has an effective range of about 3 orders of magnitude, the packet typically contained two pieces of film with different sensitivities. The effective ranges of these films overlapped, which permitted an effective response range of about 5 orders of magnitude for penetrating photon radiations.
In principle, film dosimetry is simple; it consists of the determination of optical density or degree of blackening produced by exposure to radiation. The degree of blackening produced by the radiation incident on the film is determined in terms of the net optical density, the logarithm of which is typically plotted against the logarithm of exposure or dose to produce a calibration or response curve, or an algorithm with which the exposure registered by the film can be determined. The response of a film emulsion to photon radiation is not linear with dose or exposure. Near the lower (less than 50 mR) and upper (about 1.5 to 5 R) limits of the range of the film, small increments of density represent relatively large changes in dose. Therefore, the uncertainty at the low and high ends of the dose response curve (i.e., net optical density vs. exposure), where the slope is quite shallow, is relatively large. However, the total uncertainty for high-energy exposures (more than about 150 keV to 3 MeV) for these dose ranges (1.5 to 5 R) should not exceed a factor of 2. For high-energy photon exposures in the region of 50 to 1,500 mR (the steep portion of the dose response curve), the uncertainty is much less and should be within 20% to 30%. Dose reconstructors should consider these uncertainty values to be broad estimates, not exact values.
Although a number of different film types were used for dosimetry at NTS, they generally had similar characteristics and responses to beta and photon radiations. Uncertainties in dosimetry with these films are largely, if not exclusively, the result of external factors rather than differences in the films.
The response of film to photon radiation is affected by a number of interrelated variables. From the standpoint of dose reconstruction at NTS, the most important of these are energy dependence, angular dependence, and effects of temperature and humidity. Because of the high relative atomic number (Z) of the AgBr in the film emulsion in relation to soft tissue, the response or energy absorbed per unit exposure of the film is a strong function of the energy of the exposing photons, rising steeply
Effective Date: 09/21/2004 Revision No. 00 Document No. ORAUT-TKBS-0008-6 Page 16 of 55
at energies below about 200 keV to a peak at about 30 keV, and then falling off steeply. At about 30 keV, the energy of maximum response, the degree of blackening per unit exposure is about 30-fold greater than that for photons with energies of few hundred thousand to a few million electron volts. Because the relationship between exposure and soft tissue dose is approximately constant over a wide energy range, it was essential to compensate or correct for the energy dependence of the photographic response. This was accomplished by placing metallic filters over portions of the film to alter or flatten the energy dependence characteristics such that the film responded more like soft tissue over a wide energy range.
Although energy dependence can be a large source of error in film badge dosimetry, reasonably good results can be obtained by a four-element badge: one with an OW or no filter over a portion of the film packet, and high-Z, medium-Z, and low-Z filters over other portions of the packet. By observing the relationships of the degree of darkening under each filter area, and comparing these with exposures to known energies and doses of photon radiations, a reasonably accurate assessment of photon dose can be made over a wide range of energies. This is particularly true at NTS, where exposures were largely to photons with energies greater than a few hundred thousand electron volts at angles close to normal to the plane of the film. In general, errors in dose interpretation that result from energy dependence will result in overestimates of dose and are, therefore, conservative and claimant-favorable. However, given the single-element badges in use until 1966, some dose from lower energy photons, specifically those with energies below about 80 keV, could have been missed because of attenuation in the filter; therefore, the dose interpretation could be low. Given the photon energy spectra at NTS, any such loss of dose is likely to have been relatively low.
Photon calibration of film dosimeters was typically performed in terms of exposure in free air, with the plane of the film oriented normally to the direction of the incident photon beam. Initial calibrations were made with a high-energy photon source (e.g., 60Co or 137Cs) with an energy response by film similar to the energy spectra to which personnel were exposed in the field. After introduction of the advanced multi-element film badge in January 1966, calibration was conducted with X-ray sources as well as high-energy photons. This enabled interpretation of exposure to the film with a higher degree of accuracy over a broader spectrum of photon energies.
The response of film, whether in a bare film packet or in a holder, is a function of the angle of incidence of the exposing radiation on the plane of the film. Because the film is in a small flat sheet, an edge-on exposure (i.e., an exposure with the incident radiation parallel to the plane of the film) produces a different effect or optical density pattern than an exposure normal (at right angles) to the plane of the film. The effect is strongly dependent on both the energy of the exposing photons and the type of film holder or film badge, but is generally minimal at photon energies above a few hundred thousand electron volts and for angles of incidence ranging from about 30 to 150 degrees in relation to the plane of the film. However, for angles of incidence approaching parallelism (i.e., 0 degrees) with the plane of the film, the effect can be pronounced, and can lead to significant underestimates in dose. The problem, however, should be more or less minimal for exposures at NTS because these were (1) typically to high-energy photons and at angles close to normal with the plane of the film and (2) probably largely accounted for in the interpretation of the badge.
Environmental conditions can significantly affect film badge results, and can result in large uncertainties and errors in dose estimation. Temperatures greater than 130oF (50oC) can induce fogging, but several days at this temperature are necessary before fogging or increased density occurs. At higher temperatures, which could have occurred in closed vehicles or buildings at NTS, fogging can result after shorter exposure times (Kathren, Zurakowski, and Covell 1966). If not corrected, high-temperature fogging always produces an overestimate and, therefore, a claimant-favorable dose interpretation.

Effective Date: 09/21/2004 Revision No. 00 Document No. ORAUT-TKBS-0008-6 Page 17 of 55
High relative humidity results in a fading of the latent image before development and in a decrease in the measured density of the film for a given dose. Latent image fading results in a low estimate of dose. However, studies have shown that latent image fading is not a problem until films have been worn for intervals exceeding 4 to 6 wk, and can be largely overcome by encasing the film packet in a polyethylene pouch, as was done for hot and humid conditions encountered during nuclear tests in the Pacific (Kathren, Zurakowski, and Covell 1966). Given the low-humidity conditions at NTS, latent image fading is unlikely to be of significance to film dosimetry.
Films were exchanged at varying intervals and, once collected, were developed under controlled conditions. Optical densities were determined with a densitometer, and doses were determined from calibration curves, which were log-log plots of net optical density versus dose obtained from a series of films exposed to known levels of photons. The use of control films at sites such as the badge house, where there was no expectation of a radiation field other than from background, permitted the inherent density of the film and any density attributable to background radiation (the so-called background fog) to be subtracted from the reading, thereby providing the net optical density attributable to occupational exposure. In practice, background films were used to zero the densitometer, which then gave a net optical density reading.
6.3.2.1.2 Beta Dosimetry with Film Badges
Film response to beta radiation is accomplished with an unshielded portion of a film packet. Multielement film badges have an OW or unshielded portion that allows beta and photon radiation to reach the film. The beta dose is interpreted by removing the density attributable to a concomitant photon exposure as determined by the densities on those portions of the film under the various filters. The process is subject to large uncertainties, perhaps as much as a factor of 2.
Before 1966 film dosimetry was accomplished with a bare film packet partially covered by a lead strip. The exposed film was interpreted by attributing the density under the lead filter to photons. The density in the unshielded portion of the film was assumed to be due to both photons and betas, and was typically not measured. In those instances in which the unshielded portion was read, the beta dose was determined by simply subtracting the density under the lead strip from that in the unshielded portion of the film to obtain a net density. This procedure did not accurately determine beta dose because it attributed the entire net density of the unshielded portion to beta dose, ignoring the low-energy photon dose contribution (e.g., energies less than about 80 keV, of concern primarily to post-test drillback crews before 1965, and tunnel reentry crews in those situations when the tunnel was not vented before reentry), which did not penetrate the lead strip. It is estimated that as much as 25% of the total photon dose could have been missed as a result of this attenuation (Kathren 2004; Coryell, and Sugarman 1951; Nelms and Cooper 1959). Therefore, the beta dose could have been overestimated. Given the spectra and mix of radionuclides encountered at the NTS, dose estimates made in this fashion are likely to be within a factor of 2 of actual beta dose and could slightly underestimate the overall photon dose. However, such dose estimates are likely to be unreliable and should be confirmed by other factors such as the beta:photon dose rate ratio obtained with monitoring instruments in the field, if such data are available. The value of a factor of 2 is an estimate of the range of uncertainty based on knowledge of the reported response characteristics of the dosimeters, and is presented for general information only.
Multielement badges were introduced at NTS in 1966. A single high-Z metallic filter provided a more or less flat energy response for photons with energies above the uncertainty edge of the filter (about 50 keV). The density under the filter was used to assess the dose to photons above this cutoff energy and to evaluate the doses to photons with energies below the cut off using densities under the other filters. Two filters – an OW and a low Z – were used to determine the beta dose. The response of the

Effective Date: 09/21/2004 Revision No. 00 Document No. ORAUT-TKBS-0008-6 Page 18 of 55
film under these filters was approximately the same for photons, but the low-Z plastic filter essentially removed all the betas. The reading from the low-Z filter, which was considered to be attributable to photons only, was subtracted from the density under the unshielded portion, which had a comparable response to photons and also was responsive to beta radiation. If necessary to make a beta dose estimate using the film badge results from shallow dose estimates from 1966 through 1986, dose reconstructors should double the reported value to ensure claimant-favorability and to account for uncertainties.
For external dose reconstruction, a positive indication of beta exposure in a dose record is considered to be due to betas with energies above 15 keV.
6.3.2.1.3 Evaluating Photon Doses with Film Badge Dosimetry
Different film badge dosimeters were used at NTS from its start in 1951 until 1987, when personnel film dosimeters were replaced with TLDs. In 1989, the National Research Council (NRC) published an exhaustive evaluation of film badge dosimetry in atmospheric weapons testing, effectively covering the period through the cessation of atmospheric testing in July 1962 (NRC 1989). The NRC considered only photon doses and evaluated the dose from each test series individually in terms of bias and uncertainty. This evaluation considered a number of specific factors, including laboratory factors, which was an inclusive term covering calibration, film development and processing; sensitometry; radiological uncertainties, including the source term photon energy spectrum; environmental effects; and conversion from exposure to deep dose.
On the basis of its evaluation, the NRC published tables for each test series listing bias and uncertainty values as well as a table listing individual film badge exposure values for approximately a dozen intervals less than or equal to 200 mR, the corresponding best estimate of Hp(10) in millirem, and the 95% confidence limits for Hp(10). For exposures above 200 mR, a simple equation was provided to permit easy conversion from exposure to Hp(10). The conversion from exposure to Hp(10) can be calculated by
Hp(10) = 0.77E
where Hp(10) is the personal dose equivalent, penetrating, in millirem (or rem, as appropriate), and E refers to film badge exposure in milliroentgen (or roentgen, as appropriate).
In 1966, a multielement film badge of advanced design was introduced at NTS (Brady and Iverson 1968). This badge was a considerable improvement over earlier badges and had a reported accuracy of ±20%. Certainly, this level of uncertainty at the 95% or even 99% confidence level was achievable under laboratory conditions. However, under field conditions, factors such as backscatter, wearing location, and angular dependence could result in additional uncertainty, as reflected by the GSDs listed in Table 6-1.
Although the basis for determination of personal dose equivalent from exposure values reported in individual monitoring records has been clearly documented as indicated above, it is also important that one-to-one correlation is maintained with the film badge record so that the claimant can see evidence that original records were used in dose reconstruction and to avoid the perception that the recorded doses were lowered as part of the reconstruction. Therefore, the dose reconstructors should use the original reported exposure values for the reconstruction, unless there is evidence that these values are somehow in error.

Effective Date: 09/21/2004 Revision No. 00 Document No. ORAUT-TKBS-0008-6 Page 19 of 55
6.3.2.1.4 Estimation of Beta Doses from Film Badge Results
Early dosimeters worn at NTS could not discriminate reliably between beta and photon radiation, or between photons in various energy ranges. In fact, given the types of film dosimeters, reliable beta dosimetry was not possible until the introduction of the NTS film badge in 1966 (Brady and Iverson 1968). Beginning in 1966, the multielement film badge permitted stripping out the density produced in the unshielded or OW portion of the badge by photons and interpreting the remaining density, if any, as beta dose. This process can be performed manually with a set of calibration curves made at different photon energies and a beta calibration curve or with an algorithm developed from such a set of calibration curves. Regardless of the technique used, the resultant beta dose estimate had a considerable degree of uncertainty, although it was reasonably reliable with a total uncertainty typically not exceeding a factor of 2 (Becker 1966, p. 102; Kathren and Larson 1969). Therefore, in the absence of data suggesting otherwise, a reasonable and claimant-favorable estimate of beta dose can be made from film badge results (i.e., from shallow dose estimates from 1966 through 1986) by doubling the reported value.
6.3.2.1.5 Thermoluminescent Dosimeters
6.3.2.1.5.1 NRDS Thermoluminescent Dosimeters
The first routine use of TLDs at NTS began in 1970. Starting in February 1966, Pan Am used TLDs at the NRDS as part of the site effluent monitoring program. These dosimeters contained a calcium-fluoride phosphor bound to a helically wound wire in an evacuated glass tube and were ideal for the intended purpose but unsuitable for personnel dosimetry.
Other installations had successfully demonstrated the applicability of LiF TLDs for personnel dosimetry. A brief investigation was performed and proposals submitted for institution of a LiF TLD program at NRDS in 1967 to complement the REECo-supplied personnel film dosimetry service.
On July 1, 1968, Pan Am initiated a TLD program at the NRDS with the cooperation of the Health Services Laboratory of the AEC Idaho Operations Office (IDO). This laboratory supplied LiF TLD chips and provided readout services and considerable consultation based on its extensive LiF TLD experience at the National Reactor Testing Station (NRTS). From July 1, 1968, until July 1970 NRDS personnel who were not likely to receive a significant exposure received TLDs. All reported exposures were in the background range (0 to 30 mrem). Routine use of TLDs began in July 1970 and continued until the NRDS ceased operation at the end of 1972.
Beginning in July 1970 (and repeated every quarter thereafter), a minimum of one set of dosimeters was exposed on the Pan Am Calibration Range to a total dose(s) of from 100 mR to 5 R. Each set of dosimeters consisted of 1 Pan Am R-chamber, 6 REECo film, and 12 IDO TLD chips (6 to be read out at Pan Am and 6 at IDO). The Pan Am Calibration Range was crosschecked against Pan Am R-chambers, which were calibrated by the National Bureau of Standards (NBS; one set was sent to NBS annually). If the difference between the range and the R-chamber exceeded ±6%, the data points were retaken.
A calibration factor was calculated for each type of dosimeter as follows:
R
DoDxCF −=

Effective Date: 09/21/2004 Revision No. 00 Document No. ORAUT-TKBS-0008-6 Page 20 of 55
where:
CF = calibration factor Dx = mean indicated dose from the set of six exposed dosimeters Do = mean indicated dose from the set of six unexposed dosimeters R = R-chamber indicated dose.
As long as the average calibration factor over the dose range of interest fell in the range of 0.9 to 1.1 (±10%), the results were documented but no further action was taken because this level of accuracy was considered adequate. If the average calibration factor fell outside this range, the parties concerned were notified and another set of data was taken. In general, the relative accuracy of both measurement systems, as indicated by the body of data considered, is adequate for personnel dosimetry purposes.
In the case of Pan Am-read TLDs, a calibration factor was always necessary due to the relative response of the reader. The appropriate calibration factor was employed as follows:
( )DoDiCFDc −×=
where:
Dc = calibration factor Do = actual dose Di = indicated dose
Boone, Bennett, and Adams (1970) contains additional information on calibrations and calibration comparisons between Pan Am, IDO, and REECo.
Figure 6-1 shows the security badge and enclosed TLD insert. It was a plastic holder in which two LiF dosimeters were placed. One dosimeter was shielded by the tantalum-cadmium filter area of the present badge. The other dosimeter was unshielded. The two dosimeters were held in place by retainers built into the insert (for pliable LiF-Teflon discs) or hinged retainers (for extruded LiF chips). The insert was punched with a binary code that identified security badges for issuance and collection. Finally, the bottom left-hand portion of the dosimeter insert was coded to enable security guards to determine if dosimeters were being worn for the proper period.
6.3.2.1.5.2 REECo Thermoluminescent Dosimeters
With the advent of DOE requirements to restrict personnel exposures to as low as reasonably achievable (ALARA) and with emphasis on accurate dosimetry at low doses, REECo Environmental Sciences Department personnel began evaluating TLD systems and neutron dosimeters in the early 1980s to replace the film badge and neutron TLD.
Figure 6-1. Security badge for NRDS TLD (Pan Am 1967).

Effective Date: 09/21/2004 Revision No. 00 Document No. ORAUT-TKBS-0008-6 Page 21 of 55
After evaluating several dosimetry systems, the Environmental Sciences Department determined that the Panasonic 802 TLD and the neutron TED were the best combination for NTS exposure conditions. These were put into use January 1, 1987. The security credential holder was redesigned to accommodate both dosimeters (Figures 6-2 and 6-3).
Figure 6-2. REECo badge holder (REECo 1990).
Figure 6-3. REECo security badge holder with Panasonic UD-802 dosimeter.
DOE Order 5480.11, "Radiation Protection for Occupational Workers” (DOE 1988), established the radiation protection standards and program for DOE, its contractor personnel, and other occupational personnel to protect workers from ionizing radiation. It defined policies and procedures required to operate DOE facilities and conduct activities to keep personnel exposures well below the limits set by Order 5480.11 to meet ALARA goals. The site-specific Nevada Operations Office/Yucca Mountain Project (YMP) Radiological Control Manual (known as the RadCon Manual; DOE 1994) describes radiation protection standards and program requirements as they relate to the NTS and YMP

Effective Date: 09/21/2004 Revision No. 00 Document No. ORAUT-TKBS-0008-6 Page 22 of 55
organizations. The Nevada Test Site Radiation Protection Program, published in May 1995 (REECo 1995a), demonstrated compliance with DOE rules for protecting individuals from ionizing radiation.
Specifically, the NTS external dosimetry program consists of the following:
• Site-wide RadCon Managers to coordinate exposure reduction with NTS organizations.
• Each RadCon Manager was responsible for ALARA within their own organization.
• A Radiological Work Permit system to establish exposure controls and personnel monitoring requirements for work areas on NTS.
• Procedures that identify, monitor, and control locations where personnel can encounter ionizing radiation from contaminated work areas.
• A requirement that all personnel entering an area where there is a potential for exposure wear TLDs. Additional monitoring devices are worn where there is a potential for exposure to the skin, the lens of the eye, or extremities, or exposure to nonuniform and neutron radiation fields.
• A requirement that supplemental dosimeters, such as direct-reading and electronic-alarm dosimeters, be worn for entries into High Radiation Areas (HRAs) and Very High Radiation Areas (VHRAs).
• A requirement that a dose assessment be conducted for each instance of a lost, damaged, or contaminated personnel dosimeter.
• A DOELAP-accredited external personnel dosimetry system.
The four-element Panasonic UD-802 TLD was the primary dosimeter for routine use issued to all monitored personnel until 2001, when it was replaced by the Panasonic 809 dosimeter, which also contained four elements (Table 6-1). The Panasonic UD-807 TLD is used to monitor personnel working in situations where the likelihood of exposure to an extremity is significantly greater than exposure to the whole body.
In most instances, dosimeters (i.e., TLDs) were processed quarterly. Some personnel working in locations where high exposures were more likely to occur exchanged their dosimeters monthly. The NTS monitoring program was designed to ensure that personnel exposures were kept below the annual limit of a total effective dose equivalent (TEDE) of 5 rem.
The Panasonic UD-802 TLD was designed to identify the type and energy of detected radiation, so the prescribed tissue depth dose equivalents could be determined accurately. In specific, the four-element Panasonic 802 was intended to measure the following:
• External photon radiation from 0.010 to 1,000 rem • Gamma energy range of 0.010 to 10 MeV • Beta radiation from 0.030 to 1,000 rad • Beta energy range from approximately 0.30 to 10 MeV
Table 6-2 lists TLD element composition, filtration, and radiation type.

Effective Date: 09/21/2004 Revision No. 00 Document No. ORAUT-TKBS-0008-6 Page 23 of 55
Table 6-2. Panasonic UD-802 dosimeter configuration.
Element Phosphor Filtration Rad. type & dose
equivalent E1 Li2B4O7:Cu Teflon/polyester, 18 mg/cm2 Gamma, beta, shallow dose E2 Li2B4O7:Cu Teflon/polyester & Plastics, 70 mg/cm2 Gamma, beta, eye dose E3 CaSO4:Tm Teflon/polyester, ABS Plastics, and Blak Ceramic,
645 mg/cm2 Gamma
E4 CaSO4:Tm Teflon/polyester, ABS and Lead, 1042 mg/cm2 Gamma, deep dose
The dosimeters were calibrated against known exposures to provide an accurate transition from measured exposure to dose equivalent. Dosimeter calibration factors were normalized to the corrected readings from run calibration factor (RCF) dosimeters processed with the field dosimeters. The computer program separated the calibration dosimeters, used the known RCF exposure value, and calculated RCFs that were applied to the remainder of the dosimeters in the run. The RCFs kept a reader in calibration over long periods and maintained consistency among different readers.
6.3.2.1.5.3 Energy Response
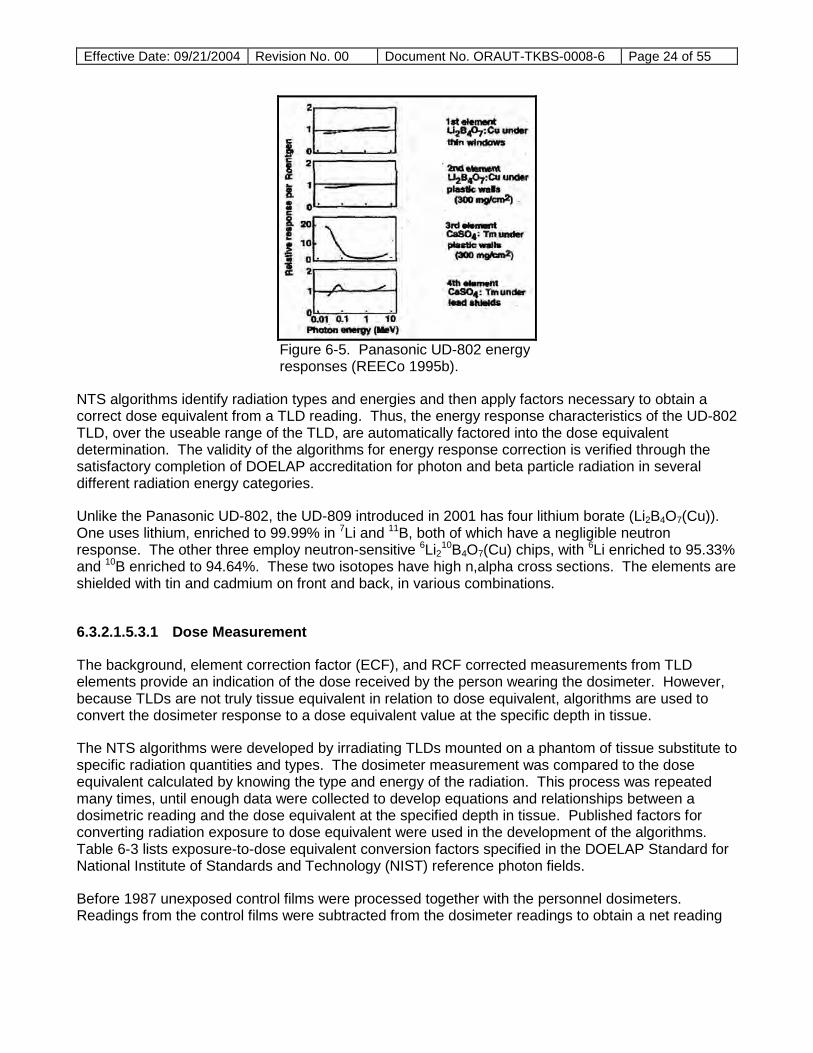
Panasonic UD-802 and UD-809 TLD elements have well-known energy responses. Like many radiation detection devices, there is an energy (about 20 keV) below which radiation does not deliver sufficient energy to the TLD element for detection. As photon radiation energy increases, the Li2B4O7:Cu elements have a relatively flat response, while the CaSO4:Tm elements overrespond between about 50 and 200 keV. The higher CaSO4:Tm response is due primarily to the effective Z of 14.4 for CaSO4, compared to 7.3 for Li2B407:Cu. The lithium borate effective Z is much closer to the effective Z for tissue (7.4), which relationship is important to photoelectric effect interactions. The response of both types of elements is relatively flat to about 5 MeV, where the CaSO4 response increases slightly due to its higher effective Z and, in this case, pair production interactions. Figure 6-4 shows typical photon energy response curves for Li2B4O7 and CaSO4 TLD elements. Figure 6-5 shows the response for the UD-802 TLD, including filters. The first element in the UD-802 TLD has a total filtration density depth of about 18 mg/cm2, making it sensitive to beta particle radiation with energies of 100 keV or more. The second element responds to beta radiation with energies above about 300 keV. Because beta particles have a low linear energy transfer (LET) and the Li2B4O7 is nearly equivalent to tissue, the beta energy response is relatively flat and similar to the photon response shown in Figure 6-5 for photon radiation (starting at 0.1 MeV for element E1 and 0.3 MeV for element E2).
Figure 6-4. Typical photon energy response curves for Li2B4O7 and CaSO4 TLD elements (REECo 1995b).
Effective Date: 09/21/2004 Revision No. 00 Document No. ORAUT-TKBS-0008-6 Page 24 of 55
Figure 6-5. Panasonic UD-802 energy responses (REECo 1995b).
NTS algorithms identify radiation types and energies and then apply factors necessary to obtain a correct dose equivalent from a TLD reading. Thus, the energy response characteristics of the UD-802 TLD, over the useable range of the TLD, are automatically factored into the dose equivalent determination. The validity of the algorithms for energy response correction is verified through the satisfactory completion of DOELAP accreditation for photon and beta particle radiation in several different radiation energy categories.
Unlike the Panasonic UD-802, the UD-809 introduced in 2001 has four lithium borate (Li2B4O7(Cu)). One uses lithium, enriched to 99.99% in 7Li and 11B, both of which have a negligible neutron response. The other three employ neutron-sensitive 6Li210B4O7(Cu) chips, with 6Li enriched to 95.33% and 10B enriched to 94.64%. These two isotopes have high n,alpha cross sections. The elements are shielded with tin and cadmium on front and back, in various combinations.
6.3.2.1.5.3.1 Dose Measurement
The background, element correction factor (ECF), and RCF corrected measurements from TLD elements provide an indication of the dose received by the person wearing the dosimeter. However, because TLDs are not truly tissue equivalent in relation to dose equivalent, algorithms are used to convert the dosimeter response to a dose equivalent value at the specific depth in tissue.
The NTS algorithms were developed by irradiating TLDs mounted on a phantom of tissue substitute to specific radiation quantities and types. The dosimeter measurement was compared to the dose equivalent calculated by knowing the type and energy of the radiation. This process was repeated many times, until enough data were collected to develop equations and relationships between a dosimetric reading and the dose equivalent at the specified depth in tissue. Published factors for converting radiation exposure to dose equivalent were used in the development of the algorithms. Table 6-3 lists exposure-to-dose equivalent conversion factors specified in the DOELAP Standard for National Institute of Standards and Technology (NIST) reference photon fields.
Before 1987 unexposed control films were processed together with the personnel dosimeters. Readings from the control films were subtracted from the dosimeter readings to obtain a net reading

Effective Date: 09/21/2004 Revision No. 00 Document No. ORAUT-TKBS-0008-6 Page 25 of 55
for determining exposure (REECo 1961, 1962). Beginning in 1987, with the introduction of TLDs, the procedure was continued with TLD background dosimeters.
Table 6-3. Photon exposure to dose correction factors for NIST reference radiations.
NIST reference radiation
Conversion factor (mrem/R) Shallow (0.07 mm) Deep (10 mm)
Filtered X-rays M30 1.08 0.45 S60 1.15 1.07 M150 1.41 1.47 H150 1.41 1.41
K-fluorescence X-ray (keV) 16 1.08 0.38 24 1.07 0.47 34 1.07 0.99 43 1.28 1.30 58 1.47 1.54 78 1.61 1.72 100 1.59 1.74
Cesium-137 photon (keV) 662 1.03 1.03
6.3.2.1.5.3.2 Detection Limits
Panasonic UD-802 TLDs have been tested to determine their lower limit of detection (LLD). The LLD is the minimum evaluated dose equivalent for which the readout value of a dosimeter is significantly different (at the 90% confidence level) from the mean readout of unirradiated dosimeters. LLD is a detection limit based on the standard deviation of background measurements and a 5% chance of reporting a false positive value.
DOE (1986, Chapter 3) summarizes the procedure for determining the LLD for the DOELAP personnel dosimetry systems. It provides two alternative equations to calculate LLD. Although DOE (1986) requires determination of the LLD for accredited dosimetry systems, no performance criteria are applied to these results.
The method used to determine the LLD for the NTS personnel TLD system is consistent with the method described in DOE (1986). Use the following equations for determining the LLD:
( )[ ] ( )[ ]22'01 1/1/1/75.12 BSBHStL opD +−++=
and
02 StL pD =
where:
LD1 = LD where the probability of reporting a false positive or false negative result is 5%. LD2 = LD corresponding to a 5% chance of reporting a false positive. Tp = distribution factor for n-1 degrees of freedom and a probability value of 0.95 = 1.68488. So = [{∑(Xio – Ho)2}/(n-1)]½ = standard deviation of measurement

Effective Date: 09/21/2004 Revision No. 00 Document No. ORAUT-TKBS-0008-6 Page 26 of 55
Ho = Ho’ = (Xio)/n = mean dose value Xio = unirradiated dosimeter value background dose n = number of dosimeters number of measurements B = bias for DOELAP categories S = standard deviation for DOELAP categories
The LLD is primarily a function of the standard deviation in background dose rates. Table 6-4 lists selected NTS background dose equivalent rates. The values can vary over time. However, the temporal variation has been small since the end of atmospheric testing.
Table 6-4. Background dose equivalent rates.
Location Dose equivalent rate (mrem/day)
Shallow Eye Deep NTS Area 12, Camp 0.375 0.311 0.283 NTS Area 6, Building 2 0.327 0.246. 0.211 NTS Area 6, Building 50 0.255 0.182 0-150 NTS Area 23, Building 650 0.271 0.199 0.168 Test Range Complex, DODa Facility 0.249 0.193 0.169 Las Vegas, REECo Highland Building 0.181 0.139 0.121 Mean dose rate 0.276 0.212 0.184 Standard deviation 0.067 0.059 0.057
a. DOD = U.S. Department of Defense.
Table 6-5 lists bias and standard deviation values for DOELAP categories determined during the 1990 accreditation process. The LLD selected as most appropriate for NTS operations is LD2, which is the most applicable value for determination of a dose likely to be higher than background levels and which increases the probability that a dose will be evaluated as positive. Therefore, the LLD values of 0.1 mrem/day for deep and eye dose equivalents and 0.13 mrem/day for shallow dose are used for NTS personnel TLD measurements. The LLD for a specific TLD reading is determined by the TLD processing software and is the appropriate LLD value multiplied by the number of days between TLD annealing and reading. For the routine calendar quarter, the LLD is about 9 mrem for the eye and deep dose equivalent and about 12 mrem for shallow dose. A nominal value of 15 mrem is recommended for dose reconstruction (Table 6-1).
Table 6-5. NTS Panasonic UD-802 detection limits for DOELAP categories (mrem/day).
Category Shallow dose Eye dose Deep dose LD1 LD2 LD1 LD2 LD1 LD2
I. Low-energy photons – X-ray high dose N/Aa N/A N/A N/A 0.21 0.21 II. High-energy photons – high dose N/A N/A N/A N/A 0.21 0.21 IIIa. Low-energy photons – X-ray general 0.31 0.13 0.23 0.10 0.23 0.10 IIIb. Low-energy photons X-ray – plutonium environments 0.33 0.13 0.25 0.10 0.24 0.10 IV. High-energy photons 0.28 0.13 0.21 0.10 0.21 0.10 V. Beta particles – general 0.27 0.13 N/A N/A N/A N/A
a. N/A = not applicable.
6.3.2.1.5.3.3 Calibration
Several Quality Assurance (QA) operations are performed on new dosimeters before they are approved for field use. The numerical coding on each TLD label is verified to ensure accurate tracking. Before use, and annually thereafter, dosimeter phosphor elements are calibrated by determining an ECF for each element. In accordance with applicable procedures, a dosimeter with an ECF out of tolerance is removed from use.
Effective Date: 09/21/2004 Revision No. 00 Document No. ORAUT-TKBS-0008-6 Page 27 of 55
TLDs are calibrated with the NTS 137Cs gamma source calibration range. The 137Cs source is traceable to NIST through a secondary standard calibrated ion chamber. An integrating electrometer, calibrated annually for NIST traceability, is used to verify the accuracy of each TLD and TLD reader calibration exposure. All temperature and barometric pressure measuring instruments used for the calibration range are calibrated annually to NIST traceable standards.
Monthly Calibration of Gamma Radiation Fields at Inner and Outer Dosimeter Support Rings (REECo 1995c) outlines procedures for performing gamma source exposures. The results of the exposures are used to ensure proper performance of the gamma sources, provide required exposure rate information to upgrade source calibration, and document exposure trends for quality control (QC).
6.3.2.1.5.3.4 Quality Assurance
The QA program was established and has been maintained through adherence to QC procedures and practices. As required by DOE rules for protecting individuals from ionizing radiation, the program includes internal audits at intervals of 3 yr or less. The QC personnel for the external dosimetry program monitor and test program operations, data records, and performance. The effectiveness of the QA program is demonstrated through satisfactory completion and maintenance of DOELAP accreditation.
Dosimeters are carefully tested before being put into use, and their performance is routinely monitored. Acceptable processing and recording equipment calibration and operation is verified by internal QA reviews and by participation in external assessments. For example, REECo Health Protection Department procedure, Thermoluminescent Dosimeter Quality Assessment (REECo 1995d), outlines the methods for assessment of the performance and adequacy of TLD issuing, processing, and reporting techniques.
The NTS external dosimetry program was one of the early programs accredited by DOE. Accreditation was initially requested in 1989 and updated in 1990. The onsite assessment was conducted in 1991, and accreditation was granted in 1992. DOELAP accreditation requires that dosimetry operations satisfy specific standards for accuracy of measurements, records, reports, and QA activities.
The NTS external dosimetry program has maintained accreditation in the following DOELAP categories:
I. Low-energy photon (high dose) II. High-energy photon (high dose) IIIA. Low-energy photon IIIB. Low-energy photon (plutonium) IV. High-energy photon VA. Beta VI. Neutrons (unmoderated, 252Cf) VII. Mixtures
III + IV III + VA IV + VA III + VI IV + VI
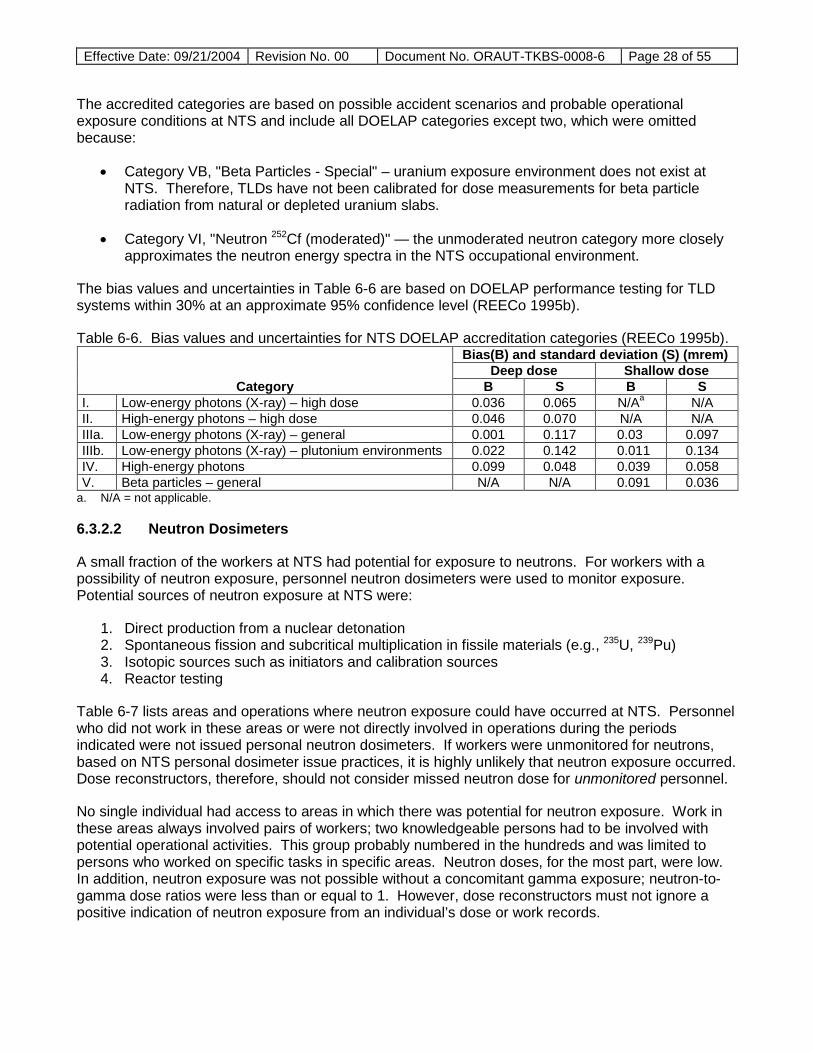
Effective Date: 09/21/2004 Revision No. 00 Document No. ORAUT-TKBS-0008-6 Page 28 of 55
The accredited categories are based on possible accident scenarios and probable operational exposure conditions at NTS and include all DOELAP categories except two, which were omitted because:
• Category VB, "Beta Particles - Special" – uranium exposure environment does not exist at NTS. Therefore, TLDs have not been calibrated for dose measurements for beta particle radiation from natural or depleted uranium slabs.
• Category VI, "Neutron 252Cf (moderated)" — the unmoderated neutron category more closely approximates the neutron energy spectra in the NTS occupational environment.
The bias values and uncertainties in Table 6-6 are based on DOELAP performance testing for TLD systems within 30% at an approximate 95% confidence level (REECo 1995b).
Table 6-6. Bias values and uncertainties for NTS DOELAP accreditation categories (REECo 1995b).
Category
Bias(B) and standard deviation (S) (mrem) Deep dose Shallow dose
B S B S I. Low-energy photons (X-ray) – high dose 0.036 0.065 N/Aa N/A II. High-energy photons – high dose 0.046 0.070 N/A N/A IIIa. Low-energy photons (X-ray) – general 0.001 0.117 0.03 0.097 IIIb. Low-energy photons (X-ray) – plutonium environments 0.022 0.142 0.011 0.134 IV. High-energy photons 0.099 0.048 0.039 0.058 V. Beta particles – general N/A N/A 0.091 0.036
a. N/A = not applicable.
6.3.2.2 Neutron Dosimeters
A small fraction of the workers at NTS had potential for exposure to neutrons. For workers with a possibility of neutron exposure, personnel neutron dosimeters were used to monitor exposure. Potential sources of neutron exposure at NTS were:
1. Direct production from a nuclear detonation 2. Spontaneous fission and subcritical multiplication in fissile materials (e.g., 235U, 239Pu) 3. Isotopic sources such as initiators and calibration sources 4. Reactor testing
Table 6-7 lists areas and operations where neutron exposure could have occurred at NTS. Personnel who did not work in these areas or were not directly involved in operations during the periods indicated were not issued personal neutron dosimeters. If workers were unmonitored for neutrons, based on NTS personal dosimeter issue practices, it is highly unlikely that neutron exposure occurred. Dose reconstructors, therefore, should not consider missed neutron dose for unmonitored personnel.
No single individual had access to areas in which there was potential for neutron exposure. Work in these areas always involved pairs of workers; two knowledgeable persons had to be involved with potential operational activities. This group probably numbered in the hundreds and was limited to persons who worked on specific tasks in specific areas. Neutron doses, for the most part, were low. In addition, neutron exposure was not possible without a concomitant gamma exposure; neutron-to-gamma dose ratios were less than or equal to 1. However, dose reconstructors must not ignore a positive indication of neutron exposure from an individual’s dose or work records.

Effective Date: 09/21/2004 Revision No. 00 Document No. ORAUT-TKBS-0008-6 Page 29 of 55
Table 6-7. Areas and operations where neutron exposure was possible. Area Operation Neutron sources Beginning Final
5 Low-level waste site TRU waste Before 1962 Present 6 Nuclear device assembly Fission neutrons Before 1962 1992 25 NRDS and BREN tower calibrations
and operation Fission neutrons & neutron sources 252Cf. PuBe, AmBe
1966 1973
26 PLUTO Reactor (nuclear-powered ramjet engine)
Fission Neutrons & neutron sources 252Cf. PuBe, AmBe
Mid 1960 Late 1960
27 Nuclear explosive assembly using special nuclear material
Fission neutrons & neutron sources 252Cf, PuBe, AmBe
Before 1982 1975
Various Down-hole well logging 238PuBe or 252Cf isotopic sources
Before 1962 Present
Various Neutron detection instrument calibration facilities
238PuBe or 252Cf isotopic sources
Before 1962 Present
Exposure to neutrons from nuclear detonations, while a theoretical possibility, was for all practical purposes nonexistent. Strict measures were taken to ensure that personnel were not exposed to the prompt radiation from the detonation and, at the locations where personnel could have been exposed to prompt neutrons from the blast, air attenuation and similar attenuation mechanisms would have reduced the energy and the fluence of the neutrons to negligible levels. Therefore, reconstructors should ignore exposure from this source.
Small neutron exposures were possible in the vicinity of test shapes or other significant quantities of fissionable materials, but levels in this case would also probably be negligible and, in any case, overshadowed by the gamma radiation field. An exception would be the few individuals associated with final assembly, arming, and firing of test weapons. Assembly operations were the only times that workers, in close proximity with the weapons components, were exposed to neutrons emanating from bare pits.
The specific workplace neutron fields for specific types of nuclear weapons components are classified. Unclassified information on neutron spectra from nuclear weapons components is not available, but there are two sources, both with significant components above 2 MeV. Before about 1960, nuclear weapons could have contained 210PoBe initiators and 238PuBe (DOE 1997) with a higher neutron dose component relative to the measured photon dose. However, these were not used after 1960.
For exposures after 1960, if neutron dose information is not specifically available for those involved with final assembly and arming operations, photon exposure records, together with neutron-to-photon dose ratios can be used. The neutron-to-photon ratios can be derived from the experience at Pantex where weapons assembly operations were conducted. Analysis of dose records for each Pantex worker with a positive neutron dose greater than 50 mrem for the period 1993 to 2003 yields a geometric mean of 0.81 and GSD of 1.51. An upper 95th-percentile value of 1.6 should be used for the neutron-to-photon dose ratio (ORAU 2004b).
Assuming that 100% of the neutron doses were delivered by neutrons in the 0.1 to 2 MeV range is claimant-favorable. Although there are neutrons with higher energies at the NTS, which are more penetrating, the probability of causation for deeper organs, such as the liver, is much larger in the 0.1 to 2 MeV energy range than any other energy group, thus offsetting the higher dose at depth for the more energetic energy ranges.
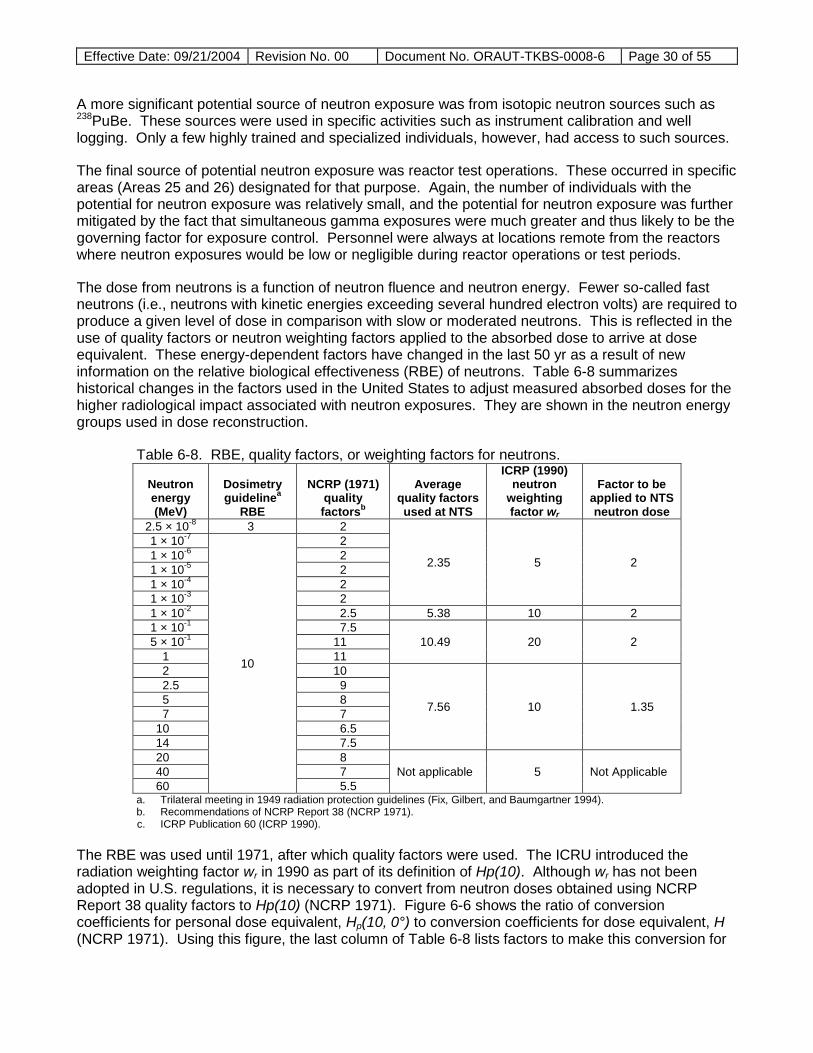
Effective Date: 09/21/2004 Revision No. 00 Document No. ORAUT-TKBS-0008-6 Page 30 of 55
A more significant potential source of neutron exposure was from isotopic neutron sources such as 238PuBe. These sources were used in specific activities such as instrument calibration and well logging. Only a few highly trained and specialized individuals, however, had access to such sources.
The final source of potential neutron exposure was reactor test operations. These occurred in specific areas (Areas 25 and 26) designated for that purpose. Again, the number of individuals with the potential for neutron exposure was relatively small, and the potential for neutron exposure was further mitigated by the fact that simultaneous gamma exposures were much greater and thus likely to be the governing factor for exposure control. Personnel were always at locations remote from the reactors where neutron exposures would be low or negligible during reactor operations or test periods.
The dose from neutrons is a function of neutron fluence and neutron energy. Fewer so-called fast neutrons (i.e., neutrons with kinetic energies exceeding several hundred electron volts) are required to produce a given level of dose in comparison with slow or moderated neutrons. This is reflected in the use of quality factors or neutron weighting factors applied to the absorbed dose to arrive at dose equivalent. These energy-dependent factors have changed in the last 50 yr as a result of new information on the relative biological effectiveness (RBE) of neutrons. Table 6-8 summarizes historical changes in the factors used in the United States to adjust measured absorbed doses for the higher radiological impact associated with neutron exposures. They are shown in the neutron energy groups used in dose reconstruction.
Table 6-8. RBE, quality factors, or weighting factors for neutrons.
Neutron energy (MeV)
Dosimetry guidelinea
RBE
NCRP (1971) quality factorsb
Average quality factors used at NTS
ICRP (1990) neutron
weighting factor wr
Factor to be applied to NTS neutron dose
2.5 × 10⁻⁸ 3 2
2.35 5 2
1 × 10⁻⁷
10
2 1 × 10⁻⁶ 2 1 × 10⁻⁵ 2 1 × 10⁻⁴ 2 1 × 10⁻³ 2 1 × 10⁻² 2.5 5.38 10 2 1 × 10⁻¹ 7.5
10.49 20 2 5 × 10⁻¹ 11 1 11 2 10
7.56 10 1.35
2.5 9 5 8 7 7
10 6.5 14 7.5 20 8
Not applicable 5 Not Applicable 40 7 60 5.5
a. Trilateral meeting in 1949 radiation protection guidelines (Fix, Gilbert, and Baumgartner 1994). b. Recommendations of NCRP Report 38 (NCRP 1971). c. ICRP Publication 60 (ICRP 1990).
The RBE was used until 1971, after which quality factors were used. The ICRU introduced the radiation weighting factor wr in 1990 as part of its definition of Hp(10). Although wr has not been adopted in U.S. regulations, it is necessary to convert from neutron doses obtained using NCRP Report 38 quality factors to Hp(10) (NCRP 1971). Figure 6-6 shows the ratio of conversion coefficients for personal dose equivalent, Hp(10, 0°) to conversion coefficients for dose equivalent, H (NCRP 1971). Using this figure, the last column of Table 6-8 lists factors to make this conversion for
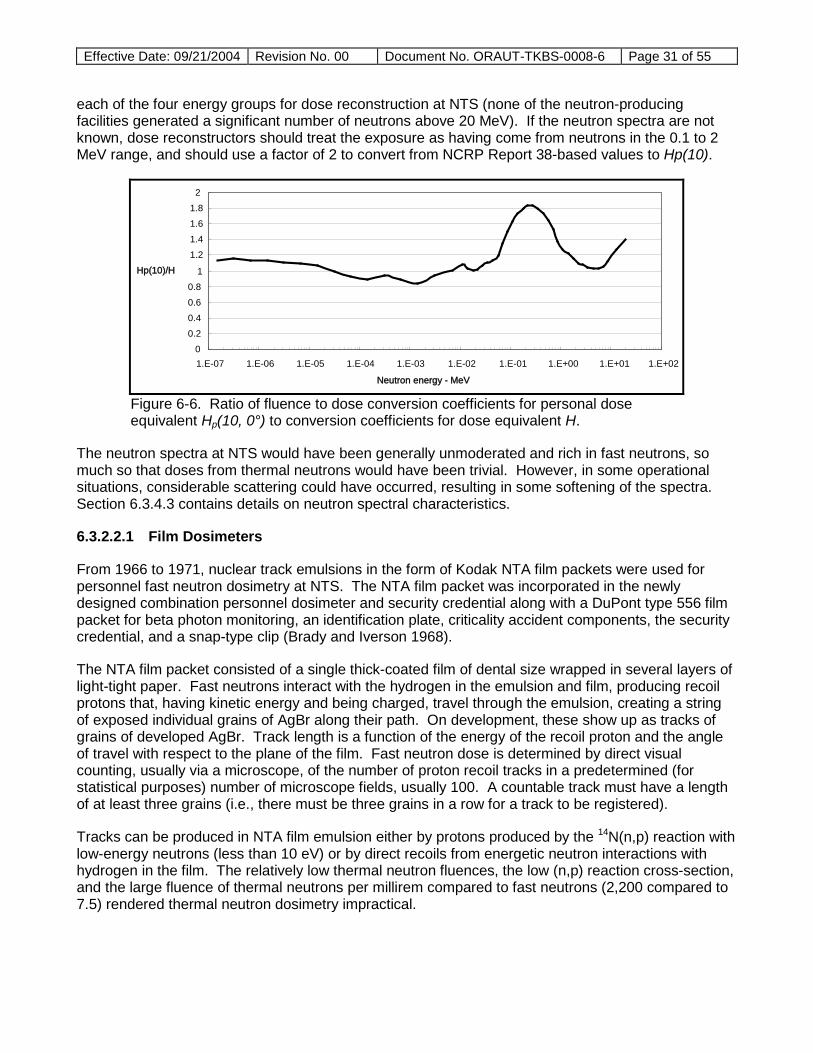
Effective Date: 09/21/2004 Revision No. 00 Document No. ORAUT-TKBS-0008-6 Page 31 of 55
each of the four energy groups for dose reconstruction at NTS (none of the neutron-producing facilities generated a significant number of neutrons above 20 MeV). If the neutron spectra are not known, dose reconstructors should treat the exposure as having come from neutrons in the 0.1 to 2 MeV range, and should use a factor of 2 to convert from NCRP Report 38-based values to Hp(10).
00.20.40.60.8
1
1.21.41.61.82
1.E-07 1.E-06 1.E-05 1.E-04 1.E-03 1.E-02 1.E-01 1.E+00 1.E+01 1.E+02
Neutron energy - MeV
Hp(10)/H
Figure 6-6. Ratio of fluence to dose conversion coefficients for personal dose equivalent Hp(10, 0°) to conversion coefficients for dose equivalent H.
The neutron spectra at NTS would have been generally unmoderated and rich in fast neutrons, so much so that doses from thermal neutrons would have been trivial. However, in some operational situations, considerable scattering could have occurred, resulting in some softening of the spectra. Section 6.3.4.3 contains details on neutron spectral characteristics.
6.3.2.2.1 Film Dosimeters
From 1966 to 1971, nuclear track emulsions in the form of Kodak NTA film packets were used for personnel fast neutron dosimetry at NTS. The NTA film packet was incorporated in the newly designed combination personnel dosimeter and security credential along with a DuPont type 556 film packet for beta photon monitoring, an identification plate, criticality accident components, the security credential, and a snap-type clip (Brady and Iverson 1968).
The NTA film packet consisted of a single thick-coated film of dental size wrapped in several layers of light-tight paper. Fast neutrons interact with the hydrogen in the emulsion and film, producing recoil protons that, having kinetic energy and being charged, travel through the emulsion, creating a string of exposed individual grains of AgBr along their path. On development, these show up as tracks of grains of developed AgBr. Track length is a function of the energy of the recoil proton and the angle of travel with respect to the plane of the film. Fast neutron dose is determined by direct visual counting, usually via a microscope, of the number of proton recoil tracks in a predetermined (for statistical purposes) number of microscope fields, usually 100. A countable track must have a length of at least three grains (i.e., there must be three grains in a row for a track to be registered).
Tracks can be produced in NTA film emulsion either by protons produced by the 14N(n,p) reaction with low-energy neutrons (less than 10 eV) or by direct recoils from energetic neutron interactions with hydrogen in the film. The relatively low thermal neutron fluences, the low (n,p) reaction cross-section, and the large fluence of thermal neutrons per millirem compared to fast neutrons (2,200 compared to 7.5) rendered thermal neutron dosimetry impractical.

Effective Date: 09/21/2004 Revision No. 00 Document No. ORAUT-TKBS-0008-6 Page 32 of 55
Based on theoretical considerations, a minimum neutron energy of about 450 keV is needed to produce a proton recoil track, although in practice the minimum detectable energy or threshold energy was about 800 keV (Figure 6-7). Thus, NTA film is essentially insensitive to neutrons below 500 to 800 keV, depending on the quality of processing. Therefore, it is suitable only for occupational environments in which the majority of the dose comes from neutrons with energies above 1 MeV, or in which the fraction of neutrons below 1 MeV is reasonably well known. It is important to calibrate NTA film dosimeters with a source having a neutron energy spectrum similar to that in which the individual could be exposed. Initially, a PuBe neutron spectrum was used for calibration. The PuBe neutron spectrum has an average energy of about 4 MeV and is considerably richer in fast neutrons than the fission spectrum (with average energy of about 1 MeV), and so is likely to result in a
Figure 6-7. NTA film neutron energy response (IAEA 1990).
calibration factor (i.e., tracks/cm2-n) that would underestimate the fast neutron dose. Any moderation of the fission spectrum encountered under field conditions would further exacerbate the underestimate.
NTA film has a number of severe limitations that lead to large uncertainties in neutron dosimetry. As noted, the response of NTA film was highly dependent on neutron energy and angle of incidence with respect to the plane of the film (Cheka 1954; Lehman 1951; Kathren, Prevo, and Block 1965; Kathren 1967). Another limitation of NTA film is its use dose range. The LLD for fast neutrons typically corresponds to a dose of about 100 mrem. For fast neutron fluences corresponding to a few rem, the track density becomes so great that accurate dosimetry becomes difficult if not impossible.
NTA films respond to other radiation qualities (photons, betas, etc.). Concomitant photon dose, which results in film blackening, can render track counting difficult, introduce errors and, if the optical density produced by the photon exposure is sufficiently great, can obscure proton recoil tracks altogether. Track counting itself is questionable; different persons given identical sections of an exposed NTA film to count often produce highly variable track counts. It has been long recognized that, in the dosimetry laboratory, human factors associated with reading large numbers of neutron films under a microscope can significantly affect neutron dosimetry results. A research conducted at the Rocky Flats Plant in 1994 reevaluated neutron doses for selected plutonium workers. This research indicated that the original evaluations of films could have contained significant errors and that the resulting neutron doses could be significantly higher or lower than the doses actually received. The degree of variation is a function of the track length and the personal style of the individual doing the counting. Uncertainty from this source alone could easily be as great as a factor of 2.

Effective Date: 09/21/2004 Revision No. 00 Document No. ORAUT-TKBS-0008-6 Page 33 of 55
The latent image produced by proton recoil tracks in NTA film is highly susceptible to fading before development. Fading is a function of time after exposure and is particularly severe in high humidity (as much as 75%/wk) but can be minimized and largely controlled if the films are sealed in a moisture-proof pouch before use. Humidity-induced latent image fading is probably not a significant source of uncertainty or dose underestimation at NTS because of the low humidity, although some latent image fading is likely if the wearing interval exceeds a month.
Given these limitations, neutron dose estimates made with NTA film are likely to have a high degree of uncertainty and generally will underestimate the actual dose from fast neutrons. As noted in Table 6-1, this leads to the need for a relatively high bias for neutron data obtained with NTA film when detailed information about the neutron fields is not available (see Section 6.3.4.3).
6.3.2.2.2 Thermoluminescent Albedo Dosimeters
The NTS albedo dosimeters adopted in 1979 were based on the design of Hankins (1977). They were used until 1987 and consisted of four TLD chips each of 6LiF and 7LiF, placed in a cadmium box to suppress response to thermal neutrons. Albedo dosimetry depends on the detection of low-energy neutrons reflected from the body (albedo neutrons) with a thermal neutron detector. Normally, a TLD with 6LiF (TLD 600) is used to detect neutrons, while a companion 7LiF (TLD 700) detector that is insensitive to neutrons is used to subtract the photon/beta contribution.
The primary advantages of TLD albedo dosimeters are the high sensitivity compared to NTA film and the availability of automated TLD readers for rapid reading. The primary disadvantage is that the energy response does not match the personal dose equivalent response, so they are highly energy-dependent (Figure 6-8). The energy response can be improved slightly by dosimeter encapsulation, as used in the NTS dosimeter design. However, the response is still highly dependent on the neutron spectrum.
Figure 6-8. Neutron energy response of NTS albedo dosimeters (IAEA 1990).
Until January 1987, dosimeters were routinely exchanged each month for all individuals and on exit from a radex area if it was suspected that an individual received 100 mR or more of exposure. In addition, personnel entering radex areas were issued self-reading PICs. Measured exposures were added to the yearly and quarterly accumulated exposures.

Effective Date: 09/21/2004 Revision No. 00 Document No. ORAUT-TKBS-0008-6 Page 34 of 55
For albedo dosimeters, neutron fields can be put in four categories based on their relative spectra characteristics: (1) reactors, linear accelerators, and accelerators for medical therapy; (2) nuclear fuel fabrication areas; (3) radioactive neutron sources; and (4) high-energy accelerators with little or no shielding. Within a neutron spectral class, neutron response relative to Hp(10) does not vary by more than a factor of 2. The large energy dependence is still a big disadvantage. The advantage to TLD albedo detectors, compared to film and to a lesser degree Columbia Resin-39 (CR-39), is that they detect neutrons of all energies and have simple automatic TLD readouts.
Calibration curves have been established for working areas that can reduce workplace-dependent changes of albedo response within ±30%. Depending on the neutron field, the lowest detectable dose using albedo TLDs varies from 5 to 20 mrem. Albedo dosimeters can be combined with TEDs for separate measurement of fast neutrons. In a combination detector, the albedo detector serves as the basic neutron detector for screening.
6.3.2.2.3 Track Etch Detectors
The gamma-insensitive CR-39 TED was introduced for personnel neutron dosimetry at NTS in 1987 and was based on the dosimeter developed at Lawrence Livermore National Laboratory (Hankins, Homann, and Westermark 1987; Hadlock et al. 1988). The CR-39 TED offered better energy response characteristics for occupational monitoring than the TLD albedo dosimeter. The response curve is relatively flat, between 0.1 and 4 MeV (Figure 6-9). Once a foil has been properly etched, acquiring information is a nondestructive process.
Figure 6-9. Neutron energy response of NTS TED (REECo 1995b).
The TED is a dosimetry-grade polymer called Columbia Resin-39. When fast neutrons interact with the plastic, submicroscopic damage trails are created. These trails can be enlarged using chemical etching techniques to form tracks visible under a 400-power microscope. The tracks can be made more visible using electrochemical etching that causes breakdown to form subsurface trees that are easily counted under low magnification.
The NTS TED dosimeter consists of three CR-39 foils (i.e., individual dosimeter pieces), cut from 0.025-in. (0.0635-cm)-thick sheets covered on both sides with 0.005-in. thick polyethylene film. They are heat sealed under an opaque blister to a plasticized card. A bar code label is applied, and (for personnel service) the assembly is placed in a cavity in the NTS Personnel Dosimeter.

Effective Date: 09/21/2004 Revision No. 00 Document No. ORAUT-TKBS-0008-6 Page 35 of 55
A three-step etching process is used to develop the damage tracks that resultfrom neutron interactions. After removing the polyethylene film, the track detectors are first etched for 45 minutes at 60°C in 6.5N KOH. This is followed by the electrochemical etching step. An alternating potential of 3 kV is applied across the track detector in the etch bath at a frequency of 60 Hz for 3 hours. The resultant tracks are amplified, forming “trees” under the track detector surface. A third step using 3 kV but at 2,000 Hz produces tracks that are more uniform and easily recognized as tracks. The final step is referred to as the blow-up stage of the process. This produces well-defined round or elliptical holes large enough to be seen and counted with low (4 power) magnification. The tracks are recorded with a television camera interfaced to a commercial bacteria colony counter that can be used to count several standard 0.09-cm2 fields. The dose equivalent is determined by a software program that converts the number of foil net tracks to a dose equivalent.
The TEDs were initially calibrated with an unmoderated 252Cf source at Pacific Northwest Laboratories. Secondary calibration is provided by the NTS 238PuBe neutron source. Secondary calibration-check TED foils are processed with each batch of personnel monitoring foils to determine the RCF for the processing run. Primary and secondary calibration data are recorded in units of millirem per track per square centimeter in the TED program. The tracks from the calibration check foils processed with each batch of foils are compared to the primary and secondary calibration data to determine the dose equivalent conversion factor for the process batch.
Background exposure is subtracted from TED results to eliminate the TED exposure that is not part of the individual’s occupational dose. The natural or background neutron radiation level is extremely low and, therefore, NTS uses the standard practice of using control TEDs. Control TEDs are prepared along with batches of TEDs for issue and are retained in the low-background dosimetry operations facility until the corresponding personnel TEDs are processed. Control, calibration-check, and personnel foils are processed together, and the number of tracks in control foils is subtracted from the number of tracks in personnel and calibration-check foils. Then calibration-check results are used to determine the correct dose equivalent calibration factor.
6.3.2.2.3.1 Dose Algorithms
The CR-39 TED is known to have a nonlinear response, with the observed or measured dose equivalent being a slight overresponse in comparison with the delivered dose equivalent for low doses, then changing to an underresponse as the dose increases. Because the nonlinearity can vary with CR-39 processing methods, specific data for the NTS TED system were collected. A series of TED exposures was made using an unmoderated PuBe source and appropriate conversion factors relating the source to an equivalent unmoderated 252Cf source. Two TEDs (six foils) each were exposed to 12 dose equivalents between 130 to 6,505 mrem. The results ranged from 126 to 2,930 mrem, as shown in Figure 6-10.
TED algorithms were developed by exposing many TEDs to calibrated neutron exposures and comparing processed results with calculated and known dose equivalents. Irradiations ranging from about 100 to 7,000 mrem were used to determine the shape of the curve relating true dose equivalent to observed dose. Linear regression analysis of the data pairs (true and observed dose) showed that a second-degree polynomial fit the relationship between true dose equivalent and indicated for uncorrected dose equivalent. That polynomial, shown below, is the algorithm used by the TED program to calculate the neutron dose equivalent HT from the TED uncorrected dose equivalent HI:
HT = 0.77HI + 0.000459HI2

Effective Date: 09/21/2004 Revision No. 00 Document No. ORAUT-TKBS-0008-6 Page 36 of 55
Figure 6-10. Electrochemically etched CR-39 dose response (REECo 1995b).
HI in the above equation is calculated by the TED program from the number of net tracks and the millirem to track calibration factors.
Because the Panasonic UD-802 TLD has a very slight response to neutrons, two algorithms are necessary to determine dose equivalent when exposure includes photons and neutrons. One algorithm corrects TLD response for neutron interference; the other converts TED results to dose equivalent. The deep dose equivalent is the sum of the deep dose from photons and the dose from neutrons. Therefore, in all neutron exposure cases, a TLD evaluation is performed to determine the deep dose from photons.
6.3.2.2.3.2 Lower Limit of Detection
Control foils processed with each TED processing are used as the basis for background subtraction for the TED system. The mean background dose equivalent to the control foils and the variance among the control foil dose equivalents are calculated for each processing. The background dose equivalent is determined for each processing because it can differ among foil sheets and within foils from the same sheet. Therefore, the TED background correction rate is not a single value, but a variable determined with each processing.
The method for determining the LLD for the TED system, with a variable background correction, was determined from Chapter 7 of NCRP Report 58, A Handbook of Radioactivity Measurements Procedures (NCRP 1978). The appropriate equations are:
LD1 = 2.71 + 4.65√VB
and
LD2 = 2.32√VB

Effective Date: 09/21/2004 Revision No. 00 Document No. ORAUT-TKBS-0008-6 Page 37 of 55
where
VB = background variance in units of dose equivalent squared (millirem squared).
The LD2 equation above was selected as the most appropriate LLD for the TED system. The selection reasons are to same as those discussed above for the TLD system.
The control foil variance (VB) increases with TED foil age and typically ranges between 5 and 25 mrem. Therefore, the TED system LLD is normally between 5 and 12 mrem. However, based on practical experience with these detectors, a value of 25 to 30 mrem is more realistic. That range of limits is reasonable for any TED issue period because it is primarily dependent on foil age and is only slightly dependent on the issue period. Considering the possibility of long-term variations and other contributing factors, potential energy-dependent underresponse to moderated spectra, and the ratio of Hp(10) to dose equivalent H, dose reconstructors should use a value of 80 mrem for the MDL (Table 6-1).
6.3.3
6.3.3.1 Photons
Calibration
In the early 1950s, film dosimeters were calibrated to free-air exposures using 226Ra and 60Co sources with source strengths traceable to the NBS, which is now NIST. Exposures were quantified from inverse-square relationships over a fixed exposure interval at various distances and for exposures at fixed distances over various time intervals. Different approaches were used to compare dosimetry results, including processing badges exposed to calibration fields to badges exposed during test operations. In addition, collocated badges of different types and ionization chambers were exposed simultaneously during some test events to provide in-field calibration for realistic radiation spectra.
6.3.3.2 Neutrons
Neutron calibrations have been performed with isotopic sources, reactor beams, or accelerators. However, virtually all routine or practical radiation protection calibrations employ radioactive sources. The preferred neutron production mechanisms are either alpha-neutron reactions with beryllium or boron, or spontaneous fission (252Cf). On rare occasions, gamma-neutron reactions have been used, but the associated high-intensity gamma fields generally make them unacceptable for calibration of dosimeters and instruments that have any degree of gamma sensitivity.
Table 6-9 summarizes the properties of commonly used isotopic sources from the International Organization for Standardization (ISO 2001). Probably the first isotopic source to be used was 226RaBe. However, its neutron production was accompanied by a high photon emission. As 239Pu, 238Pu, and 241Am became available, they became the alpha-emitting radionuclides of choice. Because these radionuclides have similar alpha energies, the resultant neutron energies are also similar and can be considered nearly identical for radiation protection purposes. In particular, 238PuBe has been in use at NTS for several years.
Occupational neutron fields at the NTS are commonly due to fission origin neutrons. Therefore, 252Cf is particularly attractive as a calibration source because it offers better inherent spectral simulation than the alpha,n sources. However, the unmoderated californium neutron spectrum is significantly harder than most reactor spectra. Beginning in the 1980s, spheres filled with deuterated water (D2O) came into common use as moderators to soften the spectrum of neutrons from the 252Cf source in the center.

Effective Date: 09/21/2004 Revision No. 00 Document No. ORAUT-TKBS-0008-6 Page 38 of 55
Table 6-9. Characteristics of ISO reference radiation radionuclide sources used for neutron dosimeter calibration.
Source Half-life
(yr) Flux average energy
(MeV) 241AmBe (α,n) 432.7 4.4 252Cf spontaneous fission 2.65 2.4 252Cf in 30-cm-diameter D2O sphere 2.65 0.54
6.3.4
The radiation production characteristics at the NTS have been outlined in ORAU (2004b). The potential for external radiation exposures arises primarily from the fission and activation products handled at the NTS. In addition, there is limited potential for neutron exposure from handling TRU radionuclides, isotopic sources, and reactor operations.
Workplace Radiation Fields
6.3.4.1 Photon Energies
The residual radiation field following detonation of a nuclear weapon consists of radiation from fission products, activation products, and unfissioned uranium or plutonium. During atmospheric testing of fission and fusion devices, differences in photon fields of residual radioactivity from detonations were observed. These differences are caused by the relative abundance of a few radionuclides that were produced in each atmospheric test. For example, a low-altitude detonation of a fusion weapon induces large quantities of activation products emitting high-energy gamma rays that dominate the residual radiation spectrum for the first few days following the detonation. In contrast, a low-altitude detonation of a fission weapon produces large quantities of fission products that emit a wide range of photon energies. With either type of weapon, depending on the design, there can be a large amount of activity from the 239Np produced, which can dominate the spectrum for several days.
Although the residual radiation intensity depends on a number of factors that can vary from test to test, relatively few radionuclides, common to all tests, contribute to the major part of the photon spectrum. The relative abundance of each of these radionuclides determines the spectrum. In all cases, the photon field is from photons with energies between approximately 100 keV and 2 MeV. There is very little contribution from photons with energies less than 100 keV with the exception of scattering from large area sources. In those cases, the scattered radiation was determined to have an energy of approximately 75 keV and to have contributed as much as 10% of the overall photon spectrum.
For external dose reconstruction, unless exposure to fresh fallout (first few days) is known to have occurred (early reentry teams), use the claimant-favorable assumption that photon energies are between 30 and 250 keV. At times less than 1 wk after detonation, it would be reasonable and still claimant-favorable to assume that 75% of the photon dose was from photons with energies above 250 keV (Kathren 2004; Coryell and Sugarman 1951; Nelms and Cooper 1959). For the period 1961 to 1966 when the multielement dosimeter was introduced, a contribution amounting to 25% of the total dose should be included in the range of 30 to 250 keV to account for low-energy photons attenuated by the lead filter that covered a portion of the film.
6.3.4.2 Beta Particle Energies
This section applies only to whole-body external doses from beta radiation as could be encountered from a fallout field or residual fission product activity at a work location. It does not apply to situations in which beta radiation is deposited directly on the skin or clothing, but rather concerns in-air doses to

Effective Date: 09/21/2004 Revision No. 00 Document No. ORAUT-TKBS-0008-6 Page 39 of 55
which a worker could have been exposed. Although there is a large and highly useful body of literature pertaining to skin doses from deposition of beta-emitting contamination on the skin, there is a paucity of available information on external (i.e., in-air) beta doses from fallout fields or residual fission product activity. Concerns were largely limited to whole-body exposure.
There are about 90 possible fission fragments, which, on the average, decay through three stages to yield a total of about 250 individual fission-produced radionuclides, most of which are beta particle emitters.1
Unlike gamma rays and neutrons, whose attenuation in matter is exponential, beta rays have a finite range in matter determined by the energy of the beta particle. Because beta particles emitted by radioactive species are not monoenergetic, the range is usually specified in terms of the maximum energy of the beta particle spectrum. For the beta produced by the decay of fission and activation products, the maximum energy typically does not exceed 3 MeV
Many of these beta-emitting fission product radionuclides have very short half-lives – on the order of a few seconds or less – and quickly decay into other nuclides. Others decay over longer periods. Therefore, the composition and beta energy spectrum of fallout is not constant; it changes over time. In addition to beta-emitting fission products, activation products are produced by a nuclear detonation, although their contribution to overall beta dose is relatively small. Unlike photons, which are emitted with discrete quantum energies, beta emission is characterized by a distribution of energies ranging from zero to a maximum value that is commonly used to characterize the spectrum. The average energy of a beta spectrum is typically about one-third of the maximum energy, and the total energy produced by beta particles from fission products is essentially the same as that from fission product gamma rays, namely about 7 MeV per fission.
2
The range of a beta particle of known energy can be rigorously calculated by integration of the –dE/dx equation, which shows that the rate of energy loss is a complex function directly proportional to the number of atoms per cubic centimeter of absorber and to the Z of the absorber, and is exponentially related to the kinetic energy of the beta particle. However, a reasonably good approximation of the range R of a beta particle of energy E (in megavolts-electron) in any medium can be calculated in terms of density thickness (in milligrams per square centimeter) from the following empirical equation:
, and the range of a 3-MeV particle in air is approximately 36 ft. Therefore, an individual at a greater distance greater than 36 ft from a fallout field would not receive an external dose from beta radiation associated with the decay of radionuclides produced by fission and fission-produced activation products. Similarly, an individual exposed to beta particles with energies below 70 keV would receive no beta dose to the skin because beta particles with energies below 70 keV have insufficient energy to penetrate the cornified outer layer of the skin.
R = 412E(1.265-0.0954 lnE)
which holds over the energy range 0.01 to 2.5 MeV. For energies above 2.5 MeV, the appropriate empirical relationship is:
R = 530E – 106
A somewhat less exact but still reasonable approximation for the range of a beta particle in units of grams per square centimeter is to divide the beta particle energy by 2: a 3-MeV particle would have a
2Although the term beta particle can refer to both positron and negatron emission from the nucleus of an excited atom, as applied to fission produced radionuclides it refers only to negatron (i.e., electron) emission because no known fission products emit positrons. 2The few exceptions are fission products with very short half-lives, which can be ignored for all practical purposes.
Effective Date: 09/21/2004 Revision No. 00 Document No. ORAUT-TKBS-0008-6 Page 40 of 55
range of 1.5 g/cm2, which corresponds to 36 ft, approximately the same value (within about 3%) obtained using either of the above equations.
Because of attenuation of beta radiation in air, the external dose associated with a fallout field is strongly dependent on distance. As one moves away from the beta field, more and more of the lower energy particles in the spectrum reach the end of their range and no longer contribute to the dose; 1 m of air is sufficient to attenuate all betas with energies below about 400 keV. And, as already noted, 36 ft of air is sufficient to absorb virtually all beta radiation associated with a fallout field, so beyond this distance there is zero beta dose. In contrast, as one moves closer to the fallout beta field, the external beta dose rate rises more rapidly than the concomitant gamma dose rate. Hence, the beta-to-gamma dose rate ratio is a function of distance from the fallout field; at distances greater than 36 ft, the ratio is zero because there is no beta dose, as noted above. Calculations by Sondhaus and Bond (1955) on persons highly exposed to Marshall Islands weapons fallout contamination from the Bravo event indicate that, relative to the average whole-body gamma dose from a fallout field, the corresponding beta dose would range from about a factor of 2 at the head to about a factor of 10 at the bottom of the feet (bare) (standing on the contamination). At 1 m above the ground, the beta–to-gamma dose rate ratio was 3. This is consistent with the data obtained onboard a contaminated ship and described in a 1954 memorandum obtained from the DOE archives in Las Vegas which, only 33 hr after detonation, described a beta:gamma ratio of 10 at the deck level, 8 at knee level, and about 5 at film badge level (about 4 ft above the deck).
The above results appear inconsistent with the observations of Kulp and Dick (1960), who reported beta dose rates at 1 in. from a contaminated aircraft surface to be typically 10-fold greater than gamma dose rates at 1 ft from the surface. When a correction is made for the distance by using 1/d relationship for an infinite plane source to obtain the gamma dose rate at 1 in., the beta:gamma dose rate ratio falls to less than 1. However, the Kulp and Dick measurements involved vastly different geometries with opportunities for beta shielding and therefore might not be applicable to the type of exposures expected in the field at NTS. A more rigorous approach was taken by Broido and Teresi (1961) who evaluated the surface dose rate from beta radiation from a fallout field in relation to the gamma dose, and found the beta dose to be 13 times that of the gamma dose. Comparing the beta surface dose to the gamma dose at 1 m, Broido and Teresi observed a ratio of 40. In a study by Black (1962) in which actual measurements were made of doses to troops crawling through a contaminated fallout field, the beta:gamma dose ratio was approximately 7.
In these studies, the concern was the dose from contamination deposited on the skin, a situation rather different from the external exposure situation that could be encountered in the field at NTS and that would likely produce a higher beta:gamma dose ratio. Although numerous theoretical and empirical studies have been made of gamma radiation doses above fallout-contaminated ground, there have been few such studies of beta radiation doses. Review of operational monitoring logs from several Plumbbob detonations indicate, on the basis of survey meter readings, a beta:gamma dose rate ratio in the range of slightly greater than unity to a maximum of about 3, regardless of distances above the field (ranging to 3 ft), and for times ranging from 1 to 4 wk after the detonation. Beta:gamma dose rate ratios did not appear dependent on dose rate but, according to a study by Barnaby (1957), vary with time. At 1 m above the surface of contaminated ground, Barnaby found a beta:gamma dose ratio of 27 at 1.5 hr after detonation, dropping rapidly to a minimum of about 3 at 10 to 20 days after detonation, and then increasing again to about 30 at 400 days after detonation. This is not necessarily inconsistent with observations at the NTS, which were mostly made from a few days to a few weeks after detonation.
Given the above discussion, for beta dose reconstruction in the absence of personnel monitoring data (i.e., exposures before 1967), the dose reconstructors should assume that a reasonable client-

Effective Date: 09/21/2004 Revision No. 00 Document No. ORAUT-TKBS-0008-6 Page 41 of 55
favorable estimate of beta dose can be obtained by ratio with gamma dose. To this end, some provisional values are presented below (with the caveat that they are subject to revision as additional information is obtained). For beta doses incurred in a mixed beta-gamma radiation field a few days to a few weeks after detonation for which the gamma dose is known, a beta:gamma dose ratio of 5 would seem to be reasonable, while allowing a measure of overstatement to ensure claimant-favorability. In other words, the beta dose would be 5 times the measured gamma dose. If the mixed field exposure occurred less than 2 to 3 days after detonation, or more than 6 wk after detonation, a beta:gamma dose ratio of 10 is provisionally suggested. These provisional dose ratios take no credit for shielding or attenuation of beta particles by clothing (which could reduce them by a factor of 2 or more) and assume a 1-m distance from the fission product field with no overburden, leaching, vegetation, or other material or weathering action that would reduce the ratio, however likely this could be.
For external dose reconstruction, a positive indication of beta exposure in a dose record is considered to be due to betas with energies greater than 15 keV.
6.3.4.3 Neutron Energies
As indicated in Section 6.3.2.2, primary NTS operations with neutron exposure potential have been:
• Low-level waste • Nuclear device assembly • NRDS and BREN (Bare Reactor Experiment Nevada) tower calibrations and operation • PLUTO reactor (nuclear-powered ramjet engine) • Nuclear explosive assembly using special nuclear material • Down-hole well logging • Neutron detection instrument calibration facilities
The neutron source spectra from these operations were either from fission of uranium and transuranic nuclides or isotopic sources involving n,alpha reactions, such as 238PuBe or 241AmBe. Moderation or scattering of the source neutrons results in a “softening” of the spectrum, with an increase in the fraction of low-energy neutrons present. This, in turn, results in (1) lower RBEs, quality factors, or radiation weighting factors, and (2) changes in the effective calibration factors for the energy-dependent dosimeters and instruments used for personal neutron dose assessment.
There is no indication that neutron spectral measurements were conducted at the NTS for radiation protection purposes. However, IAEA has compiled extensive neutron spectral functions, instrument and dosimeter response functions, and dosimetric quantity response functions (IAEA 1978, 1990, 2001). Because the source spectra for NTS operations are limited to those discussed above, adequate simulation can be obtained by selecting the proper neutron production mechanism and moderation and scatter conditions from the spectral catalogs that best simulate those for NTS operations. For example, Godiva is actually the reactor used on the BREN tower.
Figures 6-11 to 6-13 show the effect of scattering and moderation on the neutron spectra. Figure 6-14 and Table 6-10 further illustrate the impact of spectral softening from scatter and moderation; that is, the fraction of Hp(10,0) due to neutrons with energies less than the indicated value. For example, with the “hard,” unmoderated 241AmBe source spectrum, about 74% of the dose is due to neutrons above 2 MeV. The PuBe spectrum at 1 m is probably more characteristic of an unmoderated calibration source spectrum, with about 63% of the Hp(10) due to neutrons above 2 MeV. In contrast, consider the much softer 252Cf source spectrum in a 15-cm diameter D2O sphere where 9% of the dose comes from neutrons below 0.1 MeV and only 31% of the dose comes from

Effective Date: 09/21/2004 Revision No. 00 Document No. ORAUT-TKBS-0008-6 Page 42 of 55
1.E-05
1.E-04
1.E-03
1.E-02
1.E-01
1.E+00
1.E-09 1.E-08 1.E-07 1.E-06 1.E-05 1.E-04 1.E-03 1.E-02 1.E-01 1.E+00 1.E+01
Neutron energy - MeV
Flue
nce/
unit
log
ener
gy(le
thar
gy)
Bare 252Cf
Bare 252Cfw/roomscatter
Figure 6-11. Lethargy neutron spectra for 252Cf calibration source with and without room scatter (IAEA 2001).
1.E-03
1.E-02
1.E-01
1.E+00
1.E-07 1.E-06 1.E-05 1.E-04 1.E-03 1.E-02 1.E-01 1.E+00 1.E+01
Neutron energy - meV
Flue
nce/
unit
ener
gy(le
thar
gy)
252Cf - ISO
252Cf in10.16 cmCH2
252Cf in22.86 cmCH2
252Cf in22.86 cmCH2 w/10.2cm Fe cover
Figure 6-12. Lethargy neutron spectra for 252Cf with various thickness moderators (IAEA 2001).

Effective Date: 09/21/2004 Revision No. 00 Document No. ORAUT-TKBS-0008-6 Page 43 of 55
1.E-04
1.E-03
1.E-02
1.E-01
1.E+00
1.E-08 1.E-07 1.E-06 1.E-05 1.E-04 1.E-03 1.E-02 1.E-01 1.E+00 1.E+01
Neutron energy - MeV
Flue
nce/
unit
ener
gy (l
etha
rgy)
241AmBew/o roomscatter241AmBew/roomscatter
Figure 6-13. Lethargy neutron spectra for an 241Am-Be calibration source with and without room scatter (IAEA 2001).
0
0.2
0.4
0.6
0.8
1
1.2
1.E-06 1.E-05 1.E-04 1.E-03 1.E-02 1.E-01 1.E+00 1.E+01
Neutron energy, En - MeV
Frac
tion
of H
p(0,
10) <
En
252Cf - ISO 252Cf D2O Mod. - ISO
AmBe - ISO TRU Plant, Pu Repro. Plant, Heavily shielded
Bare 238PuO2 at 100 cm Godiva Spectrum Figure 6-14. Fraction of Hp(10,0) due to neutrons with energies less than En.

Effective Date: 09/21/2004 Revision No. 00 Document No. ORAUT-TKBS-0008-6 Page 44 of 55
Table 6-10. Fraction of Hp(10,0) for neutrons with energies less than En.
Energy En - MeV
252Cf ISO
Bare 252Cf w/o
shadow cone
252Cf D2O Mod. - ISO
252Cf in D2O w/o shadow
cone 241AmBe
ISO
AmBe w/o
shadow cone
PuBe at 1m
TRU Plant, Pu Repro. Plant,
heavily shielded
Bare 238PuO2 at 100
cm Godiva
spectrum 1.00E-02 0.000 0.004 0.018 0.030 0.000 0.003 0.002 0.028 0.012 0.000 1.99E-02 0.000 0.005 0.027 0.039 0.000 0.003 0.002 0.032 0.013 0.000 5.01E-02 0.001 0.008 0.050 0.064 0.000 0.005 0.003 0.046 0.014 0.001 1.00E-01 0.003 0.017 0.089 0.106 0.001 0.010 0.005 0.080 0.021 0.008 1.99E-01 0.017 0.042 0.155 0.181 0.009 0.028 0.027 0.162 0.058 0.043 3.98E-01 0.072 0.114 0.228 0.283 0.037 0.070 0.066 0.321 0.225 0.158 5.01E-01 0.110 0.158 0.269 0.328 0.053 0.099 0.088 0.392 0.331 0.226 7.94E-01 0.236 0.292 0.361 0.462 0.099 0.169 0.158 0.549 0.544 0.394 1.00E+00 0.325 0.382 0.407 0.516 0.127 0.212 0.242 0.625 0.646 0.492 1.25E+00 0.430 0.486 0.476 0.579 0.158 0.260 0.310 0.694 0.744 0.591 1.99E+00 0.662 0.708 0.668 0.775 0.262 0.376 0.373 0.814 0.842 0.781 3.98E+00 0.927 0.939 0.916 0.961 0.660 0.683 0.744 0.931 0.911 0.958 5.01E+00 0.968 0.969 0.963 0.969 0.813 0.806 0.871 0.956 0.930 0.983 7.94E+00 0.999 0.988 0.998 0.992 0.995 0.969 0.997 0.989 0.977 1.000 1.00E+01 1.000 0.993 1.000 0.994 1.000 0.991 1.000 0.999 0.987 1.000 1.58E+01 1.000 1.000 1.000 1.000 1.000 1.000 1.000 1.000 1.000 1.000
neutrons with energies greater than 2 MeV. Table 6-10 provides a detailed listing of the fraction of Hp(10,0) due to neutrons with energies less than the indicated value.
Figure 6-13 and Table 6-10 indicate that the Hp(10, 0) contribution from neutrons with energies less than 10 keV can be ignored for the purposes of NTS dose reconstruction. The primary Hp(10) contributions fall in the energy ranges 100 keV to 2 MeV and 2 MeV to 20 MeV.
It is, therefore, recommended that dose reconstructors should make the claimant-favorable assumption that neutron energies are between 100 and 2,000 keV.
Table 6-10 also indicates that NTA film could underestimate doses by 55% or more because the detection threshold for the film is about 0.8 MeV. Therefore, it is recommended that the bias for NTA measurements include a factor of 2.5 to account for potential dosimeter underresponse in softer neutron fields. The bias should also include correction for the ratio of dose equivalent H to personal dose equivalent Hp(10) conversion coefficients of 0.5 in the 0.1 to 2 MeV energy range (Table 6-10). These two factors combine to yield a recommended bias for NTA film based dose assessment of 5 (Table 6-1), if the spectrum is not well known.
TEDs have a lower energy threshold than NTA film. Therefore, fewer neutrons will be undetected. However, with a threshold of about 100 keV, the underestimate due to energy response should be less than 10% to 15%, so dose reconstructors should use an overall bias of 2.5, including dose conversion coefficient correction.
On the other hand, albedo dosimeters calibrated with isotopic sources in low-scatter conditions are likely to overestimate operational dose if more scatter and moderation could be involved. It is not recommended that credit be taken for potential overresponse of albedo dosimeters, so the bias in this case consists only of the dose conversion factor correction and a bias value of 2 is appropriate. This value is recommended for the Panasonic UD-809 measurements as well because the detection process is albedo based.

Effective Date: 09/21/2004 Revision No. 00 Document No. ORAUT-TKBS-0008-6 Page 45 of 55
REFERENCES
AEC (U.S. Atomic Energy Commission), 1961, Nevada Test Site Organization (NTSO), Chapter 0524, Radiological Safety, NTSO-0524-1, Standard Operating Procedure, Las Vegas, Nevada.
Barnaby, C. F., 1957, Operation Buffalo: Measurement of the Beta/Gamma Ratios of the Radiations from Fallout, AWRE Report T19/57, FEW 97, Nevada Test Site, Nevada.
Becker, K., 1966, Photographic Film Dosimetry, The Focal Press, London, England, and New York, New York.
Black, R. H., 1962, “Some Factors Influencing the β-Dosage to Troops,” Health Physics, volume 8, pp. 131–141.
Boone, F. W., E. D. Bennett, and S. B. Adams, 1970, Progress Report: NRDS Personnel Dosimetry Program, Statistical Comparison of TLD and Film Dosimeter Data, Report No. 33-37, Pan American World Airways, Nuclear Rocket Development Station Project, Nevada Test Site, Nevada.
Brady, W. J., and G. K. Iverson, 1968, Combination Personnel Dosimeter and Security Credential Holder, Report NVO-162-27, U.S. Atomic Energy Commission, Las Vegas, Nevada.
Brady, W. J., 2004, "Personal communication with R. Griffith on NTS external dosimetry procedures," February, Oak Ridge Associated Universities, Oak Ridge, Tennessee.
Broido, A., and J. D. Teresi, 1961, Analysis of the Hazards Associated with Radioactive Fallout Material – I. Estimation of γ- and β-Doses, Health Physics, volume 5, pp. 63–69.
Coryell, C. D., and N. Sugarman, editors, 1951, The Fission Products, National Nuclear Energy Series Book I, Division IV, Part IV, McGraw-Hill, New York.
Cheka, J., 1954, “Recent Developments in Film Monitoring of Fast Neutrons,” Nucleonics, volume 15, number 6, pp. 40.
DOE (U.S. Department of Energy), 1982, Radiological Safety, Standard Operating Procedure, Nevada Test Site, Chapter 0524, NTS-SOP-0524, Las Vegas, Nevada.
DOE (U.S. Department of Energy), 1986, Standard for the Performance Testing of Personnel Dosimetry Systems, DOE/EH-0027, Office of Environment, Safety and Health, Washington, D.C.
DOE (U.S. Department of Energy), 1988, "Radiation Protection for Occupational Workers,” Order 5480.11, Washington, D.C.
DOE (U.S. Department of Energy), 1994, NV/YMP Radiological Control Manual, DOE/NV/10630-59, Revision 1, Nevada Operations Office, Las Vegas, Nevada.
DOE (U.S. Department of Energy), 1997, Linking Legacies, DOE/EM-0319, Office of Environment, Safety and Health, Washington, D.C.
Dudley, R. A., 1966, “Dosimetry with Photographic Emulsions,” , pp. 326–387 in Radiation Dosimetry, Volume 2, F. H. Attix and W. C. Roesch, editors, Academic Press, New York, New York.

Effective Date: 09/21/2004 Revision No. 00 Document No. ORAUT-TKBS-0008-6 Page 46 of 55
Ehrlich, M., 1954, Photographic Dosimetry of X and Gamma Rays, Handbook 57, National Bureau of Standards, U.S. Department of Commerce, Washington, D.C.
Ehrlich, M., 1962, The Use of Film Badges for Personnel Monitoring, Manual STI-PUB-43, International Atomic Energy Agency, Vienna, Austria.
Fix, J. J., E. S. Gilbert, and W. V. Baumgartner, 1994, An Assessment of Bias and Uncertainty in Recorded Dose from External Sources of Radiation for Workers at the Hanford Site, PNL-10066, Pacific Northwest Laboratory, Richland, Washington.
Fix, J. J., L. Salmon, G. Cowper, and E. Cardis, 1997, “A Retrospective Evaluation of the Dosimetry Employed in an International Combined Epidemiologic Study,” Radiation Protection Dosimetry, volume 74, pp. 39–53.
Fix, J. J., R. H. Wilson, and W. V. Baumgartner, 1997, Retrospective Assessment of Personnel Neutron Dosimetry for Workers at the Hanford Site, PNNL-11196, Pacific Northwest National Laboratory, Richland, Washington.
Hadlock, D. E., L. W. Brackenbush, R. V. Griffith, D. E. Hankins, and M. A. Parkhurst, 1988, Personnel Neutron Dose Assessment Upgrade, PNL-6620, Volume 1, Pacific Northwest Laboratory, Richland, Washington.
Hankins, D. E., 1977, “Energy dependence of remmeters and albedo neutron dosimeters at energies of thermal and between 2 keV and 5.67 MeV,” Proceedings of the 4th International Congress of the International Radiation Protection Association, Volume 2, pp. 553–556.
Hankins, D. E., S. G. Homann, and J. Westermark, 1987, Personnel Neutron Dosimetry Using Electrochemically Etched CR-39 Foils, UCRL-95350, Lawrence Livermore National Laboratory, Livermore, California.
IAEA (International Atomic Energy Agency), 1978, Compendium of Neutron Spectra in Criticality Accident Dosimetry, Technical Report Series 180, Vienna, Austria
IAEA (International Atomic Energy Agency), 1990, Compendium of Neutron Spectra and Detector Responses for Radiation Protection Purposes, Technical Report Series 318, Vienna, Austria
IAEA (International Atomic Energy Agency), 2001, Compendium of Neutron Spectra and Detector Responses for Radiation Protection Purposes, Supplement to Technical Report Series No. 318, Technical Report Series 403, Vienna, Austria.
ICRP (International Commission on Radiological Protection), 1990, Recommendations of the International Commission on Radiological Protection, Publication 60, Pergamon Press, Oxford, England.
ICRU (International Commission on Radiation Units and Measurements), 1962, Radiation Quantities and Units, Report No. 10a, Bethesda, Maryland.
ICRU (International Commission on Radiation Units and Measurements), 1993, Quantities and Units in Radiation Protection Dosimetry, Report No. 51, Bethesda, Maryland.

Effective Date: 09/21/2004 Revision No. 00 Document No. ORAUT-TKBS-0008-6 Page 47 of 55
ISO (International Organization for Standardization), 2001, Reference Neutron Radiations – Part 1: Characteristics and methods of Production, Standard ISO/DIS 8529, Part 1, Geneva, Switzerland.
Kathren, R. L., 1967, “Dosimetry of 14-MeV Neutrons with Eastman NTA Personnel Monitoring Film,” Health Physics, volume 13, pp. 1039–1040.
Kathren, R. L., 1987, "External Beta-Photon Dosimetry for Radiation Protection," pp. 321–370 in The Dosimetry of Ionizing Radiation, Volume II, K. R. Kase and F. H. Attix, editors, Academic Press, New York, New York.
Kathren, R. L. and H. V. Larson, 1969, "Radiological Calibration and Standardization for Health Physics: A Program, A Plea, and a Proposal", Health Physics, volume 16, pp. 778–782.
Kathren, R. L., C. T. Prevo, and S. Block, 1965, “Angular Dependence Of Eastman Type A (NTA) Personnel Monitoring Film,” Health Physics, volume 11, pp. 1067–1069.
Kathren, R. L., P. R. Zurakowski, and M. Covell, 1966, "Effect of Humidity and Dose on Personnel Monitoring Film," American Industrial Hygiene Association Journal, volume 27, pp. 388–395.
Kathren, R. L., 2004, "Personal communication with R. Griffith on NTS external dosimetry procedures," February, Oak Ridge Associated Universities, Oak Ridge, Tennessee.
Kulp, J. L., and J. L. Dick, 1960, “The Radiation Hazard from Contaminated Aircraft,” Health Physics, volume 4, pp. 133–156.
Lehman, R. L., 1951, Energy Response and Physical Properties of NTA Personnel Dosimeter Nuclear Track Film, UCRL-9513, Lawrence Livermore National Laboratory, Livermore, California.
NCRP (National Council on Radiation Protection and Measurements), 1971, Protection Against Neutron Radiation, Report 38, Bethesda, Maryland.
NCRP (National Council on Radiation Protection and Measurements), 1978, A Handbook of Radioactivity Measurements Procedures, Report 58, Washington, D.C.
Nelms, A. T. and J. W. Cooper, 1959, “U-235 Fission Product Decay Spectra at Various Times After Fission,” Health Physics, volume 1, pp. 427–441.
NIOSH (National Institute for Occupational Safety and Health), 2002, External Dose Reconstruction Implementation Guidelines, OCAS-IG-001, Revision 1, Office of Compensation Analysis and Support, Cincinnati, Ohio.
NRC (National Research Council), 1989, Film Badge Dosimetry in Atmospheric Nuclear Tests, Report 69114, Committee on Film Badge Dosimetry in Atmospheric Nuclear Tests, National Academy Press, Washington, D.C.
ORAU (Oak Ridge Associated Universities), 2004a, Technical Basis Document for the Nevada Test Site – Occupational Environmental Dose, ORAUT-TKBS-0008-04, Revision 00, Oak Ridge, Tennessee.
Effective Date: 09/21/2004 Revision No. 00 Document No. ORAUT-TKBS-0008-6 Page 48 of 55
ORAU (Oak Ridge Associated Universities), 2004b, Technical Basis Document for the Iowa Army Ammunition Plant, ORAUT-TKBS-0018, Revision 00, Oak Ridge, Tennessee.
ORAU (Oak Ridge Associated Universities), 2004c, Technical Basis Document for the Nevada Test Site – Site Description, ORAUT-TKBS-0008-04, Revision 00, Oak Ridge, Tennessee.
Pan Am (Pan American World Airways), 1967, Final Proposal for NRDS TLD System at NRDS, Pan American World Airways NRDS Project, Report PAA-PAA 33-14, Nuclear Rocket Development Station, Nevada Test Site, Nevada.
REECo (Reynolds Electrical and Engineering Company), 1961, Standard Operating Procedures for the Radiological Safety Division, Las Vegas, Nevada.
REECo (Reynolds Electrical and Engineering Company), 1962, Basic Radiological Safety Training Manual, 559:62-0140, Las Vegas, Nevada.
REECo (Reynolds Electrical and Engineering Company), 1990, Standard Operating Procedures: Procurement and Acceptance Criteria, AABAC.D.02.40, Operational Dosimetry Branch, Las Vegas, Nevada.
REECo (Reynolds Electrical and Engineering Company), 1995a, Nevada Test Site Radiation Protection Program, Las Vegas, Nevada.
REECo (Reynolds Electrical and Engineering Company), 1995b, External Dosimetry Technical Basis Manual for the Nevada Test Site and Other Designated Locations, Report (548)-6.4.1, Las Vegas, Nevada, December.
REECo (Reynolds Electrical and Engineering Company), 1995c, Monthly Calibration of Gamma Radiation Fields at Inner and Outer Dosimeter Support Rings, REECo Organizational Operating Procedure C34-6209-086.A, Las Vegas, Nevada.
REECo (Reynolds Electrical and Engineering Company), 1995d, Thermoluminescent Dosimetry Quality Assessment, REECo Organizational Operating Procedure C34-6209-039.A. Las Vegas, Nevada.
Sondhaus, C. A., and V. P. Bond, 1955, Physical Factors and Dosimetry in the Marshall Island Radiation Exposures, Report WT-939 (Del), U.S. Naval Radiological Defense Laboratory.
Thierry-Chef, I., F. Pernicka, M. Marshall, E. Cardis, and P. Andreo, 2002, “Study of a Selection of 10 Historical Types of Dosimeter: Variation of the Response to Hp(10) with Photon Energy and Geometry of Exposure,” Radiation Protection Dosimetry, volume 102, number 2, pp. 101–113.

Effective Date: 09/21/2004 Revision No. 00 Document No. ORAUT-TKBS-0008-6 Page 49 of 55
GLOSSARY
absorbed dose, D Amount of energy imparted by radiation to unit mass of absorbing material (100 ergs per gram), including tissue. The unit used before the use of the International System of metric units is the rad; the International System unit is the gray.
accreditation Recognition that a dosimeter system has passed the performance criteria of the DOE Laboratory Accreditation Program standard in specified irradiation categories.
accuracy If a series of measurements has small systematic errors, they are said to have high accuracy. The accuracy is represented by the bias.
albedo dosimeter A TLD device that measures the thermal, intermediate, and fast neutrons that are scattered and moderated by the body from an incident fast neutron flux.
algorithm A computational procedure.
Atomic Energy Commission Original agency established for nuclear weapons and power production; a successor to the Manhattan Engineering District , and a predecessor to the U.S. Department of Energy.
backscatter Deflection of radiation by scattering processes through angles greater than 90 degrees with respect to the original direction of motion.
beta particle A charged particle of very small mass emitted spontaneously from the nuclei of certain radioactive elements. Most (if not all) direct fission products emit (negative) beta particles. The beta particle is physically identical with an electron moving at high velocity.
buildup Increase in flux or dose due to scattering in the medium.
calibration blank A dosimeter that has not been exposed to a radiation source. The results from this dosimeter establish the dosimetry system base line or zero dose value.
claimant-favorable Process of estimation based on technical considerations of parameters significant to dose such that the estimated dose is not underestimated.
collective dose equivalent The sum of the dose equivalents of all individuals in an exposed population. Collective dose is expressed in units of person-rem (person-sievert).

Effective Date: 09/21/2004 Revision No. 00 Document No. ORAUT-TKBS-0008-6 Page 50 of 55
control dosimeter A dosimeter used to establish the dosimetry system response to radiation dose. The dosimeter is exposed to a known amount of radiation.
curie A special unit of activity. One curie exactly equals 3.7 x 10¹⁰ nuclear transitions per second.
deep absorbed dose (Dd) The absorbed dose at the depth of 1.0 centimeter in a material of specified geometry and composition.
deep dose equivalent (Hd) The dose equivalent at the respective depth of 1.0 centimeter in tissue.
densitometer Instrument that has a photocell to determine the degree of darkening of developed photographic film.
density reading See optical density.
DOE Laboratory Accreditation Program (DOELAP) Accredits DOE site dosimetry programs based on performance testing and onsite reviews performed on a 2-year cycle.
dose equivalent (H) The product of the absorbed dose D, the quality factor Q, and any other modifying factors. The special unit is the rem. When D is expressed in gray, H is in sieverts. (1 sievert = 100 rem.)
dosimeter A device used to measure the quantity of radiation received. A holder with radiation-absorbing elements (filters) and an insert with radiation-sensitive elements packaged to provide a record of absorbed dose or dose equivalent received by an individual. (See albedo dosimeter, film dosimeter, neutron film dosimeter, thermoluminescent dosimeter.)
dosimetry system A system used to assess dose equivalent from external radiation to the whole body, skin, and extremities. This includes the fabrication, assignment, and processing of dosimeters as well as interpretation and documentation of the results.
DuPont 552 A film packet containing two pieces of film: a 502 sensitive film and a 510 insensitive film.
DuPont 558 A film packet containing a 508 film with one side having a sensitive emulsion and the other side insensitive emulsion.
error A term used to express the difference between the estimated and actual value.
Effective Date: 09/21/2004 Revision No. 00 Document No. ORAUT-TKBS-0008-6 Page 51 of 55
exchange period (frequency) Period (weekly, biweekly, monthly, quarterly, etc.) for routine exchange of dosimeters.
exposure As used in the technical sense, a measure expressed in roentgens of the ionization produced by gamma (or X-) rays in air.
fast neutron Neutron of energy between 10 kilovolts-electron and 10 megavolts-electron.
film Generally means a film packet that contains one or more pieces of film in a light-tight wrapping. When developed the film has an image caused by radiation that can be measured using an optical densitometer. (See DuPont 552, DuPont 558, nuclear track emulsion)
film density See optical density.
film dosimeter A small packet of film in a holder that attaches to a worker.
filter Material used to adjust radiation response of a dosimeter to provide an improved tissue equivalent or dose response.
first collision dose A dose measurement that can be determined for photons or neutrons. For neutron radiation, the simplest calculation is one relating dose to flux through a thin layer of tissue. The resultant graph, sometimes referred to as the first-collision curve, is derived from the assumption that the probability of two or more interactions per neutron is negligible. Because of the short range of the charged secondary radiation from fast neutrons, the first collision dose in irradiated material is practically the same as the absorbed dose.
gamma rays Electromagnetic radiation (photons) originating in atomic nuclei and accompanying many nuclear reactions (e.g., fission, radioactive decay, and neutron capture). Gamma rays are physically identical to X-rays of high energy; the only essential difference is that X-rays do not originate in the nucleus.
gamma ray interactions Interaction of gamma rays with matter occurs through three primary processes as follows:
• Photoelectric absorption The process whereby a gamma ray (or X-ray) photon, with energy somewhat greater than that of the binding energy of an electron in an atom, transfers all its energy to the electron, which is consequently removed from the atom.
• Compton scattering An attenuation process observed for X-ray or gamma radiation in which an incident photon interacts with an orbital electron of an atom to produce a recoil electron and a scattered photon of energy less that the incident photon.

Effective Date: 09/21/2004 Revision No. 00 Document No. ORAUT-TKBS-0008-6 Page 52 of 55
• Pair production An absorption process for X-ray and gamma radiation in which the incident photon is annihilated in the vicinity of the nucleus of the absorbing atom, with subsequent production of an electron and positron pair. This reaction occurs only for incident photon energies that exceed 1.02 megavolts-electron.
gray The International System unit of absorbed dose (1 gray = 100 rad).
intermediate energy neutron Neutron of energy between 0.5 electron volt (assumed to be 0.4 electron volt because of cadmium cutoff in neutron response) and 10 kilovolts-electron.
ionizing radiation Electromagnetic radiation (consisting of photons) or particulate radiation (consisting of electrons, neutrons, protons, etc.) capable of producing charged particles through interactions with matter.
isotopes Forms of the same element having identical chemical properties but different atomic masses. Isotopes of a given element all have the same number or protons in the nucleus but different numbers of neutrons. Some isotopes of an element may be radioactive.
kilovolt-electron (keV) An amount of energy equal to 1,000 electron volts.
nuclear track emulsion, type A (NTA) A film that is sensitive to fast neutrons. The developed image has tracks caused by neutrons that can be seen by using oil immersion and 1000-power microscope.
luminescence The emission of light from a material as a result of some excitation.
Manhattan Engineering District Agency designated to develop nuclear weapons; a predecessor to the U.S. Department of Energy.
minimum detection level (MDL) Often confused because statistical parameters necessary to its calculation are not explicitly defined. Nonetheless, the MDL is often assumed to be the level at which a dose is detected at the 2-sigma level (i.e., 95% of the time). The MDL should not be confused with the minimum recordable dose.
megavolt-electron (MeV) An amount of energy equal to 1 million electron volts.
multiple-collision neutron dose Dose to flux through tissue based on the assumption that two or more interactions per neutron occur resulting in greater energy deposition.
Effective Date: 09/21/2004 Revision No. 00 Document No. ORAUT-TKBS-0008-6 Page 53 of 55
nuclear emulsion Generally refers to nuclear track emulsion, type A film.
neutron A basic particle that is electrically neutral weighing nearly the same as the hydrogen atom.
neutron, fast Neutrons with energy equal or greater than 10 kilovolts-electron.
neutron, intermediate Neutrons with energy between 0.4 electron volt and 10 kilovolts-electron.
neutron, thermal Strictly, neutrons in thermal equilibrium with surroundings. Generally, neutrons with energy less than the cadmium cutoff at about 0.4 electron volt.
neutron film dosimeter A film dosimeter that contains an nuclear track emulsion, type A film packet.
nonpenetrating dose (NP or NPen) Designation on film dosimeter reports that implies a radiation dose, typically to the skin of whole body, from beta and lower energy photon radiation.
open window (OW) Designation on Hanford film dosimeter reports that implies the use of little shielding (only that of the security credential). It commonly is used to label the film response corresponding to the OW area.
optical density The quantitative measurement of the density of photographic blackening defined as D = Log10(Io/I).
pencil dosimeters A type of ionization chamber used by personnel to measure radiation dose. These results may be labeled as Pen dose. Other names: pencil, pocket dosimeter, pocket pencil, pocket ionization chamber, PIC.
penetrating dose (P or Pen) Designation on film dosimeter reports that implies a radiation dose, typically to the whole body, from higher energy photon radiation.
personal dose equivalent, Hp(d) Radiation quantity recommended for use as the operational quantity to be recorded for radiological protection purposes by the International Commission on Radiological Units and Measurements. Represented by Hp(d), where d identifies the depth (in millimeters) and represents the point of reference for dose in tissue. For weakly penetrating radiation of significance to skin dose, d = 0.07 millimeter and is noted as Hp(0.07). For penetrating radiation of significance to whole-body dose, d = 10 millimeters and is noted as Hp(10).
photon A unit or particle of electromagnetic radiation consisting of X- and/or gamma rays.

Effective Date: 09/21/2004 Revision No. 00 Document No. ORAUT-TKBS-0008-6 Page 54 of 55
quality factor (Q) A modifying factor used to derive dose equivalent from absorbed dose.
rad A unit of absorbed dose equal to the absorption of 100 ergs per gram of absorbing material, such as body tissue.
radiation One or more of beta, neutron, and photon radiation.
radiation monitoring Routine measurements and the estimation of the dose equivalent for the purpose of determining and controlling the dose received by workers.
radioactivity The spontaneous emission of radiation, generally alpha or beta particles, gamma rays, and neutrons from unstable nuclei
random errors When a given measurement is repeated the resultant values, in general, do not agree exactly. The causes of the disagreement between the individual values must also be causes of their differing from the actual value. Errors resulting from these causes are called random errors.
relative biological effectiveness (RBE) A ratio of the absorbed dose of a reference radiation to the absorbed dose of a test radiation producing the same biological effects, other conditions being equal.
rem The rem is a unit of dose equivalent, which is equal to the product of the number of rads absorbed and the quality factor. The word derives from roentgen equivalent in man.
rep Historically the rep has been used extensively for the specification of permissible doses of ionizing radiations other than X-rays or gamma rays. Several definitions have appeared in the literature but in the sense most widely adopted, it is a unit of absorbed dose with a magnitude of 93 ergs per gram. The word derives from roentgen-equivalent-physical.
roentgen A unit of exposure to gamma (or X-ray) radiation. It is defined precisely as the quantity of gamma (or X-) rays that will produce a total charge of 2.58 x 10⁻⁴ coulomb in 1 kilogram of dry air. An exposure of 1 roentgen is approximately equivalent to an absorbed dose of 1 rad in soft tissue.
scattering The diversion of radiation from its original path as a result of interactions with atoms between the source of the radiations and a point at some distance away. Scattered radiations are typically changed in direction and of lower energy than the original radiation.
shallow absorbed dose (Ds) The absorbed dose at a depth of 0.07 millimeter in a material of specified geometry and composition.

Effective Date: 09/21/2004 Revision No. 00 Document No. ORAUT-TKBS-0008-6 Page 55 of 55
shallow dose equivalent (Hs) Dose equivalent at a depth of 0.07 millimeter in tissue.
shielding Any material or obstruction that absorbs (or attenuates) radiation and thus tends to protect personnel or materials from radiation.
sievert The International system unit for dose equivalent. (1 sievert = 100 rem.)
skin dose Absorbed dose at a tissue depth of 7 milligrams per square centimeter.
thermal neutron Strictly, neutrons in thermal equilibrium with surroundings. Generally, refers to neutrons of energy less-than the cadmium cutoff of about 0.4 electron volt.
tissue equivalent Used to imply that radiation response characteristics of the material being irradiated are equivalent to tissue. Achieving a tissue-equivalent response is an important consideration in the design and fabrication of radiation measuring instruments and dosimeters.
thermoluminescent Property of a material that causes it to emit light as a result of being excited by heat.
thermoluminescent dosimeter (TLD) A holder containing solid chips of material that when heated will release the stored energy as light. The measurement of this light provides a measurement of absorbed dose. The solid chips are sometimes called crystals.
thermoluminescent dosimeter chip A small block or crystal made of LiF used in the TLD. TLD-600 - A TLD chip made from 6Li (>95%) used to detect neutrons. TLD-700 - A TLD chip made from 7Li (>99.9%) used to detect photon and beta radiation.
whole-body dose Absorbed dose at a tissue depth of 1.0 centimeter (1,000 milligrams per square centimeter); however, also used to refer to the dose recorded.
X-ray Ionizing electromagnetic radiation of extranuclear origin.