
Orange County Care Transitions Collaborative - hsag.com · Road Map to Action. ... –Lack of...
28
Orange County Care Transitions Collaborative Health Services Advisory Group July 11, 2018 –1– Orange County Care Transitions Collaborative Ettie Lande, BSN, MS, ACM-RN Health Services Advisory Group (HSAG) July 11, 2018 Thank You! For hosting today’s meeting Saddleback Memorial Medical Center 2
Transcript of Orange County Care Transitions Collaborative - hsag.com · Road Map to Action. ... –Lack of...
Orange County Care Transitions Collaborative
Health Services Advisory GroupJuly 11, 2018
–1–
Orange County Care Transitions Collaborative
Ettie Lande, BSN, MS, ACM-RNHealth Services Advisory Group (HSAG)
July 11, 2018
Thank You!
For hosting today’s meetingSaddleback Memorial Medical Center
2
Orange County Care Transitions Collaborative
Health Services Advisory GroupJuly 11, 2018
–2–
Thank You!
For sponsoring today’s breakfast24Hr Home Care and Blake Naudin
3
If you can sponsor breakfast at a future
meeting, contact [email protected]
or 818.265.4660
Community Introductions—Who Is At Your Table?
4
Orange County Care Transitions Collaborative
Health Services Advisory GroupJuly 11, 2018
–3–
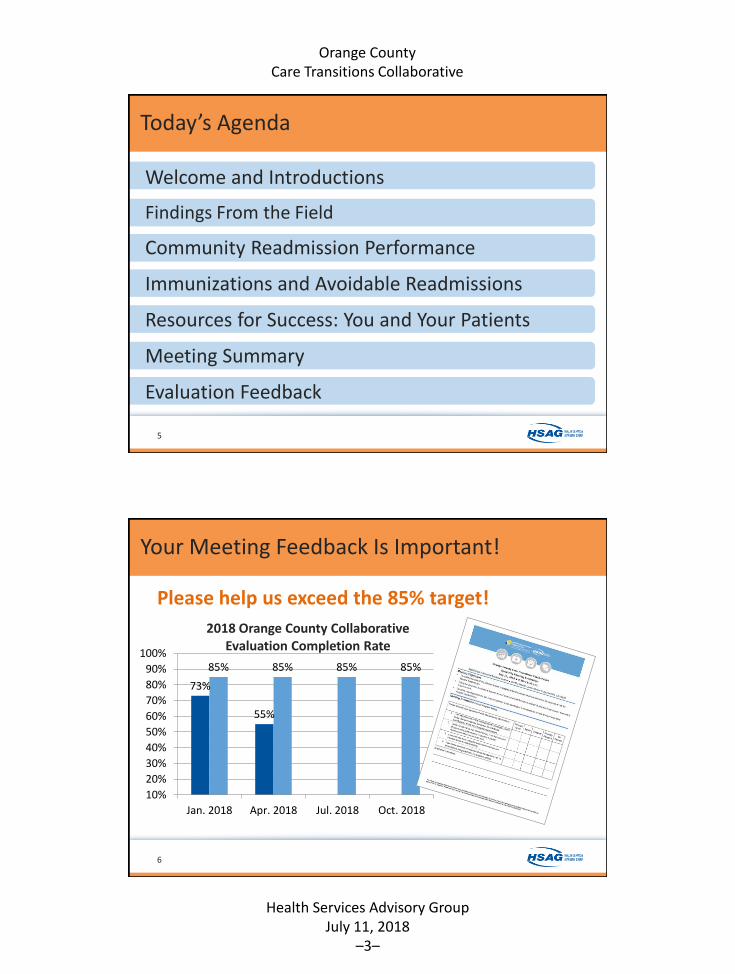
Today’s Agenda
Welcome and Introductions
Findings From the Field
Community Readmission Performance
Immunizations and Avoidable Readmissions
Resources for Success: You and Your Patients
Meeting Summary
Evaluation Feedback
5
Your Meeting Feedback Is Important!
Please help us exceed the 85% target!
6
73%
55%
85% 85% 85% 85%
10%
20%
30%
40%
50%
60%
70%
80%
90%
100%
Jan. 2018 Apr. 2018 Jul. 2018 Oct. 2018
2018 Orange County CollaborativeEvaluation Completion Rate
Orange County Care Transitions Collaborative
Health Services Advisory GroupJuly 11, 2018
–4–
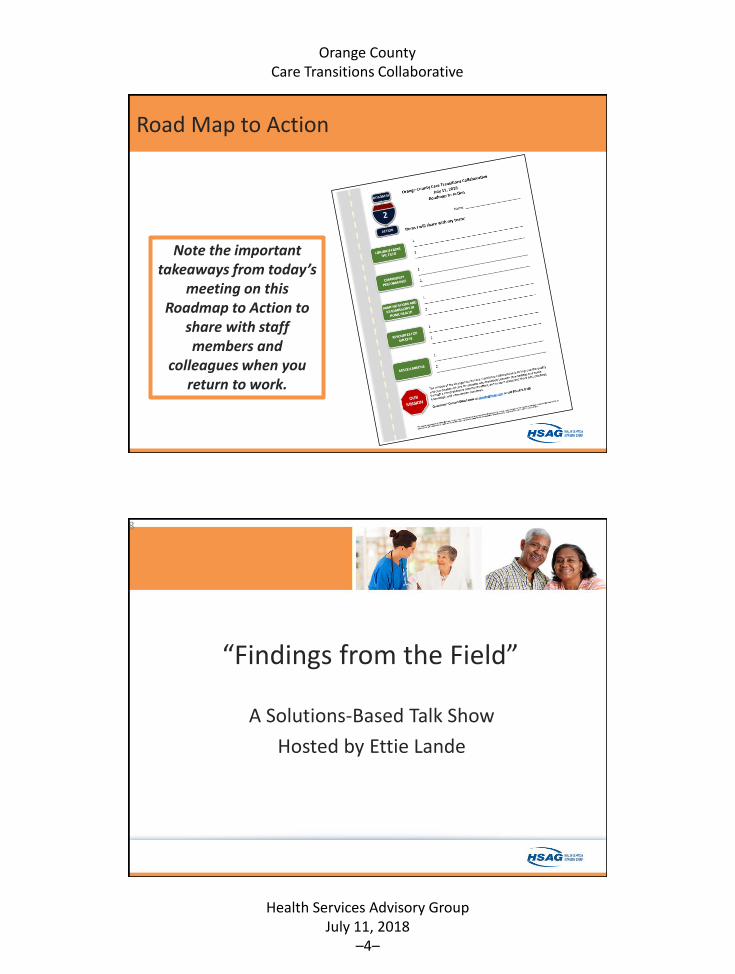
Road Map to Action
Note the important takeaways from today’s
meeting on this Roadmap to Action to
share with staff members and
colleagues when you return to work.
“Findings from the Field”
A Solutions-Based Talk Show
Hosted by Ettie Lande
8
Orange County Care Transitions Collaborative
Health Services Advisory GroupJuly 11, 2018
–5–
How Can We Fix These Transition Gaps?
9
Guests on Today’s Show
10
• Laura GarciaFountain Valley Regional Hospital
• Lisa ForsytheMemorial Care Saddleback Medical Center
• Claudia SkinnerSt. Jude Medical Center
• Sally GasparSt. Joseph Health
• John MastrocolaGenerations Healthcare, Southern Region
Orange County Care Transitions Collaborative
Health Services Advisory GroupJuly 11, 2018
–6–
What We Will Learn From Each Guest Today
1. What gap opportunity related to caretransitions was identified by yourorganization?
2. What was the biggest challenge youexperienced in moving the strategy along toits next steps?
3. What advice would you give to someonetrying to implement this strategy in theirown organization?
11
Network and Break: 15 Minutes
12
http://www.online-stopwatch.com/eggtimer-countdown/full-screen
Orange County Care Transitions Collaborative
Health Services Advisory GroupJuly 11, 2018
–7–
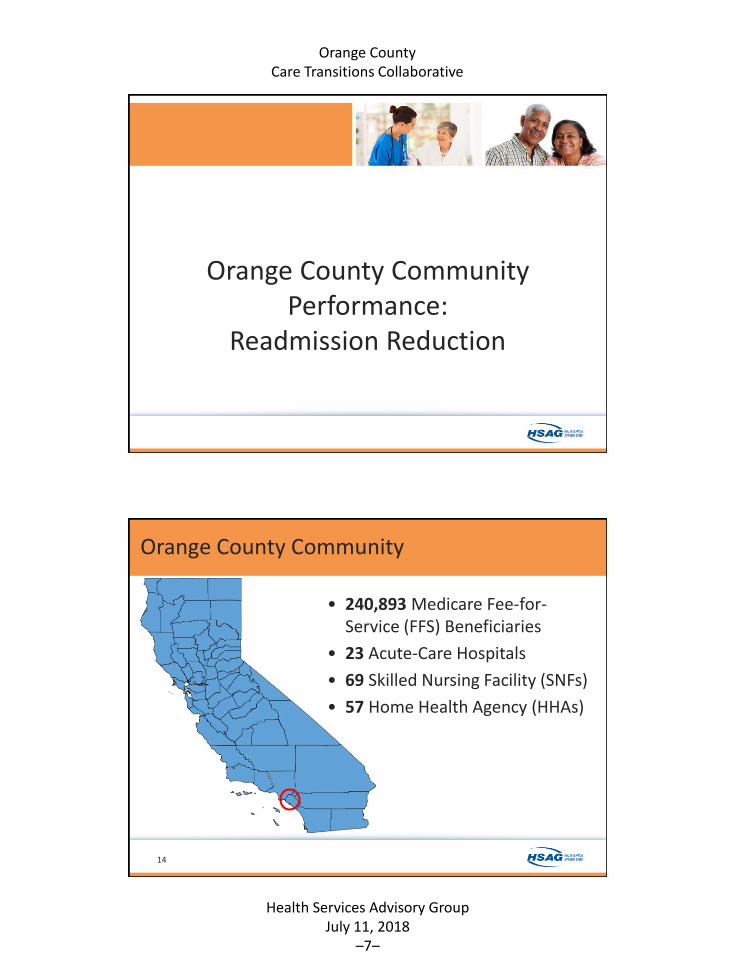
Orange County Community Performance:
Readmission Reduction
Orange County Community
• 240,893 Medicare Fee-for-Service (FFS) Beneficiaries
• 23 Acute-Care Hospitals
• 69 Skilled Nursing Facility (SNFs)
• 57 Home Health Agency (HHAs)
14
Orange County Care Transitions Collaborative
Health Services Advisory GroupJuly 11, 2018
–8–
Orange County Community
15
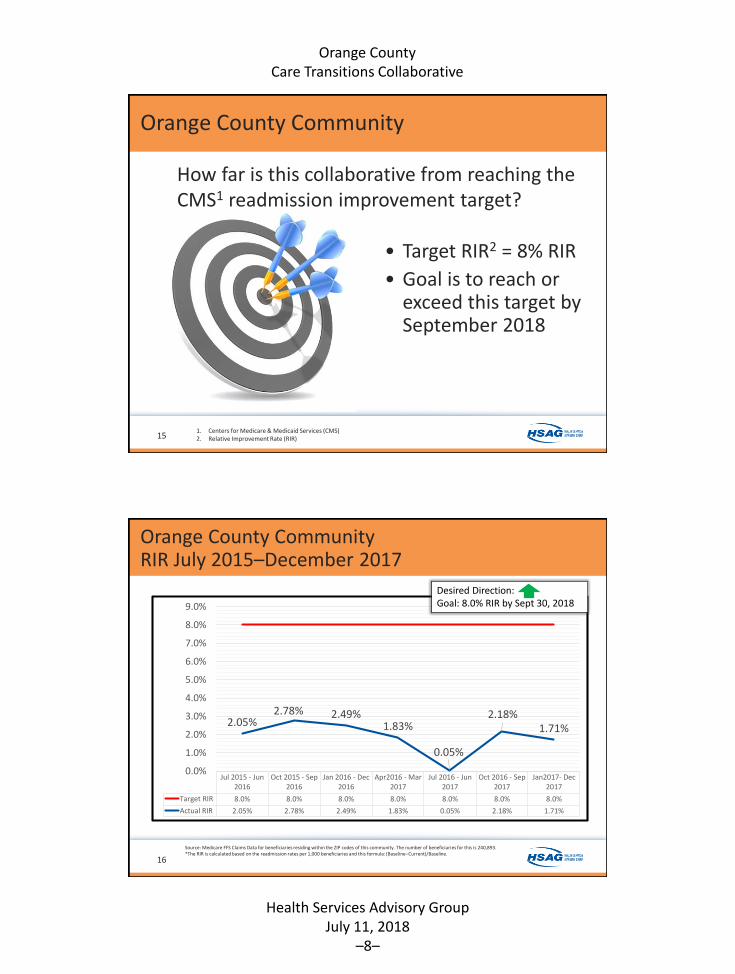
How far is this collaborative from reaching the CMS1 readmission improvement target?
• Target RIR2 = 8% RIR
• Goal is to reach orexceed this target bySeptember 2018
1. Centers for Medicare & Medicaid Services (CMS)2. Relative Improvement Rate (RIR)
Orange County CommunityRIR July 2015–December 2017
Jul 2015 - Jun2016
Oct 2015 - Sep2016
Jan 2016 - Dec2016
Apr2016 - Mar2017
Jul 2016 - Jun2017
Oct 2016 - Sep2017
Jan2017- Dec2017
Target RIR 8.0% 8.0% 8.0% 8.0% 8.0% 8.0% 8.0%
Actual RIR 2.05% 2.78% 2.49% 1.83% 0.05% 2.18% 1.71%
2.05%2.78% 2.49%
1.83%
0.05%
2.18%1.71%
0.0%
1.0%
2.0%
3.0%
4.0%
5.0%
6.0%
7.0%
8.0%
9.0%
16
Desired Direction:Goal: 8.0% RIR by Sept 30, 2018
Source: Medicare FFS Claims Data for beneficiaries residing within the ZIP codes of this community. The number of beneficiaries for this is 240,893.*The RIR is calculated based on the readmission rates per 1,000 beneficiaries and this formula: (Baseline–Current)/Baseline.
Orange County Care Transitions Collaborative
Health Services Advisory GroupJuly 11, 2018
–9–
90-Day Sprint to the Finish!
17
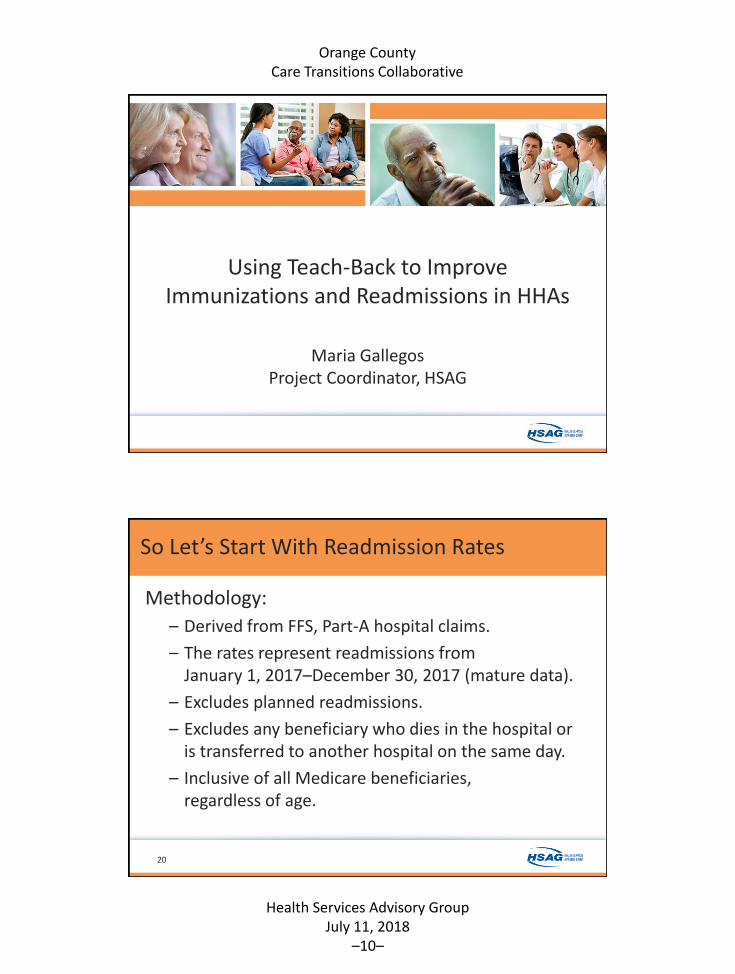
Turn in Your Meeting Evaluation and Receive a Copy of Your Community’s Report
18
Data Source for this Report:
Medicare FFSClaims Data for
beneficiaries residing within the ZIP codes of this community
Orange County Care Transitions Collaborative
Health Services Advisory GroupJuly 11, 2018
–10–
Using Teach-Back to Improve Immunizations and Readmissions in HHAs
Maria Gallegos Project Coordinator, HSAG
So Let’s Start With Readmission Rates
Methodology:
– Derived from FFS, Part-A hospital claims.
– The rates represent readmissions from January 1, 2017–December 30, 2017 (mature data).
– Excludes planned readmissions.
– Excludes any beneficiary who dies in the hospital or is transferred to another hospital on the same day.
– Inclusive of all Medicare beneficiaries, regardless of age.
20
Orange County Care Transitions Collaborative
Health Services Advisory GroupJuly 11, 2018
–11–
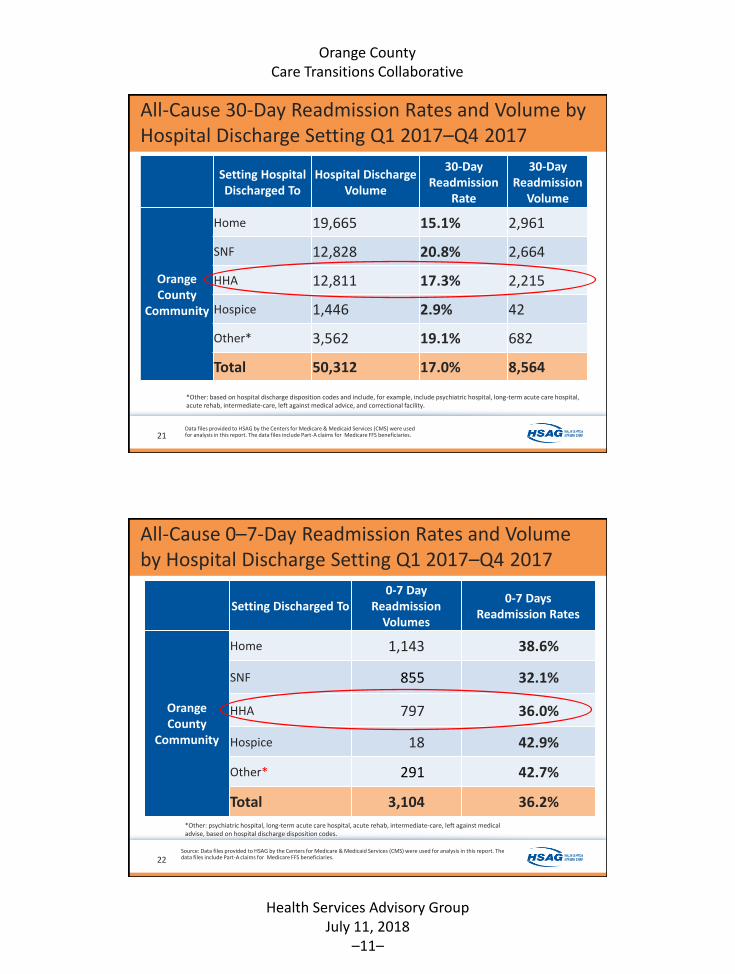
All-Cause 30-Day Readmission Rates and Volume by Hospital Discharge Setting Q1 2017–Q4 2017
Setting Hospital Discharged To
Hospital Discharge Volume
30-DayReadmission
Rate
30-DayReadmission
Volume
Orange County
Community
Home 19,665 15.1% 2,961
SNF 12,828 20.8% 2,664
HHA 12,811 17.3% 2,215
Hospice 1,446 2.9% 42
Other* 3,562 19.1% 682
Total 50,312 17.0% 8,564
*Other: based on hospital discharge disposition codes and include, for example, include psychiatric hospital, long-term acute care hospital, acute rehab, intermediate-care, left against medical advice, and correctional facility.
Data files provided to HSAG by the Centers for Medicare & Medicaid Services (CMS) were used for analysis in this report. The data files include Part-A claims for Medicare FFS beneficiaries. 21
All-Cause 0–7-Day Readmission Rates and Volume by Hospital Discharge Setting Q1 2017–Q4 2017
Setting Discharged To0-7 Day
Readmission Volumes
0-7 DaysReadmission Rates
Orange County
Community
Home 1,143 38.6%
SNF 855 32.1%
HHA 797 36.0%
Hospice 18 42.9%
Other* 291 42.7%
Total 3,104 36.2%
*Other: psychiatric hospital, long-term acute care hospital, acute rehab, intermediate-care, left against medical advise, based on hospital discharge disposition codes.
Source: Data files provided to HSAG by the Centers for Medicare & Medicaid Services (CMS) were used for analysis in this report. The data files include Part-A claims for Medicare FFS beneficiaries. 22
Orange County Care Transitions Collaborative
Health Services Advisory GroupJuly 11, 2018
–12–
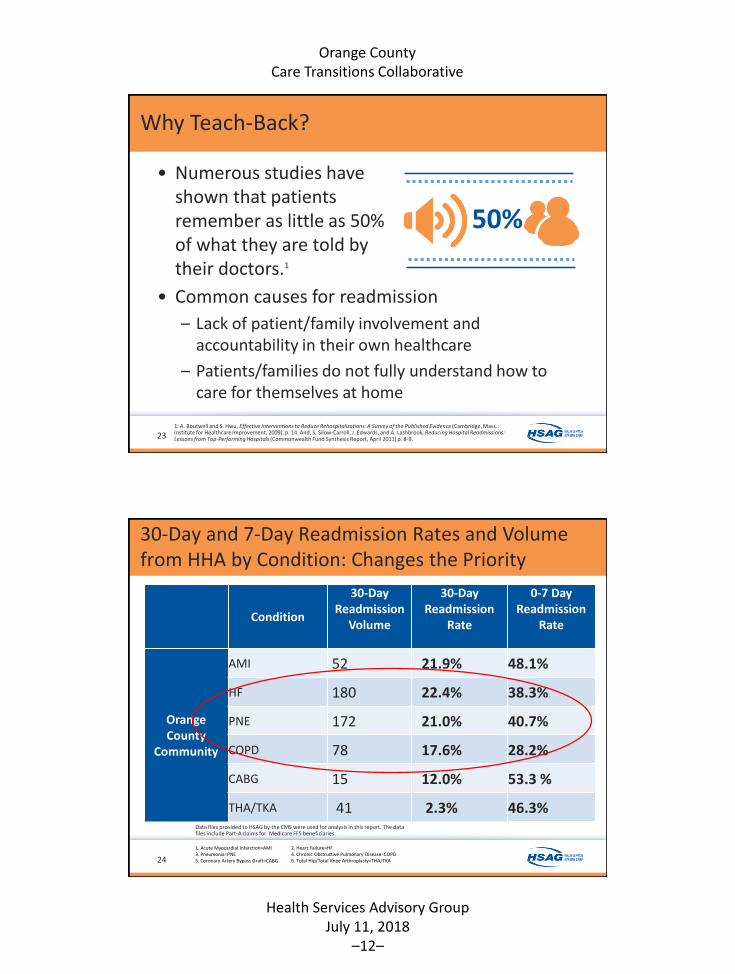
Why Teach-Back?
• Numerous studies haveshown that patientsremember as little as 50%of what they are told bytheir doctors.1
• Common causes for readmission
– Lack of patient/family involvement andaccountability in their own healthcare
– Patients/families do not fully understand how tocare for themselves at home
231. A. Boutwell and S. Hwu, Effective Interventions to Reduce Rehospitalizations: A Survey of the Published Evidence (Cambridge, Mass.: Institute for Healthcare Improvement, 2009), p. 14. And, S, Silow-Carroll, J. Edwards, and A. Lashbrook, Reducing Hospital Readmissions: Lessons from Top-Performing Hospitals (Commonwealth Fund Synthesis Report, April 2011) p. 8-9.
50%
30-Day and 7-Day Readmission Rates and Volume from HHA by Condition: Changes the Priority
Condition
30-DayReadmission
Volume
30-DayReadmission
Rate
0-7 DayReadmission
Rate
Orange County
Community
AMI 52 21.9% 48.1%
HF 180 22.4% 38.3%
PNE 172 21.0% 40.7%
COPD 78 17.6% 28.2%
CABG 15 12.0% 53.3 %
THA/TKA 41 2.3% 46.3%Data files provided to HSAG by the CMS were used for analysis in this report. The data files include Part-A claims for Medicare FFS beneficiaries.
24
1. Acute Myocardial Infarction=AMI 2. Heart Failure=HF3. Pneumonia=PNE 4. Chronic Obstructive Pulmonary Disease=COPD5. Coronary Artery Bypass Graft=CABG 6. Total Hip/Total Knee Arthroplasty=THA/TKA
Orange County Care Transitions Collaborative
Health Services Advisory GroupJuly 11, 2018
–13–
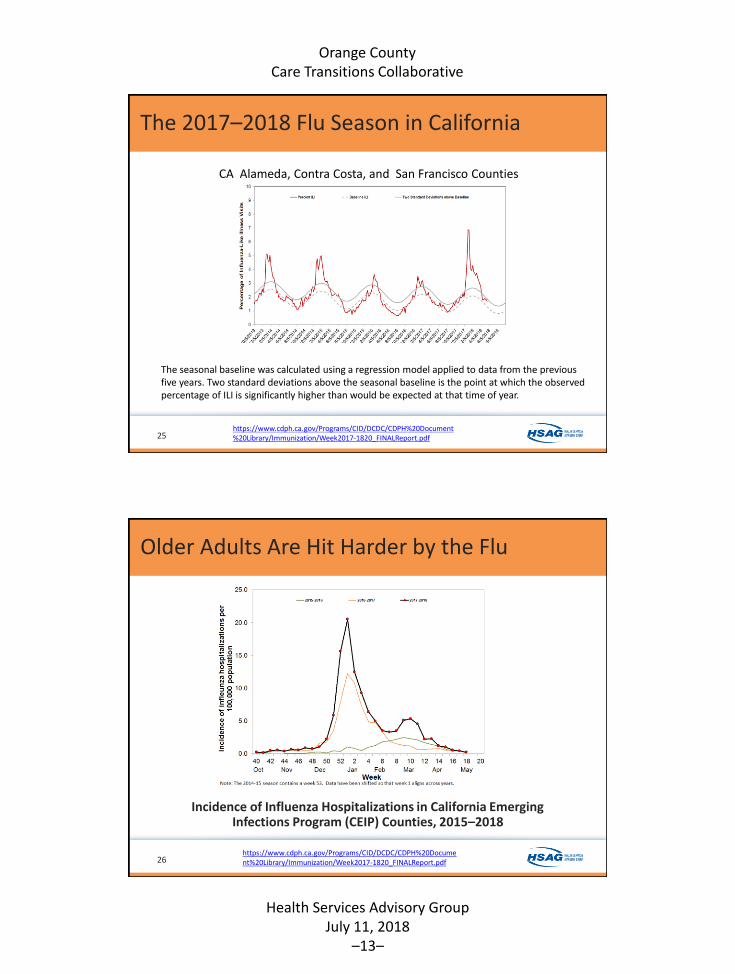
The 2017–2018 Flu Season in California
CA Alameda, Contra Costa, and San Francisco Counties
The seasonal baseline was calculated using a regression model applied to data from the previous five years. Two standard deviations above the seasonal baseline is the point at which the observed percentage of ILI is significantly higher than would be expected at that time of year.
25https://www.cdph.ca.gov/Programs/CID/DCDC/CDPH%20Document%20Library/Immunization/Week2017-1820_FINALReport.pdf
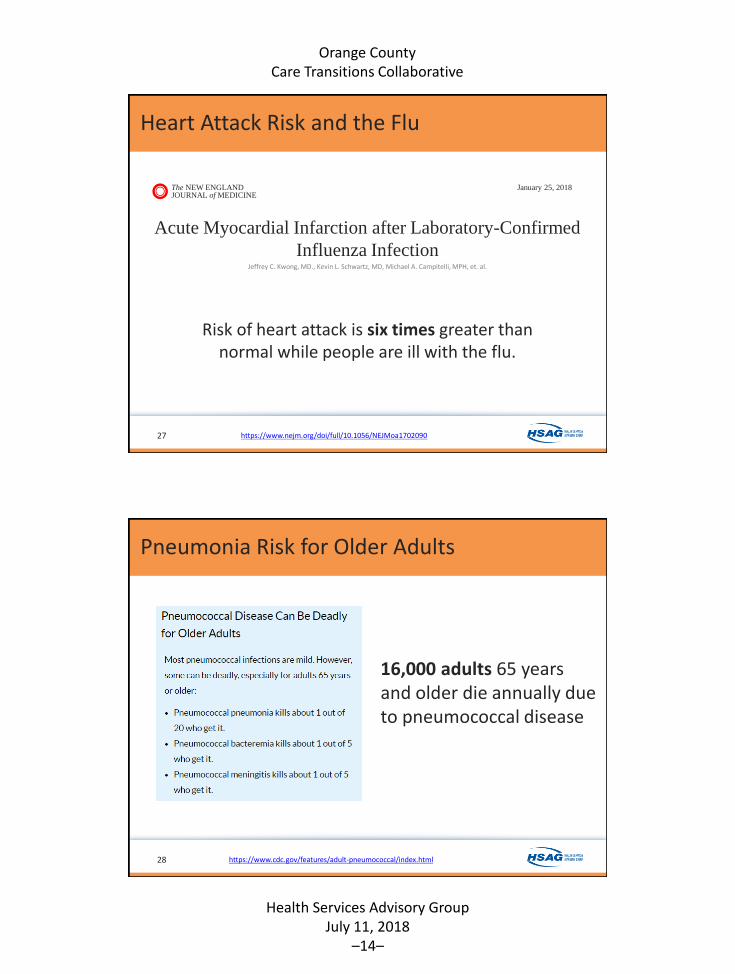
Older Adults Are Hit Harder by the Flu
Incidence of Influenza Hospitalizations in California Emerging Infections Program (CEIP) Counties, 2015–2018
https://www.cdph.ca.gov/Programs/CID/DCDC/CDPH%20Document%20Library/Immunization/Week2017-1820_FINALReport.pdf26
Orange County Care Transitions Collaborative
Health Services Advisory GroupJuly 11, 2018
–14–
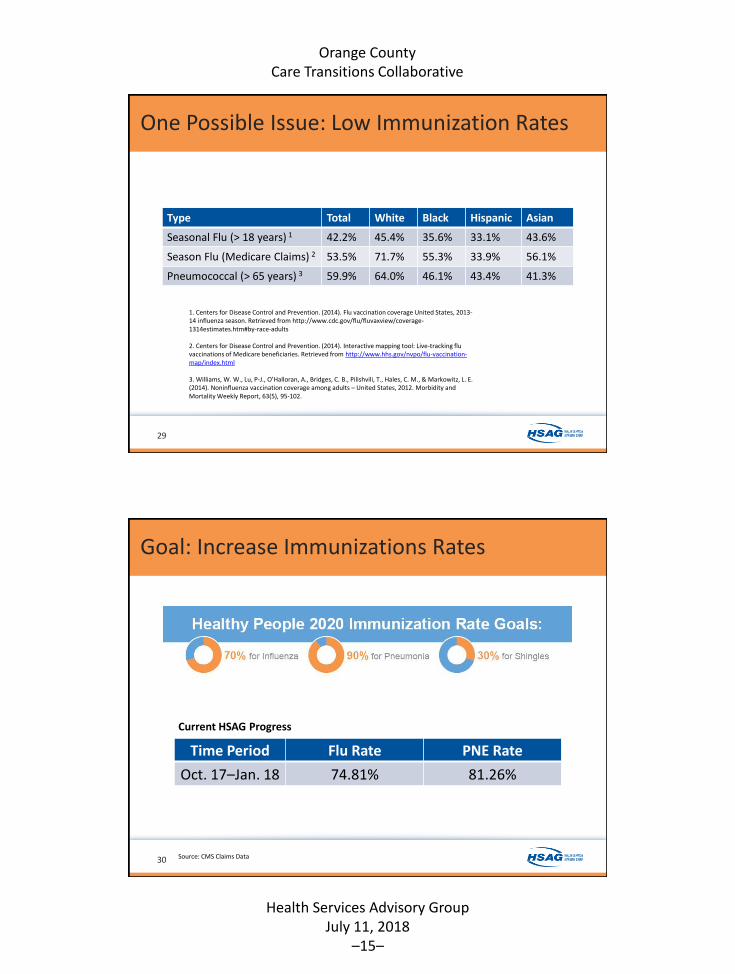
Heart Attack Risk and the Flu
The NEW ENGLAND January 25, 2018JOURNAL of MEDICINE
Acute Myocardial Infarction after Laboratory-Confirmed
Influenza InfectionJeffrey C. Kwong, MD., Kevin L. Schwartz, MD, Michael A. Campitelli, MPH, et. al.
27
Risk of heart attack is six times greater than normal while people are ill with the flu.
https://www.nejm.org/doi/full/10.1056/NEJMoa1702090
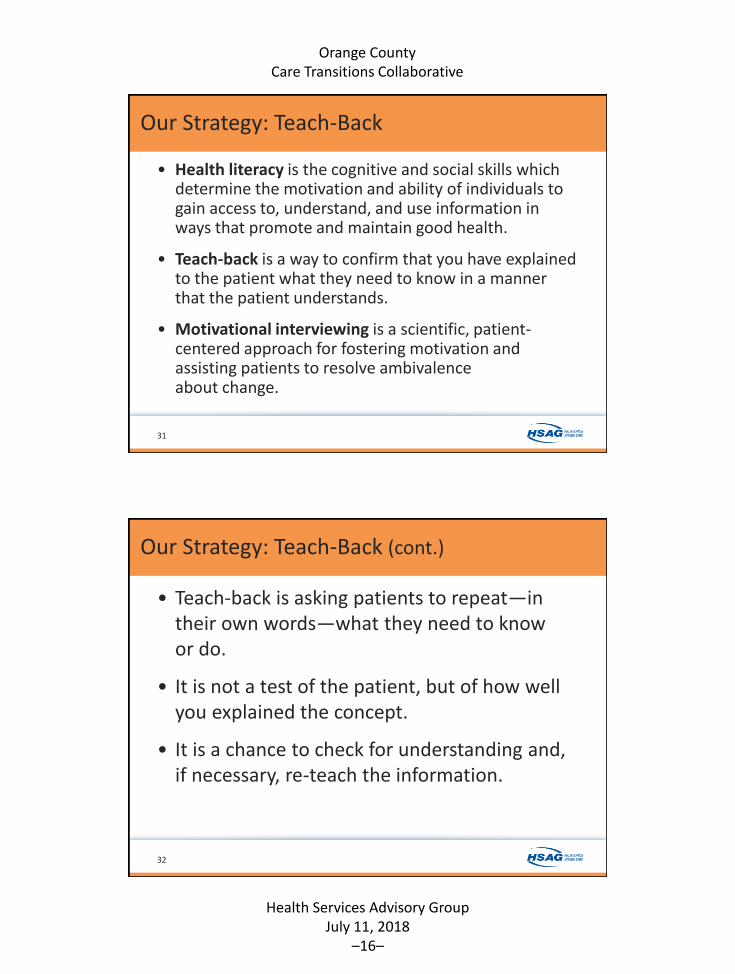
Pneumonia Risk for Older Adults
16,000 adults 65 years and older die annually due to pneumococcal disease
https://www.cdc.gov/features/adult-pneumococcal/index.html28
Orange County Care Transitions Collaborative
Health Services Advisory GroupJuly 11, 2018
–15–
One Possible Issue: Low Immunization Rates
Type Total White Black Hispanic Asian
Seasonal Flu (> 18 years) 1 42.2% 45.4% 35.6% 33.1% 43.6%
Season Flu (Medicare Claims) 2 53.5% 71.7% 55.3% 33.9% 56.1%
Pneumococcal (> 65 years) 3 59.9% 64.0% 46.1% 43.4% 41.3%
1. Centers for Disease Control and Prevention. (2014). Flu vaccination coverage United States, 2013-14 influenza season. Retrieved from http://www.cdc.gov/flu/fluvaxview/coverage-1314estimates.htm#by-race-adults
2. Centers for Disease Control and Prevention. (2014). Interactive mapping tool: Live-tracking flu vaccinations of Medicare beneficiaries. Retrieved from http://www.hhs.gov/nvpo/flu-vaccination-map/index.html
3. Williams, W. W., Lu, P-J., O’Halloran, A., Bridges, C. B., Pilishvili, T., Hales, C. M., & Markowitz, L. E. (2014). Noninfluenza vaccination coverage among adults – United States, 2012. Morbidity and Mortality Weekly Report, 63(5), 95-102.
29
Goal: Increase Immunizations Rates
Current HSAG Progress
Time Period Flu Rate PNE Rate
Oct. 17–Jan. 18 74.81% 81.26%
Source: CMS Claims Data30
Orange County Care Transitions Collaborative
Health Services Advisory GroupJuly 11, 2018
–16–
Our Strategy: Teach-Back
• Health literacy is the cognitive and social skills whichdetermine the motivation and ability of individuals togain access to, understand, and use information inways that promote and maintain good health.
• Teach-back is a way to confirm that you have explainedto the patient what they need to know in a mannerthat the patient understands.
• Motivational interviewing is a scientific, patient-centered approach for fostering motivation andassisting patients to resolve ambivalenceabout change.
31
Our Strategy: Teach-Back (cont.)
• Teach-back is asking patients to repeat—intheir own words—what they need to knowor do.
• It is not a test of the patient, but of how wellyou explained the concept.
• It is a chance to check for understanding and,if necessary, re-teach the information.
32
Orange County Care Transitions Collaborative
Health Services Advisory GroupJuly 11, 2018
–17–
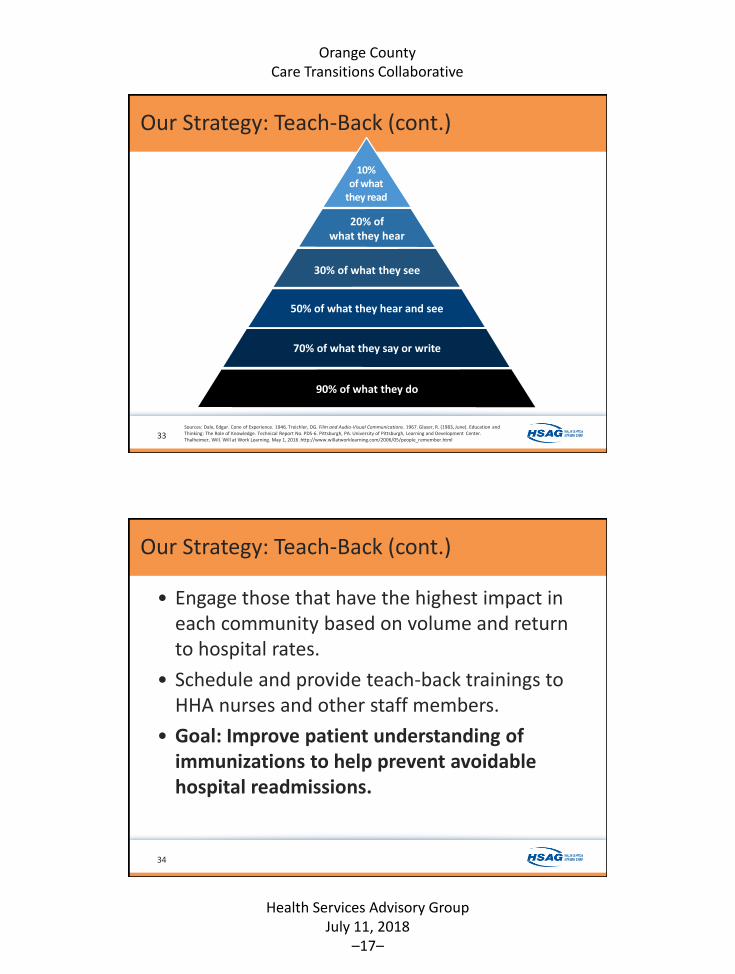
Our Strategy: Teach-Back (cont.)
33
10% of what
they read
20% of what they hear
30% of what they see
50% of what they hear and see
70% of what they say or write
90% of what they do
Sources: Dale, Edgar. Cone of Experience. 1946. Treichler, DG. Film and Audio-Visual Communications. 1967. Glaser, R. (1983, June). Education and Thinking: The Role of Knowledge. Technical Report No. PDS-6. Pittsburgh, PA: University of Pittsburgh, Learning and Development Center. Thalheimer, Will. Will at Work Learning. May 1, 2016 .http://www.willatworklearning.com/2006/05/people_remember.html
Our Strategy: Teach-Back (cont.)
• Engage those that have the highest impact in each community based on volume and return to hospital rates.
• Schedule and provide teach-back trainings to HHA nurses and other staff members.
• Goal: Improve patient understanding of immunizations to help prevent avoidable hospital readmissions.
34
Orange County Care Transitions Collaborative
Health Services Advisory GroupJuly 11, 2018
–18–
Thank you!
Maria Gallegos
Resources for Success: HSAG Website and YouTube Channel
Ettie Lande
Orange County Care Transitions Collaborative
Health Services Advisory GroupJuly 11, 2018
–19–
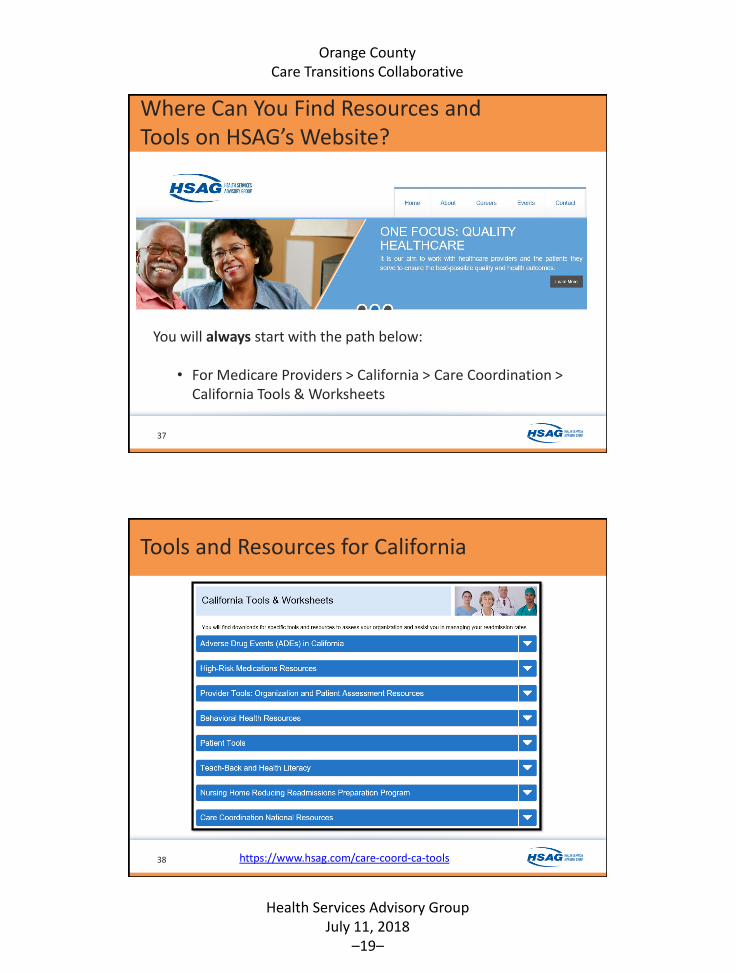
Where Can You Find Resources and Tools on HSAG’s Website?
37
You will always start with the path below:
• For Medicare Providers > California > Care Coordination > California Tools & Worksheets
Tools and Resources for California
38 https://www.hsag.com/care-coord-ca-tools
Orange County Care Transitions Collaborative
Health Services Advisory GroupJuly 11, 2018
–20–
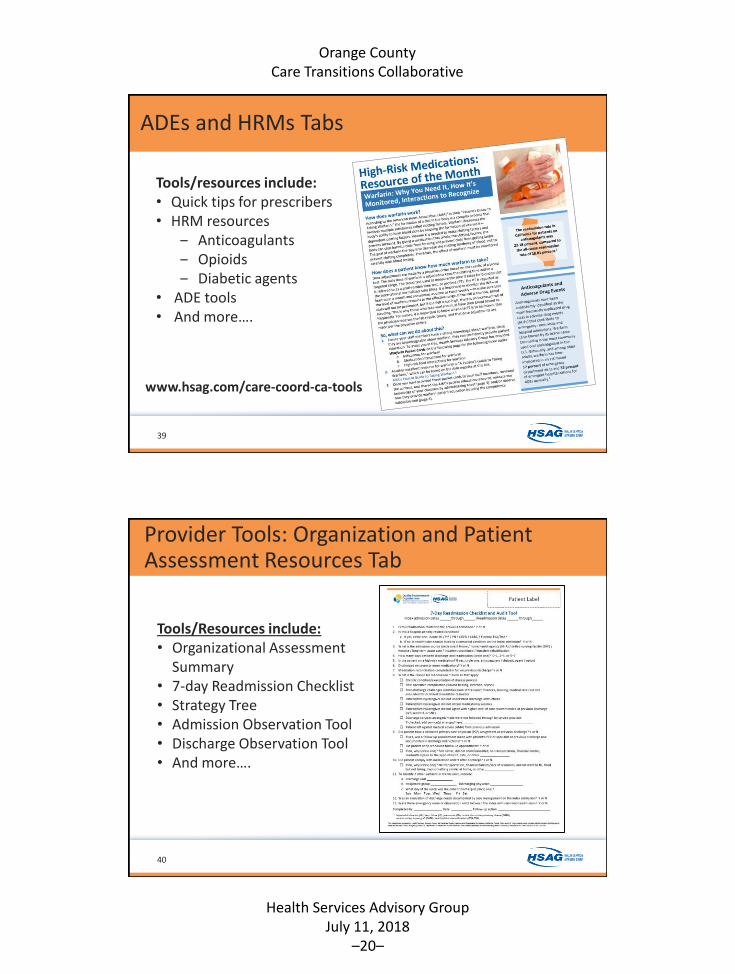
ADEs and HRMs Tabs
39
Tools/resources include: • Quick tips for prescribers• HRM resources
‒ Anticoagulants ‒ Opioids‒ Diabetic agents
• ADE tools• And more….
www.hsag.com/care-coord-ca-tools
Provider Tools: Organization and Patient Assessment Resources Tab
40
Tools/Resources include: • Organizational Assessment
Summary • 7-day Readmission Checklist• Strategy Tree • Admission Observation Tool• Discharge Observation Tool• And more….
Orange County Care Transitions Collaborative
Health Services Advisory GroupJuly 11, 2018
–21–
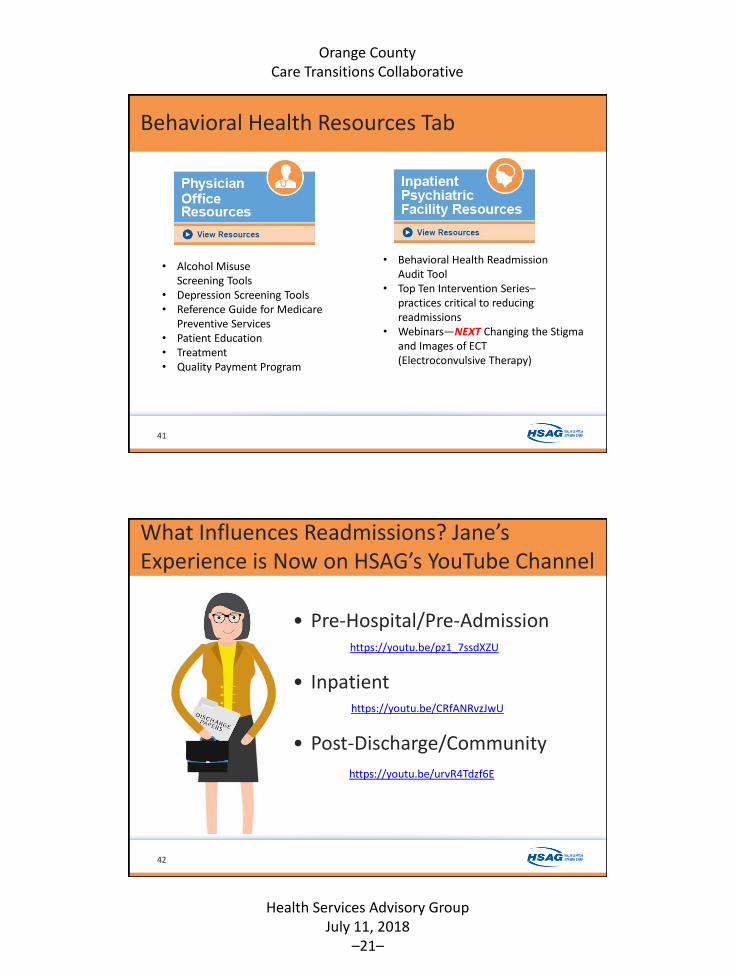
Behavioral Health Resources Tab
41
• Alcohol Misuse Screening Tools
• Depression Screening Tools• Reference Guide for Medicare
Preventive Services• Patient Education • Treatment• Quality Payment Program
• Behavioral Health Readmission Audit Tool
• Top Ten Intervention Series–practices critical to reducing readmissions
• Webinars—NEXT Changing the Stigma and Images of ECT (Electroconvulsive Therapy)
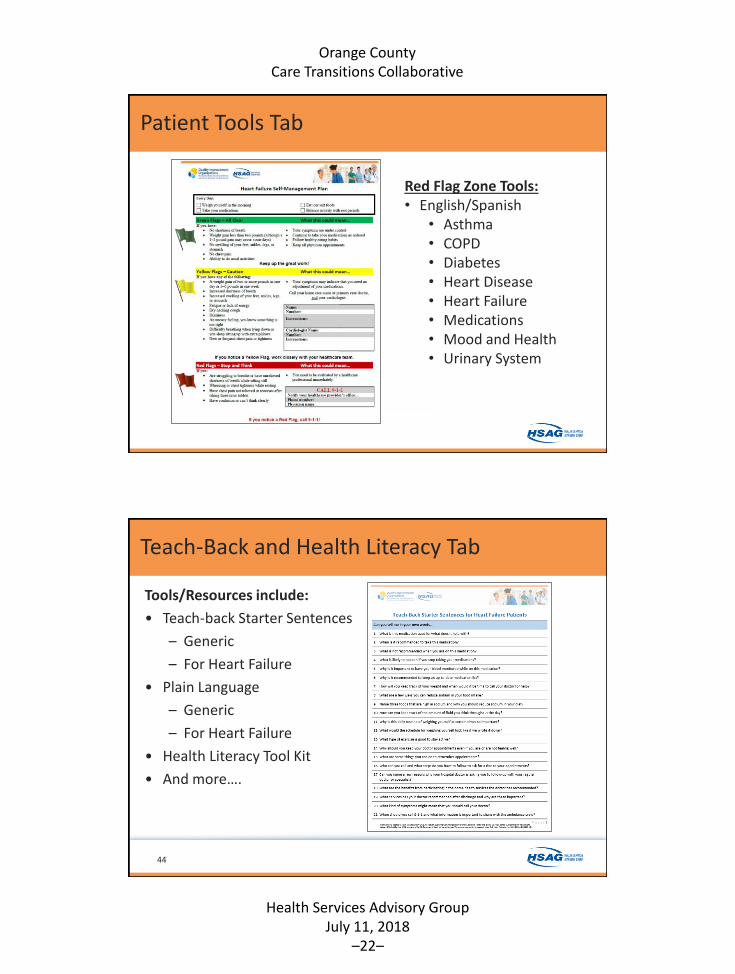
What Influences Readmissions? Jane’s Experience is Now on HSAG’s YouTube Channel
42
• Pre-Hospital/Pre-Admissionhttps://youtu.be/pz1_7ssdXZU
• Inpatient
• Post-Discharge/Community
https://youtu.be/CRfANRvzJwU
https://youtu.be/urvR4Tdzf6E
Orange County Care Transitions Collaborative
Health Services Advisory GroupJuly 11, 2018
–22–
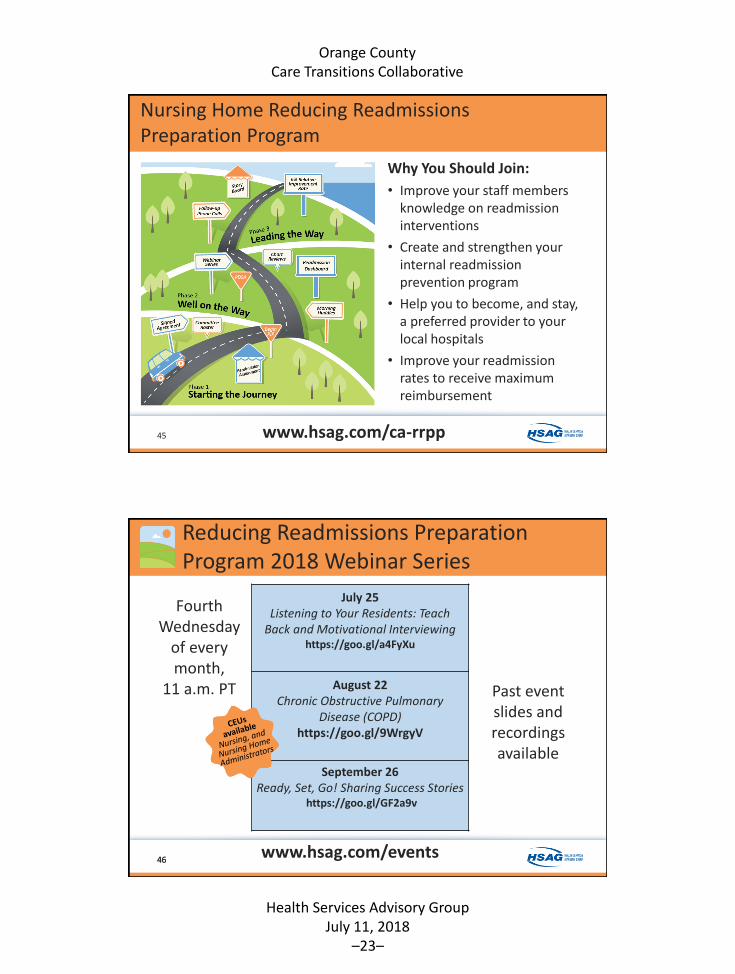
Patient Tools Tab
Red Flag Zone Tools: • English/Spanish
• Asthma• COPD• Diabetes• Heart Disease• Heart Failure• Medications• Mood and Health• Urinary System
Teach-Back and Health Literacy Tab
Tools/Resources include:
• Teach-back Starter Sentences
– Generic
– For Heart Failure
• Plain Language
– Generic
– For Heart Failure
• Health Literacy Tool Kit
• And more….
44
Orange County Care Transitions Collaborative
Health Services Advisory GroupJuly 11, 2018
–23–
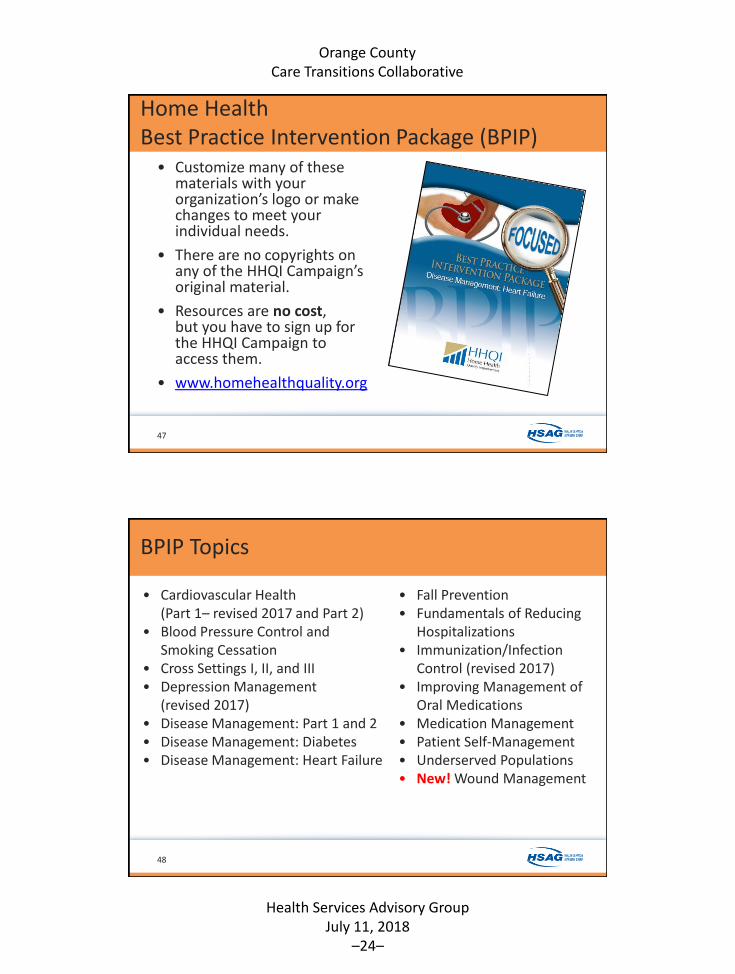
Nursing Home Reducing Readmissions Preparation Program
Why You Should Join:
• Improve your staff members knowledge on readmission interventions
• Create and strengthen your internal readmission prevention program
• Help you to become, and stay, a preferred provider to your local hospitals
• Improve your readmission rates to receive maximum reimbursement
45 www.hsag.com/ca-rrpp
Reducing Readmissions Preparation Program 2018 Webinar Series
4646
Fourth Wednesday
of every month,
11 a.m. PT
July 25Listening to Your Residents: Teach
Back and Motivational Interviewinghttps://goo.gl/a4FyXu
August 22Chronic Obstructive Pulmonary
Disease (COPD)https://goo.gl/9WrgyV
September 26Ready, Set, Go! Sharing Success Stories
https://goo.gl/GF2a9v
Past event slides and recordings available
www.hsag.com/events
Orange County Care Transitions Collaborative
Health Services Advisory GroupJuly 11, 2018
–24–
Home Health Best Practice Intervention Package (BPIP)
• Customize many of these materials with your organization’s logo or make changes to meet your individual needs.
• There are no copyrights on any of the HHQI Campaign’s original material.
• Resources are no cost, but you have to sign up for the HHQI Campaign to access them.
• www.homehealthquality.org
47
• Cardiovascular Health (Part 1– revised 2017 and Part 2)
• Blood Pressure Control and Smoking Cessation
• Cross Settings I, II, and III• Depression Management
(revised 2017)• Disease Management: Part 1 and 2• Disease Management: Diabetes• Disease Management: Heart Failure
• Fall Prevention• Fundamentals of Reducing
Hospitalizations• Immunization/Infection
Control (revised 2017)• Improving Management of
Oral Medications• Medication Management• Patient Self-Management• Underserved Populations • New! Wound Management
BPIP Topics
48
Orange County Care Transitions Collaborative
Health Services Advisory GroupJuly 11, 2018
–25–
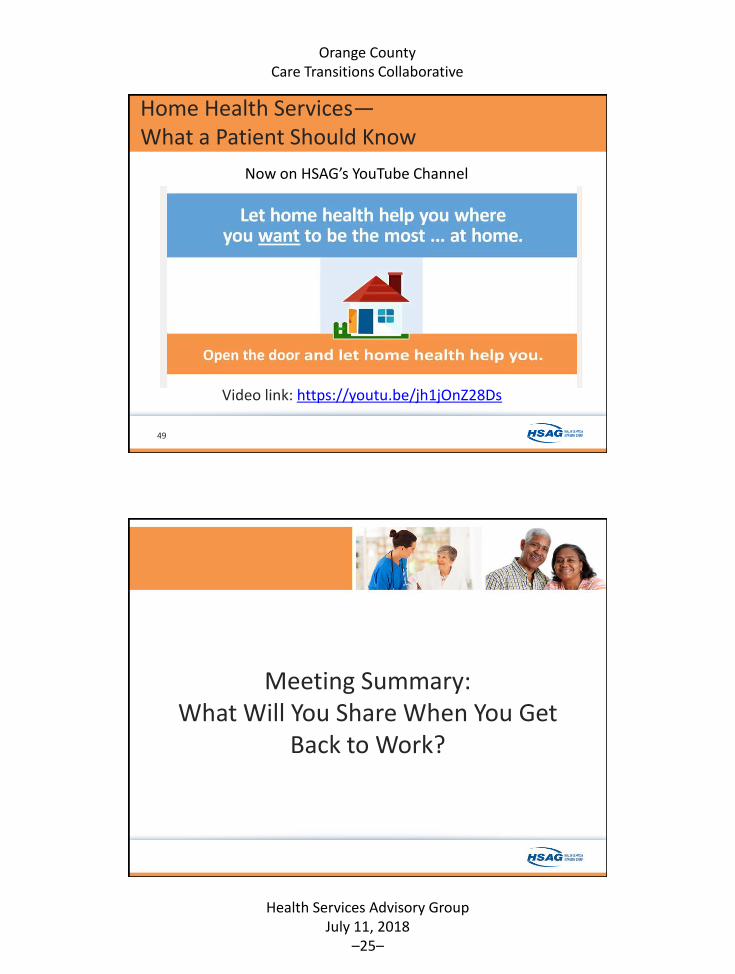
Home Health Services—What a Patient Should Know
49
Now on HSAG’s YouTube Channel
Video link: https://youtu.be/jh1jOnZ28Ds
Meeting Summary: What Will You Share When You Get
Back to Work?
Orange County Care Transitions Collaborative
Health Services Advisory GroupJuly 11, 2018
–26–
Your Meeting Evaluation Feedback Is Needed
• Target: At least 85% of you will complete a meeting evaluation form.
• Please complete the evaluation before you leave today (fold in half and leave on the center of the table).
• Your feedback is very important to us and highly valued.
51
Questions?
52
Orange County Care Transitions Collaborative
Health Services Advisory GroupJuly 11, 2018
–27–
Thank You All for Your Participation Today!
53
Thank You!
Ettie Lande
Orange County Care Transitions Collaborative
Health Services Advisory GroupJuly 11, 2018
–28–
DisclaimerThis material was prepared by Health Services Advisory Group, the Medicare Quality Improvement
Organization for California, under contract with the Centers for Medicare & Medicaid Services (CMS), an agency of the U.S. Department of Health and Human Services. The contents presented
do not necessarily reflect CMS policy. Publication No. CA-11SOW-C.3-07132018-01

![The Communicator HAMLINE UNIVERSITY SPRING …...chance to meet other students [from other institutions]. It’s very fun to get to know new people,” Gaetano said. Gaetano explained](https://static.fdocuments.in/doc/165x107/5ecde0915140d13f9829b138/the-communicator-hamline-university-spring-chance-to-meet-other-students-from.jpg)