Oral Health Disparities in Publicly Insured Children
29
Oral Health Disparities in Publicly Insured Children Dental Advisory Committee April 11 th , 2008 Tegwyn H. Brickhouse DDS PhD Department of Pediatric Dentistry VCU School of Dentistry
-
Upload
dentistryinfo -
Category
Documents
-
view
142 -
download
1
Transcript of Oral Health Disparities in Publicly Insured Children

Oral Health Disparities in Publicly Insured Children
Dental Advisory Committee
April 11th, 2008
Tegwyn H. Brickhouse DDS PhD
Department of Pediatric Dentistry
VCU School of Dentistry
Grant
• NIH Career Transition Award (K22)• From the National Institutes of Dental and Craniofacial Research• Supports young investigators in their early career • Experience guides them to become a independent scientist • Future grants

Oral Health Disparities
• Dental caries is the most common chronic disease of childhood, affecting 58% of all children.
• Untreated dental caries has been identified as the most prevalent unmet health need in US children.
• Disparities exist among children with 25% suffering 80% of all tooth decay.
• Dental disease disproportionately affects children younger then 6, from lower socioeconomic backgrounds.
SGR on Oral Health May, 2000

Health Coverage for Children
• Employer/Private Insurance 60%
– 47 million children
• Medicaid/SCHIP 28%
– 22 million children
• Uninsured 12%
– Over 9.4 million
60%
12%
28%
Uninsured
Medicaid/SCHIP
Private
Kaiser Commission on Medicaid and the Uninsured September, 2007

Background
• Publicly Financed Health Plans Providing Dental Services
• Medicaid– A joint federal-state-county program established in 1965 to
provide health insurance to low-income populations
• State Children’s Health Insurance Program (SCHIP)– A joint federal-state program established in 1997 to provide
coverage to low-income uninsured children who are not eligible for Medicaid.

Grant Objectives
• Examine the structure of public dental insurance programs and patterns of Enrollment in publicly insured children.
• Examine the Process of dental care (utilization, mix of services) and dental health status Outcomes (tooth loss, caries-related treatments).
• Compare dental treatment with of general anesthesia versus the conventional dental delivery system for preschool-aged children
• Implement a project that examines outcomes for case management of infant oral health in a medical setting.

Effects of Public Insurance on Access to Dental Services
• Cohort of Publicly Insured Children • Enrollment and Claims data from 2002-2005• Children 0-18 years of age• Two State Programs (Virginia and North Carolina)
– Similar size– Similar population distribution– Similar geography

Analytical File Construction
• Claim summaries of utilization• Provider-Level summaries• Individual Child-level files
– linked enrollment and claims across time periods.

Analytical File Creation Child-Level File
Provider Characteristics
Enrollment Claims
Child
Enrollment Patterns of Publicly Insured Children
• Measures that characterize enrollment in public programs
• Length of Enrollment (duration)– Heterogeneous populations
• Patterns of Enrollment (continuity)– yearly and age determinations– gaps

Impacts of Enrollment
• Impact on eligibility for dental services– Age and aid categories of eligibility determination
• Enrollees are approximately 10% SCHIP, 90% Medicaid• 75% of children were enrolled with one MCO provider• 20% enrolled with 2 MCO’s • 5% enrolled with 3+• Impact on provider acceptance
– Real-time eligibility determination (on-line, swipe methods)

Enrollment
• Over the 3 year period, children were enrolled a mean number of 436 days, median of 365 days.
• The mean age of enrolled children is 5 years.
• 12.5% had no gaps in enrollment
• 50% has one gap in enrollment
• 37.5% had 2+ gaps in enrollment
• Few studies have examined the relationship of enrollment patterns and utilization.

Outcomes
• Dental Visits– Utilization of dental services measured by at least one paid
claim.– Annual Dental Visit (NCQA standards)– Performance Measures of Dental Services– Which children utilize services/benefit most
• Age• Geography• Income

Outcomes
• Performance Measures of Dental Services– Preventive services – Restorative services– Tooth Loss (receipt of one or more extraction services)
• Dental Home– 2 visits to same practice/same year

North Carolina Claims Data

Medicaid versus Separate SCHIP Program
0 1 2 3 4 5 6 7 8 9 10 11 120.0
0.1
0.2
0.3
0.4
0.5
0.6
0.7
BothHealth Choice onlyMedicaid onlyEnrollment category
Months enrolled
Prob
abili
ty o
f vis
it (
± 95
% C
I)

Mix of Services for all Children
1.17 (1.02-1.36)0.93 (0.79-1.09)
1.00
1.75 (1.61-1.89)1.37 (1.26-1.50)
1.00
2.42 (2.20-2.66)1.64 (1.52-1.76)
1.00
Odds Ratio (95% CI)
0.0310.372
<0.001<0.001
<0.001<0.001
P-Value
3%2%2%
11%9%7%
26%20%15%
*Predicted Utilization
Extraction ServicesSCHIPBoth plansMedicaid (ref)
Restorative ServicesSCHIPBoth plansMedicaid (ref)
Preventive ServicesSCHIPBoth plansMedicaid (ref)
Enrolled Children
*Likelihood of having a dental service compared to Medicaid (ref), controlling for enrollment characteristics, age, race, and county-level indicators.

Mix of Services for Children Accessing Dental Care
0.54 (0.43-0.68)0.56 (0.47-0.68)
1.00
0.94 (0.86-1.04)0.87 (0.79-0.96)
1.00
1.21 (1.08-1.36)0.93 (0.83-1.04)
1.00
Odds Ratio (95% CI)
<0.001<0.001
0.2100.008
0.1980.001
P-Value
10%11%17%
49%47%50%
86%82%83%
*Predicted Utilization
Extraction ServicesSCHIPBoth plansMedicaid (ref)
Restorative ServicesSCHIPBoth plansMedicaid (ref)
Preventive ServicesSCHIPBoth plansMedicaid (ref)
Children with Utilization
*Likelihood of having a dental service compared to Medicaid (ref), controlling for enrollment characteristics, age, race, and county-level indicators.
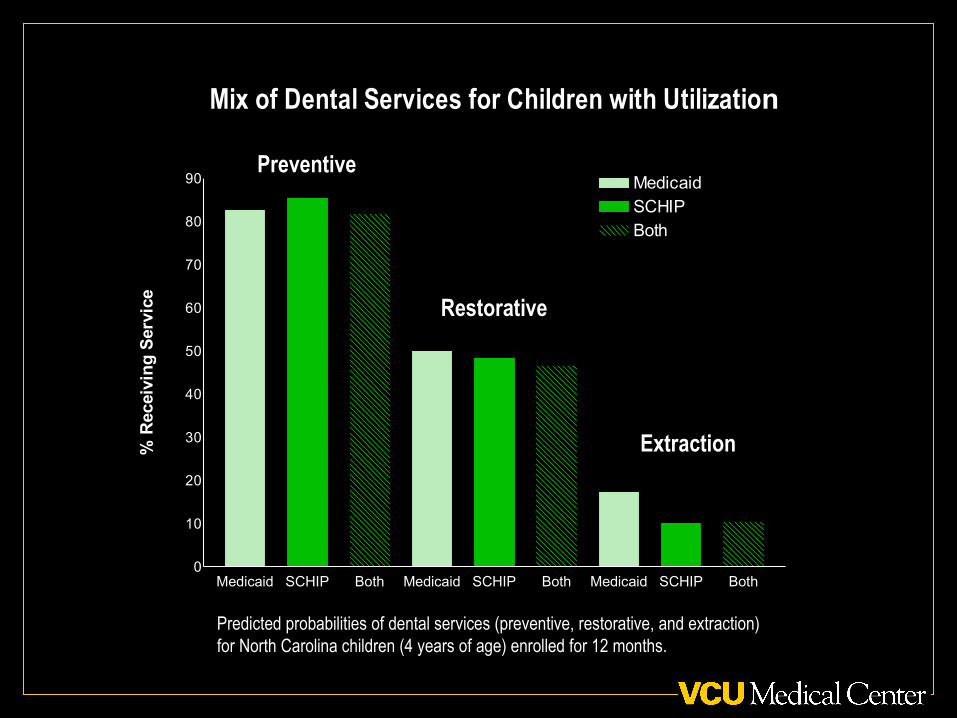
Mix of Dental Services for Children with Utilization
Medicaid SCHIP Both Medicaid SCHIP Both Medicaid SCHIP Both0
10
20
30
40
50
60
70
80
90 MedicaidSCHIPBoth
% R
ecei
vin
g S
ervi
ce
Predicted probabilities of dental services (preventive, restorative, and extraction) for North Carolina children (4 years of age) enrolled for 12 months.
Preventive
Restorative
Extraction

Virginia Claims Data
• 62% of dental claims were MCO• 38% of dental claims were FFS• Mean age for children with claims was 9 years of age.

Mix of Services
• 32% Diagnostic Services• 40% Preventive Services• 18% Restorative Services• 5% Extraction Services• 1.5 % Orthodontic Services

Infant Oral Health Project
• Preventive oral health services consist of – knee to knee oral screening and risk
assessment – Fluoride varnish– oral health education for caregivers – referral to a pediatric dental clinic.

Infant Assessment
• 19% of children had signs of dental caries• 12.5% having white-spot lesions• 75% were categorized as ‘high’ risk and referred for a dental visit• 80% of children received a fluoride varnish treatment

25
75
64
36
71
29
62
38
62
38
Family Member with Active Decay
61Y
100N
Snacking 3+ times a day
61Y
100N
Suboptimal Fluoride
47 Y
114N
Takes Bottle to Bed
58Y
103 N
Assessment of High Risk
121Y
40N

85137N
1524Y
Visible Plaque
Age
19 monthsMean
9.5SD
440Range
81130N
1931Y
87139N
1320Y
White Spot Lesions
Decay
% n Characteristic

High-Risk Children
• 6-months post-enrollment, 9% of children had made a dental visit to VCU.
• Children with visible plaque were more likely to have decay at baseline.
• 400+ Children enrolled in the VCU Bright Smiles Program• Examine the prevalence of dental claims for enrolled children
versus a random sample of Medicaid children 0-3 years of age.

Future Studies
• Provider Measures– Participation in programs– Level of activity– Types of Services– Response to program
changes• Program structure • Fee increases

State Program Reform
• Single Vendor Carve Out• Pre-Post Design
Questions?
• Many Thanks to DMAS• Sandra Brown• James Starkey• Lisa Bilik• Pat Finnerty