Oracle® Fusion Middleware · 1.2.1 Oracle BAM Adapter ... Monitoring Oracle Fusion Middleware...
230
Oracle® Fusion Middleware User's Guide for Oracle Business Activity Monitoring 11g Release 1 (11.1.1.6.3) E10230-10 August 2012 Documentation for report creators that describes how to create and format reports, use and format data in views, and organize and share reports in Oracle Business Activity Monitoring (BAM) using Oracle BAM Active Studio and Oracle BAM Active Viewer.
Transcript of Oracle® Fusion Middleware · 1.2.1 Oracle BAM Adapter ... Monitoring Oracle Fusion Middleware...
Oracle® Fusion MiddlewareUser's Guide for Oracle Business Activity Monitoring
11g Release 1 (11.1.1.6.3)
E10230-10
August 2012
Documentation for report creators that describes how to create and format reports, use and format data in views, and organize and share reports in Oracle Business Activity Monitoring (BAM) using Oracle BAM Active Studio and Oracle BAM Active Viewer.
Oracle Fusion Middleware User's Guide for Oracle Business Activity Monitoring, 11g Release 1 (11.1.1.6.3)
E10230-10
Copyright © 2006, 2012, Oracle and/or its affiliates. All rights reserved.
This software and related documentation are provided under a license agreement containing restrictions on use and disclosure and are protected by intellectual property laws. Except as expressly permitted in your license agreement or allowed by law, you may not use, copy, reproduce, translate, broadcast, modify, license, transmit, distribute, exhibit, perform, publish, or display any part, in any form, or by any means. Reverse engineering, disassembly, or decompilation of this software, unless required by law for interoperability, is prohibited.
The information contained herein is subject to change without notice and is not warranted to be error-free. If you find any errors, please report them to us in writing.
If this is software or related documentation that is delivered to the U.S. Government or anyone licensing it on behalf of the U.S. Government, the following notice is applicable:
U.S. GOVERNMENT RIGHTS Programs, software, databases, and related documentation and technical data delivered to U.S. Government customers are "commercial computer software" or "commercial technical data" pursuant to the applicable Federal Acquisition Regulation and agency-specific supplemental regulations. As such, the use, duplication, disclosure, modification, and adaptation shall be subject to the restrictions and license terms set forth in the applicable Government contract, and, to the extent applicable by the terms of the Government contract, the additional rights set forth in FAR 52.227-19, Commercial Computer Software License (December 2007). Oracle America, Inc., 500 Oracle Parkway, Redwood City, CA 94065.
This software or hardware is developed for general use in a variety of information management applications. It is not developed or intended for use in any inherently dangerous applications, including applications that may create a risk of personal injury. If you use this software or hardware in dangerous applications, then you shall be responsible to take all appropriate fail-safe, backup, redundancy, and other measures to ensure its safe use. Oracle Corporation and its affiliates disclaim any liability for any damages caused by use of this software or hardware in dangerous applications.
Oracle and Java are registered trademarks of Oracle and/or its affiliates. Other names may be trademarks of their respective owners.
Intel and Intel Xeon are trademarks or registered trademarks of Intel Corporation. All SPARC trademarks are used under license and are trademarks or registered trademarks of SPARC International, Inc. AMD, Opteron, the AMD logo, and the AMD Opteron logo are trademarks or registered trademarks of Advanced Micro Devices. UNIX is a registered trademark of The Open Group.
This software or hardware and documentation may provide access to or information on content, products, and services from third parties. Oracle Corporation and its affiliates are not responsible for and expressly disclaim all warranties of any kind with respect to third-party content, products, and services. Oracle Corporation and its affiliates will not be responsible for any loss, costs, or damages incurred due to your access to or use of third-party content, products, or services.
iii
Contents
Preface ............................................................................................................................................................... xv
Intended Audience.................................................................................................................................... xvDocumentation Accessibility ................................................................................................................... xvConventions ............................................................................................................................................... xv
What's New in This Guide for Release 11.1.1.6.x ................................................................... xvii
1 Introduction to Oracle Business Activity Monitoring
1.1 About Oracle BAM ..................................................................................................................... 1-11.2 Real Time Data Streaming ......................................................................................................... 1-21.2.1 Oracle BAM Adapter........................................................................................................... 1-21.2.2 Direct JMS Connectivity ..................................................................................................... 1-31.2.3 Oracle Data Integrator......................................................................................................... 1-31.2.4 Oracle BAM Web Services.................................................................................................. 1-31.3 External Data Sources................................................................................................................. 1-41.4 Oracle BAM Server ..................................................................................................................... 1-41.4.1 Oracle BAM Active Data Cache......................................................................................... 1-41.4.2 Oracle BAM Event Engine.................................................................................................. 1-41.4.3 Oracle BAM Report Cache ................................................................................................. 1-51.5 Oracle BAM Web Applications................................................................................................. 1-51.5.1 Oracle BAM Start Page ....................................................................................................... 1-51.5.2 Oracle BAM Active Viewer ................................................................................................ 1-51.5.3 Oracle BAM Active Studio ................................................................................................. 1-51.5.4 Oracle BAM Architect ......................................................................................................... 1-61.5.5 Oracle BAM Administrator ................................................................................................ 1-61.5.6 Oracle BAM Report Server ................................................................................................. 1-61.6 Oracle BAM Data Control.......................................................................................................... 1-61.7 Oracle BAM Administration ..................................................................................................... 1-61.8 ICommand ................................................................................................................................... 1-71.9 Related Documentation.............................................................................................................. 1-71.10 Samples and Tutorials ................................................................................................................ 1-7
2 Getting Started With Oracle BAM Web Applications
2.1 Microsoft Internet Explorer Settings ........................................................................................ 2-12.1.1 Disable Popup Blockers ...................................................................................................... 2-2
iv
2.1.2 Open Separate Browser Windows For New URLs......................................................... 2-22.1.3 Configure Print Settings ..................................................................................................... 2-22.1.4 Disable Browser Caching.................................................................................................... 2-22.1.5 Hide Address Bar in Oracle BAM Web Applications .................................................... 2-22.2 Starting Oracle BAM Web Applications.................................................................................. 2-42.3 Personalizing Oracle BAM Web Applications........................................................................ 2-52.3.1 Configuring Print Setup (Required).................................................................................. 2-52.3.2 Configure Time Zone Preferences..................................................................................... 2-62.3.3 Specifying Report Loading Indicator Settings................................................................. 2-82.3.4 Enabling Oracle BAM Active Studio View Editor Animation...................................... 2-92.3.5 Selecting a Report for the Oracle BAM Active Studio Home Tab ................................ 2-92.4 Getting Started With Oracle BAM Active Viewer ................................................................. 2-92.4.1 Select Report ...................................................................................................................... 2-102.4.2 Print Preview..................................................................................................................... 2-102.4.3 Personalize ......................................................................................................................... 2-112.4.4 Reprompt ........................................................................................................................... 2-112.4.5 Save Offline........................................................................................................................ 2-112.4.6 Email ................................................................................................................................... 2-112.5 Getting Started With Oracle BAM Active Studio................................................................ 2-112.5.1 Tabs..................................................................................................................................... 2-122.5.2 Toolbars.............................................................................................................................. 2-122.5.3 Reports................................................................................................................................ 2-132.5.4 Alerts .................................................................................................................................. 2-132.5.5 Folders ................................................................................................................................ 2-132.5.6 Actions................................................................................................................................ 2-132.5.7 View Tasks/Options ........................................................................................................ 2-132.5.8 Guide Text.......................................................................................................................... 2-142.5.9 View Editor........................................................................................................................ 2-142.6 Getting Started With Oracle BAM Architect........................................................................ 2-142.7 Getting Started With Oracle BAM Administrator .............................................................. 2-152.8 Getting Started With Oracle BAM Samples ......................................................................... 2-16
3 Creating and Managing Reports
3.1 Introduction to Report Creation and Delivery ....................................................................... 3-13.2 Creating Tiled Reports ............................................................................................................... 3-23.3 Creating Columnar Reports ...................................................................................................... 3-73.3.1 Grouping Items in Columnar Reports........................................................................... 3-103.3.2 Adding Summary Functions in Columnar Reports .................................................... 3-113.3.3 Quick Formatting in Columnar Reports ....................................................................... 3-123.4 Saving Reports.......................................................................................................................... 3-133.5 Renaming Reports.................................................................................................................... 3-153.6 Editing Reports......................................................................................................................... 3-173.6.1 Editing a Report ................................................................................................................ 3-173.6.2 Adding Report Titles........................................................................................................ 3-173.6.3 Formatting Report Titles.................................................................................................. 3-183.6.4 Setting Backgrounds for Reports.................................................................................... 3-183.6.5 Resizing Views .................................................................................................................. 3-19
v
3.6.6 Inserting Views ................................................................................................................. 3-193.6.7 Deleting Views .................................................................................................................. 3-193.6.8 Changing View Types...................................................................................................... 3-203.6.9 Changing the Data Objects Used.................................................................................... 3-203.6.10 Setting Active Data Retrieval Interval ........................................................................... 3-213.6.11 Setting a Report-Level Poll Mode Refresh Interval ..................................................... 3-223.6.12 Configuring Report Breadcrumbs.................................................................................. 3-233.6.13 Configuring Browser Padding........................................................................................ 3-233.7 Deleting Reports....................................................................................................................... 3-233.8 E-mailing Reports .................................................................................................................... 3-243.9 Printing Reports ....................................................................................................................... 3-253.10 Copying Report URLs ............................................................................................................. 3-263.11 Saving Reports Offline ............................................................................................................ 3-273.12 Viewing Reports....................................................................................................................... 3-273.13 Responding to Report Prompts ............................................................................................. 3-293.14 Pausing and Playing Active Data .......................................................................................... 3-303.15 Adding Oracle BAM Reports to Web Pages ........................................................................ 3-30
4 Creating and Using Views
4.1 Creating and Using List Views ................................................................................................. 4-14.1.1 Introduction to List Views.................................................................................................. 4-14.1.2 Creating List Views ............................................................................................................. 4-24.1.3 Configuring List View Formatting Properties................................................................. 4-44.1.4 Sorting Data in List Views.................................................................................................. 4-54.1.5 Adding Summaries to a Collapsed List............................................................................ 4-64.1.6 Configuring the Action List ............................................................................................... 4-64.1.6.1 Selecting Rows of Data in the Action List................................................................. 4-64.1.6.2 Editing Data in the Action List ................................................................................... 4-64.1.6.3 Adding Action Buttons................................................................................................ 4-74.1.7 Using the Paging Controls.................................................................................................. 4-74.2 Creating and Using Chart Views.............................................................................................. 4-74.2.1 Introduction to Chart Views .............................................................................................. 4-74.2.2 Creating Chart Views.......................................................................................................... 4-84.2.3 Configuring Chart View General Formatting Properties ........................................... 4-104.2.4 Grouping Data................................................................................................................... 4-104.2.5 Configuring Time Groups ............................................................................................... 4-114.2.6 Configuring Chart Targets .............................................................................................. 4-134.2.7 Creating Charts With Multiple Data Objects................................................................ 4-144.2.7.1 Adding Data Objects to Chart Views ..................................................................... 4-144.2.7.2 Editing Charts Containing Multiple Data Objects................................................ 4-144.2.7.3 Removing Data Objects From Charts ..................................................................... 4-144.2.8 Creating Statistical Process Control Charts .................................................................. 4-144.2.8.1 Creating an SPC Chart Data Object ........................................................................ 4-154.2.8.2 Selecting Fields for SPC Charts ............................................................................... 4-154.2.9 Using the Pie Chart........................................................................................................... 4-164.3 Creating and Using the Columnar View.............................................................................. 4-174.3.1 Introduction to the Columnar View............................................................................... 4-17
vi
4.3.2 Adding a Columnar View to a Report........................................................................... 4-174.3.3 Adding Summaries to a Columnar View...................................................................... 4-184.3.4 Configuring Columnar View Formatting Properties .................................................. 4-184.3.5 Using the Columnar View............................................................................................... 4-184.4 Creating and Using Key Process Indicator Views .............................................................. 4-194.4.1 Introduction to KPI Views............................................................................................... 4-194.4.2 Creating KPI Views .......................................................................................................... 4-194.4.3 Configuring KPI View Formatting Properties.............................................................. 4-214.4.4 Selecting a Gauge Style .................................................................................................... 4-224.5 Creating and Using Crosstab Views ..................................................................................... 4-234.5.1 Introduction to Crosstab Views...................................................................................... 4-234.5.2 Creating Crosstab Views ................................................................................................. 4-234.5.3 Configuring Crosstab View Formatting Properties..................................................... 4-254.5.4 Configuring Summaries in Crosstab and Summary Crosstab Views....................... 4-254.5.5 Configuring Conditional Formatting in Matrix Views ............................................... 4-264.5.6 Using the Crosstab View ................................................................................................. 4-264.5.6.1 Filtering the Crosstab View...................................................................................... 4-264.5.6.2 Changing the Aggregate Function.......................................................................... 4-264.5.6.3 Changing Row and Column Order......................................................................... 4-274.5.6.4 Pivoting ...................................................................................................................... 4-274.5.6.5 Rolling Up and Drilling Down ................................................................................ 4-274.5.7 Using the Summary Crosstab View ............................................................................... 4-274.5.7.1 Filtering the Summary Crosstab View ................................................................... 4-274.5.7.2 Changing the Aggregate Function.......................................................................... 4-284.5.7.3 Rolling Up and Drilling Down ................................................................................ 4-284.5.7.4 Sorting the Summary Crosstab View ..................................................................... 4-284.5.8 Using the Matrix View ..................................................................................................... 4-284.6 Creating and Using the Excel View....................................................................................... 4-284.6.1 Introduction to the Excel View ....................................................................................... 4-284.6.2 Creating an Excel View.................................................................................................... 4-294.6.3 Configuring Excel View Formatting Properties........................................................... 4-294.6.4 Using the Excel View........................................................................................................ 4-304.6.4.1 Saving the Excel Spreadsheet Outside of Oracle BAM........................................ 4-304.6.4.2 Viewing Named Ranges ........................................................................................... 4-304.6.4.3 Performance Tips....................................................................................................... 4-314.7 Creating and Using the Action Form View.......................................................................... 4-314.7.1 Introduction to the Action Form View .......................................................................... 4-314.7.2 Creating Action Form Templates ................................................................................... 4-314.7.3 Creating Action Form Views........................................................................................... 4-334.8 Creating and Using the External Content View.................................................................. 4-354.8.1 Introduction to the External Content View................................................................... 4-354.8.2 Creating External Content Views................................................................................... 4-354.9 Creating and Using Utility Views ......................................................................................... 4-364.9.1 Introduction to the Utility Views ................................................................................... 4-364.9.2 Creating the Surface Prompts View............................................................................... 4-364.9.3 Creating the Container View .......................................................................................... 4-374.9.4 Creating the Row Group and Column Group Views.................................................. 4-37
vii
4.9.5 Creating the Tab Group View......................................................................................... 4-384.9.6 Creating the Dashboard View......................................................................................... 4-404.9.6.1 Configuring the Dashboard Toolbar ...................................................................... 4-42
5 Manipulating Data in Views
5.1 Filtering Data ............................................................................................................................... 5-15.1.1 Using Active Now ............................................................................................................... 5-65.1.1.1 Using is within a time interval ................................................................................... 5-75.1.1.2 Using is within the current time period ................................................................. 5-105.1.1.3 Using is within a time period .................................................................................. 5-115.1.1.4 Using Active Now and Time Groups in the Same Chart .................................... 5-125.1.1.5 Understanding Active Now Behavior in a Multiple Entry Filter Expression .. 5-155.2 Displaying Top N Data ........................................................................................................... 5-165.3 Using Drilling ........................................................................................................................... 5-165.3.1 Drilling Down ................................................................................................................... 5-175.3.2 Drilling Up......................................................................................................................... 5-175.3.3 Drilling Through............................................................................................................... 5-175.3.4 Drilling Across .................................................................................................................. 5-185.3.5 Adding Drilling Hierarchies to Views........................................................................... 5-185.3.6 Enabling Drilling Through to Details ............................................................................ 5-195.3.7 Configuring Drill-Across Targets................................................................................... 5-195.3.8 Drilling Across to a URL.................................................................................................. 5-205.4 Adding Calculated Fields ....................................................................................................... 5-215.4.1 Using HTML in Calculations .......................................................................................... 5-225.4.2 Using Decimal Type Numbers in Calculations............................................................ 5-235.4.3 Formatting Date Subtractions in Calculated Fields ..................................................... 5-235.5 Adding Surface Prompts......................................................................................................... 5-245.6 Applying Summary Functions to Groups............................................................................ 5-25
6 Formatting Views
6.1 Introduction to Formatting Views............................................................................................ 6-16.2 Configuring General Formatting Properties........................................................................... 6-26.3 Configuring Axis Properties ..................................................................................................... 6-26.4 Configuring View Borders, Shading, and Background Color.............................................. 6-36.5 Configuring Text Alignment..................................................................................................... 6-56.5.1 Suppressing Duplicate Fields ............................................................................................ 6-66.6 Displaying Data Labels .............................................................................................................. 6-86.7 Configuring Font Formats ......................................................................................................... 6-86.8 Configuring Themes................................................................................................................... 6-96.8.1 Adding and Changing Themes....................................................................................... 6-106.9 Configuring Value Formats.................................................................................................... 6-106.10 Configuring the Display of Active Data ............................................................................... 6-116.11 Setting a View-Level Poll Mode Refresh Interval ............................................................... 6-126.12 Configuring Patterns ............................................................................................................... 6-13
viii
7 Editing Columnar Reports
7.1 About Columnar Reports .......................................................................................................... 7-17.2 Using Formatting Toolbars........................................................................................................ 7-17.3 Inserting Images.......................................................................................................................... 7-27.4 Inserting Text............................................................................................................................... 7-3
8 Using Prompts and Parameters
8.1 About Prompts and Parameters ............................................................................................... 8-18.2 Creating Parameters ................................................................................................................... 8-28.3 Creating Custom Parameters .................................................................................................... 8-68.4 Creating Prompts ........................................................................................................................ 8-78.4.1 Creating a Datetime Type Parameter ............................................................................ 8-178.4.2 Creating a Field Type Parameter.................................................................................... 8-178.5 Working with Prompts and Parameters............................................................................... 8-188.5.1 Arranging Prompt Order................................................................................................. 8-198.5.2 Previewing Prompts......................................................................................................... 8-198.5.3 Editing Prompts and Parameters ................................................................................... 8-198.5.4 Deleting Prompts and Parameters ................................................................................. 8-198.5.5 Cascading Prompts........................................................................................................... 8-208.6 Using Parameters in Report URLs......................................................................................... 8-208.7 Driving Prompts and Parameters from Other Views......................................................... 8-228.7.1 Configuring Driving......................................................................................................... 8-228.7.2 A Driving Example........................................................................................................... 8-23
9 Using Action Buttons
9.1 About Action Buttons................................................................................................................. 9-19.2 Creating Action Buttons............................................................................................................. 9-19.2.1 Creating Action Buttons ..................................................................................................... 9-29.2.2 Configuring Insert Action Types....................................................................................... 9-39.2.3 Configuring Constant Value Update Action Types ....................................................... 9-49.2.4 Configuring Edit Column Update Action Types ............................................................ 9-59.2.5 Configuring Delete Action Types...................................................................................... 9-59.2.6 Configuring Open a URL Action Types........................................................................... 9-59.2.7 Configuring View a Report Action Types........................................................................ 9-69.2.8 Configuring Reset a Form Action Types.......................................................................... 9-79.2.9 Configuring Refresh a View Action Types ...................................................................... 9-89.2.10 Configuring Show a Confirmation Message Action Types........................................... 9-8
10 Organizing and Sharing Reports
10.1 Organizing Your Reports........................................................................................................ 10-110.2 Creating New Folders ............................................................................................................. 10-110.3 Setting Folder Permissions ..................................................................................................... 10-210.4 Working with Folders ............................................................................................................. 10-310.5 Copying Reports and Folders ................................................................................................ 10-310.6 Moving Reports and Folders.................................................................................................. 10-410.7 Sharing Reports with Other Users......................................................................................... 10-4
ix
10.8 Deleting Shared Reports ......................................................................................................... 10-4
11 Archiving and Purging Data
11.1 Archiving Data ......................................................................................................................... 11-111.2 Purging Data............................................................................................................................. 11-1
A Calculation Operators and Expressions
A.1 Calculation Operators ............................................................................................................... A-2A.2 Avg............................................................................................................................................... A-2A.3 Ceiling.......................................................................................................................................... A-3A.4 Concat .......................................................................................................................................... A-3A.5 Count ........................................................................................................................................... A-3A.6 CountDistinct.............................................................................................................................. A-4A.7 DateAdd ...................................................................................................................................... A-4A.8 DayName .................................................................................................................................... A-4A.9 DayOfMonth............................................................................................................................... A-4A.10 DayOfWeek................................................................................................................................. A-5A.11 DayOfYear................................................................................................................................... A-5A.12 Floor ............................................................................................................................................. A-5A.13 Hour ............................................................................................................................................. A-5A.14 If.................................................................................................................................................... A-5A.15 IfNull............................................................................................................................................ A-6A.16 Length.......................................................................................................................................... A-6A.17 Lower ........................................................................................................................................... A-6A.18 Max............................................................................................................................................... A-7A.19 Min ............................................................................................................................................... A-7A.20 Minute.......................................................................................................................................... A-7A.21 Month........................................................................................................................................... A-7A.22 MonthName................................................................................................................................ A-7A.23 Now.............................................................................................................................................. A-8A.24 PercentOfTotal............................................................................................................................ A-8A.25 Power ........................................................................................................................................... A-8A.26 Quarter......................................................................................................................................... A-8A.27 Repeat .......................................................................................................................................... A-9A.28 Replace......................................................................................................................................... A-9A.29 Round .......................................................................................................................................... A-9A.30 Second.......................................................................................................................................... A-9A.31 Substring ................................................................................................................................... A-10A.32 Sum ............................................................................................................................................ A-10A.33 Switch ........................................................................................................................................ A-10A.34 TrimEnd..................................................................................................................................... A-10A.35 TrimStart ................................................................................................................................... A-11A.36 Upper ......................................................................................................................................... A-11A.37 Week .......................................................................................................................................... A-11A.38 Year ............................................................................................................................................ A-12
x
B Filter Comparison Expressions
B.1 Filter Comparison Expressions ................................................................................................ B-1B.2 Exceptions for Timestamp Filter Expressions........................................................................ B-2
C Date and Time in Oracle BAM
C.1 General Transformation and Formatting Of Date and Time............................................... C-1C.2 Personalized Time Zone Settings ............................................................................................ C-1C.3 Date (Datetime and Timestamp) Configuration in Reports ................................................ C-2C.4 Date and Time in Alerts ............................................................................................................ C-2C.5 Date and Time in Enterprise Message Sources...................................................................... C-3
D Troubleshooting
D.1 Upgrade Issues ........................................................................................................................... D-1D.1.1 Open 10.1.3.x Oracle JDeveloper Project with Oracle BAM sensor actions in Oracle
JDeveloper 11g D-1D.2 Startup and Login Issues .......................................................................................................... D-2D.2.1 Database is Running and Reachable ................................................................................ D-2D.2.2 404 Error............................................................................................................................... D-2D.2.3 Authentication Failed Exception ...................................................................................... D-3D.2.4 Buttons Grayed Out on the Start Page............................................................................. D-3D.3 Oracle BAM Web Application Issues...................................................................................... D-3D.3.1 Loss of Active Data............................................................................................................. D-3D.3.2 Active Data is Intermittent ................................................................................................ D-4D.3.3 Reports Get Stuck ............................................................................................................... D-4D.3.4 Printing Issues ..................................................................................................................... D-4D.3.5 Unable to Create or View Report With No Permissions on System Folder ............... D-4D.3.6 Cannot Configure More Than 50 Prompt Values in a Report...................................... D-5D.3.7 Not All Values Are Displayed in the Filter Value Browse List.................................... D-5D.3.8 Action Form Error............................................................................................................... D-5D.3.9 Report Says "Reconnecting" Indefinitely......................................................................... D-5D.3.10 Data Object Name Is Different in Oracle BAM Architect and Oracle Enterprise
Manager Fusion Middleware Control D-5D.3.11 Rows Truncated in List Views .......................................................................................... D-6D.3.12 Exception Message While Creating or Viewing Charts and KPIs............................... D-6D.3.13 Cannot Reuse a User Name............................................................................................... D-6D.3.14 Timing Is Off Between Active Now and Continuous Time Series .............................. D-7D.3.15 Exception Thrown Drilling Across Between Reports.................................................... D-7D.4 Oracle BAM Server Issues ........................................................................................................ D-7D.4.1 Enterprise Message Source Not Receiving Messages.................................................... D-7D.5 Oracle BAM Adapter Issues ..................................................................................................... D-8D.5.1 SOA Server Invalid User Name Exception ..................................................................... D-8D.5.2 SOA Server Authentication Error With Correct Credential Configuration............... D-8D.5.3 Illegal Argument Exception on Oracle WebLogic Server Console Upon Restart or
Editing Deployment of Oracle BAM Adapter D-9D.6 Oracle BAM Sensor Action Issues ......................................................................................... D-10D.6.1 Loggers for Troubleshooting Oracle BAM Sensors Actions....................................... D-10D.7 Oracle BAM ICommand Issues.............................................................................................. D-10
xi
D.7.1 JDBC Connection Pool Error........................................................................................... D-10D.7.2 ICommand Fails to Connect With Oracle BAM Server............................................... D-10D.7.3 Unavailable External Data Source Error ....................................................................... D-11D.8 Oracle BAM Issues With Oracle Enterprise Manager Fusion Middleware Control Console..
D-11D.8.1 Oracle BAM Security Roles and Policies Are Not Displayed .................................... D-11D.9 Oracle BAM Issues With Oracle WebLogic Server Administrative Console.................. D-11D.9.1 Unable to Locate the Activate Changes Button............................................................ D-11D.10 Oracle BAM Issues With Oracle Data Integrator ................................................................ D-13D.10.1 Unable to Connect With Oracle Data Integrator.......................................................... D-13D.11 Database Issues ........................................................................................................................ D-13D.11.1 Unable to Extend ORABAM Tablespace....................................................................... D-13D.11.2 Data Corruption Symptoms............................................................................................ D-13D.12 Using the Logs.......................................................................................................................... D-14
Index

xii
xiii
Preface
This preface explains how to use this book. It contains the following topics:
■ Intended Audience
■ Documentation Accessibility
■ Conventions
Intended AudienceThis manual is intended for report creators responsible for creating reports in Oracle Business Activity Monitoring. Using the Administrator application, the report creator creates private and shared reports, and creates alerts.
Documentation AccessibilityFor information about Oracle's commitment to accessibility, visit the Oracle Accessibility Program website at http://www.oracle.com/pls/topic/lookup?ctx=acc&id=docacc.
Access to Oracle SupportOracle customers have access to electronic support through My Oracle Support. For information, visit http://www.oracle.com/pls/topic/lookup?ctx=acc&id=info or visit http://www.oracle.com/pls/topic/lookup?ctx=acc&id=trs if you are hearing impaired.
ConventionsThe following text conventions are used in this document:
Convention Meaning
boldface Boldface type indicates graphical user interface elements associated with an action, or terms defined in text or the glossary.
italic Italic type indicates book titles, emphasis, or placeholder variables for which you supply particular values.
monospace Monospace type indicates commands within a paragraph, URLs, code in examples, text that appears on the screen, or text that you enter.

xiv
xv
What's New in This Guide for Release11.1.1.6.x
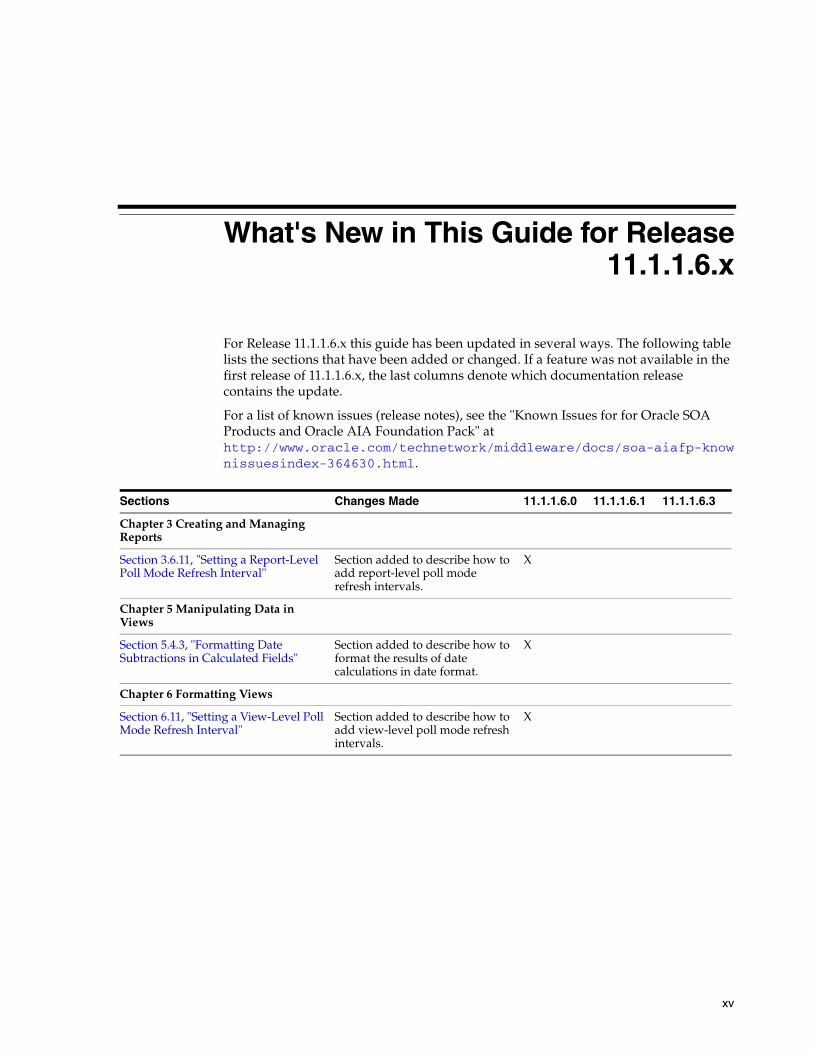
For Release 11.1.1.6.x this guide has been updated in several ways. The following table lists the sections that have been added or changed. If a feature was not available in the first release of 11.1.1.6.x, the last columns denote which documentation release contains the update.
For a list of known issues (release notes), see the "Known Issues for for Oracle SOA Products and Oracle AIA Foundation Pack" at http://www.oracle.com/technetwork/middleware/docs/soa-aiafp-knownissuesindex-364630.html.
Sections Changes Made 11.1.1.6.0 11.1.1.6.1 11.1.1.6.3
Chapter 3 Creating and Managing Reports
Section 3.6.11, "Setting a Report-Level Poll Mode Refresh Interval"
Section added to describe how to add report-level poll mode refresh intervals.
X
Chapter 5 Manipulating Data in Views
Section 5.4.3, "Formatting Date Subtractions in Calculated Fields"
Section added to describe how to format the results of date calculations in date format.
X
Chapter 6 Formatting Views
Section 6.11, "Setting a View-Level Poll Mode Refresh Interval"
Section added to describe how to add view-level poll mode refresh intervals.
X

xvi
1
Introduction to Oracle Business Activity Monitoring 1-1
1Introduction to Oracle Business ActivityMonitoring
This chapter provides a brief overview of Oracle Business Activity Monitoring (Oracle BAM) and its uses. It lists the components that make up Oracle BAM and gives a high-level description of the components, including Oracle BAM Server, Oracle BAM web applications such as Active Viewer and Active Studio, and the components that provide data feeds and active data content.
The chapter contains the following topics:
■ Section 1.1, "About Oracle BAM"
■ Section 1.2, "Real Time Data Streaming"
■ Section 1.3, "External Data Sources"
■ Section 1.4, "Oracle BAM Server"
■ Section 1.5, "Oracle BAM Web Applications"
■ Section 1.6, "Oracle BAM Data Control"
■ Section 1.7, "Oracle BAM Administration"
■ Section 1.8, "ICommand"
■ Section 1.9, "Related Documentation"
■ Section 1.10, "Samples and Tutorials"
1.1 About Oracle BAMOracle BAM provides a framework for
■ Creating dashboards that display real-time data inflow.
■ Creating rules to send alerts under specified conditions.
■ Designing Web applications with graphs displaying active data.
Active Data Architecture. Oracle Business Activity Monitoring provides an active data architecture that dynamically moves real-time data to end users through every step of the process. This solution actively collects data, applies rules designed to monitor changes, and delivers the information in reports to users.
Real-time Reports. Real-time reports containing current data are delivered as soon as data changes occur. This is possible because of data in the Oracle BAM Active Data Cache and the connections to real-time transactional feeds.
Real Time Data Streaming
1-2 Oracle Fusion Middleware User's Guide for Oracle Business Activity Monitoring
Active Presentations in Reports. Reports display active data presentations where data continuously updates, formats, and is displayed. When data changes, the display changes in real-time.
Instant Alerts. Alerts, based on rules and events occurring in real-time, are delivered through e-mail.
Rules-Based Active Delivery. In an event-driven solution, the information finds the target users instead of requiring users to query for the information on their own initiative. The reports are initially designed for delivery to end users based on data changing or events triggering. For the end user, the result is zero-click reporting that is always relevant.
High Performance, Scalable Architecture. Oracle Business Activity Monitoring is scalable to handle large amounts of complex, real-time enterprise data. Oracle BAM uses Oracle Data Integrator to select the correct raw data and then transform and perform calculations required by the data designer. The transformed data is delivered to the Oracle BAM Active Data Cache in a ready-to-use state for fast access.
Oracle BAM consists of several components:
■ Real Time Data Streaming- feeds data into Oracle BAM. See Section 1.2, "Real Time Data Streaming."
■ Oracle BAM Server - See Section 1.4, "Oracle BAM Server."
■ Oracle BAM Web Applications - users build Oracle BAM schema, dashboards, and alerts. See Section 1.5, "Oracle BAM Web Applications."
■ Oracle BAM Data Control - developers create ADF pages with active data content. See Section 1.6, "Oracle BAM Data Control.".
■ ICommand - command-line tool for manipulating the Oracle BAM schema, dashboards, and reports. See Section 1.8, "ICommand."
1.2 Real Time Data StreamingOracle Business Activity Monitoring offers four different mechanisms to update Oracle BAM Server with real-time streaming data.
■ Oracle BAM Adapter, the JCA-compliant adapter, and the fastest option for streaming data into Oracle BAM Server. See Section 1.2.1, "Oracle BAM Adapter."
■ Direct JMS (also known as JMS Connector or Enterprise Message Sources). See Section 1.2.2, "Direct JMS Connectivity."
■ Oracle Data Integrator. See Section 1.2.3, "Oracle Data Integrator."
■ Web services API to interact directly with Oracle BAM data objects from a remote client. See Section 1.2.4, "Oracle BAM Web Services."
1.2.1 Oracle BAM AdapterOracle BAM offers a JCA-compliant adapter, Oracle BAM Adapter, which J2EE applications can use to send data to Oracle BAM Server. This is the fastest option, and also the most tightly coupled option.
This is the mechanism by which Oracle BPEL Process Manager and the other components in Oracle SOA Suite in Fusion Middleware interact with Oracle BAM Server. Oracle BAM Adapter can communicate with Oracle BAM Server through Enterprise JavaBeans (EJB) (if they are deployed in the same farm), direct Java object invocations (if they are deployed in the same container) or through Web Services (if
Real Time Data Streaming
Introduction to Oracle Business Activity Monitoring 1-3
there is a firewall between them). Oracle BAM Adapter is configured in Oracle WebLogic Server console to provide any of these connection pools.
Oracle BAM Adapter provides three mechanisms by which you can send data to an Oracle BAM Server from your SOA composite application as you develop it in Oracle JDeveloper.
■ The Oracle BAM Adapter can be used as a reference binding component in an SOA composite application.
■ The Oracle BAM Adapter can also be used as a partner link in a BPEL process to send data to Oracle BAM as a step in the process.
■ Oracle BAM sensor actions can be included within a BPEL process to publish event-based data to Oracle BAM data objects.
For more information see Oracle Fusion Middleware Developer's Guide for Oracle SOA Suite.
1.2.2 Direct JMS ConnectivityEnterprise Message Sources (EMS) are used by applications to provide direct Java Message Service (JMS) connectivity to Oracle BAM Server by mapping messages directly to Oracle BAM data objects. Oracle BAM Server can read data directly from any JMS based message queue or topic. This option offers guaranteed messaging.
This option allows basic XSL transformation capability. However, it is recommended to use an Extract, Transform, and Load (ETL) tool, such as Oracle Data Integrator, to perform any rigorous transformations on the data for performance considerations.
The EMS feature does not configure ETL scenarios, but rather maps from a message directly to a data object on Oracle BAM Server; however, you can still use XSL transformations before the data is inserted (updated, upserted, or deleted) into the data object. Each EMS reads from a specific JMS topic or queue and the information is delivered into a data object in Oracle BAM Active Data Cache. The Oracle BAM Architect Web application is used to configure EMS definitions.
For more information see Oracle Fusion Middleware Developer's Guide for Oracle SOA Suite.
1.2.3 Oracle Data IntegratorOracle Data Integrator is the Extract Load Transform (E-LT) tool that is used with Oracle BAM to perform rigorous data transformations. Oracle BAM Server has been implemented as an Oracle Data Integrator technology (for example, DB2, SQL Server are Oracle Data Integrator technologies) and Oracle BAM has Oracle Data Integrator knowledge modules which let Oracle Data Integrator perform all of the operations on Oracle BAM Server to facilitate reading and writing data in various ways, including Changed Data Capture.
For more information about the integration between Oracle Data Integrator and Oracle BAM, see Oracle Fusion Middleware Developer's Guide for Oracle SOA Suite.
1.2.4 Oracle BAM Web ServicesOracle BAM offers a Web Services API to update Oracle BAM data objects. This option is best for non-Java clients, or remote clients that can only access Oracle BAM Server over the Web, and does not offer guaranteed messaging.
External Data Sources
1-4 Oracle Fusion Middleware User's Guide for Oracle Business Activity Monitoring
Oracle BAM Web services allow users to build applications that publish data to Oracle BAM Server for use in real-time charts and dashboards. Any client that can talk to standard Web services can use these APIs to publish data to Oracle BAM. Oracle BAM Web services interfaces allow integration of Oracle BAM with other components such as BPEL Process Manager and ESB, and they facilitate SOA application development. For more information see Oracle Fusion Middleware Developer's Guide for Oracle SOA Suite.
1.3 External Data SourcesIn addition to real-time data streaming, you can load data into Oracle BAM data objects from an external data source (EDS). An EDS is a connection to an external database. EDS definitions usually point to data sources that do not change very much or a data source that is too large to load into the Oracle BAM Active Data Cache. For more information about configuring EDS definitions see Oracle Fusion Middleware Developer's Guide for Oracle SOA Suite.
1.4 Oracle BAM ServerOracle BAM Server is a collection of components that handle incoming data from real time data sources and evaluate conditions for sending alerts to users and launching actions.
Oracle BAM Server consists of the following components:
■ Oracle BAM Active Data Cache
■ Oracle BAM Event Engine
■ Oracle BAM Report Cache
1.4.1 Oracle BAM Active Data CacheOracle BAM Active Data Cache (Oracle BAM ADC) is designed and optimized to handle large amounts of data in a real-time solution. To make data readily accessible and deliverable, it maintains real-time views of the data. The data feed to the Oracle BAM ADC is a combination of business data sources, from data warehouse information to transactional feeds and other enterprise sources. The various data streaming technologies integrated with Oracle BAM send this information to the Oracle BAM ADC in a continuous stream as data changes occur.
The Oracle BAM ADC hosts and runs the data objects, the view sets and the active view sets. It receives transactions (insert, update, delete, and upsert) to its data objects, and these data objects notify other data objects which are linked to them through lookups. Active view sets which are monitoring these data objects are notified of the changes and produce active data.
1.4.2 Oracle BAM Event EngineOracle BAM Event Engine monitors complex data conditions and implements specified rules. Rules can include a series of conditions and actions attached to an event. The Event Engine continuously monitors the information in the Oracle BAM ADC for certain conditions and executes the related actions defined in associated rules.
The Event Engine is responsible for tracking events based on date, time or data changes. The design of the Event Engine uses a satellite concept, in which there are
Oracle BAM Web Applications
Introduction to Oracle Business Activity Monitoring 1-5
four different systems (satellites) which event clauses can be registered with and tracked in.
The Date and Time satellites are both based on a scheduler, and they are used for alerts such as "E-mail a snapshot of this Oracle BAM dashboard to me every morning at 8am."
The Manual satellite is use to manually fire alerts by name (using a Web service call).
The Data satellite (which is really the ViewsetMonitor object in the Oracle BAM ADC's kernel) is used to track alerts that are based on specific changes in the data of a given data object, such as "call this Web Service when SUM(Sales) > 10000 in the MediaSales data object," or "let me know when anything in this dashboard changes."
1.4.3 Oracle BAM Report CacheOracle BAM Report Cache off-loads the burden of maintaining the view set snapshot in memory from the Oracle BAM ADC. The Oracle BAM Report Cache opens view sets and active view sets in the Oracle BAM ADC for the Oracle BAM Report Server (in the Oracle BAM Web Applications set of components). It then caches the snapshot (in chunks) and the active data before sending it to the Oracle BAM Report Server. This allows for random access into the snapshot and recovery from losing internet connectivity. The Oracle BAM Report Cache also allows for the Oracle BAM Report Server to be stateless, and with the Oracle BAM ADC it supports view set sharing.
1.5 Oracle BAM Web ApplicationsOracle BAM Web applications are the user interfaces for creating dashboards and alerts, building the data model, viewing reports, and managing users.
1.5.1 Oracle BAM Start PageThe Oracle BAM start page provides a login screen and access to Oracle BAM Active Viewer, Active Studio, Architect, and Administrator Web applications. See Section 2.2, "Starting Oracle BAM Web Applications" for more information
1.5.2 Oracle BAM Active ViewerOracle BAM Active Viewer is the thin user interface for viewing reports. Active Messenger is client-side notification software. When fresh information is available, the user receives an e-mail that contains a link to the information. The user clicks the link and the report is displayed in Oracle BAM Active Viewer. Report formats include charts, lists, KPIs, crosstabs, spreadsheets, and more. See Section 2.4, "Getting Started With Oracle BAM Active Viewer" for more information.
1.5.3 Oracle BAM Active StudioOracle BAM Active Studio is the thin user interface for the power user. Through Oracle BAM Active Studio, the power user can create and edit reports. Reports can be shared with other users and rules can be created for determining the scheduling and delivery of the reports. Report types include charts, lists, KPIs, crosstabs, spreadsheets, and more. See Section 2.5, "Getting Started With Oracle BAM Active Studio" for more information.
Oracle BAM Data Control
1-6 Oracle Fusion Middleware User's Guide for Oracle Business Activity Monitoring
1.5.4 Oracle BAM ArchitectOracle BAM Architect is the thin user interface for the data designer. Through Oracle BAM Architect, the data designer creates and manages data objects in the Oracle BAM ADC and manages real-time message processing. See Section 2.6, "Getting Started With Oracle BAM Architect" for more information.
1.5.5 Oracle BAM AdministratorOracle BAM Administrator is the thin user interface for the system administrator who is responsible for user management (creating users and roles is separate from managing privileges, and is configured in Oracle WebLogic Server Administration Console). Using Oracle BAM Administrator, the system administrator manages users, object ownership, and security levels, and configures user distribution lists. See Section 2.7, "Getting Started With Oracle BAM Administrator" for more information.
1.5.6 Oracle BAM Report ServerOracle BAM Report Server applies the report definitions to the data sets retrieved from the Oracle BAM ADC for presentation in a browser. It manages information paging for viewing and printing reports. After reports are created, they are stored in the Oracle BAM ADC so that report creation is not repeated each time. Most reporting views are designed to support live, active displays of data changing in real-time.
1.6 Oracle BAM Data ControlThe Oracle BAM Data Control allows ADF developers to build applications with a dynamic user interface that changes based on real-time business events. Oracle BAM Data Control is used to bind data from Oracle BAM data objects to databound UI components in an ADF page. For more information see Oracle Fusion Middleware Developer's Guide for Oracle SOA Suite.
1.7 Oracle BAM AdministrationOracle BAM employs two tools, Oracle Enterprise Manager Fusion Middleware Control and Oracle BAM Administrator, to help you manage Oracle BAM components and users, and configure properties.
Oracle Enterprise Manager Fusion Middleware Control is an enterprise management tool that you can use to administer the deployed Oracle BAM Server and Oracle BAM Web applications described in Section 1.4, "Oracle BAM Server" and Section 1.5, "Oracle BAM Web Applications." Fusion Middleware Control provides dashboards for monitoring performance metrics, accessing logs, and configuring properties.
More information is available in the Oracle Fusion Middleware Administrator's Guide for Oracle SOA Suite and Oracle Business Process Management Suite.
Oracle BAM Administrator is the thin user interface for the system administrator who is responsible for user management. Using Oracle BAM Administrator, the system administrator manages users and security levels, and manages user distribution lists. See Section 2.7, "Getting Started With Oracle BAM Administrator" for more information.
Samples and Tutorials
Introduction to Oracle Business Activity Monitoring 1-7
1.8 ICommandICommand is a command-line utility (and Web service) that provides a set of commands that perform various operations on items in the Oracle BAM ADC. You can use ICommand to export, import, rename, clear, and delete items from Oracle BAM ADC. The commands can be contained in an input XML file, or a single command can be entered on the command line. Informational and error messages may be output to either the command window or to an XML file. For more information see Oracle Fusion Middleware Developer's Guide for Oracle SOA Suite.
1.9 Related DocumentationNot all of the information about Oracle BAM is contained within this guide. The following documents should be consulted for topics not provided in this guide.
Installation instructions are provided in the Oracle Fusion Middleware Installation Guide for Oracle SOA Suite.
Upgrade instructions are provided in the Oracle Fusion Middleware Upgrade Guide for Oracle SOA Suite, WebCenter, and ADF.
Data management topics, such as creating data objects, configuring data streaming technologies, using Oracle BAM Data Controls in ADF, using Oracle BAM Adapter in SOA composite applications (such as BPEL processes), creating alerts, and using ICommand are included in the Oracle Fusion Middleware Developer's Guide for Oracle SOA Suite.
Administration topics, such as property configuration, user management, and performance and log monitoring using Oracle Fusion Middleware Control and Oracle BAM Administrator applications are provided in the Oracle Fusion Middleware Administrator's Guide for Oracle SOA Suite and Oracle Business Process Management Suite.
Migration from a test to production environment is documented in Oracle Fusion Middleware Administrator's Guide.
Performance tuning information for Oracle BAM is available in the Oracle Fusion Middleware Performance and Tuning Guide.
High availability configuration information is provided in the Oracle Fusion Middleware High Availability Guide.
1.10 Samples and TutorialsOracle BAM includes several sample data objects and dashboards to demonstrate its features. Sample files are installed with the Oracle BAM Web applications. If the samples are not installed on your system, the files, installation script, and instructions are located in the SOA_ORACLE_HOME/bam/samples/ directory.
For information about the samples see Section 2.8, "Getting Started With Oracle BAM Samples."
Oracle BAM tutorials with sample files are available for download on the Oracle SOA Suite samples web page.

Samples and Tutorials
1-8 Oracle Fusion Middleware User's Guide for Oracle Business Activity Monitoring
2
Getting Started With Oracle BAM Web Applications 2-1
2Getting Started With Oracle BAM WebApplications
This chapter describes how to start each of the Oracle Business Activity Monitoring (Oracle BAM) Web applications, including Oracle BAM Active Viewer, Architect and Administrator. It describes what you need to configure in the Microsoft Internet Explorer browser for optimal usage with Oracle BAM Web applications, and how to change display preferences and set up report print setup options in Oracle BAM Active Viewer and Studio. Information about where to find Oracle BAM samples is also included.
This chapter contains the following topics:
■ Section 2.1, "Microsoft Internet Explorer Settings"
■ Section 2.2, "Starting Oracle BAM Web Applications"
■ Section 2.3, "Personalizing Oracle BAM Web Applications"
■ Section 2.4, "Getting Started With Oracle BAM Active Viewer"
■ Section 2.5, "Getting Started With Oracle BAM Active Studio"
■ Section 2.6, "Getting Started With Oracle BAM Architect"
■ Section 2.7, "Getting Started With Oracle BAM Administrator"
■ Section 2.8, "Getting Started With Oracle BAM Samples"
2.1 Microsoft Internet Explorer SettingsThe following settings are recommended for your Microsoft Internet Explorer browser:
■ Disable Popup Blockers
■ Open Separate Browser Windows For New URLs
■ Configure Print Settings
■ Disable Browser Caching
■ Hide Address Bar in Oracle BAM Web Applications
Supported browser versions are listed in the support matrix on the Oracle Technology Network Web site at http://www.oracle.com/technetwork/middleware/downloads/fmw-11gr1certmatrix.xls
Microsoft Internet Explorer Settings
2-2 Oracle Fusion Middleware User's Guide for Oracle Business Activity Monitoring
2.1.1 Disable Popup BlockersPopup blockers should be disabled when using Oracle BAM Active Studio.
2.1.2 Open Separate Browser Windows For New URLsAs a default behavior of Microsoft Internet Explorer, if the browser is displaying a Web page, and you click a link in an e-mail or an alert, the page opens in the most recently used browser window. You can change this behavior so that a separate browser window opens each time a link outside of the current browser is clicked.
It is recommended to change this setting if you often have browsers running that should remain open when you click links in e-mails or alerts.
To change the setting to open a separate browser for links in alerts or e-mails:1. In Microsoft Internet Explorer, select Tools > Internet Options.
2. Click the Advanced tab.
3. In the Browsing settings, ensure that the Reuse windows for launching shortcuts checkbox is deselected.
4. Click OK.
2.1.3 Configure Print SettingsBetter quality printing results if the Print background colors and images option is selected, which is not a default setting. This setting provides increased quality printing, especially for Crosstab views.
To change the setting for printing backgrounds:1. In Microsoft Internet Explorer, select Tools > Internet Options.
2. Click the Advanced tab.
3. In the Printing settings, select the Print background colors and images checkbox.
4. Click OK.
2.1.4 Disable Browser CachingTo ensure that the most recent file versions are displayed, set the Microsoft Internet Explorer option to automatically check for updated files.
To change the cached files setting:1. In Microsoft Internet Explorer, select Tools > Internet Options.
2. On the General tab, click Settings (under the Browsing History section in Microsoft Internet Explorer 7).
3. Select Automatically.
4. Click OK.
2.1.5 Hide Address Bar in Oracle BAM Web ApplicationsFor security reasons, in recent versions of Microsoft Internet Explorer, the address bar appears at the top of a browser page for sites within the Internet Zone. You can safely alter your Microsoft Internet Explorer security settings to allow the Oracle BAM Web applications to hide the address bar.
Microsoft Internet Explorer Settings
Getting Started With Oracle BAM Web Applications 2-3
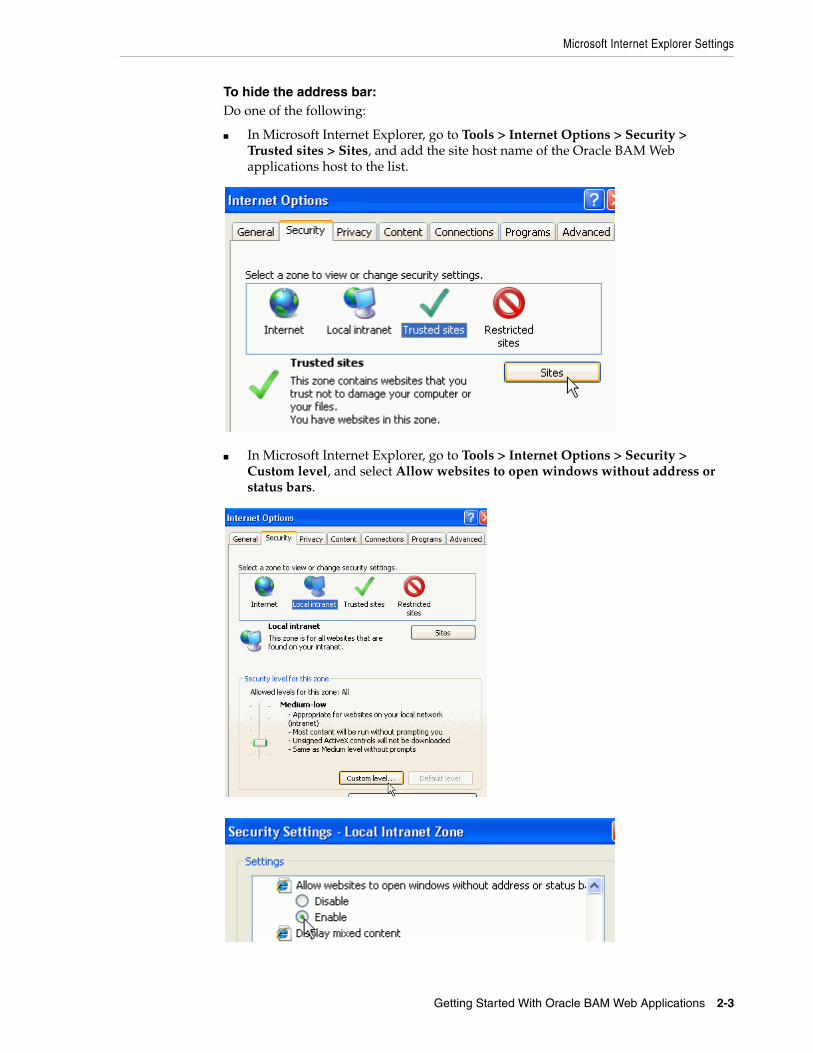
To hide the address bar:Do one of the following:
■ In Microsoft Internet Explorer, go to Tools > Internet Options > Security > Trusted sites > Sites, and add the site host name of the Oracle BAM Web applications host to the list.
■ In Microsoft Internet Explorer, go to Tools > Internet Options > Security > Custom level, and select Allow websites to open windows without address or status bars.
Starting Oracle BAM Web Applications
2-4 Oracle Fusion Middleware User's Guide for Oracle Business Activity Monitoring
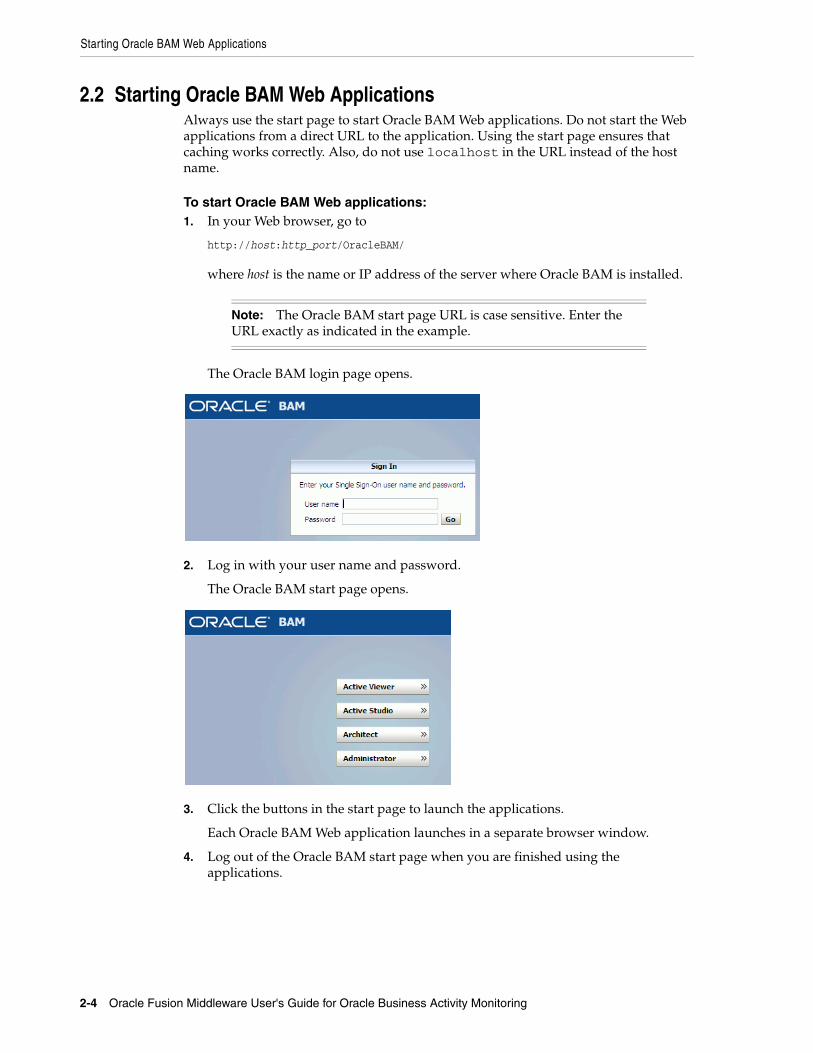
2.2 Starting Oracle BAM Web ApplicationsAlways use the start page to start Oracle BAM Web applications. Do not start the Web applications from a direct URL to the application. Using the start page ensures that caching works correctly. Also, do not use localhost in the URL instead of the host name.
To start Oracle BAM Web applications:1. In your Web browser, go to
http://host:http_port/OracleBAM/
where host is the name or IP address of the server where Oracle BAM is installed.
The Oracle BAM login page opens.
2. Log in with your user name and password.
The Oracle BAM start page opens.
3. Click the buttons in the start page to launch the applications.
Each Oracle BAM Web application launches in a separate browser window.
4. Log out of the Oracle BAM start page when you are finished using the applications.
Note: The Oracle BAM start page URL is case sensitive. Enter the URL exactly as indicated in the example.
Personalizing Oracle BAM Web Applications
Getting Started With Oracle BAM Web Applications 2-5
2.3 Personalizing Oracle BAM Web ApplicationsIn Oracle BAM Active Viewer, Oracle BAM Active Studio, and Oracle BAM Architect, you can configure application settings, such as time zone preferences, report loading indicator, printing options (required), and reports that display in the Home tab (Oracle BAM Active Studio only).
See the following sections for more information:
■ Section 2.3.1, "Configuring Print Setup (Required)"
■ Section 2.3.2, "Configure Time Zone Preferences"
■ Section 2.3.3, "Specifying Report Loading Indicator Settings"
■ Section 2.3.4, "Enabling Oracle BAM Active Studio View Editor Animation"
■ Section 2.3.5, "Selecting a Report for the Oracle BAM Active Studio Home Tab"
2.3.1 Configuring Print Setup (Required)In Oracle BAM Active Viewer and Oracle BAM Active Studio, you must configure report print setup options from the Personalize dialog box. These settings are used for specifying a print layout and paper size used for previewing the print layout.
These settings help you visualize how the report will look when it is printed, but the settings do not control the print settings for your printer. Printer settings must be configured separately.
To configure print previewing options:1. Open the Personalize dialog box.
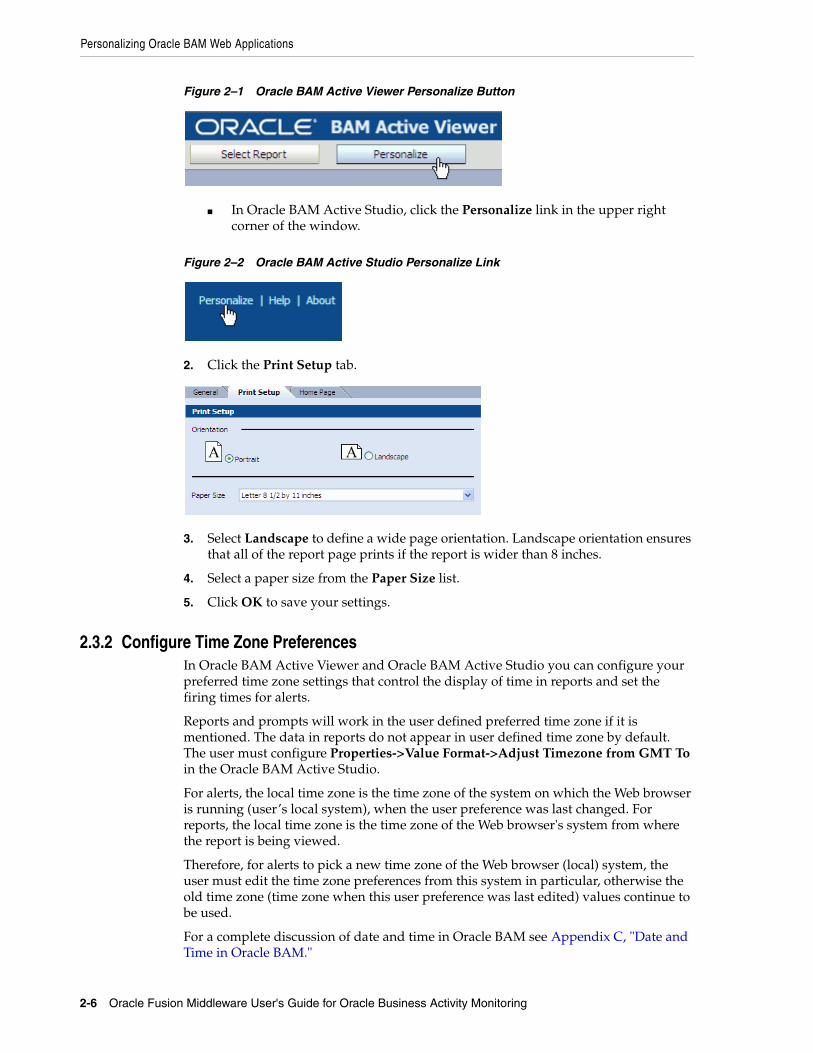
■ In Oracle BAM Active Viewer, click the Personalize button in the toolbar.
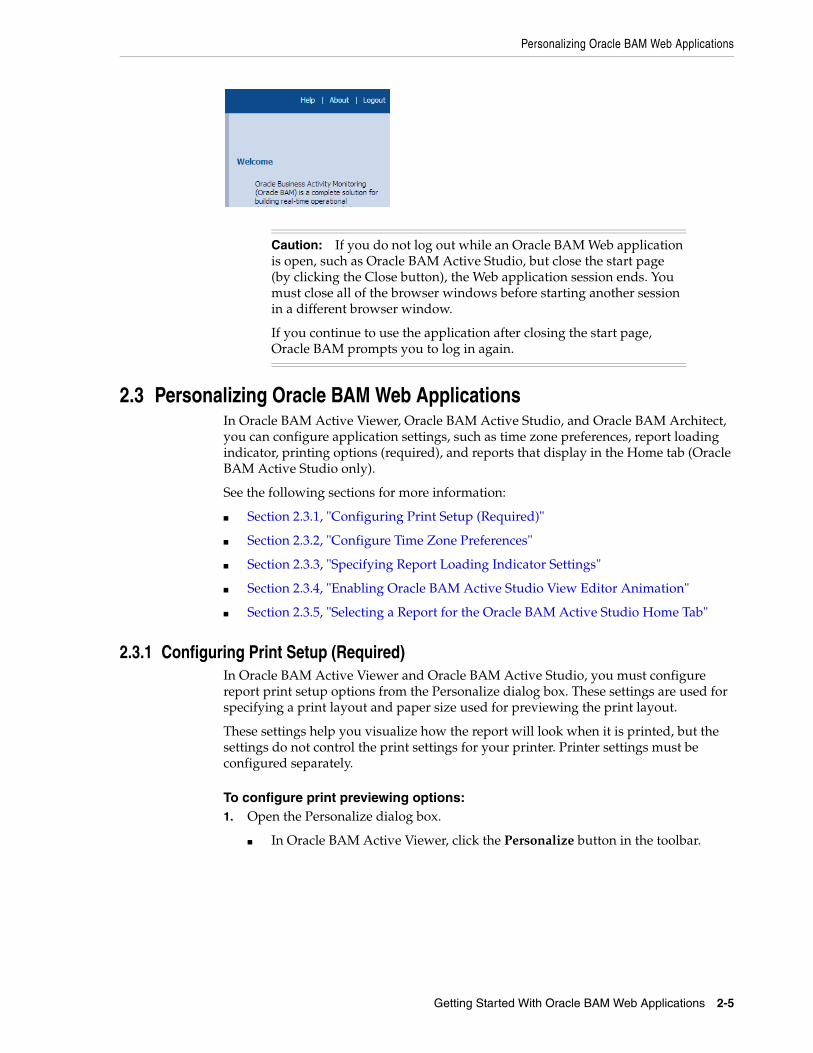
Caution: If you do not log out while an Oracle BAM Web application is open, such as Oracle BAM Active Studio, but close the start page (by clicking the Close button), the Web application session ends. You must close all of the browser windows before starting another session in a different browser window.
If you continue to use the application after closing the start page, Oracle BAM prompts you to log in again.
Personalizing Oracle BAM Web Applications
2-6 Oracle Fusion Middleware User's Guide for Oracle Business Activity Monitoring
Figure 2–1 Oracle BAM Active Viewer Personalize Button
■ In Oracle BAM Active Studio, click the Personalize link in the upper right corner of the window.
Figure 2–2 Oracle BAM Active Studio Personalize Link
2. Click the Print Setup tab.
3. Select Landscape to define a wide page orientation. Landscape orientation ensures that all of the report page prints if the report is wider than 8 inches.
4. Select a paper size from the Paper Size list.
5. Click OK to save your settings.
2.3.2 Configure Time Zone PreferencesIn Oracle BAM Active Viewer and Oracle BAM Active Studio you can configure your preferred time zone settings that control the display of time in reports and set the firing times for alerts.
Reports and prompts will work in the user defined preferred time zone if it is mentioned. The data in reports do not appear in user defined time zone by default. The user must configure Properties->Value Format->Adjust Timezone from GMT To in the Oracle BAM Active Studio.
For alerts, the local time zone is the time zone of the system on which the Web browser is running (user’s local system), when the user preference was last changed. For reports, the local time zone is the time zone of the Web browser's system from where the report is being viewed.
Therefore, for alerts to pick a new time zone of the Web browser (local) system, the user must edit the time zone preferences from this system in particular, otherwise the old time zone (time zone when this user preference was last edited) values continue to be used.
For a complete discussion of date and time in Oracle BAM see Appendix C, "Date and Time in Oracle BAM."
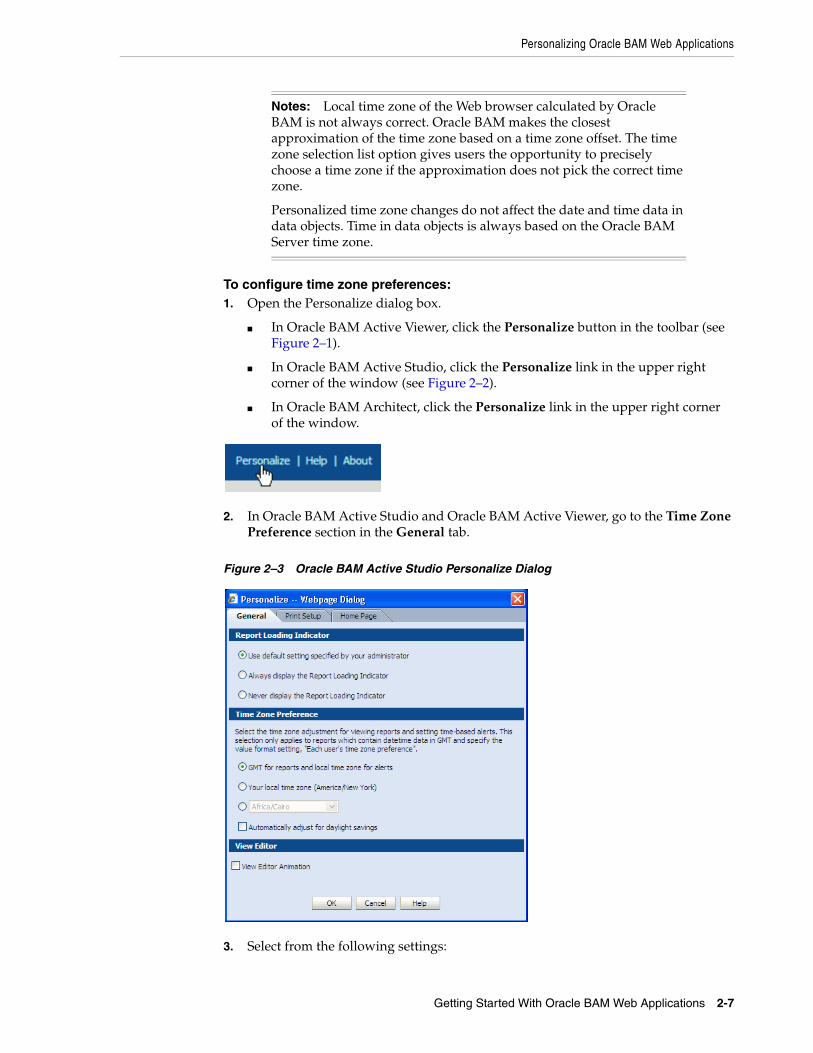
Personalizing Oracle BAM Web Applications
Getting Started With Oracle BAM Web Applications 2-7
To configure time zone preferences:1. Open the Personalize dialog box.
■ In Oracle BAM Active Viewer, click the Personalize button in the toolbar (see Figure 2–1).
■ In Oracle BAM Active Studio, click the Personalize link in the upper right corner of the window (see Figure 2–2).
■ In Oracle BAM Architect, click the Personalize link in the upper right corner of the window.
2. In Oracle BAM Active Studio and Oracle BAM Active Viewer, go to the Time Zone Preference section in the General tab.
Figure 2–3 Oracle BAM Active Studio Personalize Dialog
3. Select from the following settings:
Notes: Local time zone of the Web browser calculated by Oracle BAM is not always correct. Oracle BAM makes the closest approximation of the time zone based on a time zone offset. The time zone selection list option gives users the opportunity to precisely choose a time zone if the approximation does not pick the correct time zone.
Personalized time zone changes do not affect the date and time data in data objects. Time in data objects is always based on the Oracle BAM Server time zone.
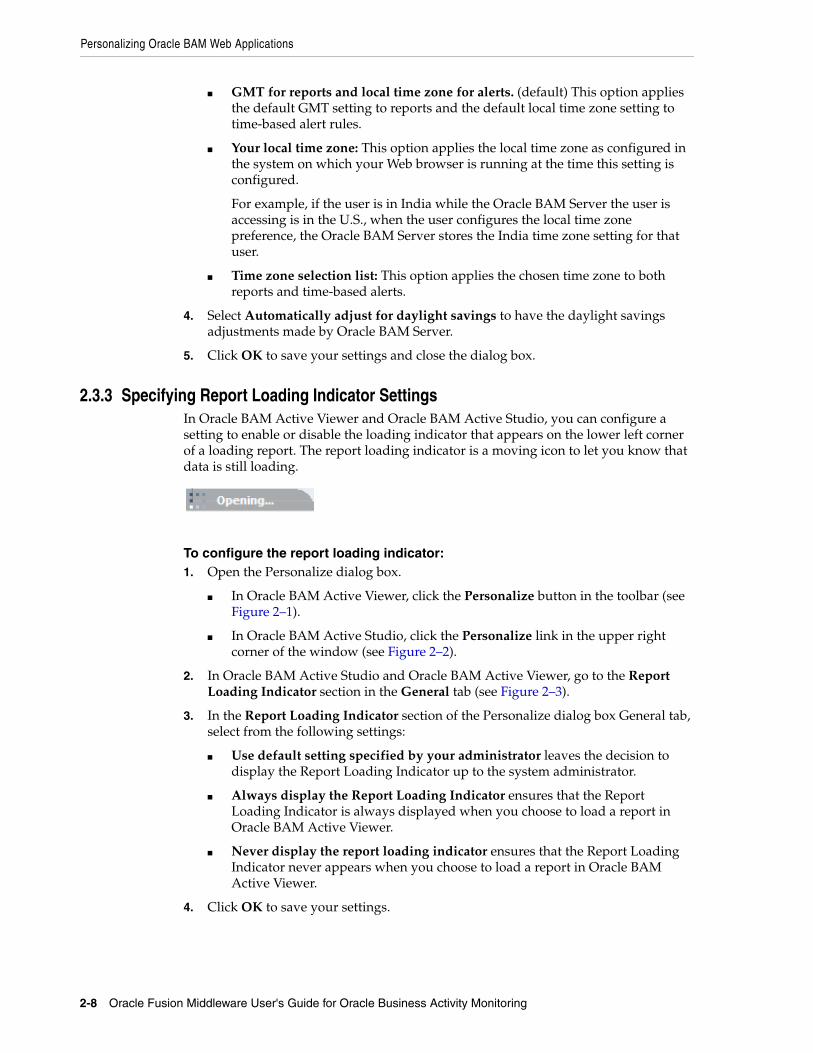
Personalizing Oracle BAM Web Applications
2-8 Oracle Fusion Middleware User's Guide for Oracle Business Activity Monitoring
■ GMT for reports and local time zone for alerts. (default) This option applies the default GMT setting to reports and the default local time zone setting to time-based alert rules.
■ Your local time zone: This option applies the local time zone as configured in the system on which your Web browser is running at the time this setting is configured.
For example, if the user is in India while the Oracle BAM Server the user is accessing is in the U.S., when the user configures the local time zone preference, the Oracle BAM Server stores the India time zone setting for that user.
■ Time zone selection list: This option applies the chosen time zone to both reports and time-based alerts.
4. Select Automatically adjust for daylight savings to have the daylight savings adjustments made by Oracle BAM Server.
5. Click OK to save your settings and close the dialog box.
2.3.3 Specifying Report Loading Indicator SettingsIn Oracle BAM Active Viewer and Oracle BAM Active Studio, you can configure a setting to enable or disable the loading indicator that appears on the lower left corner of a loading report. The report loading indicator is a moving icon to let you know that data is still loading.
To configure the report loading indicator:1. Open the Personalize dialog box.
■ In Oracle BAM Active Viewer, click the Personalize button in the toolbar (see Figure 2–1).
■ In Oracle BAM Active Studio, click the Personalize link in the upper right corner of the window (see Figure 2–2).
2. In Oracle BAM Active Studio and Oracle BAM Active Viewer, go to the Report Loading Indicator section in the General tab (see Figure 2–3).
3. In the Report Loading Indicator section of the Personalize dialog box General tab, select from the following settings:
■ Use default setting specified by your administrator leaves the decision to display the Report Loading Indicator up to the system administrator.
■ Always display the Report Loading Indicator ensures that the Report Loading Indicator is always displayed when you choose to load a report in Oracle BAM Active Viewer.
■ Never display the report loading indicator ensures that the Report Loading Indicator never appears when you choose to load a report in Oracle BAM Active Viewer.
4. Click OK to save your settings.
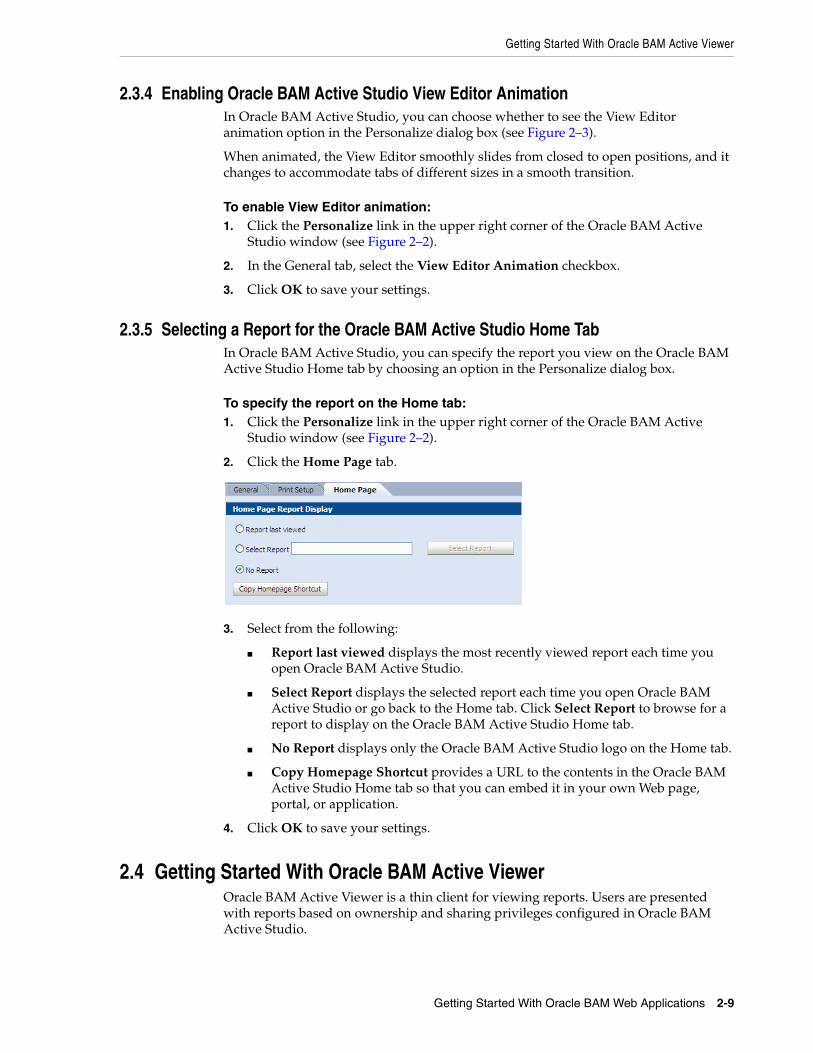
Getting Started With Oracle BAM Active Viewer
Getting Started With Oracle BAM Web Applications 2-9
2.3.4 Enabling Oracle BAM Active Studio View Editor AnimationIn Oracle BAM Active Studio, you can choose whether to see the View Editor animation option in the Personalize dialog box (see Figure 2–3).
When animated, the View Editor smoothly slides from closed to open positions, and it changes to accommodate tabs of different sizes in a smooth transition.
To enable View Editor animation:1. Click the Personalize link in the upper right corner of the Oracle BAM Active
Studio window (see Figure 2–2).
2. In the General tab, select the View Editor Animation checkbox.
3. Click OK to save your settings.
2.3.5 Selecting a Report for the Oracle BAM Active Studio Home TabIn Oracle BAM Active Studio, you can specify the report you view on the Oracle BAM Active Studio Home tab by choosing an option in the Personalize dialog box.
To specify the report on the Home tab:1. Click the Personalize link in the upper right corner of the Oracle BAM Active
Studio window (see Figure 2–2).
2. Click the Home Page tab.
3. Select from the following:
■ Report last viewed displays the most recently viewed report each time you open Oracle BAM Active Studio.
■ Select Report displays the selected report each time you open Oracle BAM Active Studio or go back to the Home tab. Click Select Report to browse for a report to display on the Oracle BAM Active Studio Home tab.
■ No Report displays only the Oracle BAM Active Studio logo on the Home tab.
■ Copy Homepage Shortcut provides a URL to the contents in the Oracle BAM Active Studio Home tab so that you can embed it in your own Web page, portal, or application.
4. Click OK to save your settings.
2.4 Getting Started With Oracle BAM Active ViewerOracle BAM Active Viewer is a thin client for viewing reports. Users are presented with reports based on ownership and sharing privileges configured in Oracle BAM Active Studio.
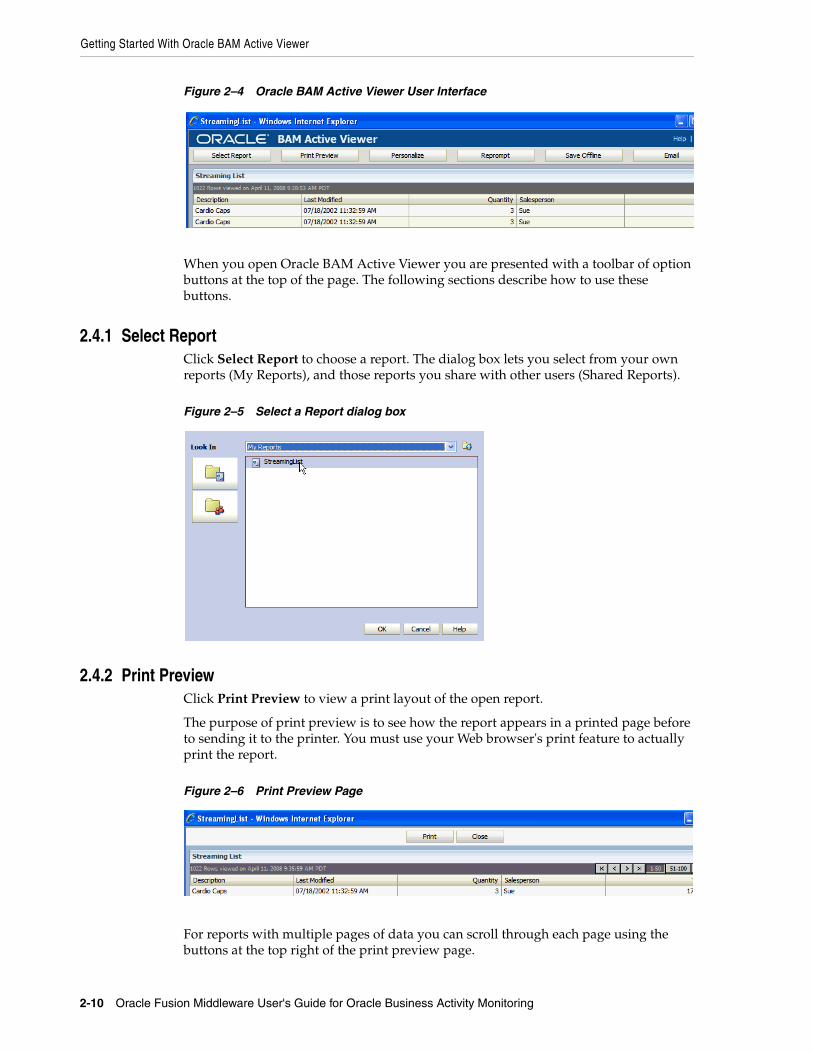
Getting Started With Oracle BAM Active Viewer
2-10 Oracle Fusion Middleware User's Guide for Oracle Business Activity Monitoring
Figure 2–4 Oracle BAM Active Viewer User Interface
When you open Oracle BAM Active Viewer you are presented with a toolbar of option buttons at the top of the page. The following sections describe how to use these buttons.
2.4.1 Select ReportClick Select Report to choose a report. The dialog box lets you select from your own reports (My Reports), and those reports you share with other users (Shared Reports).
Figure 2–5 Select a Report dialog box
2.4.2 Print PreviewClick Print Preview to view a print layout of the open report.
The purpose of print preview is to see how the report appears in a printed page before to sending it to the printer. You must use your Web browser's print feature to actually print the report.
Figure 2–6 Print Preview Page
For reports with multiple pages of data you can scroll through each page using the buttons at the top right of the print preview page.
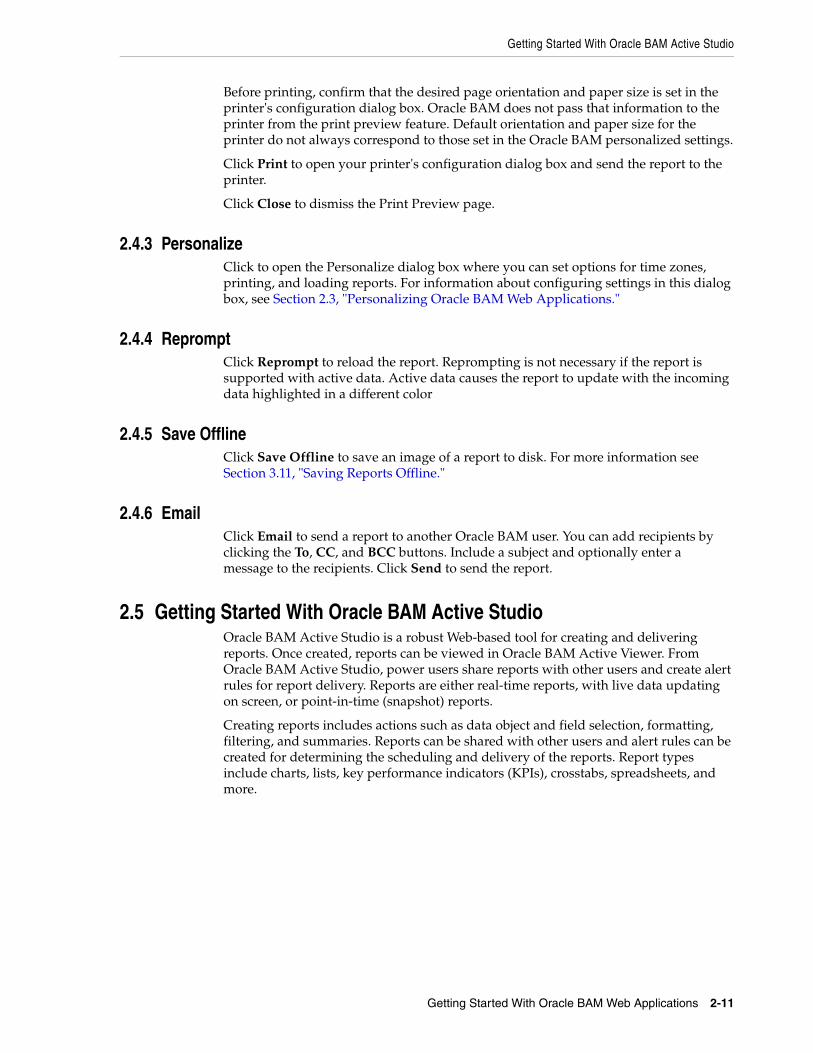
Getting Started With Oracle BAM Active Studio
Getting Started With Oracle BAM Web Applications 2-11
Before printing, confirm that the desired page orientation and paper size is set in the printer's configuration dialog box. Oracle BAM does not pass that information to the printer from the print preview feature. Default orientation and paper size for the printer do not always correspond to those set in the Oracle BAM personalized settings.
Click Print to open your printer's configuration dialog box and send the report to the printer.
Click Close to dismiss the Print Preview page.
2.4.3 PersonalizeClick to open the Personalize dialog box where you can set options for time zones, printing, and loading reports. For information about configuring settings in this dialog box, see Section 2.3, "Personalizing Oracle BAM Web Applications."
2.4.4 RepromptClick Reprompt to reload the report. Reprompting is not necessary if the report is supported with active data. Active data causes the report to update with the incoming data highlighted in a different color
2.4.5 Save OfflineClick Save Offline to save an image of a report to disk. For more information see Section 3.11, "Saving Reports Offline."
2.4.6 EmailClick Email to send a report to another Oracle BAM user. You can add recipients by clicking the To, CC, and BCC buttons. Include a subject and optionally enter a message to the recipients. Click Send to send the report.
2.5 Getting Started With Oracle BAM Active StudioOracle BAM Active Studio is a robust Web-based tool for creating and delivering reports. Once created, reports can be viewed in Oracle BAM Active Viewer. From Oracle BAM Active Studio, power users share reports with other users and create alert rules for report delivery. Reports are either real-time reports, with live data updating on screen, or point-in-time (snapshot) reports.
Creating reports includes actions such as data object and field selection, formatting, filtering, and summaries. Reports can be shared with other users and alert rules can be created for determining the scheduling and delivery of the reports. Report types include charts, lists, key performance indicators (KPIs), crosstabs, spreadsheets, and more.
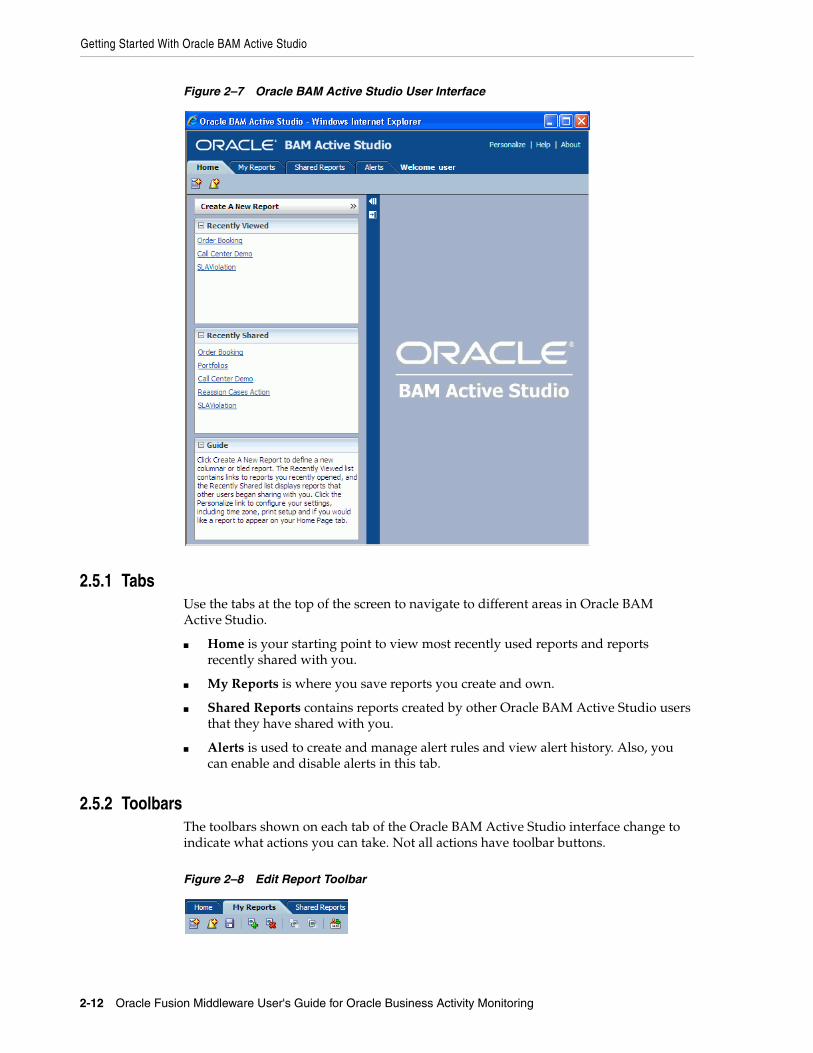
Getting Started With Oracle BAM Active Studio
2-12 Oracle Fusion Middleware User's Guide for Oracle Business Activity Monitoring
Figure 2–7 Oracle BAM Active Studio User Interface
2.5.1 TabsUse the tabs at the top of the screen to navigate to different areas in Oracle BAM Active Studio.
■ Home is your starting point to view most recently used reports and reports recently shared with you.
■ My Reports is where you save reports you create and own.
■ Shared Reports contains reports created by other Oracle BAM Active Studio users that they have shared with you.
■ Alerts is used to create and manage alert rules and view alert history. Also, you can enable and disable alerts in this tab.
2.5.2 ToolbarsThe toolbars shown on each tab of the Oracle BAM Active Studio interface change to indicate what actions you can take. Not all actions have toolbar buttons.
Figure 2–8 Edit Report Toolbar
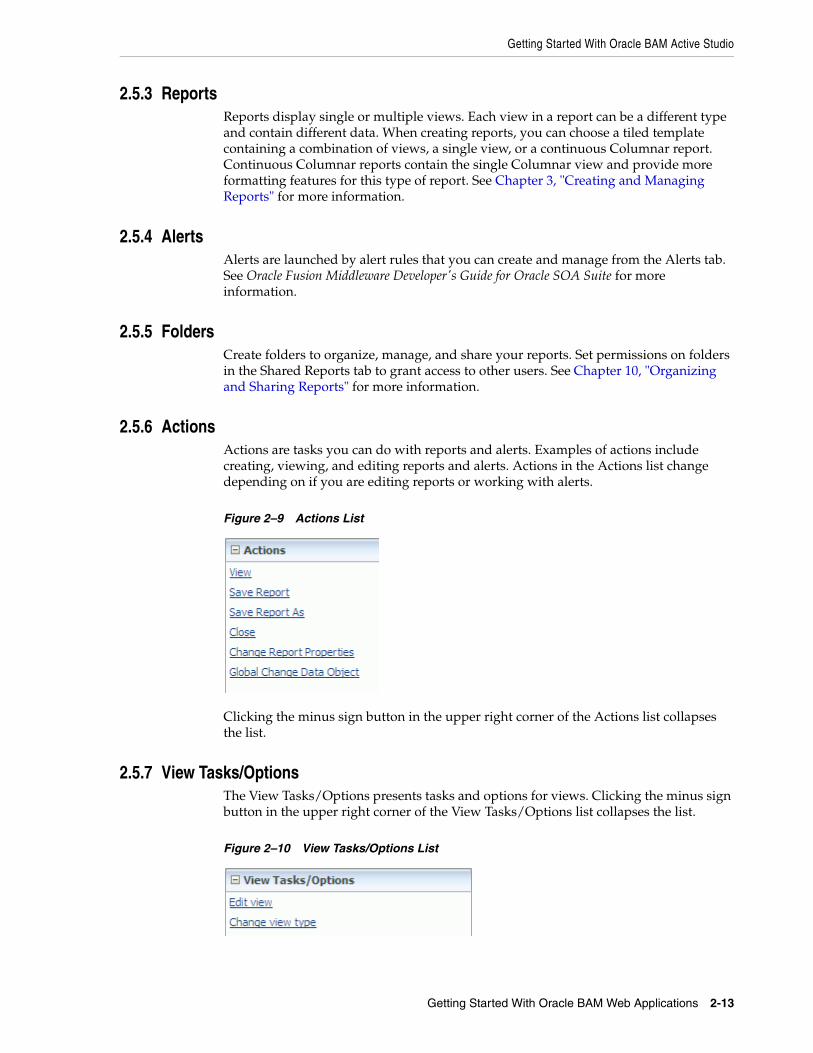
Getting Started With Oracle BAM Active Studio
Getting Started With Oracle BAM Web Applications 2-13
2.5.3 ReportsReports display single or multiple views. Each view in a report can be a different type and contain different data. When creating reports, you can choose a tiled template containing a combination of views, a single view, or a continuous Columnar report. Continuous Columnar reports contain the single Columnar view and provide more formatting features for this type of report. See Chapter 3, "Creating and Managing Reports" for more information.
2.5.4 AlertsAlerts are launched by alert rules that you can create and manage from the Alerts tab. See Oracle Fusion Middleware Developer's Guide for Oracle SOA Suite for more information.
2.5.5 FoldersCreate folders to organize, manage, and share your reports. Set permissions on folders in the Shared Reports tab to grant access to other users. See Chapter 10, "Organizing and Sharing Reports" for more information.
2.5.6 ActionsActions are tasks you can do with reports and alerts. Examples of actions include creating, viewing, and editing reports and alerts. Actions in the Actions list change depending on if you are editing reports or working with alerts.
Figure 2–9 Actions List
Clicking the minus sign button in the upper right corner of the Actions list collapses the list.
2.5.7 View Tasks/OptionsThe View Tasks/Options presents tasks and options for views. Clicking the minus sign button in the upper right corner of the View Tasks/Options list collapses the list.
Figure 2–10 View Tasks/Options List
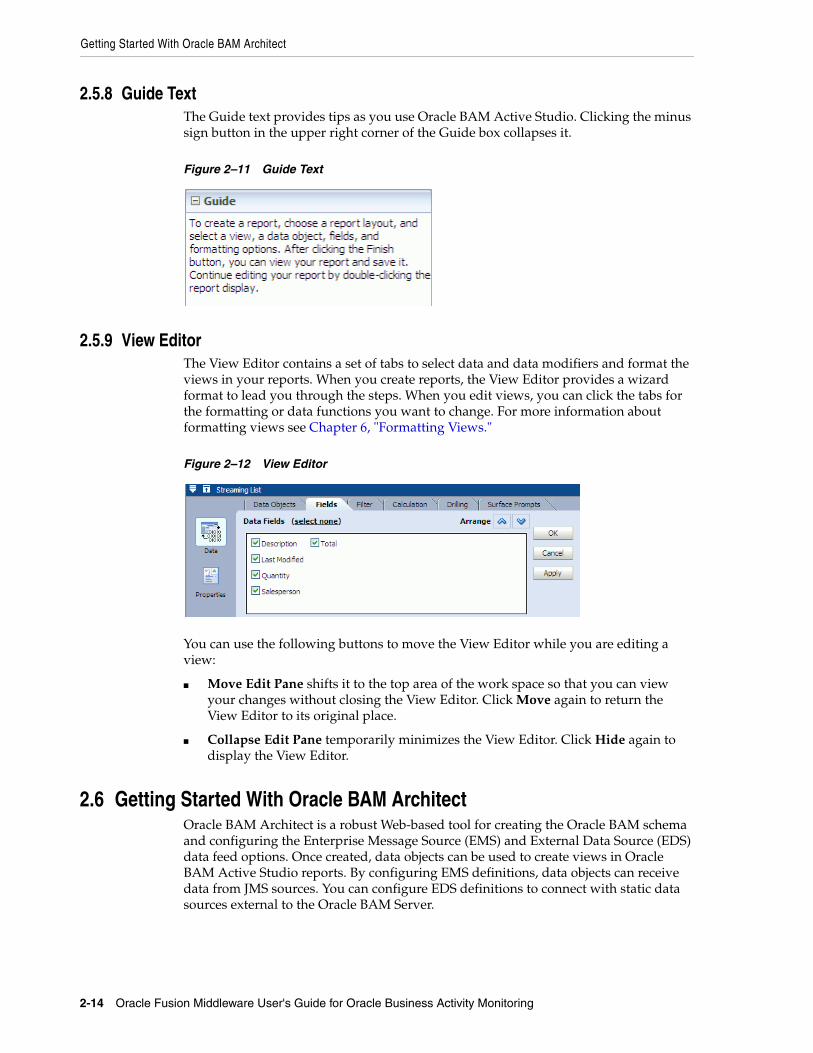
Getting Started With Oracle BAM Architect
2-14 Oracle Fusion Middleware User's Guide for Oracle Business Activity Monitoring
2.5.8 Guide TextThe Guide text provides tips as you use Oracle BAM Active Studio. Clicking the minus sign button in the upper right corner of the Guide box collapses it.
Figure 2–11 Guide Text
2.5.9 View EditorThe View Editor contains a set of tabs to select data and data modifiers and format the views in your reports. When you create reports, the View Editor provides a wizard format to lead you through the steps. When you edit views, you can click the tabs for the formatting or data functions you want to change. For more information about formatting views see Chapter 6, "Formatting Views."
Figure 2–12 View Editor
You can use the following buttons to move the View Editor while you are editing a view:
■ Move Edit Pane shifts it to the top area of the work space so that you can view your changes without closing the View Editor. Click Move again to return the View Editor to its original place.
■ Collapse Edit Pane temporarily minimizes the View Editor. Click Hide again to display the View Editor.
2.6 Getting Started With Oracle BAM ArchitectOracle BAM Architect is a robust Web-based tool for creating the Oracle BAM schema and configuring the Enterprise Message Source (EMS) and External Data Source (EDS) data feed options. Once created, data objects can be used to create views in Oracle BAM Active Studio reports. By configuring EMS definitions, data objects can receive data from JMS sources. You can configure EDS definitions to connect with static data sources external to the Oracle BAM Server.
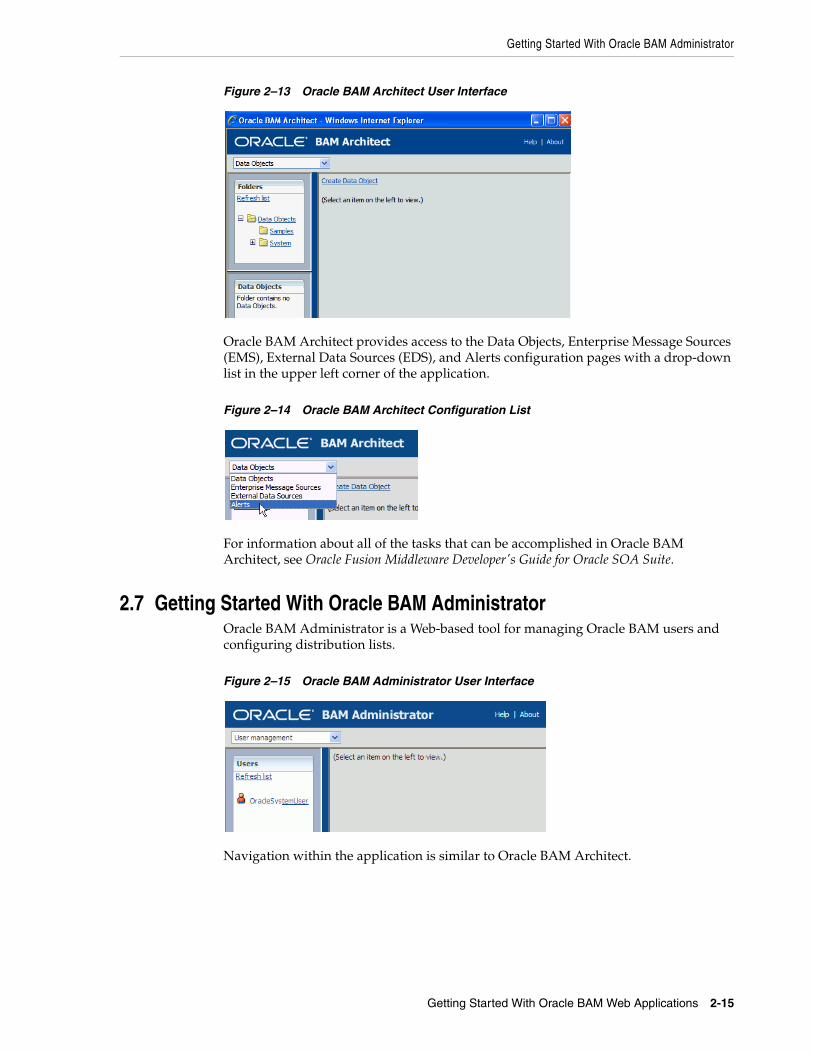
Getting Started With Oracle BAM Administrator
Getting Started With Oracle BAM Web Applications 2-15
Figure 2–13 Oracle BAM Architect User Interface
Oracle BAM Architect provides access to the Data Objects, Enterprise Message Sources (EMS), External Data Sources (EDS), and Alerts configuration pages with a drop-down list in the upper left corner of the application.
Figure 2–14 Oracle BAM Architect Configuration List
For information about all of the tasks that can be accomplished in Oracle BAM Architect, see Oracle Fusion Middleware Developer's Guide for Oracle SOA Suite.
2.7 Getting Started With Oracle BAM AdministratorOracle BAM Administrator is a Web-based tool for managing Oracle BAM users and configuring distribution lists.
Figure 2–15 Oracle BAM Administrator User Interface
Navigation within the application is similar to Oracle BAM Architect.
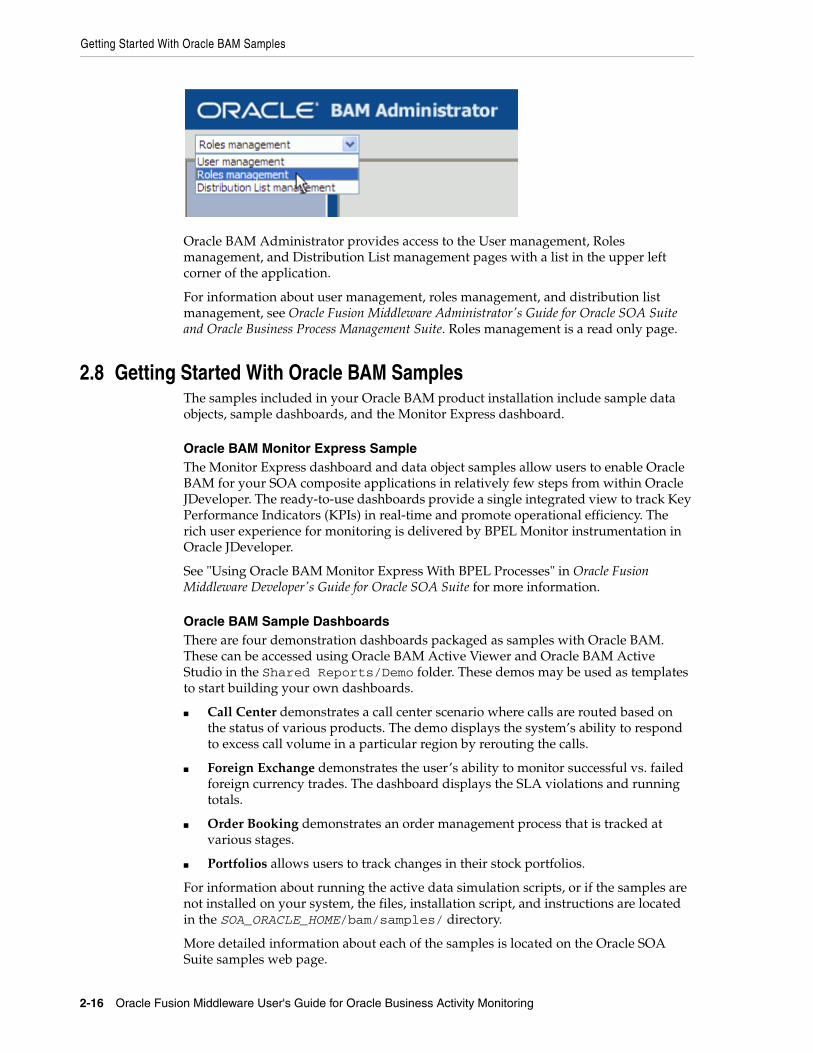
Getting Started With Oracle BAM Samples
2-16 Oracle Fusion Middleware User's Guide for Oracle Business Activity Monitoring
Oracle BAM Administrator provides access to the User management, Roles management, and Distribution List management pages with a list in the upper left corner of the application.
For information about user management, roles management, and distribution list management, see Oracle Fusion Middleware Administrator's Guide for Oracle SOA Suite and Oracle Business Process Management Suite. Roles management is a read only page.
2.8 Getting Started With Oracle BAM SamplesThe samples included in your Oracle BAM product installation include sample data objects, sample dashboards, and the Monitor Express dashboard.
Oracle BAM Monitor Express SampleThe Monitor Express dashboard and data object samples allow users to enable Oracle BAM for your SOA composite applications in relatively few steps from within Oracle JDeveloper. The ready-to-use dashboards provide a single integrated view to track Key Performance Indicators (KPIs) in real-time and promote operational efficiency. The rich user experience for monitoring is delivered by BPEL Monitor instrumentation in Oracle JDeveloper.
See "Using Oracle BAM Monitor Express With BPEL Processes" in Oracle Fusion Middleware Developer's Guide for Oracle SOA Suite for more information.
Oracle BAM Sample DashboardsThere are four demonstration dashboards packaged as samples with Oracle BAM. These can be accessed using Oracle BAM Active Viewer and Oracle BAM Active Studio in the Shared Reports/Demo folder. These demos may be used as templates to start building your own dashboards.
■ Call Center demonstrates a call center scenario where calls are routed based on the status of various products. The demo displays the system’s ability to respond to excess call volume in a particular region by rerouting the calls.
■ Foreign Exchange demonstrates the user’s ability to monitor successful vs. failed foreign currency trades. The dashboard displays the SLA violations and running totals.
■ Order Booking demonstrates an order management process that is tracked at various stages.
■ Portfolios allows users to track changes in their stock portfolios.
For information about running the active data simulation scripts, or if the samples are not installed on your system, the files, installation script, and instructions are located in the SOA_ORACLE_HOME/bam/samples/ directory.
More detailed information about each of the samples is located on the Oracle SOA Suite samples web page.
Getting Started With Oracle BAM Samples
Getting Started With Oracle BAM Web Applications 2-17
Sample Data ObjectsSeveral sample data objects are provided with Oracle BAM so that you can learn to use a feature with sample data. These sample data objects are used throughout the Oracle BAM documentation when demonstrating the use of a feature.

Getting Started With Oracle BAM Samples
2-18 Oracle Fusion Middleware User's Guide for Oracle Business Activity Monitoring
3
Creating and Managing Reports 3-1
3Creating and Managing Reports
This chapter describes how to create various reports in Oracle Business Activity Monitoring (Oracle BAM) Active Studio including tiled and columnar reports and how to use some of the options available when designing and formatting the reports. It describes how to modify the data objects used in reports, how to set a time delay for active data retrieval in reports, and how to configure reports to use poll mode.
This chapter contains the following topics:
■ Section 3.1, "Introduction to Report Creation and Delivery"
■ Section 3.2, "Creating Tiled Reports"
■ Section 3.3, "Creating Columnar Reports"
■ Section 3.4, "Saving Reports"
■ Section 3.5, "Renaming Reports"
■ Section 3.6, "Editing Reports"
■ Section 3.7, "Deleting Reports"
■ Section 3.8, "E-mailing Reports"
■ Section 3.9, "Printing Reports"
■ Section 3.10, "Copying Report URLs"
■ Section 3.11, "Saving Reports Offline"
■ Section 3.12, "Viewing Reports"
■ Section 3.13, "Responding to Report Prompts"
■ Section 3.14, "Pausing and Playing Active Data"
■ Section 3.15, "Adding Oracle BAM Reports to Web Pages"
3.1 Introduction to Report Creation and DeliveryYou create reports in Oracle BAM Active Studio for viewing, sharing with other users, and for delivery by alerts based on information or conditions changing within the report or data objects on which it is based. Reports can contain one or more views of point-in-time or real-time information (active data). Active data means the display continues to update as the data changes are received in the Oracle BAM Active Data Cache.
When designing reports, you can choose from a variety of template layouts. You might want to include two or more views in a single report. Each view is formatted to show information from a data object in a view type such as a list, chart, or key process
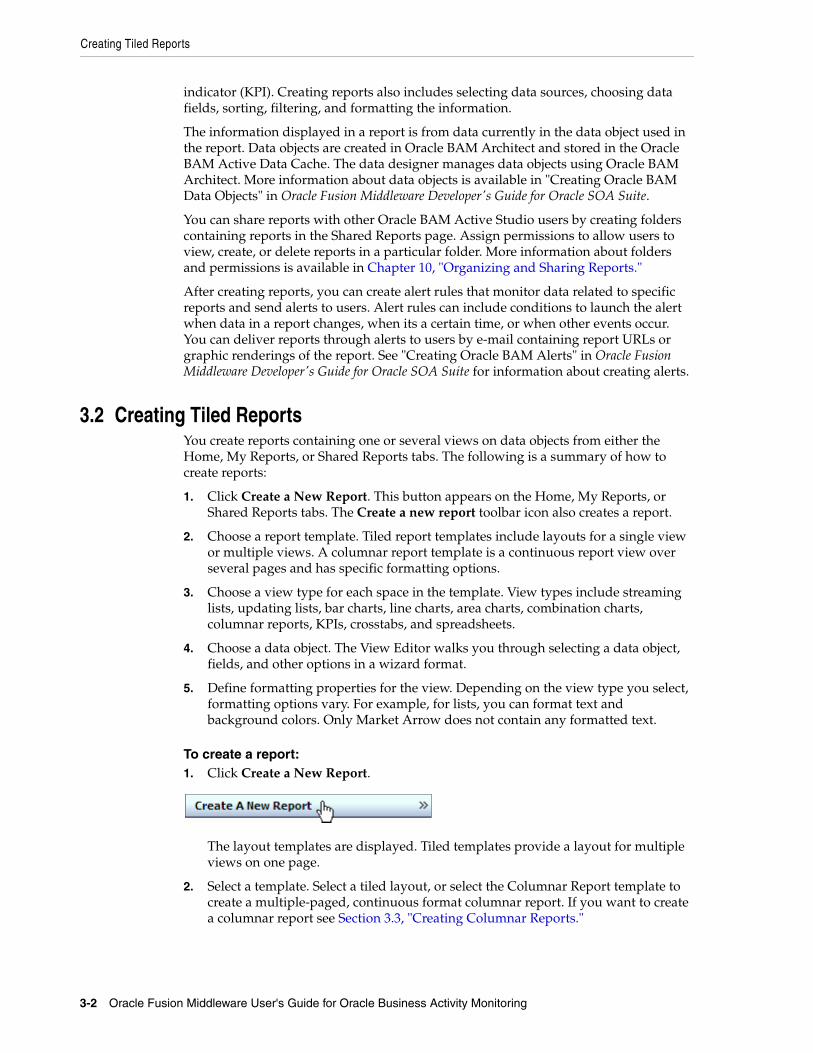
Creating Tiled Reports
3-2 Oracle Fusion Middleware User's Guide for Oracle Business Activity Monitoring
indicator (KPI). Creating reports also includes selecting data sources, choosing data fields, sorting, filtering, and formatting the information.
The information displayed in a report is from data currently in the data object used in the report. Data objects are created in Oracle BAM Architect and stored in the Oracle BAM Active Data Cache. The data designer manages data objects using Oracle BAM Architect. More information about data objects is available in "Creating Oracle BAM Data Objects" in Oracle Fusion Middleware Developer's Guide for Oracle SOA Suite.
You can share reports with other Oracle BAM Active Studio users by creating folders containing reports in the Shared Reports page. Assign permissions to allow users to view, create, or delete reports in a particular folder. More information about folders and permissions is available in Chapter 10, "Organizing and Sharing Reports."
After creating reports, you can create alert rules that monitor data related to specific reports and send alerts to users. Alert rules can include conditions to launch the alert when data in a report changes, when its a certain time, or when other events occur. You can deliver reports through alerts to users by e-mail containing report URLs or graphic renderings of the report. See "Creating Oracle BAM Alerts" in Oracle Fusion Middleware Developer's Guide for Oracle SOA Suite for information about creating alerts.
3.2 Creating Tiled ReportsYou create reports containing one or several views on data objects from either the Home, My Reports, or Shared Reports tabs. The following is a summary of how to create reports:
1. Click Create a New Report. This button appears on the Home, My Reports, or Shared Reports tabs. The Create a new report toolbar icon also creates a report.
2. Choose a report template. Tiled report templates include layouts for a single view or multiple views. A columnar report template is a continuous report view over several pages and has specific formatting options.
3. Choose a view type for each space in the template. View types include streaming lists, updating lists, bar charts, line charts, area charts, combination charts, columnar reports, KPIs, crosstabs, and spreadsheets.
4. Choose a data object. The View Editor walks you through selecting a data object, fields, and other options in a wizard format.
5. Define formatting properties for the view. Depending on the view type you select, formatting options vary. For example, for lists, you can format text and background colors. Only Market Arrow does not contain any formatted text.
To create a report:1. Click Create a New Report.
The layout templates are displayed. Tiled templates provide a layout for multiple views on one page.
2. Select a template. Select a tiled layout, or select the Columnar Report template to create a multiple-paged, continuous format columnar report. If you want to create a columnar report see Section 3.3, "Creating Columnar Reports."
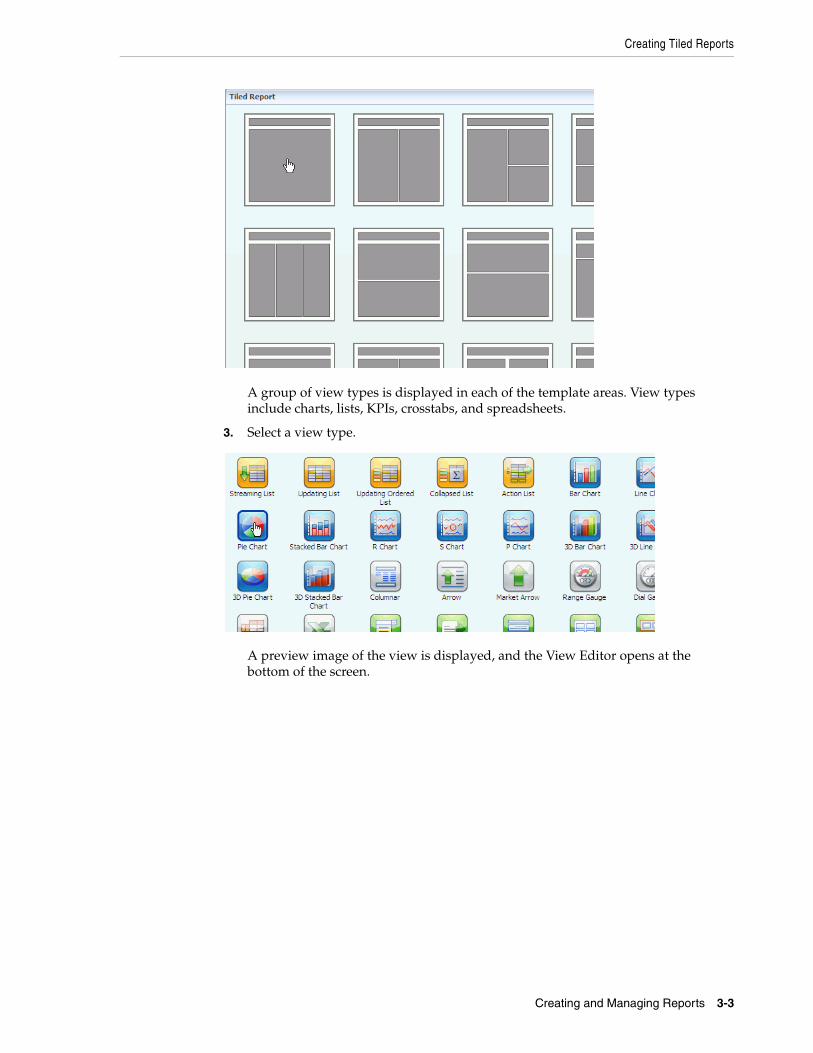
Creating Tiled Reports
Creating and Managing Reports 3-3
A group of view types is displayed in each of the template areas. View types include charts, lists, KPIs, crosstabs, and spreadsheets.
3. Select a view type.
A preview image of the view is displayed, and the View Editor opens at the bottom of the screen.
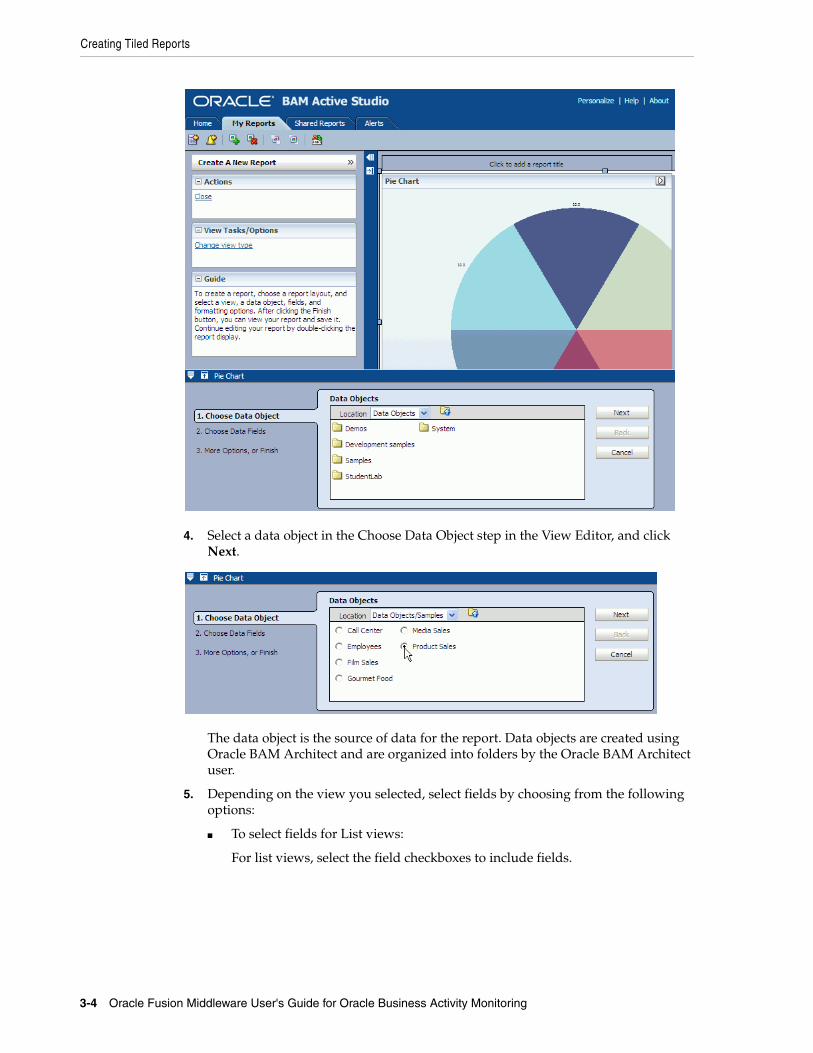
Creating Tiled Reports
3-4 Oracle Fusion Middleware User's Guide for Oracle Business Activity Monitoring
4. Select a data object in the Choose Data Object step in the View Editor, and click Next.
The data object is the source of data for the report. Data objects are created using Oracle BAM Architect and are organized into folders by the Oracle BAM Architect user.
5. Depending on the view you selected, select fields by choosing from the following options:
■ To select fields for List views:
For list views, select the field checkboxes to include fields.
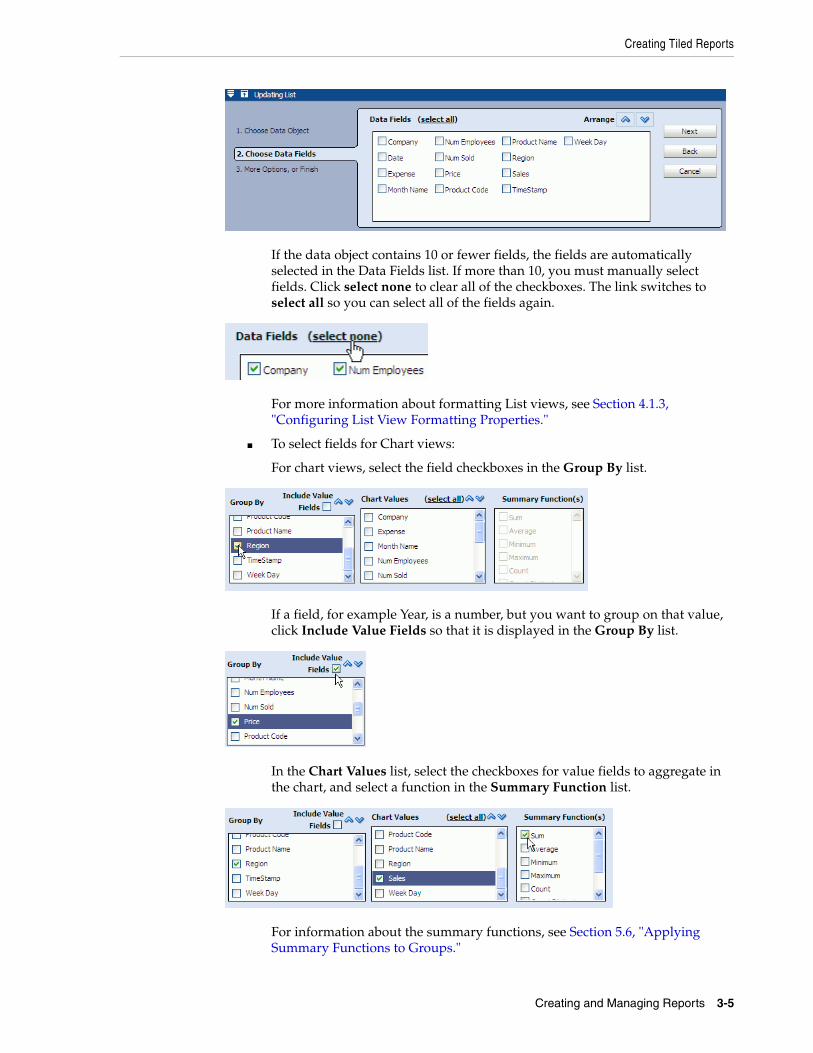
Creating Tiled Reports
Creating and Managing Reports 3-5
If the data object contains 10 or fewer fields, the fields are automatically selected in the Data Fields list. If more than 10, you must manually select fields. Click select none to clear all of the checkboxes. The link switches to select all so you can select all of the fields again.
For more information about formatting List views, see Section 4.1.3, "Configuring List View Formatting Properties."
■ To select fields for Chart views:
For chart views, select the field checkboxes in the Group By list.
If a field, for example Year, is a number, but you want to group on that value, click Include Value Fields so that it is displayed in the Group By list.
In the Chart Values list, select the checkboxes for value fields to aggregate in the chart, and select a function in the Summary Function list.
For information about the summary functions, see Section 5.6, "Applying Summary Functions to Groups."
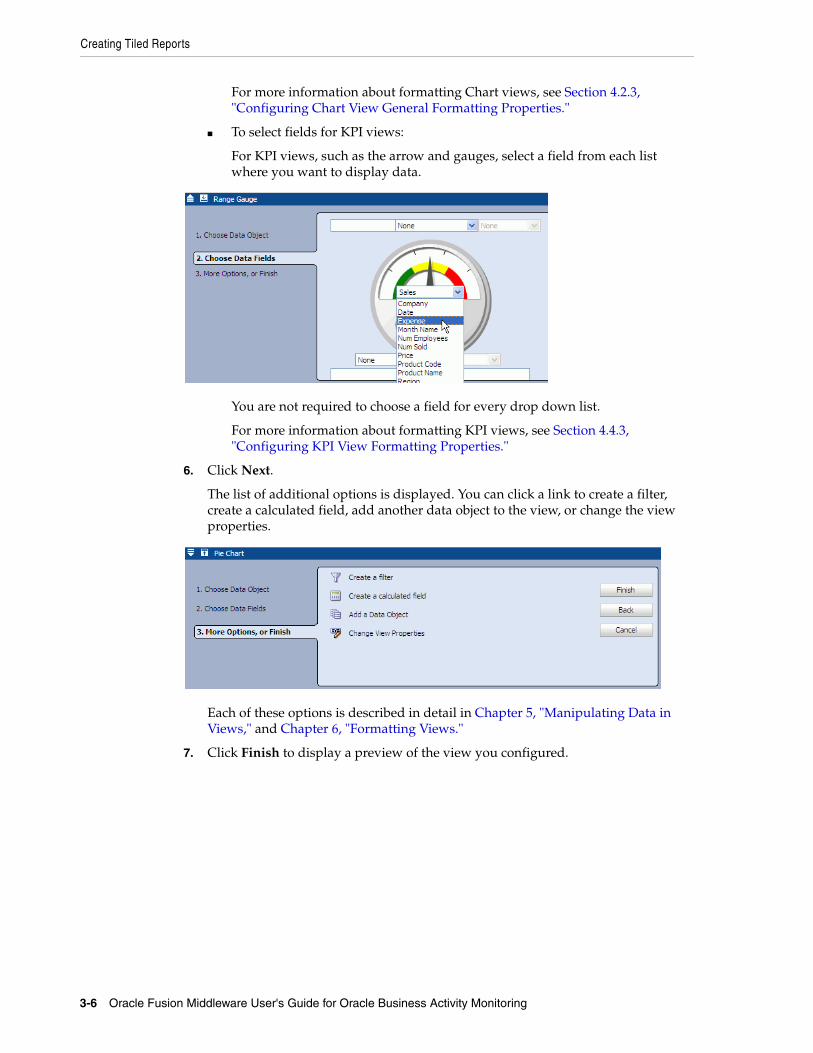
Creating Tiled Reports
3-6 Oracle Fusion Middleware User's Guide for Oracle Business Activity Monitoring
For more information about formatting Chart views, see Section 4.2.3, "Configuring Chart View General Formatting Properties."
■ To select fields for KPI views:
For KPI views, such as the arrow and gauges, select a field from each list where you want to display data.
You are not required to choose a field for every drop down list.
For more information about formatting KPI views, see Section 4.4.3, "Configuring KPI View Formatting Properties."
6. Click Next.
The list of additional options is displayed. You can click a link to create a filter, create a calculated field, add another data object to the view, or change the view properties.
Each of these options is described in detail in Chapter 5, "Manipulating Data in Views," and Chapter 6, "Formatting Views."
7. Click Finish to display a preview of the view you configured.
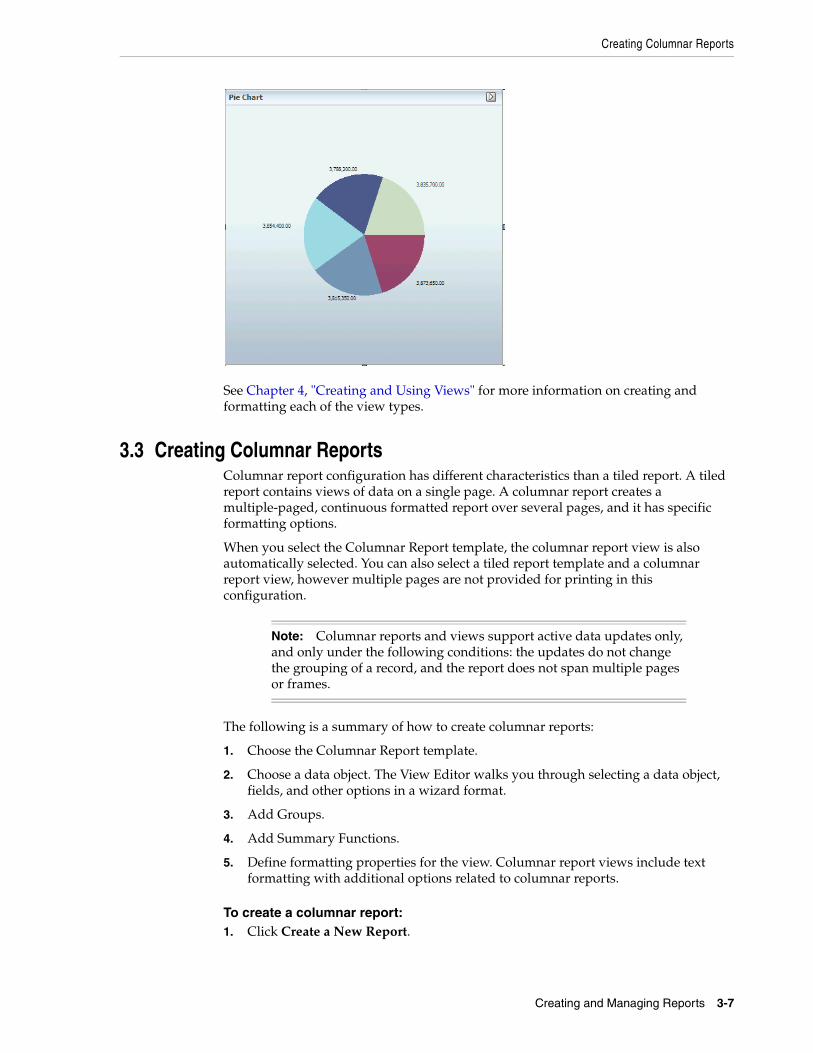
Creating Columnar Reports
Creating and Managing Reports 3-7
See Chapter 4, "Creating and Using Views" for more information on creating and formatting each of the view types.
3.3 Creating Columnar ReportsColumnar report configuration has different characteristics than a tiled report. A tiled report contains views of data on a single page. A columnar report creates a multiple-paged, continuous formatted report over several pages, and it has specific formatting options.
When you select the Columnar Report template, the columnar report view is also automatically selected. You can also select a tiled report template and a columnar report view, however multiple pages are not provided for printing in this configuration.
The following is a summary of how to create columnar reports:
1. Choose the Columnar Report template.
2. Choose a data object. The View Editor walks you through selecting a data object, fields, and other options in a wizard format.
3. Add Groups.
4. Add Summary Functions.
5. Define formatting properties for the view. Columnar report views include text formatting with additional options related to columnar reports.
To create a columnar report:1. Click Create a New Report.
Note: Columnar reports and views support active data updates only, and only under the following conditions: the updates do not change the grouping of a record, and the report does not span multiple pages or frames.
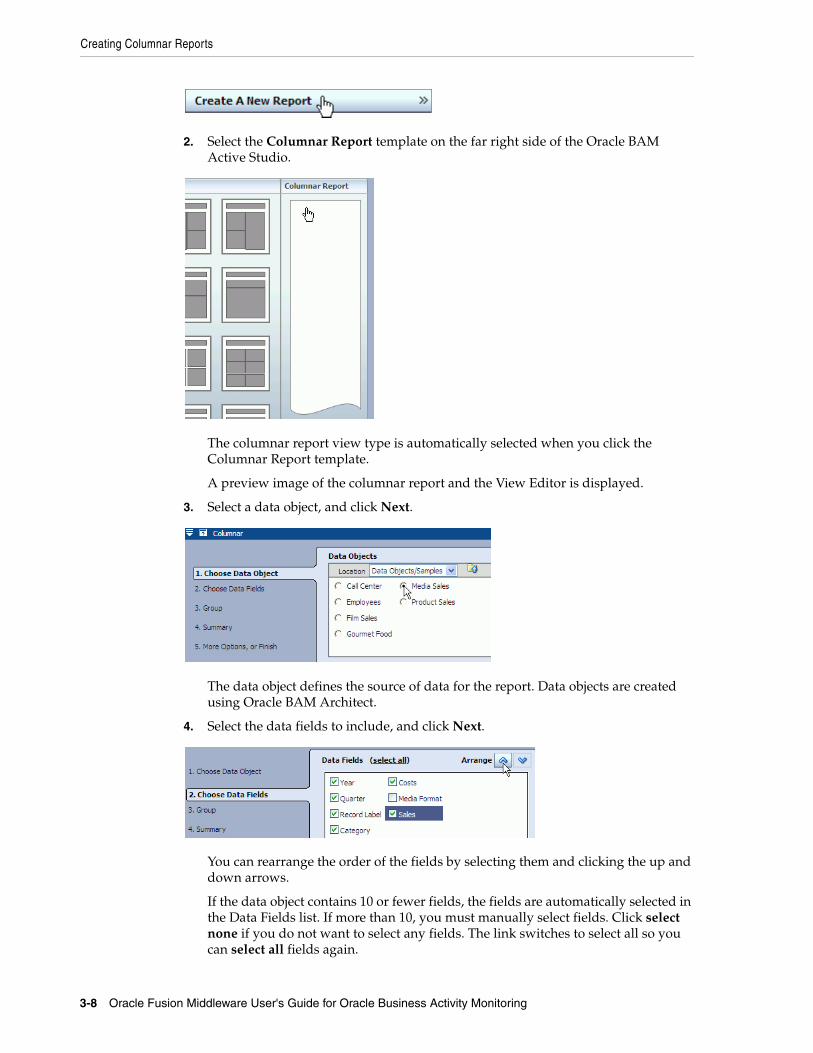
Creating Columnar Reports
3-8 Oracle Fusion Middleware User's Guide for Oracle Business Activity Monitoring
2. Select the Columnar Report template on the far right side of the Oracle BAM Active Studio.
The columnar report view type is automatically selected when you click the Columnar Report template.
A preview image of the columnar report and the View Editor is displayed.
3. Select a data object, and click Next.
The data object defines the source of data for the report. Data objects are created using Oracle BAM Architect.
4. Select the data fields to include, and click Next.
You can rearrange the order of the fields by selecting them and clicking the up and down arrows.
If the data object contains 10 or fewer fields, the fields are automatically selected in the Data Fields list. If more than 10, you must manually select fields. Click select none if you do not want to select any fields. The link switches to select all so you can select all fields again.
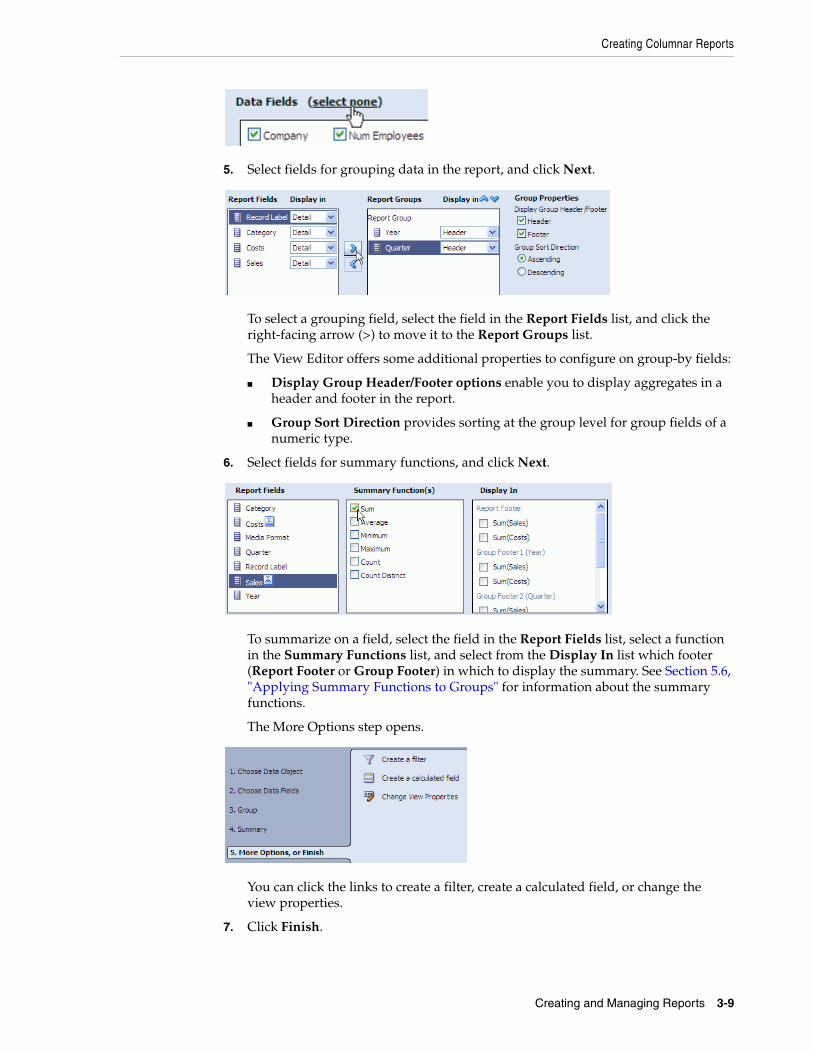
Creating Columnar Reports
Creating and Managing Reports 3-9
5. Select fields for grouping data in the report, and click Next.
To select a grouping field, select the field in the Report Fields list, and click the right-facing arrow (>) to move it to the Report Groups list.
The View Editor offers some additional properties to configure on group-by fields:
■ Display Group Header/Footer options enable you to display aggregates in a header and footer in the report.
■ Group Sort Direction provides sorting at the group level for group fields of a numeric type.
6. Select fields for summary functions, and click Next.
To summarize on a field, select the field in the Report Fields list, select a function in the Summary Functions list, and select from the Display In list which footer (Report Footer or Group Footer) in which to display the summary. See Section 5.6, "Applying Summary Functions to Groups" for information about the summary functions.
The More Options step opens.
You can click the links to create a filter, create a calculated field, or change the view properties.
7. Click Finish.
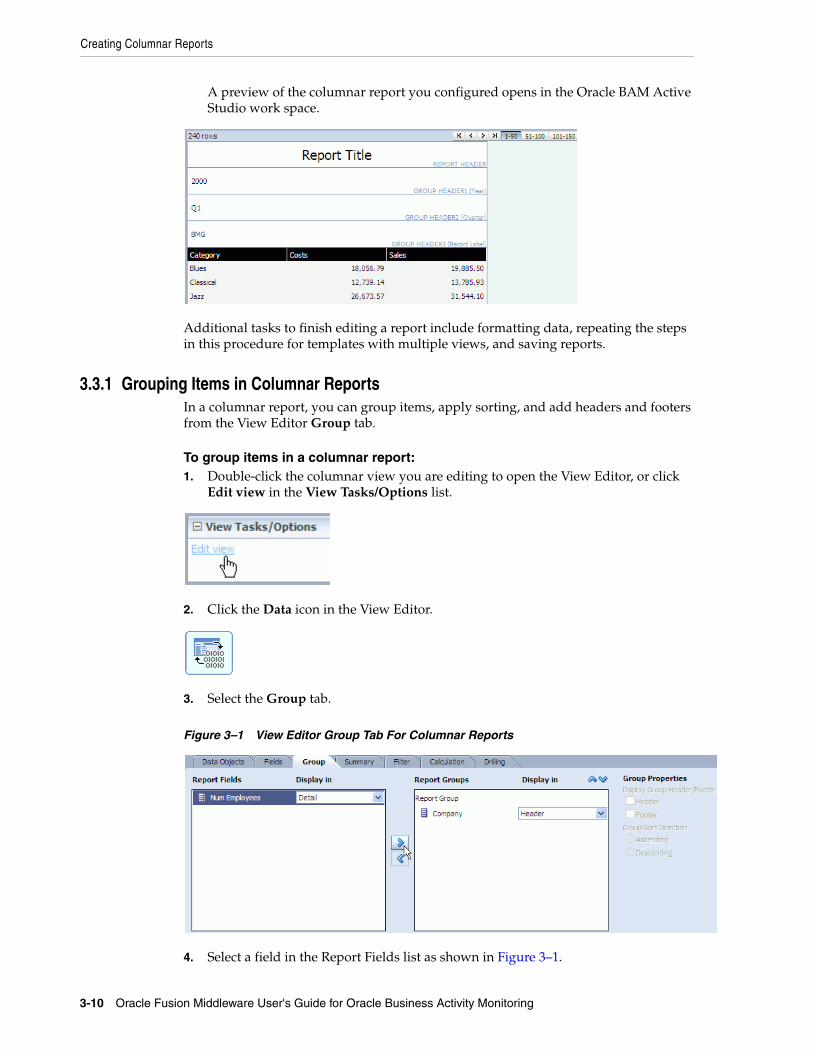
Creating Columnar Reports
3-10 Oracle Fusion Middleware User's Guide for Oracle Business Activity Monitoring
A preview of the columnar report you configured opens in the Oracle BAM Active Studio work space.
Additional tasks to finish editing a report include formatting data, repeating the steps in this procedure for templates with multiple views, and saving reports.
3.3.1 Grouping Items in Columnar ReportsIn a columnar report, you can group items, apply sorting, and add headers and footers from the View Editor Group tab.
To group items in a columnar report:1. Double-click the columnar view you are editing to open the View Editor, or click
Edit view in the View Tasks/Options list.
2. Click the Data icon in the View Editor.
3. Select the Group tab.
Figure 3–1 View Editor Group Tab For Columnar Reports
4. Select a field in the Report Fields list as shown in Figure 3–1.
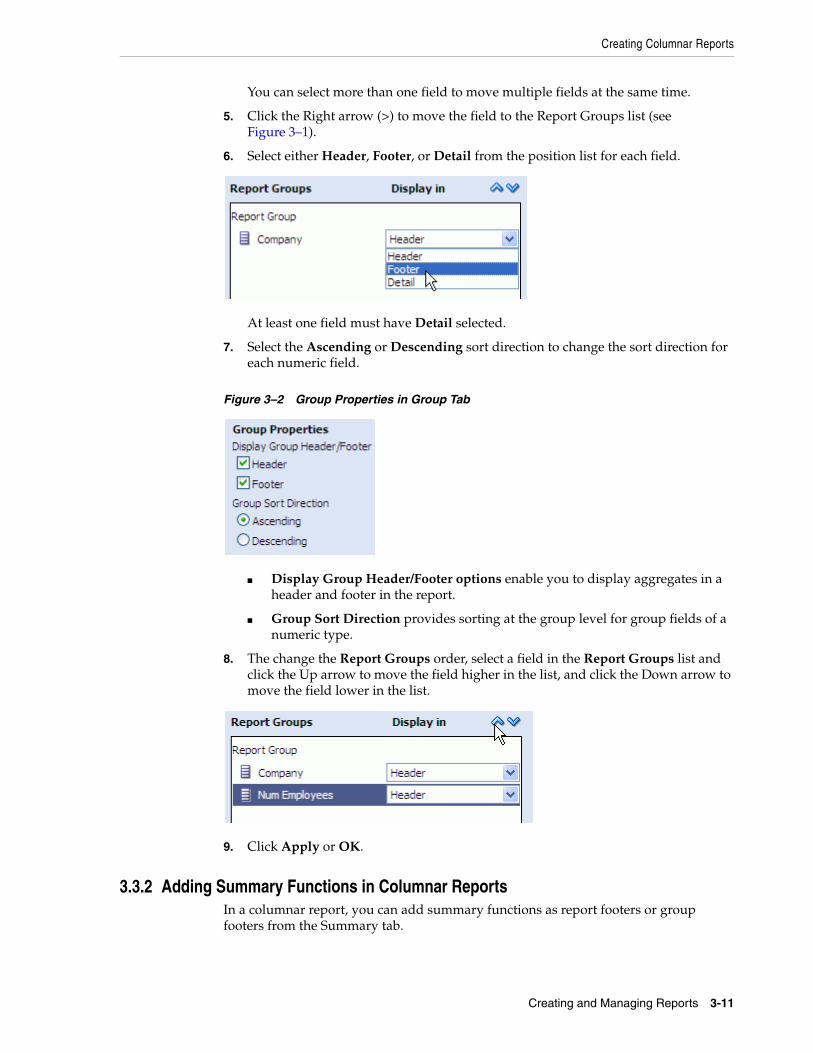
Creating Columnar Reports
Creating and Managing Reports 3-11
You can select more than one field to move multiple fields at the same time.
5. Click the Right arrow (>) to move the field to the Report Groups list (see Figure 3–1).
6. Select either Header, Footer, or Detail from the position list for each field.
At least one field must have Detail selected.
7. Select the Ascending or Descending sort direction to change the sort direction for each numeric field.
Figure 3–2 Group Properties in Group Tab
■ Display Group Header/Footer options enable you to display aggregates in a header and footer in the report.
■ Group Sort Direction provides sorting at the group level for group fields of a numeric type.
8. The change the Report Groups order, select a field in the Report Groups list and click the Up arrow to move the field higher in the list, and click the Down arrow to move the field lower in the list.
9. Click Apply or OK.
3.3.2 Adding Summary Functions in Columnar ReportsIn a columnar report, you can add summary functions as report footers or group footers from the Summary tab.
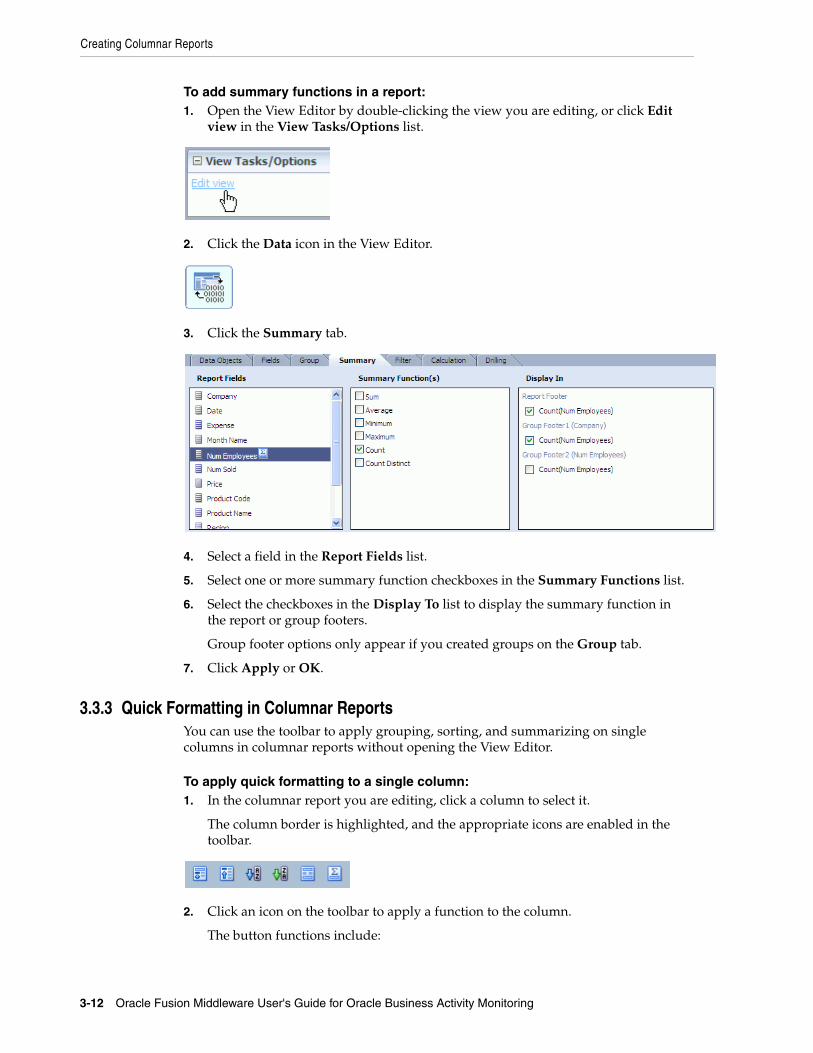
Creating Columnar Reports
3-12 Oracle Fusion Middleware User's Guide for Oracle Business Activity Monitoring
To add summary functions in a report:1. Open the View Editor by double-clicking the view you are editing, or click Edit
view in the View Tasks/Options list.
2. Click the Data icon in the View Editor.
3. Click the Summary tab.
4. Select a field in the Report Fields list.
5. Select one or more summary function checkboxes in the Summary Functions list.
6. Select the checkboxes in the Display To list to display the summary function in the report or group footers.
Group footer options only appear if you created groups on the Group tab.
7. Click Apply or OK.
3.3.3 Quick Formatting in Columnar ReportsYou can use the toolbar to apply grouping, sorting, and summarizing on single columns in columnar reports without opening the View Editor.
To apply quick formatting to a single column:1. In the columnar report you are editing, click a column to select it.
The column border is highlighted, and the appropriate icons are enabled in the toolbar.
2. Click an icon on the toolbar to apply a function to the column.
The button functions include:
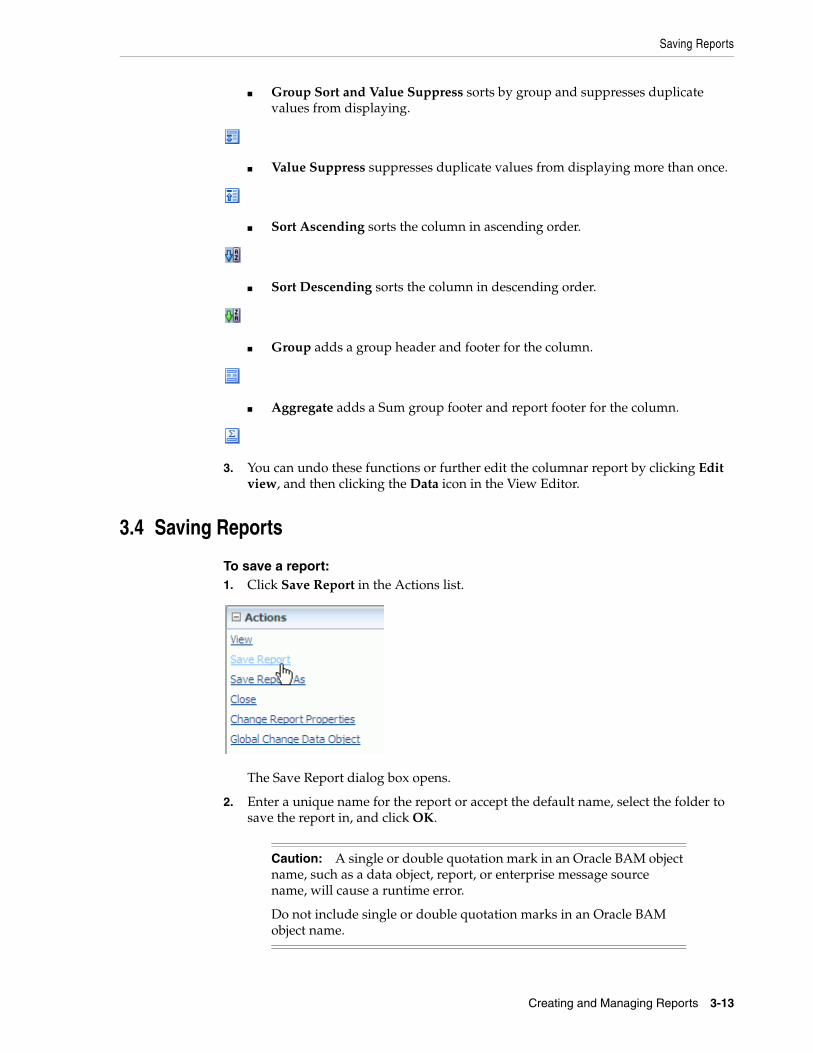
Saving Reports
Creating and Managing Reports 3-13
■ Group Sort and Value Suppress sorts by group and suppresses duplicate values from displaying.
■ Value Suppress suppresses duplicate values from displaying more than once.
■ Sort Ascending sorts the column in ascending order.
■ Sort Descending sorts the column in descending order.
■ Group adds a group header and footer for the column.
■ Aggregate adds a Sum group footer and report footer for the column.
3. You can undo these functions or further edit the columnar report by clicking Edit view, and then clicking the Data icon in the View Editor.
3.4 Saving Reports
To save a report:1. Click Save Report in the Actions list.
The Save Report dialog box opens.
2. Enter a unique name for the report or accept the default name, select the folder to save the report in, and click OK.
Caution: A single or double quotation mark in an Oracle BAM object name, such as a data object, report, or enterprise message source name, will cause a runtime error.
Do not include single or double quotation marks in an Oracle BAM object name.
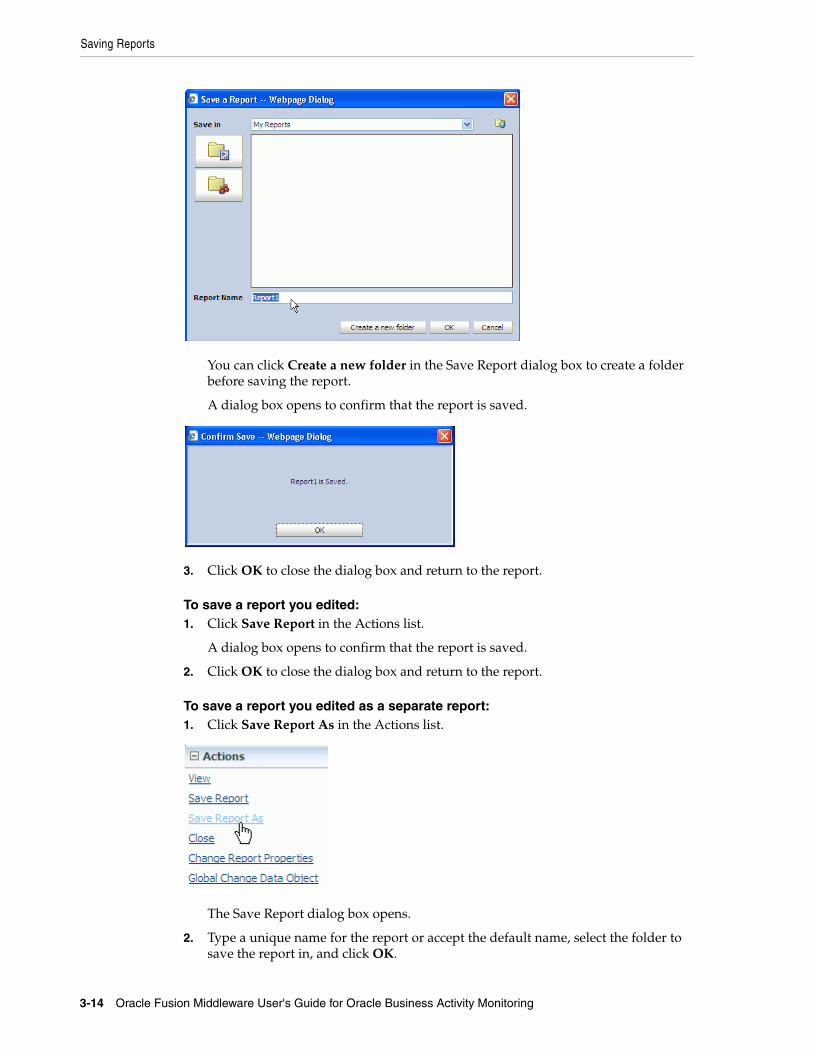
Saving Reports
3-14 Oracle Fusion Middleware User's Guide for Oracle Business Activity Monitoring
You can click Create a new folder in the Save Report dialog box to create a folder before saving the report.
A dialog box opens to confirm that the report is saved.
3. Click OK to close the dialog box and return to the report.
To save a report you edited:1. Click Save Report in the Actions list.
A dialog box opens to confirm that the report is saved.
2. Click OK to close the dialog box and return to the report.
To save a report you edited as a separate report:1. Click Save Report As in the Actions list.
The Save Report dialog box opens.
2. Type a unique name for the report or accept the default name, select the folder to save the report in, and click OK.
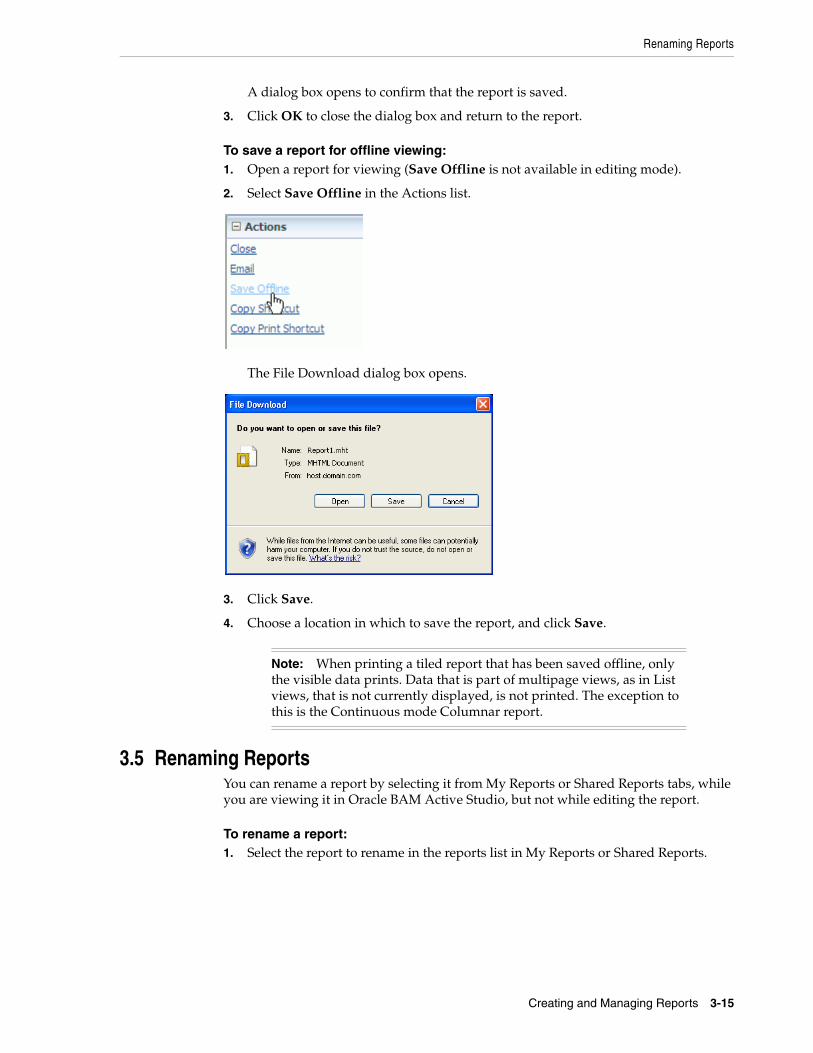
Renaming Reports
Creating and Managing Reports 3-15
A dialog box opens to confirm that the report is saved.
3. Click OK to close the dialog box and return to the report.
To save a report for offline viewing:1. Open a report for viewing (Save Offline is not available in editing mode).
2. Select Save Offline in the Actions list.
The File Download dialog box opens.
3. Click Save.
4. Choose a location in which to save the report, and click Save.
3.5 Renaming ReportsYou can rename a report by selecting it from My Reports or Shared Reports tabs, while you are viewing it in Oracle BAM Active Studio, but not while editing the report.
To rename a report:1. Select the report to rename in the reports list in My Reports or Shared Reports.
Note: When printing a tiled report that has been saved offline, only the visible data prints. Data that is part of multipage views, as in List views, that is not currently displayed, is not printed. The exception to this is the Continuous mode Columnar report.
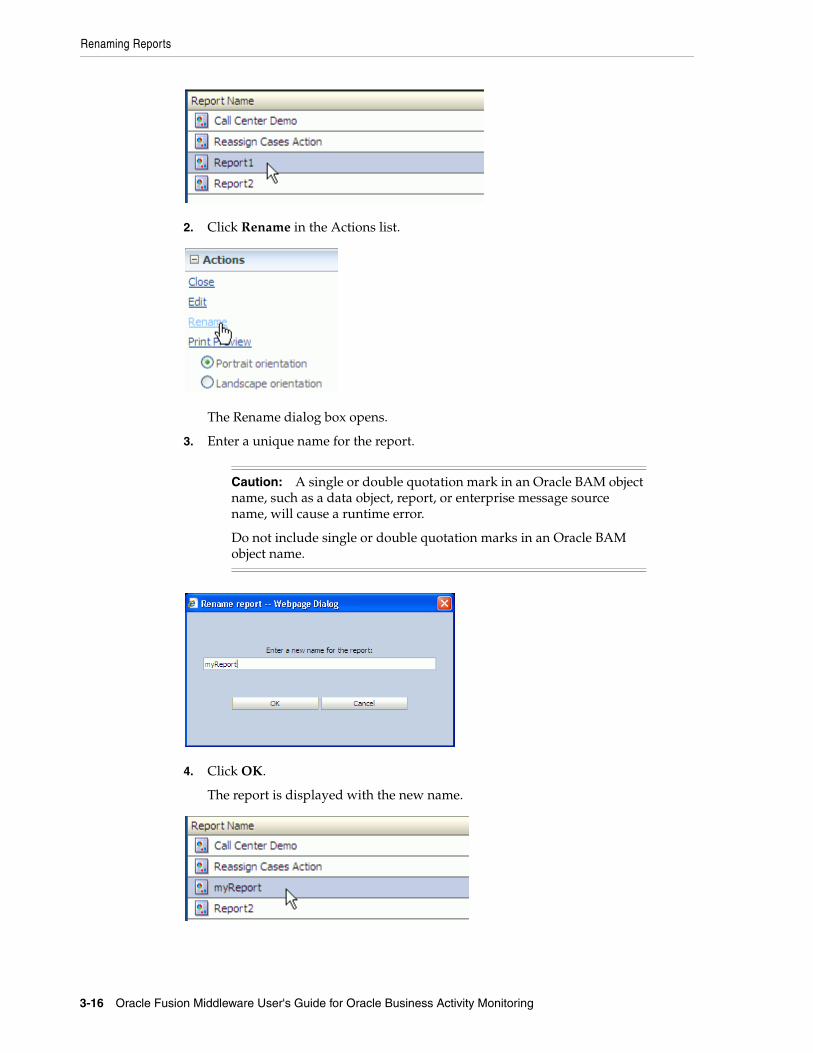
Renaming Reports
3-16 Oracle Fusion Middleware User's Guide for Oracle Business Activity Monitoring
2. Click Rename in the Actions list.
The Rename dialog box opens.
3. Enter a unique name for the report.
4. Click OK.
The report is displayed with the new name.
Caution: A single or double quotation mark in an Oracle BAM object name, such as a data object, report, or enterprise message source name, will cause a runtime error.
Do not include single or double quotation marks in an Oracle BAM object name.
Editing Reports
Creating and Managing Reports 3-17
3.6 Editing ReportsThis section provides procedures for editing many aspects of Oracle BAM reports. It contains the following topics:
■ Section 3.6.1, "Editing a Report"
■ Section 3.6.2, "Adding Report Titles"
■ Section 3.6.3, "Formatting Report Titles"
■ Section 3.6.4, "Setting Backgrounds for Reports"
■ Section 3.6.5, "Resizing Views"
■ Section 3.6.6, "Inserting Views"
■ Section 3.6.7, "Deleting Views"
■ Section 3.6.8, "Changing View Types"
■ Section 3.6.9, "Changing the Data Objects Used"
■ Section 3.6.10, "Setting Active Data Retrieval Interval"
■ Section 3.6.11, "Setting a Report-Level Poll Mode Refresh Interval"
■ Section 3.6.12, "Configuring Report Breadcrumbs"
■ Section 3.6.13, "Configuring Browser Padding"
3.6.1 Editing a ReportYou can edit any reports that you own. You can edit formatting options for each view, and you can change view types. You cannot edit reports shared by other users unless you have Create permissions for the folder they are stored in.
To edit a report:1. Select the report to edit in My Reports or Shared Reports, and click Edit in the
Actions list.
The report is displayed in the work space.
2. You can do choose from the following:
■ Click Edit view in the View Tasks/Options list to open the View Editor, which contains the data functions and formatting properties dialog box. You can also double-click the report display to open the View Editor.
■ To change the view type, click Change view type in the View Tasks/Options list. Previously selected options for the view are applied to the view type where possible.
3. When you finish editing the report, click Save Report in the Actions list.
3.6.2 Adding Report TitlesYou can add titles to display at the top of reports.
To add a title to a report:1. In a report you are editing, click in the Click to add a report title text at the top of
the report.
The text changes into a text cursor.
Editing Reports
3-18 Oracle Fusion Middleware User's Guide for Oracle Business Activity Monitoring
2. Enter the report title.
The title is saved with the report. You can edit the report title by clicking the title text field and typing. You can format the report title in the Report Properties dialog box.
You can also add a display title for each view if your report has multiple views.
3.6.3 Formatting Report TitlesYou can format report titles using the Report Properties dialog box. You must add a report title before you can format the text.
To format a report title:1. In a report you are editing, click Change Report Properties in the Actions list.
The Report Properties dialog box opens.
2. On the Title tab, click a font name from the Font list.
3. Click a font style from the Style list.
4. Click a font size from the Size list.
5. Click the color swatch.
A color palette opens.
6. Select a color from the palette.
The color and the color hexadecimal number display. You can also specify the color by typing or pasting a hexadecimal number in this field.
7. Choose the effects to apply to the text by selecting the checkboxes for underline, overline, or line through.
8. Choose a case for the text such as capitalize the first letters, all uppercase letters, or all lowercase letters.
9. Click Apply or OK.
3.6.4 Setting Backgrounds for ReportsYou can set a background color or an image for reports. The background is displayed in the title bar, in the space behind view elements, and between views.
Only GIF, JPG, and PNG image file formats are supported.
To set a background color for a report:1. In a report you are editing, click Change Report Properties in the Actions list.
The Report Properties dialog box opens.
2. On the Background tab, click the current color swatch for the report background.
A color palette opens.
3. Select a color.
The color and the color hexadecimal number display for the report background color. You can also specify the color by typing or pasting a hexadecimal number in this field.
4. Click OK.
The background color is applied to the report.
Editing Reports
Creating and Managing Reports 3-19
To use an image in the background:1. In a report you are editing, click Change Report Properties in the Actions list.
The Report Properties dialog box opens.
2. On the Background tab, select the Image checkbox, and click Browse.
The File Upload dialog box opens.
3. Click Browse to locate the image.
4. Select an image file and click Open.
5. Click Upload.
6. Click OK to close the File Upload dialog box.
7. Click OK to close the Report Properties dialog box.
3.6.5 Resizing ViewsYou can resize a view in a report. You might want to display a larger view, or you might want decrease the size of a view to make room for inserting another view.
To resize a view in a report:1. In a report you are editing, select the view to resize.
The view displays selection handles.
2. Click a selection handle and do one of the following:
■ Drag the handle with the mouse in a direction to resize the view.
■ Use the direction keys (arrows) in the direction you want the view edge to move (this offers more precision).
The view is resized. You can also move the view without resizing by dragging the frame of the view instead of a selection handle.
3.6.6 Inserting ViewsYou can insert additional views into a report. After selecting a report template, you might want to arrange views and add more views.
To insert a view into a report:1. In a report you are editing, click Insert View in the toolbar.
The view opens and the selection handles are active.
2. You can do any of the following to arrange your view:
■ Click a handle and drag in a direction to resize the view.
■ Move the view without resizing by dragging the frame of the view instead of a selection handle.
■ Click Send Backward and Bring Forward in the toolbar to arrange views that overlap.
3.6.7 Deleting ViewsYou can delete a view from a report. You might want fewer views in a report, and then you can resize the remaining views.
Editing Reports
3-20 Oracle Fusion Middleware User's Guide for Oracle Business Activity Monitoring
To delete a view from a report:1. In a report you are editing, click the view to delete.
The view displays selection handles.
2. Click Delete View in the toolbar.
The view is deleted.
3.6.8 Changing View TypesYou can edit a report and change the view type you selected for a specific view. For example, you might have a three view report and decide to change the first view from a streaming list to an updating ordered list, without re-creating the entire report. Many view types can be changed and still maintain the majority of the properties you previously specified.
To change a view type in a report:1. In a report you are editing, click the view to change.
The view displays selection handles.
2. Click Change view type in the View Tasks/Options list.
The view type icons display.
3. Click the view type to switch to.
The view opens using the data object selected for the old view type.
4. Open the View Editor to make any other formatting selections needed for the view type.
3.6.9 Changing the Data Objects UsedYou can edit a report and change the data object you selected for a specific view, or any occurrence of a data object used throughout the entire report. The data object you select must contain at least the same fields as the originally selected data object. The data object you choose might contain additional fields. The data objects that do not apply are disabled.
You can change the data object for a specific view by using the View Editor Data Objects tab, or you can replace a data object for entire report by using Global Change Data Object action. For information about data objects see Oracle Fusion Middleware Developer's Guide for Oracle SOA Suite.
To switch a data object in a view:1. In a report you are editing, click the view to change.
The view displays selection handles.
2. Click Edit view in the View Tasks/Options list.
3. Click the Data Objects tab.
The list of data objects opens. Data objects that are not similar to the original data object are disabled.
4. Make any other formatting selections needed for the view type.
5. Click OK or Apply.
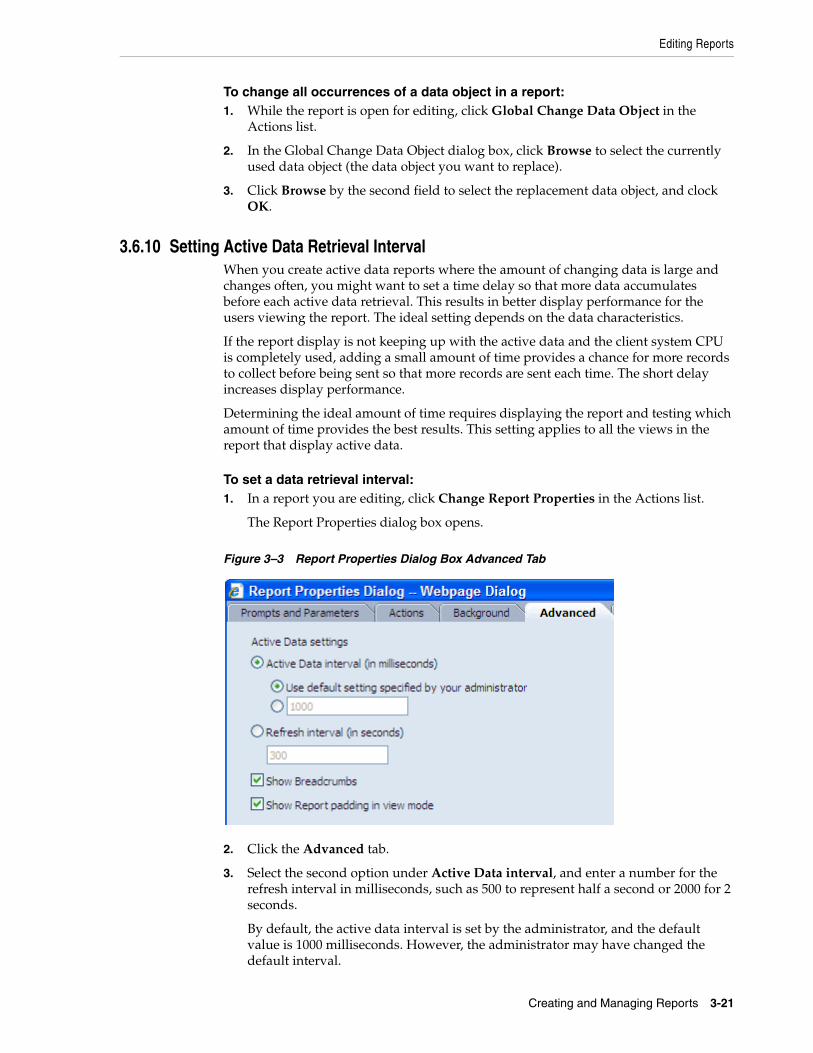
Editing Reports
Creating and Managing Reports 3-21
To change all occurrences of a data object in a report:1. While the report is open for editing, click Global Change Data Object in the
Actions list.
2. In the Global Change Data Object dialog box, click Browse to select the currently used data object (the data object you want to replace).
3. Click Browse by the second field to select the replacement data object, and clock OK.
3.6.10 Setting Active Data Retrieval IntervalWhen you create active data reports where the amount of changing data is large and changes often, you might want to set a time delay so that more data accumulates before each active data retrieval. This results in better display performance for the users viewing the report. The ideal setting depends on the data characteristics.
If the report display is not keeping up with the active data and the client system CPU is completely used, adding a small amount of time provides a chance for more records to collect before being sent so that more records are sent each time. The short delay increases display performance.
Determining the ideal amount of time requires displaying the report and testing which amount of time provides the best results. This setting applies to all the views in the report that display active data.
To set a data retrieval interval:1. In a report you are editing, click Change Report Properties in the Actions list.
The Report Properties dialog box opens.
Figure 3–3 Report Properties Dialog Box Advanced Tab
2. Click the Advanced tab.
3. Select the second option under Active Data interval, and enter a number for the refresh interval in milliseconds, such as 500 to represent half a second or 2000 for 2 seconds.
By default, the active data interval is set by the administrator, and the default value is 1000 milliseconds. However, the administrator may have changed the default interval.
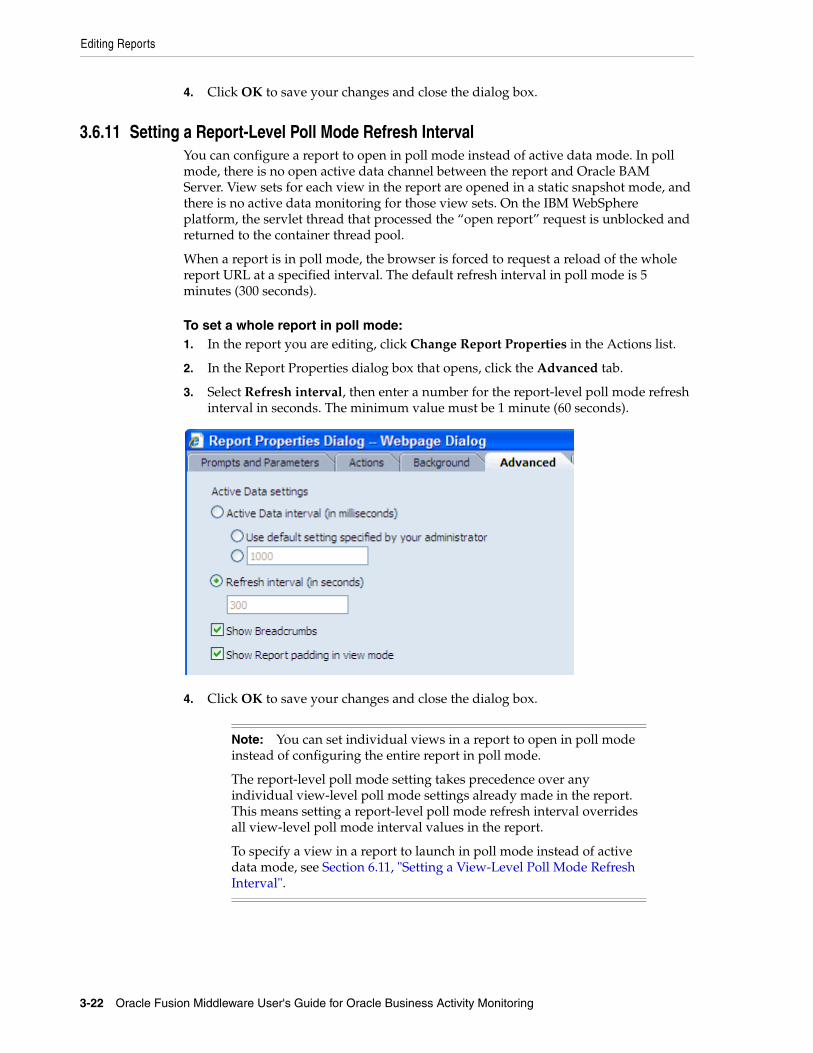
Editing Reports
3-22 Oracle Fusion Middleware User's Guide for Oracle Business Activity Monitoring
4. Click OK to save your changes and close the dialog box.
3.6.11 Setting a Report-Level Poll Mode Refresh IntervalYou can configure a report to open in poll mode instead of active data mode. In poll mode, there is no open active data channel between the report and Oracle BAM Server. View sets for each view in the report are opened in a static snapshot mode, and there is no active data monitoring for those view sets. On the IBM WebSphere platform, the servlet thread that processed the “open report” request is unblocked and returned to the container thread pool.
When a report is in poll mode, the browser is forced to request a reload of the whole report URL at a specified interval. The default refresh interval in poll mode is 5 minutes (300 seconds).
To set a whole report in poll mode:1. In the report you are editing, click Change Report Properties in the Actions list.
2. In the Report Properties dialog box that opens, click the Advanced tab.
3. Select Refresh interval, then enter a number for the report-level poll mode refresh interval in seconds. The minimum value must be 1 minute (60 seconds).
4. Click OK to save your changes and close the dialog box.
Note: You can set individual views in a report to open in poll mode instead of configuring the entire report in poll mode.
The report-level poll mode setting takes precedence over any individual view-level poll mode settings already made in the report. This means setting a report-level poll mode refresh interval overrides all view-level poll mode interval values in the report.
To specify a view in a report to launch in poll mode instead of active data mode, see Section 6.11, "Setting a View-Level Poll Mode Refresh Interval".
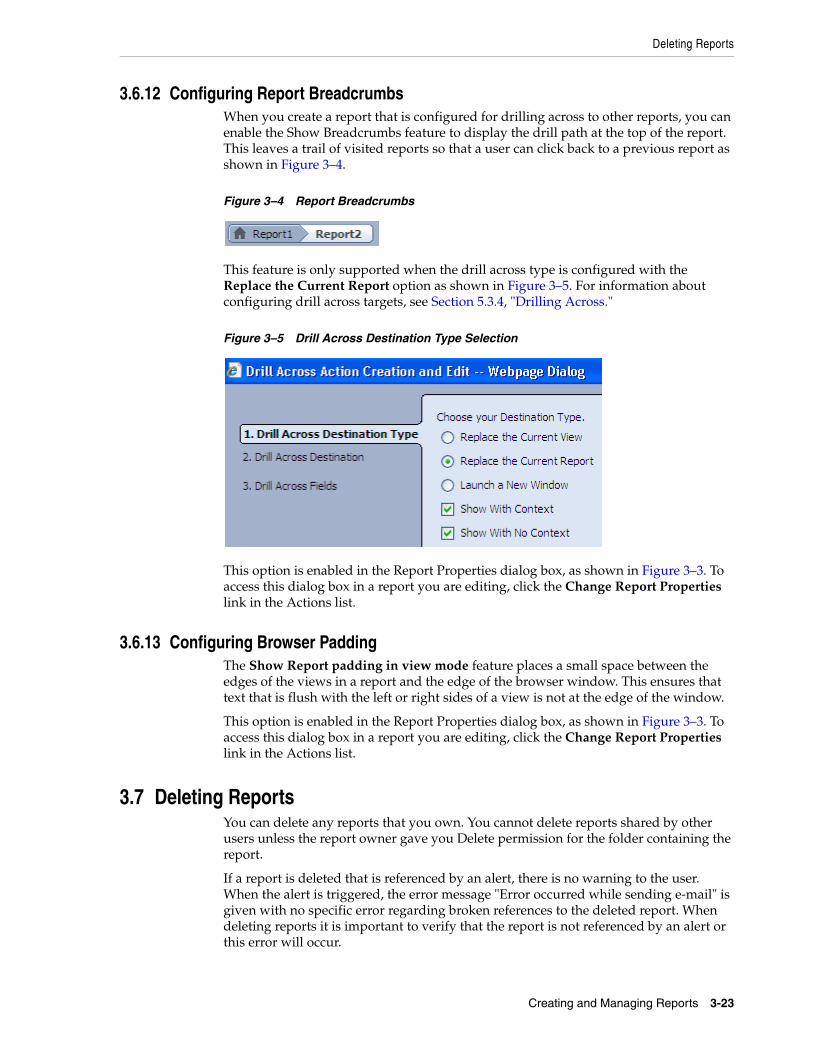
Deleting Reports
Creating and Managing Reports 3-23
3.6.12 Configuring Report BreadcrumbsWhen you create a report that is configured for drilling across to other reports, you can enable the Show Breadcrumbs feature to display the drill path at the top of the report. This leaves a trail of visited reports so that a user can click back to a previous report as shown in Figure 3–4.
Figure 3–4 Report Breadcrumbs
This feature is only supported when the drill across type is configured with the Replace the Current Report option as shown in Figure 3–5. For information about configuring drill across targets, see Section 5.3.4, "Drilling Across."
Figure 3–5 Drill Across Destination Type Selection
This option is enabled in the Report Properties dialog box, as shown in Figure 3–3. To access this dialog box in a report you are editing, click the Change Report Properties link in the Actions list.
3.6.13 Configuring Browser PaddingThe Show Report padding in view mode feature places a small space between the edges of the views in a report and the edge of the browser window. This ensures that text that is flush with the left or right sides of a view is not at the edge of the window.
This option is enabled in the Report Properties dialog box, as shown in Figure 3–3. To access this dialog box in a report you are editing, click the Change Report Properties link in the Actions list.
3.7 Deleting ReportsYou can delete any reports that you own. You cannot delete reports shared by other users unless the report owner gave you Delete permission for the folder containing the report.
If a report is deleted that is referenced by an alert, there is no warning to the user. When the alert is triggered, the error message "Error occurred while sending e-mail" is given with no specific error regarding broken references to the deleted report. When deleting reports it is important to verify that the report is not referenced by an alert or this error will occur.
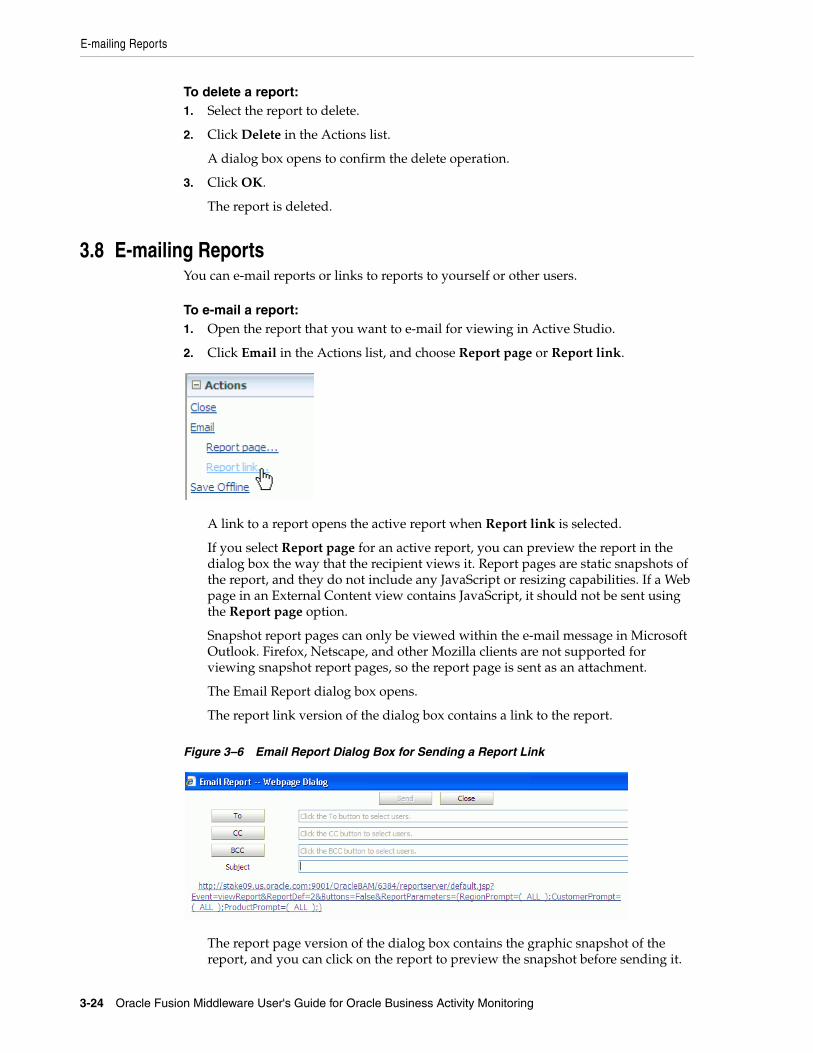
E-mailing Reports
3-24 Oracle Fusion Middleware User's Guide for Oracle Business Activity Monitoring
To delete a report:1. Select the report to delete.
2. Click Delete in the Actions list.
A dialog box opens to confirm the delete operation.
3. Click OK.
The report is deleted.
3.8 E-mailing ReportsYou can e-mail reports or links to reports to yourself or other users.
To e-mail a report:1. Open the report that you want to e-mail for viewing in Active Studio.
2. Click Email in the Actions list, and choose Report page or Report link.
A link to a report opens the active report when Report link is selected.
If you select Report page for an active report, you can preview the report in the dialog box the way that the recipient views it. Report pages are static snapshots of the report, and they do not include any JavaScript or resizing capabilities. If a Web page in an External Content view contains JavaScript, it should not be sent using the Report page option.
Snapshot report pages can only be viewed within the e-mail message in Microsoft Outlook. Firefox, Netscape, and other Mozilla clients are not supported for viewing snapshot report pages, so the report page is sent as an attachment.
The Email Report dialog box opens.
The report link version of the dialog box contains a link to the report.
Figure 3–6 Email Report Dialog Box for Sending a Report Link
The report page version of the dialog box contains the graphic snapshot of the report, and you can click on the report to preview the snapshot before sending it.
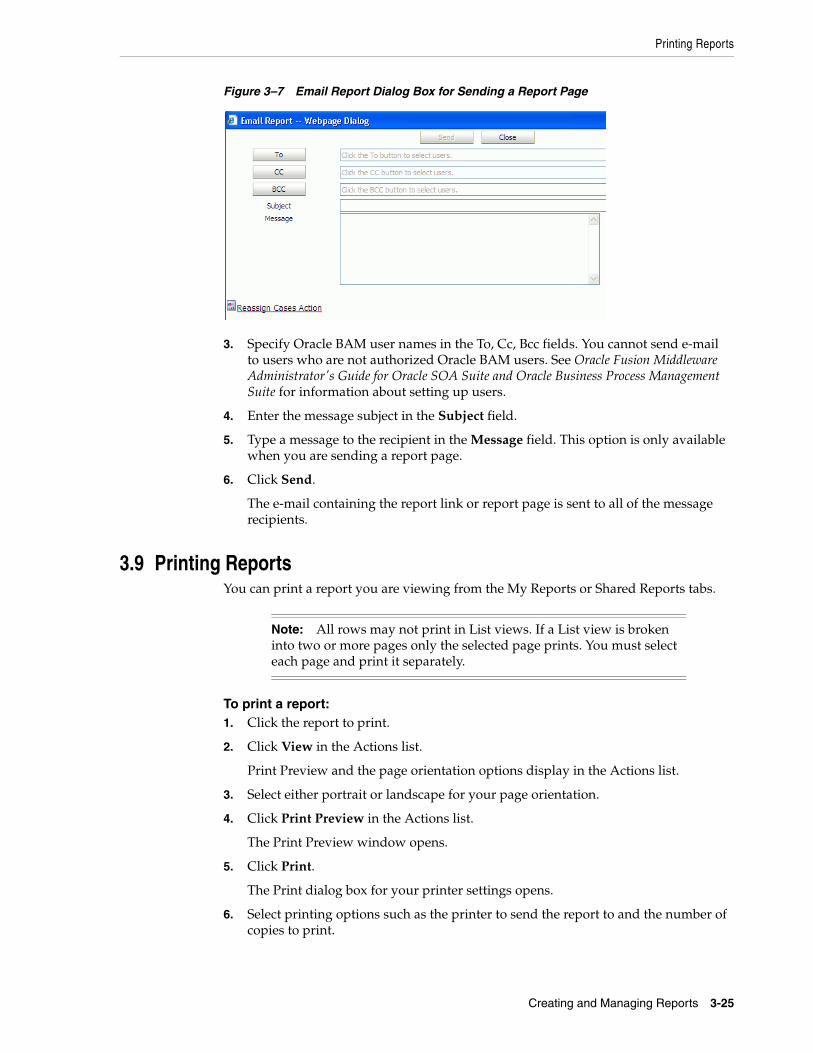
Printing Reports
Creating and Managing Reports 3-25
Figure 3–7 Email Report Dialog Box for Sending a Report Page
3. Specify Oracle BAM user names in the To, Cc, Bcc fields. You cannot send e-mail to users who are not authorized Oracle BAM users. See Oracle Fusion Middleware Administrator's Guide for Oracle SOA Suite and Oracle Business Process Management Suite for information about setting up users.
4. Enter the message subject in the Subject field.
5. Type a message to the recipient in the Message field. This option is only available when you are sending a report page.
6. Click Send.
The e-mail containing the report link or report page is sent to all of the message recipients.
3.9 Printing ReportsYou can print a report you are viewing from the My Reports or Shared Reports tabs.
To print a report:1. Click the report to print.
2. Click View in the Actions list.
Print Preview and the page orientation options display in the Actions list.
3. Select either portrait or landscape for your page orientation.
4. Click Print Preview in the Actions list.
The Print Preview window opens.
5. Click Print.
The Print dialog box for your printer settings opens.
6. Select printing options such as the printer to send the report to and the number of copies to print.
Note: All rows may not print in List views. If a List view is broken into two or more pages only the selected page prints. You must select each page and print it separately.
Copying Report URLs
3-26 Oracle Fusion Middleware User's Guide for Oracle Business Activity Monitoring
If you changed the page orientation in Oracle BAM Active Studio, then you must also change the page orientation in your printer settings. Click Preferences in the Microsoft Windows Print dialog box, and then click the Basics tab to view the page orientation options.
7. Click Print.
The printer prints the report.
To close the Print Preview window, click Close.
When you print a columnar report, you can view the print boundaries and the page count.
To print a columnar report:1. Click the report to print.
2. Click View in the Actions list.
Print Boundaries and the page orientation options display in the Actions list.
3. Click Print Boundaries to view the page layout and page count.
4. Select either portrait or landscape for your page orientation.
5. Click Print in the Actions list.
The Print dialog box for your printer settings opens.
6. Select printing options such as the printer to send the report to and the number of copies to print.
If you changed the page orientation in Oracle BAM Active Studio, then you must also change the page orientation in your printer settings. Click Preferences in the Print dialog box, and then click the Basics tab to view the page orientation options.
7. Click Print.
The printer prints the report.
8. To turn off the print boundaries, click Print Boundaries again.
3.10 Copying Report URLsYou can copy the URL of a saved report so that you can paste it in another location, such as a Web page in a portal site or as a link in an e-mail. The report URL contains the complete report location so that clicking the link opens the report in a browser. The report is displayed in Oracle BAM Active Studio.
For information about using the Oracle BAM report URL to add a report to an iFrame, see Section 3.15, "Adding Oracle BAM Reports to Web Pages."
To copy a report URL:1. Select the report in the list in the My Reports page or the Shared Reports page.
2. Click Copy Shortcut in the Actions list.
The Copy Shortcut dialog box opens including the string containing the report URL.
3. Highlight the string, hold down the Control key, and type C to copy the text.
4. Paste the URL in any location.
Viewing Reports
Creating and Managing Reports 3-27
3.11 Saving Reports OfflineYou can save reports locally as MHT files. These files are saved on your local computer so that you can view them at another time when you might not have access to Oracle BAM Active Studio. The MHT files are viewed in a browser and display the report just as it opens in Oracle BAM Active Studio.
To save a report offline:1. Click the report.
2. Click View in the Actions list.
3. Click Save Offline in the Actions list.
The Save HTML document dialog box opens.
4. Select a folder location to save the file.
5. Type a name for the MHT file and click Save.
To view a report saved offline:
■ Locate the MHT file in your local files and double-click it.
The MHT file is displayed in the Internet Explorer browser. The report display resizes according to the browser window size. Reports saved as MHT files are static and do not show live data.
3.12 Viewing ReportsYou can view reports from the Home, My Reports, or Shared Reports tabs in Oracle BAM Active Studio. To configure a report to open in your Home tab, see Section 2.3.5, "Selecting a Report for the Oracle BAM Active Studio Home Tab."
You can specify whether to display an indicator as the report information loads. To enable or disable a report loading indicator, see Section 2.3.3, "Specifying Report Loading Indicator Settings."
To view a report on the Home tab:1. Open Oracle BAM Active Studio (see Section 2.5, "Getting Started With Oracle
BAM Active Studio"). The Home tab is displayed by default.
Note: When printing a tiled report that has been saved offline, only the visible data prints. Data that is part of multipage views, as in List views, that is not currently displayed, is not printed. The exception to this is the Continuous mode Columnar report.
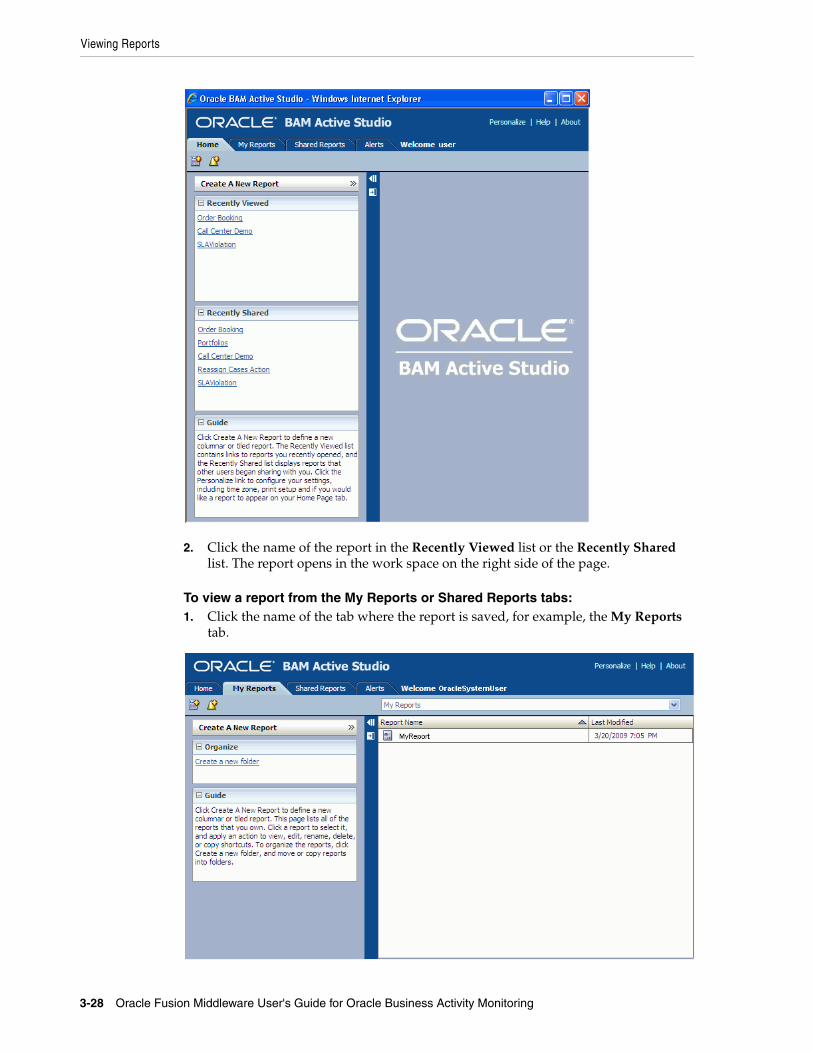
Viewing Reports
3-28 Oracle Fusion Middleware User's Guide for Oracle Business Activity Monitoring
2. Click the name of the report in the Recently Viewed list or the Recently Shared list. The report opens in the work space on the right side of the page.
To view a report from the My Reports or Shared Reports tabs:1. Click the name of the tab where the report is saved, for example, the My Reports
tab.
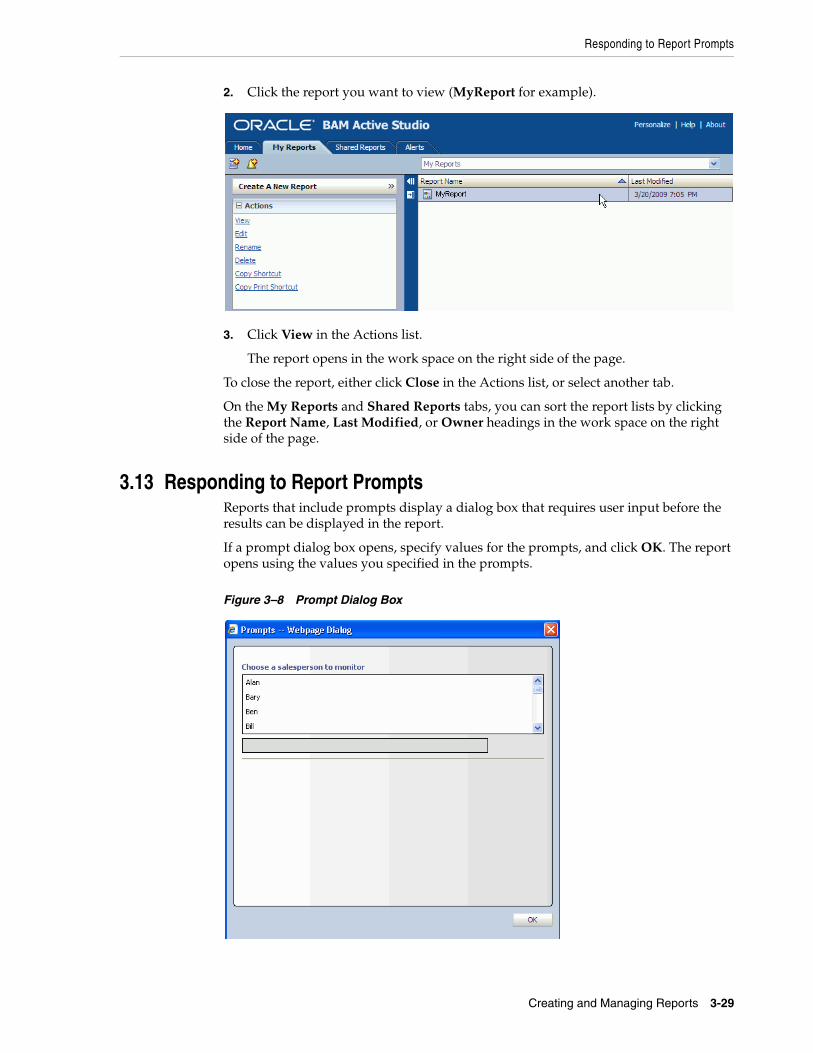
Responding to Report Prompts
Creating and Managing Reports 3-29
2. Click the report you want to view (MyReport for example).
3. Click View in the Actions list.
The report opens in the work space on the right side of the page.
To close the report, either click Close in the Actions list, or select another tab.
On the My Reports and Shared Reports tabs, you can sort the report lists by clicking the Report Name, Last Modified, or Owner headings in the work space on the right side of the page.
3.13 Responding to Report PromptsReports that include prompts display a dialog box that requires user input before the results can be displayed in the report.
If a prompt dialog box opens, specify values for the prompts, and click OK. The report opens using the values you specified in the prompts.
Figure 3–8 Prompt Dialog Box
Pausing and Playing Active Data
3-30 Oracle Fusion Middleware User's Guide for Oracle Business Activity Monitoring
You can click the Reprompt button in the toolbar to view the dialog box again and present different report results.
Figure 3–9 Reprompt button
3.14 Pausing and Playing Active DataWhen viewing reports, you can pause the display of active data in reports. For reports that are quickly updating, you might want to pause the display to view the current data before more active data is loaded.
To stop the display of active data:■ In a report you are viewing, click the Pause icon in the toolbar.
The active data is temporarily halted, and the Pause button turns into a Play button.
To restart the display of active data:■ Click Play in the toolbar.
The active data starts, and the Play button turns into a Pause button.
3.15 Adding Oracle BAM Reports to Web Pages
To add an Oracle BAM report to a Web page:1. Open My Reports>Shared Reports tab in Oracle BAM Active Studio.
2. Select the report to be displayed in the Web page.
3. On left side pane, in Actions panel, click the Copy Shortcut link.
The Copy Shortcut dialog box opens including the string containing the report URL.
4. Highlight the URL string, and press Control-C to copy the text.
5. Paste the URL into the src attribute of an iframe element as shown in the following example.
<iframe src="http://<HostName>:<HostPort>/OracleBAM/<BuildNumber>/reportserver/default.jsp?Event=viewReport&ReportDef=6&Buttons=False" width="100%" height="100%"></iframe>
You can set height and width attributes of the iframe to control both of these properties.
Example 3–1 Sample HTML File With Oracle BAM Report URL
<html><body><iframe src="http://adc2110349.us.oracle.com:7001/OracleBAM/10704/reportserver/default.jsp?Event=viewReport&ReportDef=6&Buttons=False" width="100%" height="100%"></iframe></body></html>

Adding Oracle BAM Reports to Web Pages
Creating and Managing Reports 3-31

Adding Oracle BAM Reports to Web Pages
3-32 Oracle Fusion Middleware User's Guide for Oracle Business Activity Monitoring
4
Creating and Using Views 4-1
4Creating and Using Views
This chapter describes how to create and use each of the views in Oracle Business Activity Monitoring (Oracle BAM) Active Studio, including list views and charts views, and how to add organization and functionality to reports and groups of views, or use rows and columns to display a multi-dimensional view of the values.
This chapter contains the following topics:
■ Section 4.1, "Creating and Using List Views"
■ Section 4.2, "Creating and Using Chart Views"
■ Section 4.3, "Creating and Using the Columnar View"
■ Section 4.4, "Creating and Using Key Process Indicator Views"
■ Section 4.5, "Creating and Using Crosstab Views"
■ Section 4.6, "Creating and Using the Excel View"
■ Section 4.7, "Creating and Using the Action Form View"
■ Section 4.8, "Creating and Using the External Content View"
■ Section 4.9, "Creating and Using Utility Views"
4.1 Creating and Using List ViewsThis section provides information about creating and using the Streaming List, Updating List, Ordered Updating List, Collapsed List, and Action List. It contains the following topics:
■ Section 4.1.1, "Introduction to List Views"
■ Section 4.1.2, "Creating List Views"
■ Section 4.1.3, "Configuring List View Formatting Properties"
■ Section 4.1.4, "Sorting Data in List Views"
■ Section 4.1.5, "Adding Summaries to a Collapsed List"
■ Section 4.1.6, "Configuring the Action List"
■ Section 4.1.7, "Using the Paging Controls"
4.1.1 Introduction to List ViewsOracle BAM Active Studio provides several types of list views that can accommodate your requirements.
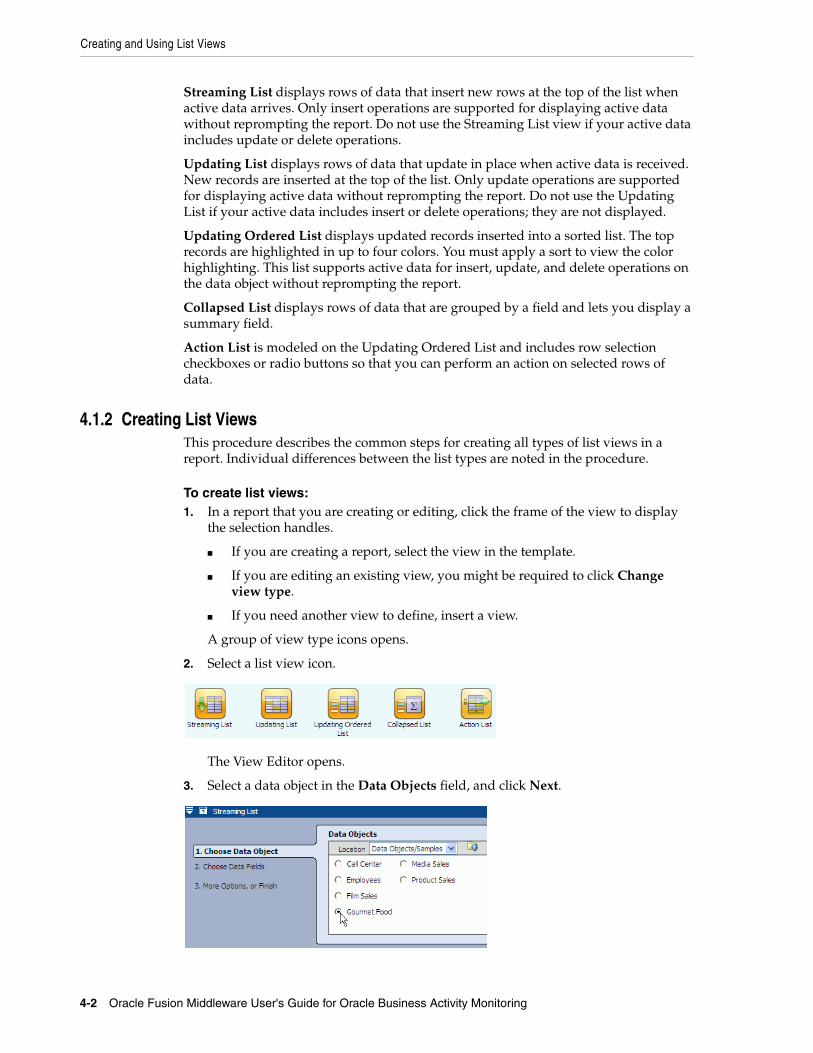
Creating and Using List Views
4-2 Oracle Fusion Middleware User's Guide for Oracle Business Activity Monitoring
Streaming List displays rows of data that insert new rows at the top of the list when active data arrives. Only insert operations are supported for displaying active data without reprompting the report. Do not use the Streaming List view if your active data includes update or delete operations.
Updating List displays rows of data that update in place when active data is received. New records are inserted at the top of the list. Only update operations are supported for displaying active data without reprompting the report. Do not use the Updating List if your active data includes insert or delete operations; they are not displayed.
Updating Ordered List displays updated records inserted into a sorted list. The top records are highlighted in up to four colors. You must apply a sort to view the color highlighting. This list supports active data for insert, update, and delete operations on the data object without reprompting the report.
Collapsed List displays rows of data that are grouped by a field and lets you display a summary field.
Action List is modeled on the Updating Ordered List and includes row selection checkboxes or radio buttons so that you can perform an action on selected rows of data.
4.1.2 Creating List ViewsThis procedure describes the common steps for creating all types of list views in a report. Individual differences between the list types are noted in the procedure.
To create list views:1. In a report that you are creating or editing, click the frame of the view to display
the selection handles.
■ If you are creating a report, select the view in the template.
■ If you are editing an existing view, you might be required to click Change view type.
■ If you need another view to define, insert a view.
A group of view type icons opens.
2. Select a list view icon.
The View Editor opens.
3. Select a data object in the Data Objects field, and click Next.
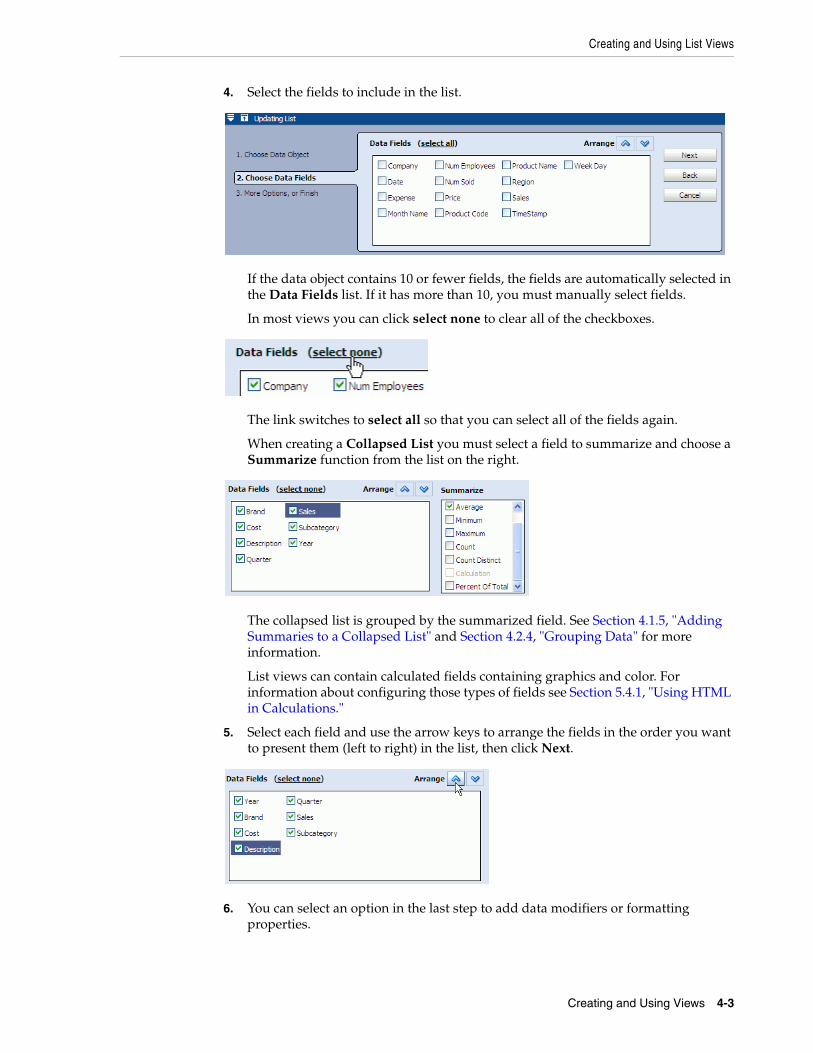
Creating and Using List Views
Creating and Using Views 4-3
4. Select the fields to include in the list.
If the data object contains 10 or fewer fields, the fields are automatically selected in the Data Fields list. If it has more than 10, you must manually select fields.
In most views you can click select none to clear all of the checkboxes.
The link switches to select all so that you can select all of the fields again.
When creating a Collapsed List you must select a field to summarize and choose a Summarize function from the list on the right.
The collapsed list is grouped by the summarized field. See Section 4.1.5, "Adding Summaries to a Collapsed List" and Section 4.2.4, "Grouping Data" for more information.
List views can contain calculated fields containing graphics and color. For information about configuring those types of fields see Section 5.4.1, "Using HTML in Calculations."
5. Select each field and use the arrow keys to arrange the fields in the order you want to present them (left to right) in the list, then click Next.
6. You can select an option in the last step to add data modifiers or formatting properties.
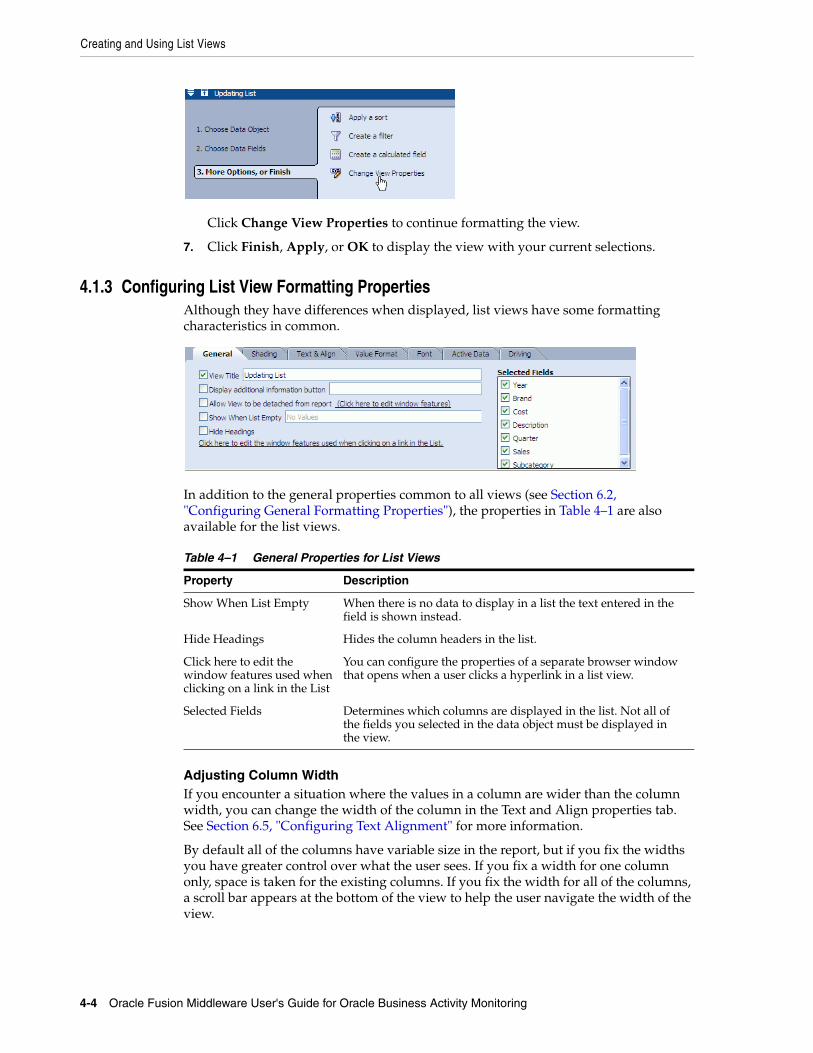
Creating and Using List Views
4-4 Oracle Fusion Middleware User's Guide for Oracle Business Activity Monitoring
Click Change View Properties to continue formatting the view.
7. Click Finish, Apply, or OK to display the view with your current selections.
4.1.3 Configuring List View Formatting PropertiesAlthough they have differences when displayed, list views have some formatting characteristics in common.
In addition to the general properties common to all views (see Section 6.2, "Configuring General Formatting Properties"), the properties in Table 4–1 are also available for the list views.
Adjusting Column WidthIf you encounter a situation where the values in a column are wider than the column width, you can change the width of the column in the Text and Align properties tab. See Section 6.5, "Configuring Text Alignment" for more information.
By default all of the columns have variable size in the report, but if you fix the widths you have greater control over what the user sees. If you fix a width for one column only, space is taken for the existing columns. If you fix the width for all of the columns, a scroll bar appears at the bottom of the view to help the user navigate the width of the view.
Table 4–1 General Properties for List Views
Property Description
Show When List Empty When there is no data to display in a list the text entered in the field is shown instead.
Hide Headings Hides the column headers in the list.
Click here to edit the window features used when clicking on a link in the List
You can configure the properties of a separate browser window that opens when a user clicks a hyperlink in a list view.
Selected Fields Determines which columns are displayed in the list. Not all of the fields you selected in the data object must be displayed in the view.
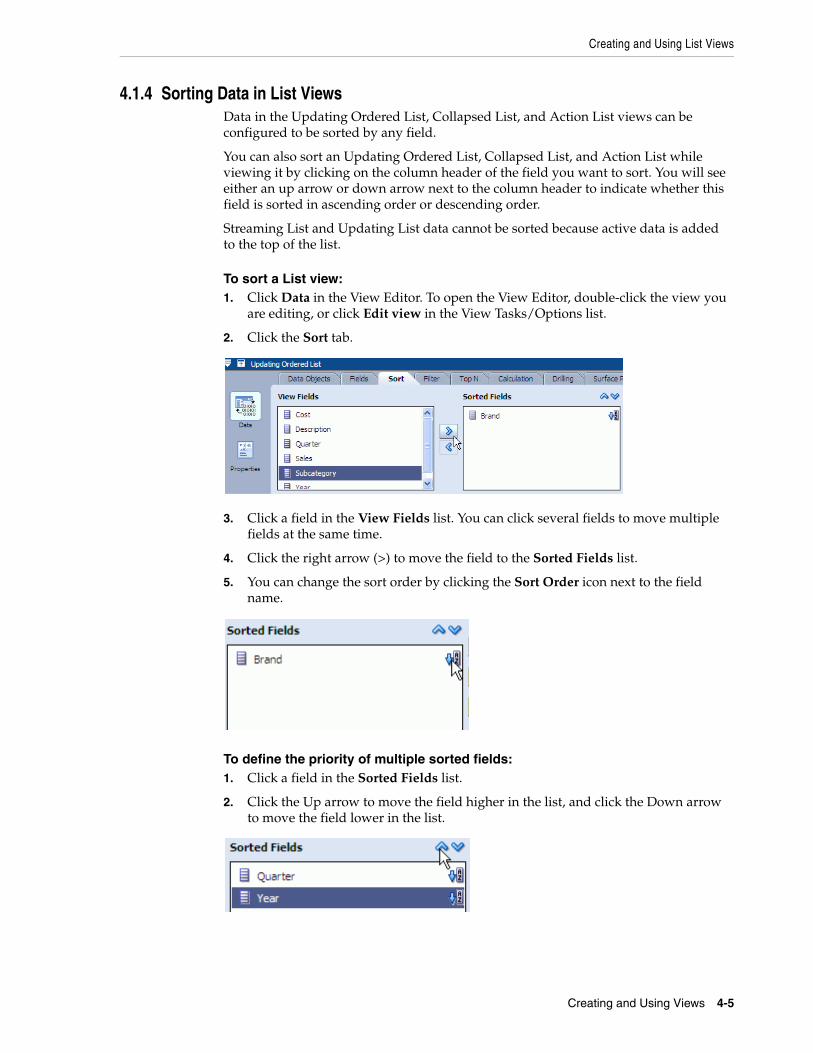
Creating and Using List Views
Creating and Using Views 4-5
4.1.4 Sorting Data in List ViewsData in the Updating Ordered List, Collapsed List, and Action List views can be configured to be sorted by any field.
You can also sort an Updating Ordered List, Collapsed List, and Action List while viewing it by clicking on the column header of the field you want to sort. You will see either an up arrow or down arrow next to the column header to indicate whether this field is sorted in ascending order or descending order.
Streaming List and Updating List data cannot be sorted because active data is added to the top of the list.
To sort a List view:1. Click Data in the View Editor. To open the View Editor, double-click the view you
are editing, or click Edit view in the View Tasks/Options list.
2. Click the Sort tab.
3. Click a field in the View Fields list. You can click several fields to move multiple fields at the same time.
4. Click the right arrow (>) to move the field to the Sorted Fields list.
5. You can change the sort order by clicking the Sort Order icon next to the field name.
To define the priority of multiple sorted fields:1. Click a field in the Sorted Fields list.
2. Click the Up arrow to move the field higher in the list, and click the Down arrow to move the field lower in the list.
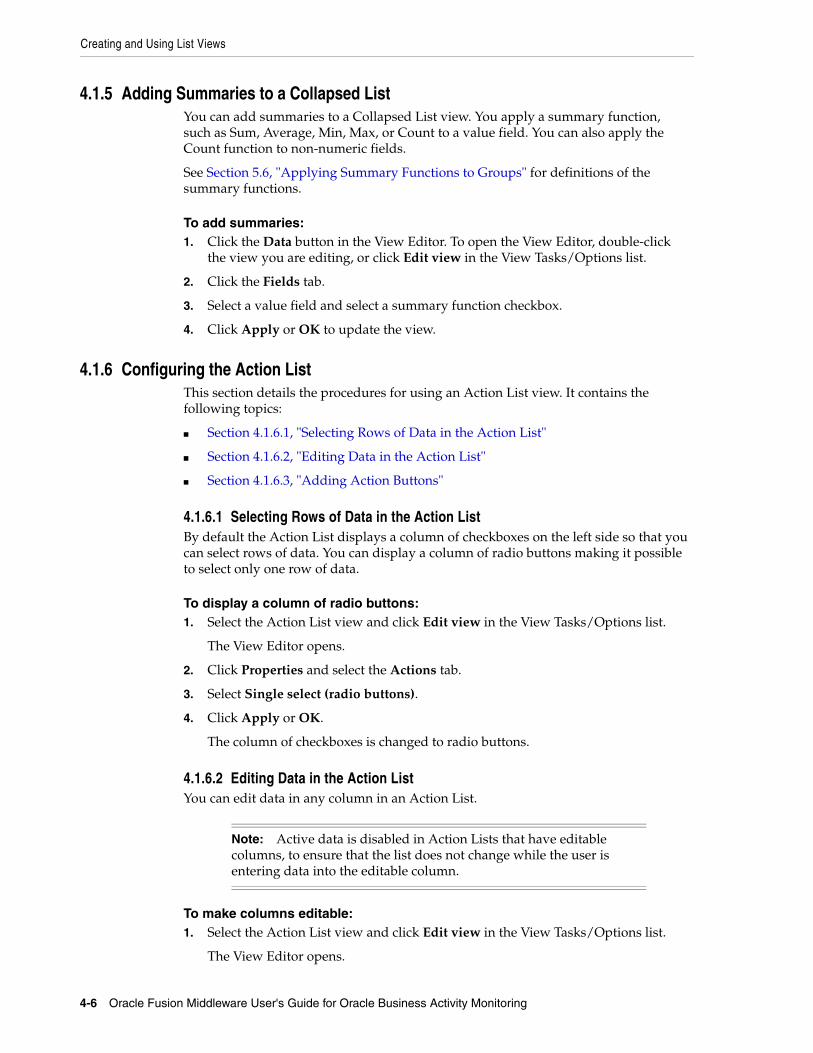
Creating and Using List Views
4-6 Oracle Fusion Middleware User's Guide for Oracle Business Activity Monitoring
4.1.5 Adding Summaries to a Collapsed ListYou can add summaries to a Collapsed List view. You apply a summary function, such as Sum, Average, Min, Max, or Count to a value field. You can also apply the Count function to non-numeric fields.
See Section 5.6, "Applying Summary Functions to Groups" for definitions of the summary functions.
To add summaries:1. Click the Data button in the View Editor. To open the View Editor, double-click
the view you are editing, or click Edit view in the View Tasks/Options list.
2. Click the Fields tab.
3. Select a value field and select a summary function checkbox.
4. Click Apply or OK to update the view.
4.1.6 Configuring the Action ListThis section details the procedures for using an Action List view. It contains the following topics:
■ Section 4.1.6.1, "Selecting Rows of Data in the Action List"
■ Section 4.1.6.2, "Editing Data in the Action List"
■ Section 4.1.6.3, "Adding Action Buttons"
4.1.6.1 Selecting Rows of Data in the Action ListBy default the Action List displays a column of checkboxes on the left side so that you can select rows of data. You can display a column of radio buttons making it possible to select only one row of data.
To display a column of radio buttons:1. Select the Action List view and click Edit view in the View Tasks/Options list.
The View Editor opens.
2. Click Properties and select the Actions tab.
3. Select Single select (radio buttons).
4. Click Apply or OK.
The column of checkboxes is changed to radio buttons.
4.1.6.2 Editing Data in the Action ListYou can edit data in any column in an Action List.
To make columns editable:1. Select the Action List view and click Edit view in the View Tasks/Options list.
The View Editor opens.
Note: Active data is disabled in Action Lists that have editable columns, to ensure that the list does not change while the user is entering data into the editable column.
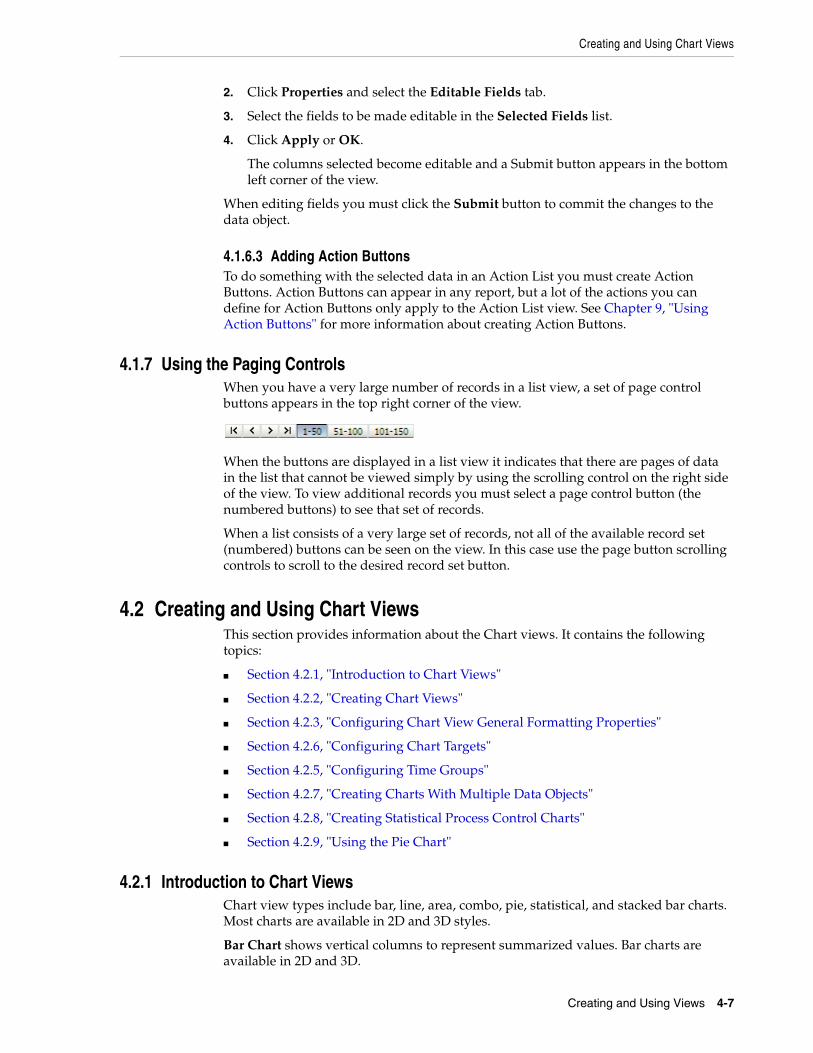
Creating and Using Chart Views
Creating and Using Views 4-7
2. Click Properties and select the Editable Fields tab.
3. Select the fields to be made editable in the Selected Fields list.
4. Click Apply or OK.
The columns selected become editable and a Submit button appears in the bottom left corner of the view.
When editing fields you must click the Submit button to commit the changes to the data object.
4.1.6.3 Adding Action ButtonsTo do something with the selected data in an Action List you must create Action Buttons. Action Buttons can appear in any report, but a lot of the actions you can define for Action Buttons only apply to the Action List view. See Chapter 9, "Using Action Buttons" for more information about creating Action Buttons.
4.1.7 Using the Paging ControlsWhen you have a very large number of records in a list view, a set of page control buttons appears in the top right corner of the view.
When the buttons are displayed in a list view it indicates that there are pages of data in the list that cannot be viewed simply by using the scrolling control on the right side of the view. To view additional records you must select a page control button (the numbered buttons) to see that set of records.
When a list consists of a very large set of records, not all of the available record set (numbered) buttons can be seen on the view. In this case use the page button scrolling controls to scroll to the desired record set button.
4.2 Creating and Using Chart ViewsThis section provides information about the Chart views. It contains the following topics:
■ Section 4.2.1, "Introduction to Chart Views"
■ Section 4.2.2, "Creating Chart Views"
■ Section 4.2.3, "Configuring Chart View General Formatting Properties"
■ Section 4.2.6, "Configuring Chart Targets"
■ Section 4.2.5, "Configuring Time Groups"
■ Section 4.2.7, "Creating Charts With Multiple Data Objects"
■ Section 4.2.8, "Creating Statistical Process Control Charts"
■ Section 4.2.9, "Using the Pie Chart"
4.2.1 Introduction to Chart ViewsChart view types include bar, line, area, combo, pie, statistical, and stacked bar charts. Most charts are available in 2D and 3D styles.
Bar Chart shows vertical columns to represent summarized values. Bar charts are available in 2D and 3D.
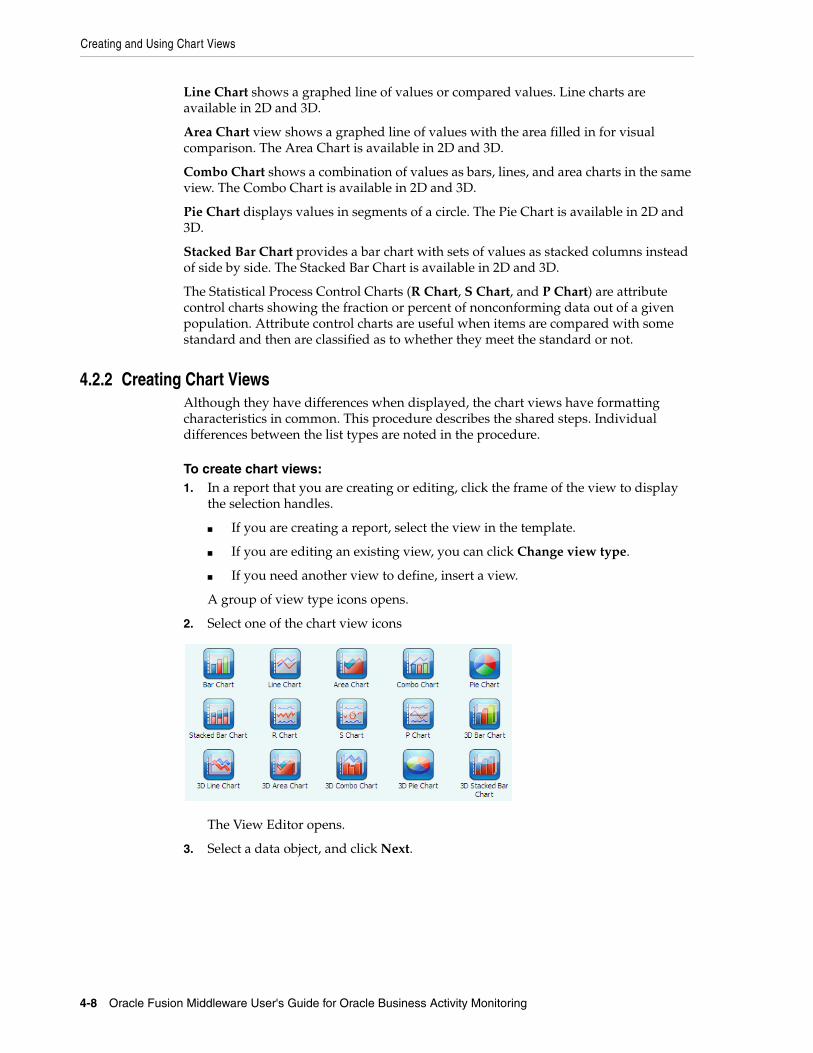
Creating and Using Chart Views
4-8 Oracle Fusion Middleware User's Guide for Oracle Business Activity Monitoring
Line Chart shows a graphed line of values or compared values. Line charts are available in 2D and 3D.
Area Chart view shows a graphed line of values with the area filled in for visual comparison. The Area Chart is available in 2D and 3D.
Combo Chart shows a combination of values as bars, lines, and area charts in the same view. The Combo Chart is available in 2D and 3D.
Pie Chart displays values in segments of a circle. The Pie Chart is available in 2D and 3D.
Stacked Bar Chart provides a bar chart with sets of values as stacked columns instead of side by side. The Stacked Bar Chart is available in 2D and 3D.
The Statistical Process Control Charts (R Chart, S Chart, and P Chart) are attribute control charts showing the fraction or percent of nonconforming data out of a given population. Attribute control charts are useful when items are compared with some standard and then are classified as to whether they meet the standard or not.
4.2.2 Creating Chart ViewsAlthough they have differences when displayed, the chart views have formatting characteristics in common. This procedure describes the shared steps. Individual differences between the list types are noted in the procedure.
To create chart views:1. In a report that you are creating or editing, click the frame of the view to display
the selection handles.
■ If you are creating a report, select the view in the template.
■ If you are editing an existing view, you can click Change view type.
■ If you need another view to define, insert a view.
A group of view type icons opens.
2. Select one of the chart view icons
The View Editor opens.
3. Select a data object, and click Next.
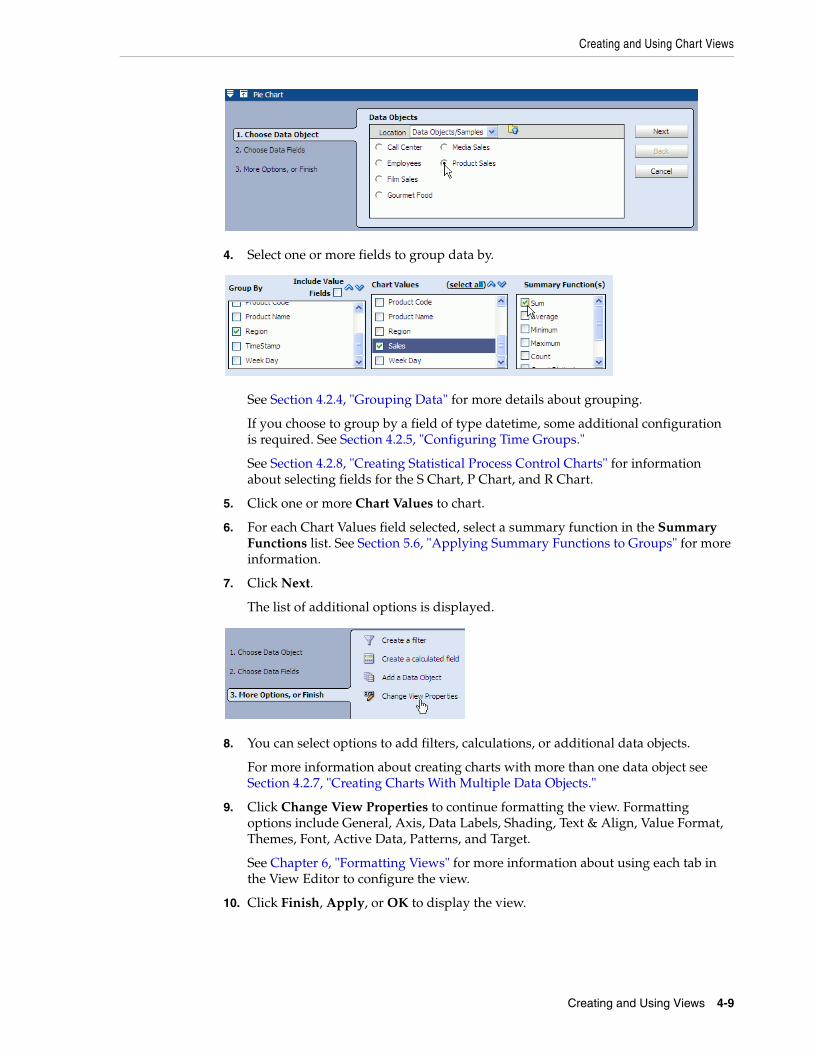
Creating and Using Chart Views
Creating and Using Views 4-9
4. Select one or more fields to group data by.
See Section 4.2.4, "Grouping Data" for more details about grouping.
If you choose to group by a field of type datetime, some additional configuration is required. See Section 4.2.5, "Configuring Time Groups."
See Section 4.2.8, "Creating Statistical Process Control Charts" for information about selecting fields for the S Chart, P Chart, and R Chart.
5. Click one or more Chart Values to chart.
6. For each Chart Values field selected, select a summary function in the Summary Functions list. See Section 5.6, "Applying Summary Functions to Groups" for more information.
7. Click Next.
The list of additional options is displayed.
8. You can select options to add filters, calculations, or additional data objects.
For more information about creating charts with more than one data object see Section 4.2.7, "Creating Charts With Multiple Data Objects."
9. Click Change View Properties to continue formatting the view. Formatting options include General, Axis, Data Labels, Shading, Text & Align, Value Format, Themes, Font, Active Data, Patterns, and Target.
See Chapter 6, "Formatting Views" for more information about using each tab in the View Editor to configure the view.
10. Click Finish, Apply, or OK to display the view.
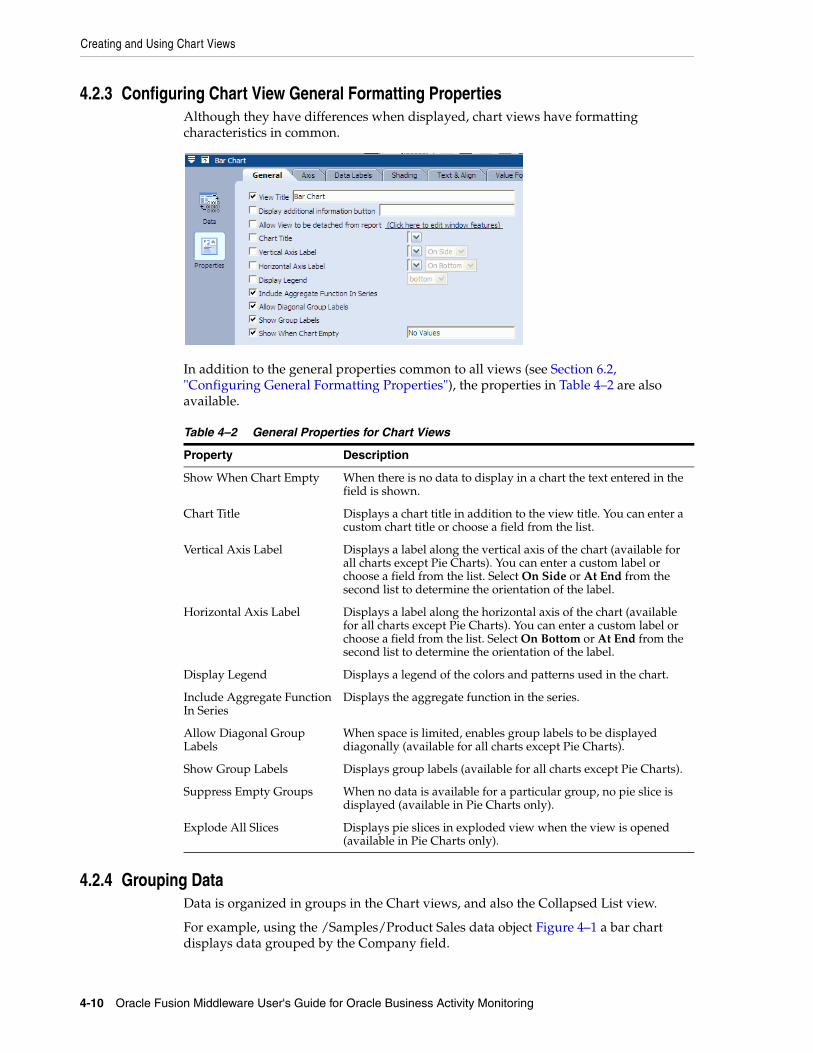
Creating and Using Chart Views
4-10 Oracle Fusion Middleware User's Guide for Oracle Business Activity Monitoring
4.2.3 Configuring Chart View General Formatting PropertiesAlthough they have differences when displayed, chart views have formatting characteristics in common.
In addition to the general properties common to all views (see Section 6.2, "Configuring General Formatting Properties"), the properties in Table 4–2 are also available.
4.2.4 Grouping DataData is organized in groups in the Chart views, and also the Collapsed List view.
For example, using the /Samples/Product Sales data object Figure 4–1 a bar chart displays data grouped by the Company field.
Table 4–2 General Properties for Chart Views
Property Description
Show When Chart Empty When there is no data to display in a chart the text entered in the field is shown.
Chart Title Displays a chart title in addition to the view title. You can enter a custom chart title or choose a field from the list.
Vertical Axis Label Displays a label along the vertical axis of the chart (available for all charts except Pie Charts). You can enter a custom label or choose a field from the list. Select On Side or At End from the second list to determine the orientation of the label.
Horizontal Axis Label Displays a label along the horizontal axis of the chart (available for all charts except Pie Charts). You can enter a custom label or choose a field from the list. Select On Bottom or At End from the second list to determine the orientation of the label.
Display Legend Displays a legend of the colors and patterns used in the chart.
Include Aggregate Function In Series
Displays the aggregate function in the series.
Allow Diagonal Group Labels
When space is limited, enables group labels to be displayed diagonally (available for all charts except Pie Charts).
Show Group Labels Displays group labels (available for all charts except Pie Charts).
Suppress Empty Groups When no data is available for a particular group, no pie slice is displayed (available in Pie Charts only).
Explode All Slices Displays pie slices in exploded view when the view is opened (available in Pie Charts only).
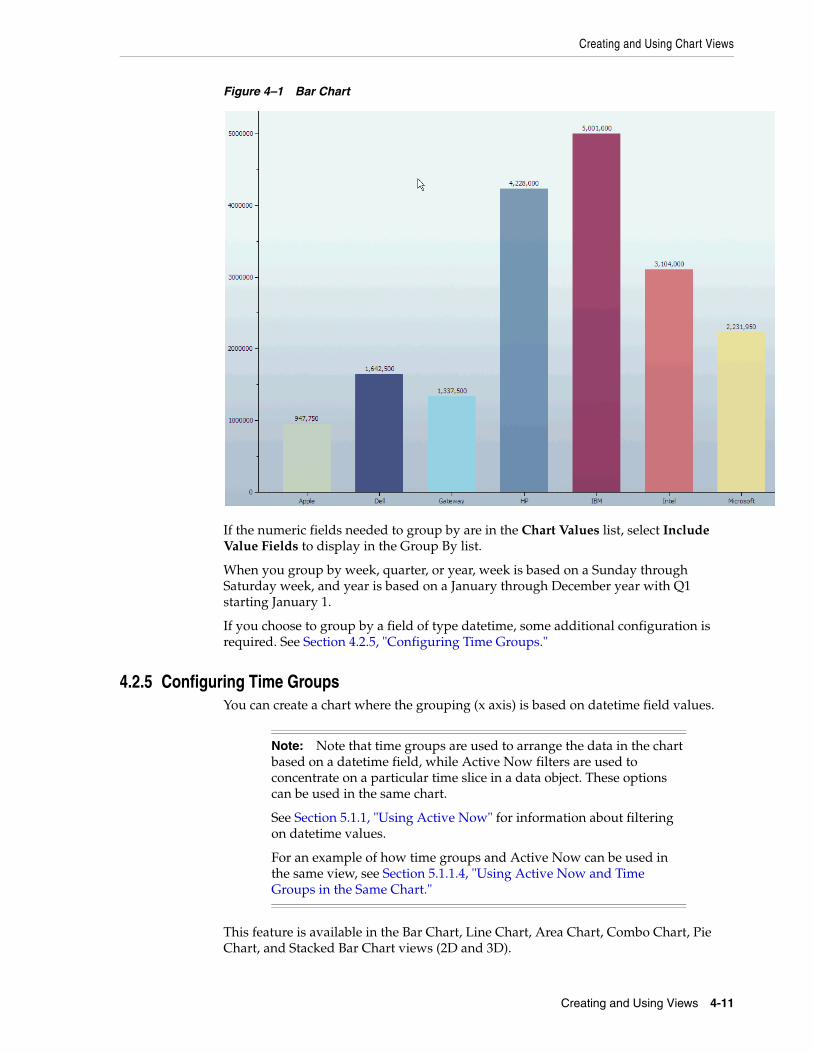
Creating and Using Chart Views
Creating and Using Views 4-11
Figure 4–1 Bar Chart
If the numeric fields needed to group by are in the Chart Values list, select Include Value Fields to display in the Group By list.
When you group by week, quarter, or year, week is based on a Sunday through Saturday week, and year is based on a January through December year with Q1 starting January 1.
If you choose to group by a field of type datetime, some additional configuration is required. See Section 4.2.5, "Configuring Time Groups."
4.2.5 Configuring Time GroupsYou can create a chart where the grouping (x axis) is based on datetime field values.
This feature is available in the Bar Chart, Line Chart, Area Chart, Combo Chart, Pie Chart, and Stacked Bar Chart views (2D and 3D).
Note: Note that time groups are used to arrange the data in the chart based on a datetime field, while Active Now filters are used to concentrate on a particular time slice in a data object. These options can be used in the same chart.
See Section 5.1.1, "Using Active Now" for information about filtering on datetime values.
For an example of how time groups and Active Now can be used in the same view, see Section 5.1.1.4, "Using Active Now and Time Groups in the Same Chart."
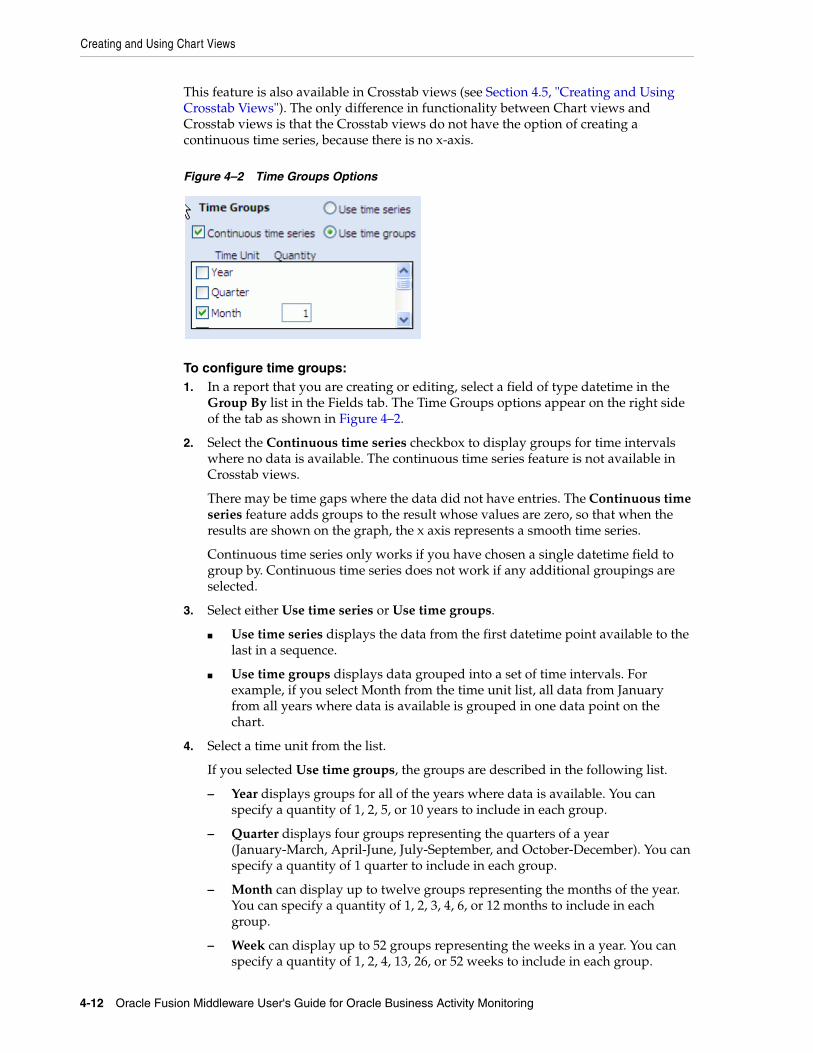
Creating and Using Chart Views
4-12 Oracle Fusion Middleware User's Guide for Oracle Business Activity Monitoring
This feature is also available in Crosstab views (see Section 4.5, "Creating and Using Crosstab Views"). The only difference in functionality between Chart views and Crosstab views is that the Crosstab views do not have the option of creating a continuous time series, because there is no x-axis.
Figure 4–2 Time Groups Options
To configure time groups:1. In a report that you are creating or editing, select a field of type datetime in the
Group By list in the Fields tab. The Time Groups options appear on the right side of the tab as shown in Figure 4–2.
2. Select the Continuous time series checkbox to display groups for time intervals where no data is available. The continuous time series feature is not available in Crosstab views.
There may be time gaps where the data did not have entries. The Continuous time series feature adds groups to the result whose values are zero, so that when the results are shown on the graph, the x axis represents a smooth time series.
Continuous time series only works if you have chosen a single datetime field to group by. Continuous time series does not work if any additional groupings are selected.
3. Select either Use time series or Use time groups.
■ Use time series displays the data from the first datetime point available to the last in a sequence.
■ Use time groups displays data grouped into a set of time intervals. For example, if you select Month from the time unit list, all data from January from all years where data is available is grouped in one data point on the chart.
4. Select a time unit from the list.
If you selected Use time groups, the groups are described in the following list.
– Year displays groups for all of the years where data is available. You can specify a quantity of 1, 2, 5, or 10 years to include in each group.
– Quarter displays four groups representing the quarters of a year (January-March, April-June, July-September, and October-December). You can specify a quantity of 1 quarter to include in each group.
– Month can display up to twelve groups representing the months of the year. You can specify a quantity of 1, 2, 3, 4, 6, or 12 months to include in each group.
– Week can display up to 52 groups representing the weeks in a year. You can specify a quantity of 1, 2, 4, 13, 26, or 52 weeks to include in each group.
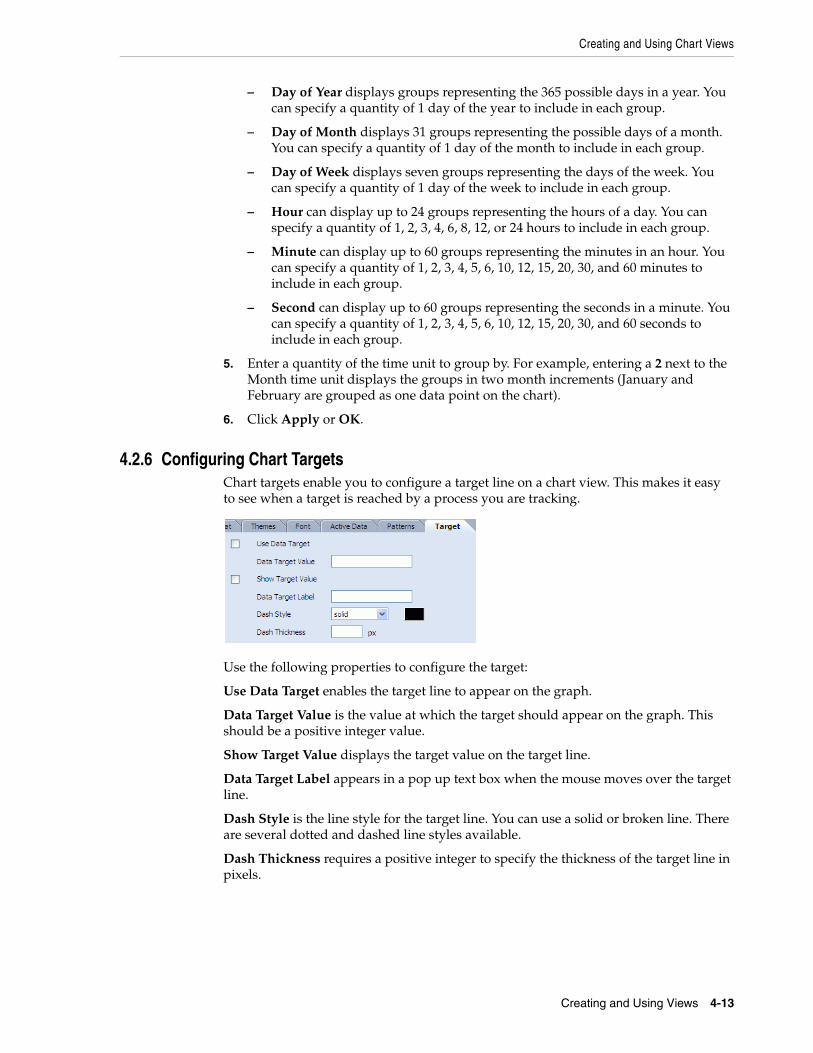
Creating and Using Chart Views
Creating and Using Views 4-13
– Day of Year displays groups representing the 365 possible days in a year. You can specify a quantity of 1 day of the year to include in each group.
– Day of Month displays 31 groups representing the possible days of a month. You can specify a quantity of 1 day of the month to include in each group.
– Day of Week displays seven groups representing the days of the week. You can specify a quantity of 1 day of the week to include in each group.
– Hour can display up to 24 groups representing the hours of a day. You can specify a quantity of 1, 2, 3, 4, 6, 8, 12, or 24 hours to include in each group.
– Minute can display up to 60 groups representing the minutes in an hour. You can specify a quantity of 1, 2, 3, 4, 5, 6, 10, 12, 15, 20, 30, and 60 minutes to include in each group.
– Second can display up to 60 groups representing the seconds in a minute. You can specify a quantity of 1, 2, 3, 4, 5, 6, 10, 12, 15, 20, 30, and 60 seconds to include in each group.
5. Enter a quantity of the time unit to group by. For example, entering a 2 next to the Month time unit displays the groups in two month increments (January and February are grouped as one data point on the chart).
6. Click Apply or OK.
4.2.6 Configuring Chart TargetsChart targets enable you to configure a target line on a chart view. This makes it easy to see when a target is reached by a process you are tracking.
Use the following properties to configure the target:
Use Data Target enables the target line to appear on the graph.
Data Target Value is the value at which the target should appear on the graph. This should be a positive integer value.
Show Target Value displays the target value on the target line.
Data Target Label appears in a pop up text box when the mouse moves over the target line.
Dash Style is the line style for the target line. You can use a solid or broken line. There are several dotted and dashed line styles available.
Dash Thickness requires a positive integer to specify the thickness of the target line in pixels.
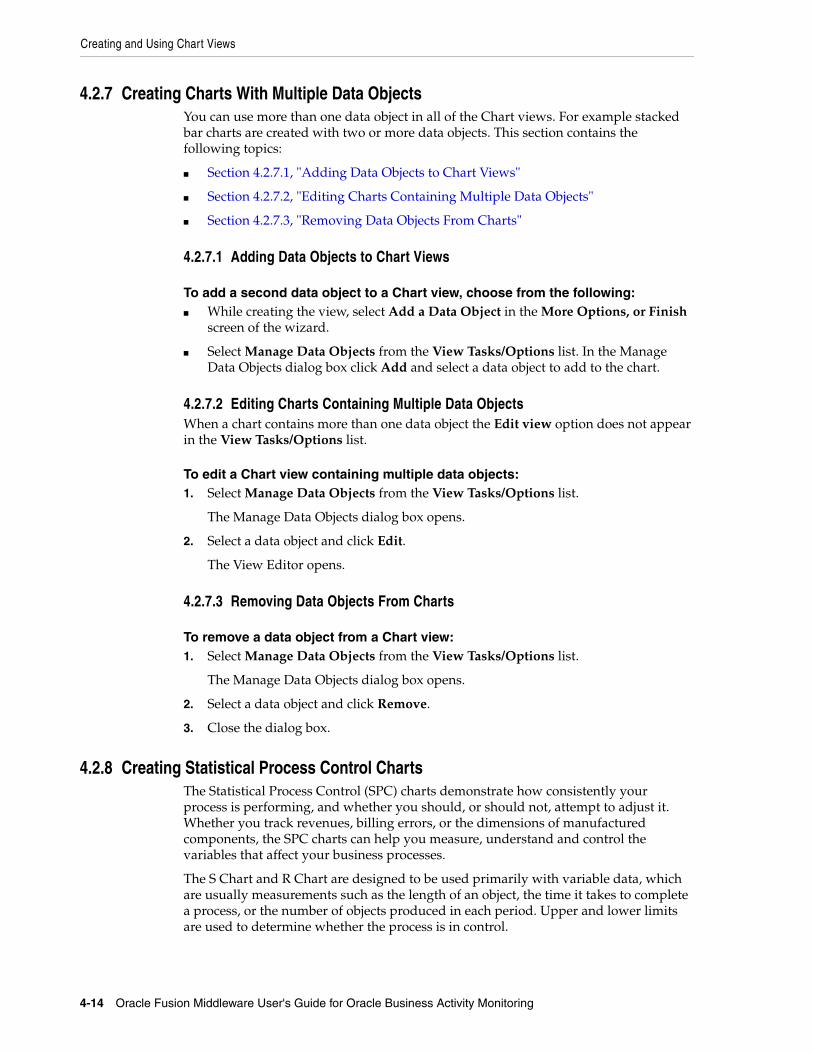
Creating and Using Chart Views
4-14 Oracle Fusion Middleware User's Guide for Oracle Business Activity Monitoring
4.2.7 Creating Charts With Multiple Data ObjectsYou can use more than one data object in all of the Chart views. For example stacked bar charts are created with two or more data objects. This section contains the following topics:
■ Section 4.2.7.1, "Adding Data Objects to Chart Views"
■ Section 4.2.7.2, "Editing Charts Containing Multiple Data Objects"
■ Section 4.2.7.3, "Removing Data Objects From Charts"
4.2.7.1 Adding Data Objects to Chart Views
To add a second data object to a Chart view, choose from the following:■ While creating the view, select Add a Data Object in the More Options, or Finish
screen of the wizard.
■ Select Manage Data Objects from the View Tasks/Options list. In the Manage Data Objects dialog box click Add and select a data object to add to the chart.
4.2.7.2 Editing Charts Containing Multiple Data ObjectsWhen a chart contains more than one data object the Edit view option does not appear in the View Tasks/Options list.
To edit a Chart view containing multiple data objects:1. Select Manage Data Objects from the View Tasks/Options list.
The Manage Data Objects dialog box opens.
2. Select a data object and click Edit.
The View Editor opens.
4.2.7.3 Removing Data Objects From Charts
To remove a data object from a Chart view:1. Select Manage Data Objects from the View Tasks/Options list.
The Manage Data Objects dialog box opens.
2. Select a data object and click Remove.
3. Close the dialog box.
4.2.8 Creating Statistical Process Control ChartsThe Statistical Process Control (SPC) charts demonstrate how consistently your process is performing, and whether you should, or should not, attempt to adjust it. Whether you track revenues, billing errors, or the dimensions of manufactured components, the SPC charts can help you measure, understand and control the variables that affect your business processes.
The S Chart and R Chart are designed to be used primarily with variable data, which are usually measurements such as the length of an object, the time it takes to complete a process, or the number of objects produced in each period. Upper and lower limits are used to determine whether the process is in control.
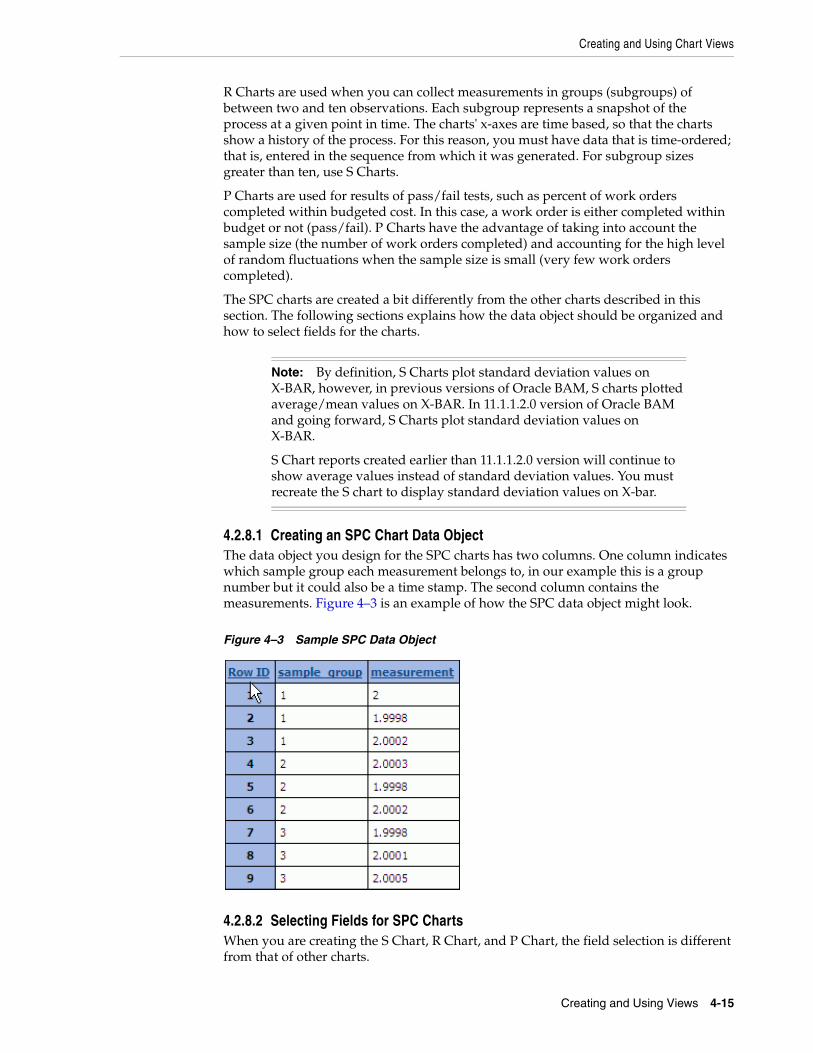
Creating and Using Chart Views
Creating and Using Views 4-15
R Charts are used when you can collect measurements in groups (subgroups) of between two and ten observations. Each subgroup represents a snapshot of the process at a given point in time. The charts' x-axes are time based, so that the charts show a history of the process. For this reason, you must have data that is time-ordered; that is, entered in the sequence from which it was generated. For subgroup sizes greater than ten, use S Charts.
P Charts are used for results of pass/fail tests, such as percent of work orders completed within budgeted cost. In this case, a work order is either completed within budget or not (pass/fail). P Charts have the advantage of taking into account the sample size (the number of work orders completed) and accounting for the high level of random fluctuations when the sample size is small (very few work orders completed).
The SPC charts are created a bit differently from the other charts described in this section. The following sections explains how the data object should be organized and how to select fields for the charts.
4.2.8.1 Creating an SPC Chart Data ObjectThe data object you design for the SPC charts has two columns. One column indicates which sample group each measurement belongs to, in our example this is a group number but it could also be a time stamp. The second column contains the measurements. Figure 4–3 is an example of how the SPC data object might look.
Figure 4–3 Sample SPC Data Object
4.2.8.2 Selecting Fields for SPC ChartsWhen you are creating the S Chart, R Chart, and P Chart, the field selection is different from that of other charts.
Note: By definition, S Charts plot standard deviation values on X-BAR, however, in previous versions of Oracle BAM, S charts plotted average/mean values on X-BAR. In 11.1.1.2.0 version of Oracle BAM and going forward, S Charts plot standard deviation values on X-BAR.
S Chart reports created earlier than 11.1.1.2.0 version will continue to show average values instead of standard deviation values. You must recreate the S chart to display standard deviation values on X-bar.
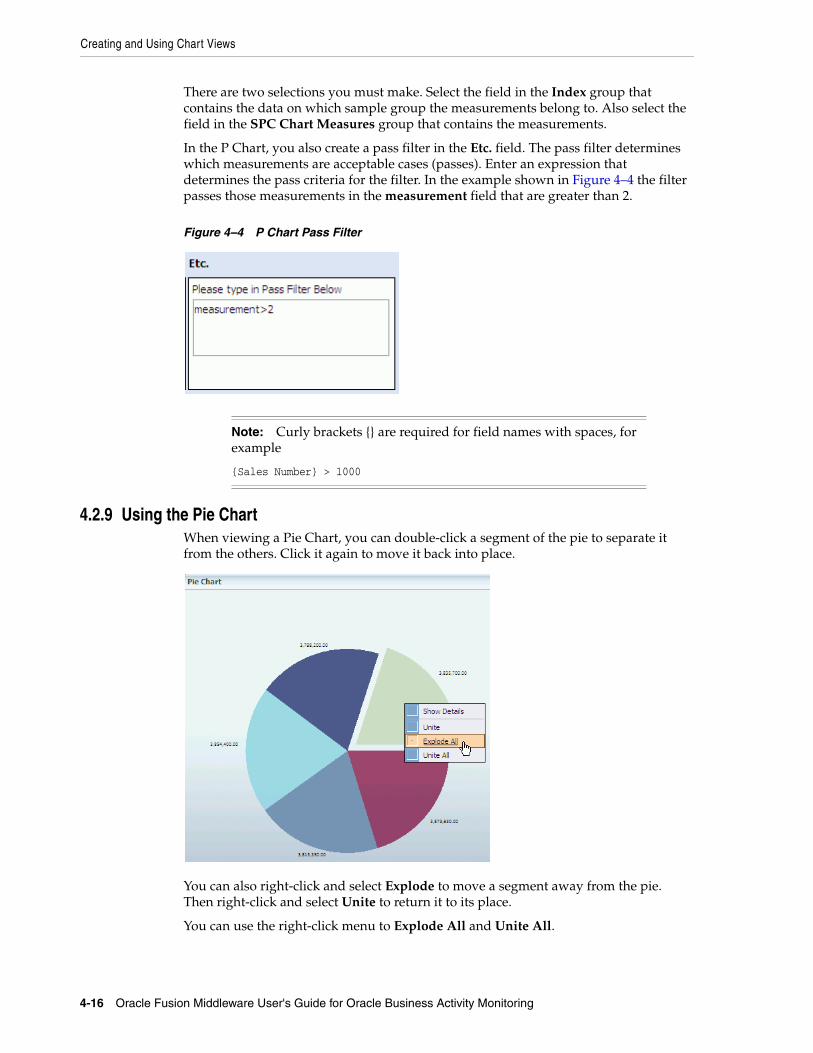
Creating and Using Chart Views
4-16 Oracle Fusion Middleware User's Guide for Oracle Business Activity Monitoring
There are two selections you must make. Select the field in the Index group that contains the data on which sample group the measurements belong to. Also select the field in the SPC Chart Measures group that contains the measurements.
In the P Chart, you also create a pass filter in the Etc. field. The pass filter determines which measurements are acceptable cases (passes). Enter an expression that determines the pass criteria for the filter. In the example shown in Figure 4–4 the filter passes those measurements in the measurement field that are greater than 2.
Figure 4–4 P Chart Pass Filter
4.2.9 Using the Pie ChartWhen viewing a Pie Chart, you can double-click a segment of the pie to separate it from the others. Click it again to move it back into place.
You can also right-click and select Explode to move a segment away from the pie. Then right-click and select Unite to return it to its place.
You can use the right-click menu to Explode All and Unite All.
Note: Curly brackets {} are required for field names with spaces, for example
{Sales Number} > 1000
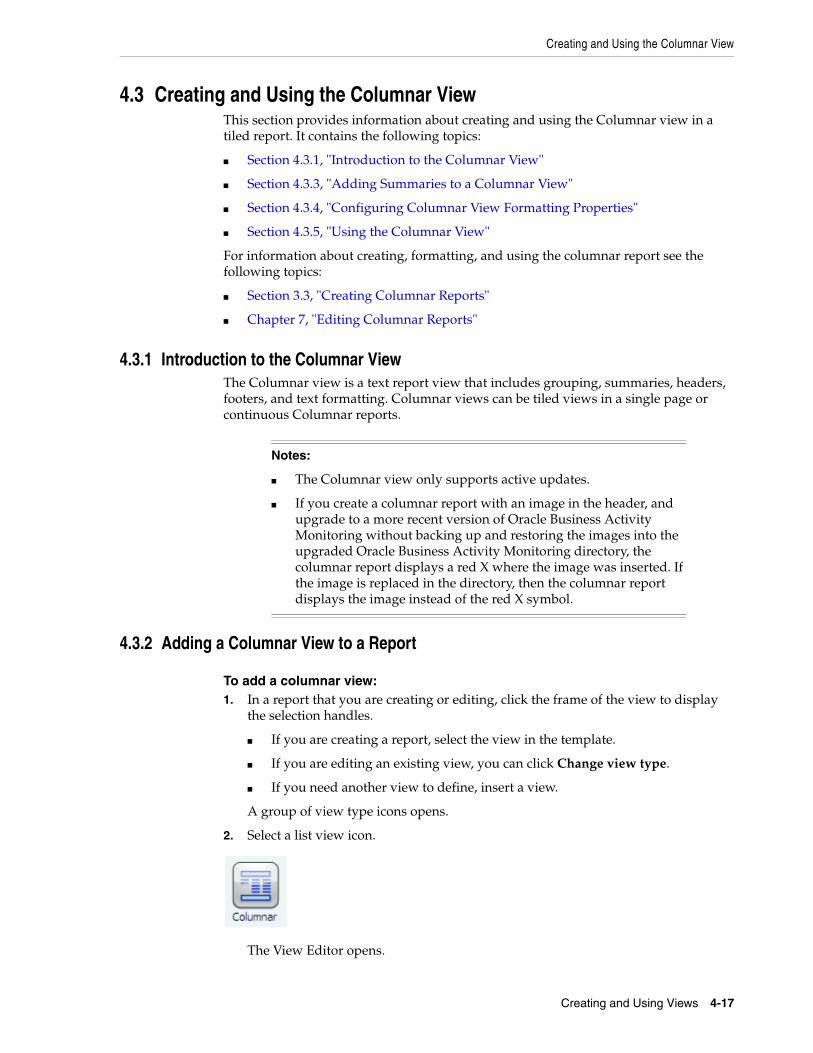
Creating and Using the Columnar View
Creating and Using Views 4-17
4.3 Creating and Using the Columnar ViewThis section provides information about creating and using the Columnar view in a tiled report. It contains the following topics:
■ Section 4.3.1, "Introduction to the Columnar View"
■ Section 4.3.3, "Adding Summaries to a Columnar View"
■ Section 4.3.4, "Configuring Columnar View Formatting Properties"
■ Section 4.3.5, "Using the Columnar View"
For information about creating, formatting, and using the columnar report see the following topics:
■ Section 3.3, "Creating Columnar Reports"
■ Chapter 7, "Editing Columnar Reports"
4.3.1 Introduction to the Columnar ViewThe Columnar view is a text report view that includes grouping, summaries, headers, footers, and text formatting. Columnar views can be tiled views in a single page or continuous Columnar reports.
4.3.2 Adding a Columnar View to a Report
To add a columnar view:1. In a report that you are creating or editing, click the frame of the view to display
the selection handles.
■ If you are creating a report, select the view in the template.
■ If you are editing an existing view, you can click Change view type.
■ If you need another view to define, insert a view.
A group of view type icons opens.
2. Select a list view icon.
The View Editor opens.
Notes:
■ The Columnar view only supports active updates.
■ If you create a columnar report with an image in the header, and upgrade to a more recent version of Oracle Business Activity Monitoring without backing up and restoring the images into the upgraded Oracle Business Activity Monitoring directory, the columnar report displays a red X where the image was inserted. If the image is replaced in the directory, then the columnar report displays the image instead of the red X symbol.
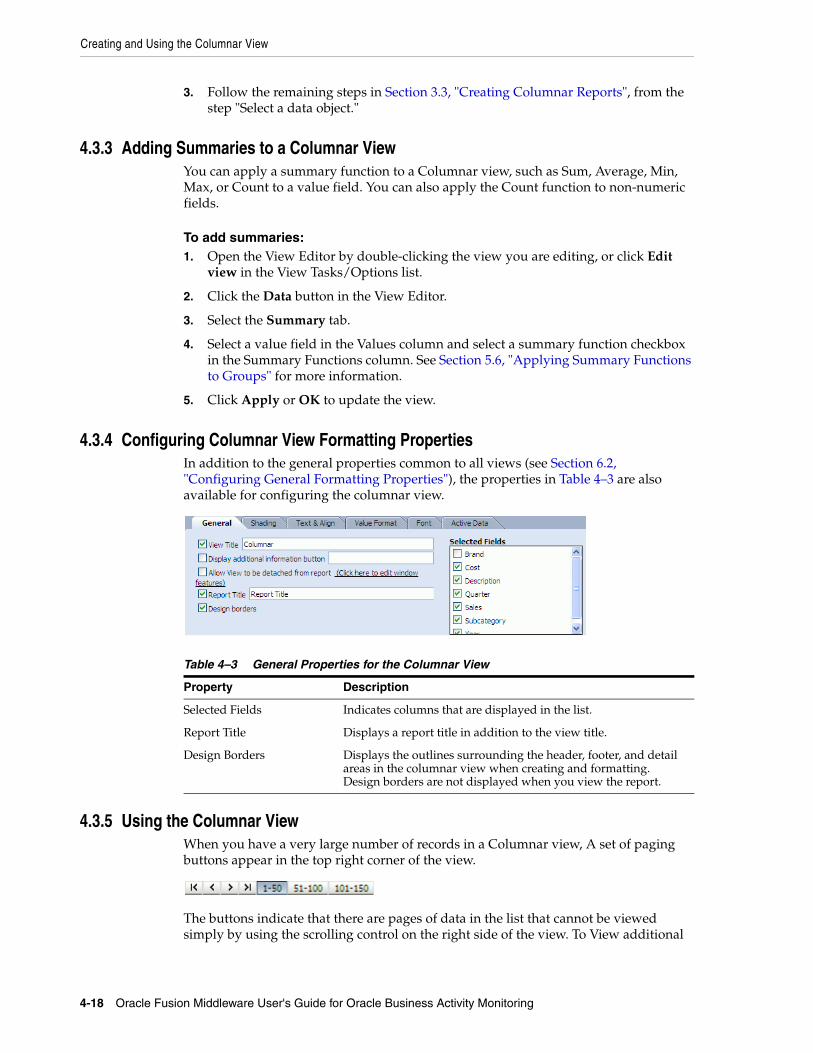
Creating and Using the Columnar View
4-18 Oracle Fusion Middleware User's Guide for Oracle Business Activity Monitoring
3. Follow the remaining steps in Section 3.3, "Creating Columnar Reports", from the step "Select a data object."
4.3.3 Adding Summaries to a Columnar ViewYou can apply a summary function to a Columnar view, such as Sum, Average, Min, Max, or Count to a value field. You can also apply the Count function to non-numeric fields.
To add summaries:1. Open the View Editor by double-clicking the view you are editing, or click Edit
view in the View Tasks/Options list.
2. Click the Data button in the View Editor.
3. Select the Summary tab.
4. Select a value field in the Values column and select a summary function checkbox in the Summary Functions column. See Section 5.6, "Applying Summary Functions to Groups" for more information.
5. Click Apply or OK to update the view.
4.3.4 Configuring Columnar View Formatting PropertiesIn addition to the general properties common to all views (see Section 6.2, "Configuring General Formatting Properties"), the properties in Table 4–3 are also available for configuring the columnar view.
4.3.5 Using the Columnar ViewWhen you have a very large number of records in a Columnar view, A set of paging buttons appear in the top right corner of the view.
The buttons indicate that there are pages of data in the list that cannot be viewed simply by using the scrolling control on the right side of the view. To View additional
Table 4–3 General Properties for the Columnar View
Property Description
Selected Fields Indicates columns that are displayed in the list.
Report Title Displays a report title in addition to the view title.
Design Borders Displays the outlines surrounding the header, footer, and detail areas in the columnar view when creating and formatting. Design borders are not displayed when you view the report.
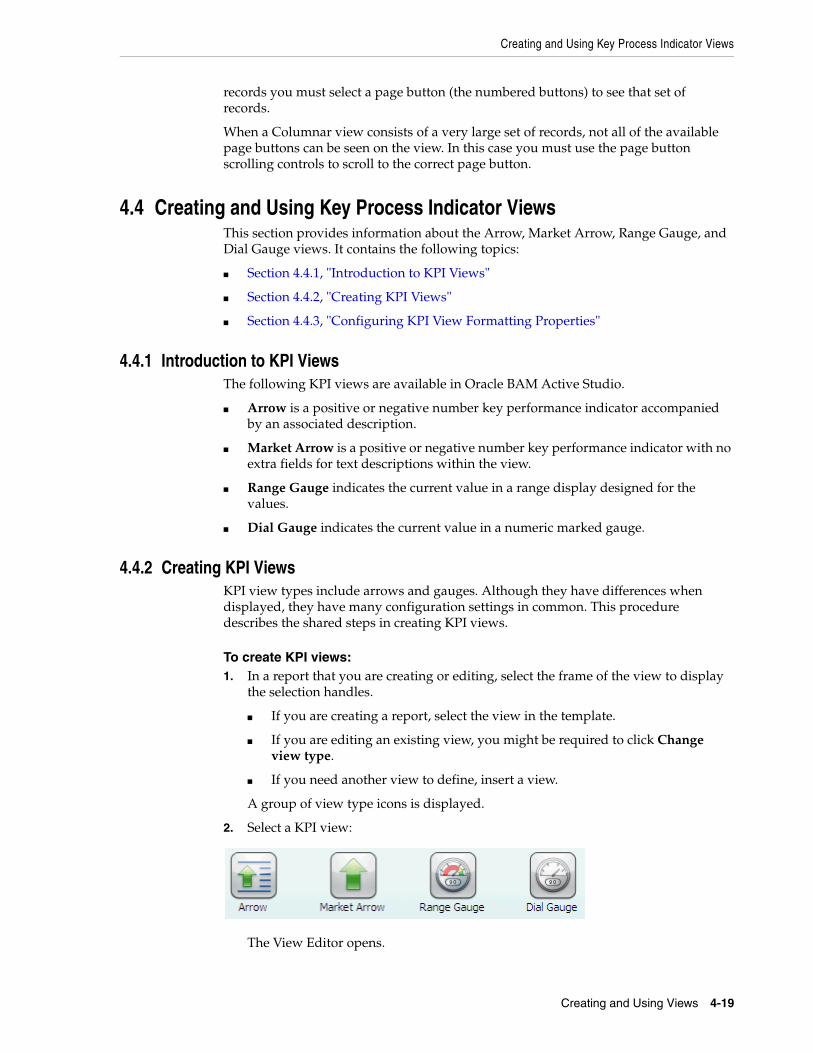
Creating and Using Key Process Indicator Views
Creating and Using Views 4-19
records you must select a page button (the numbered buttons) to see that set of records.
When a Columnar view consists of a very large set of records, not all of the available page buttons can be seen on the view. In this case you must use the page button scrolling controls to scroll to the correct page button.
4.4 Creating and Using Key Process Indicator ViewsThis section provides information about the Arrow, Market Arrow, Range Gauge, and Dial Gauge views. It contains the following topics:
■ Section 4.4.1, "Introduction to KPI Views"
■ Section 4.4.2, "Creating KPI Views"
■ Section 4.4.3, "Configuring KPI View Formatting Properties"
4.4.1 Introduction to KPI ViewsThe following KPI views are available in Oracle BAM Active Studio.
■ Arrow is a positive or negative number key performance indicator accompanied by an associated description.
■ Market Arrow is a positive or negative number key performance indicator with no extra fields for text descriptions within the view.
■ Range Gauge indicates the current value in a range display designed for the values.
■ Dial Gauge indicates the current value in a numeric marked gauge.
4.4.2 Creating KPI ViewsKPI view types include arrows and gauges. Although they have differences when displayed, they have many configuration settings in common. This procedure describes the shared steps in creating KPI views.
To create KPI views:1. In a report that you are creating or editing, select the frame of the view to display
the selection handles.
■ If you are creating a report, select the view in the template.
■ If you are editing an existing view, you might be required to click Change view type.
■ If you need another view to define, insert a view.
A group of view type icons is displayed.
2. Select a KPI view:
The View Editor opens.
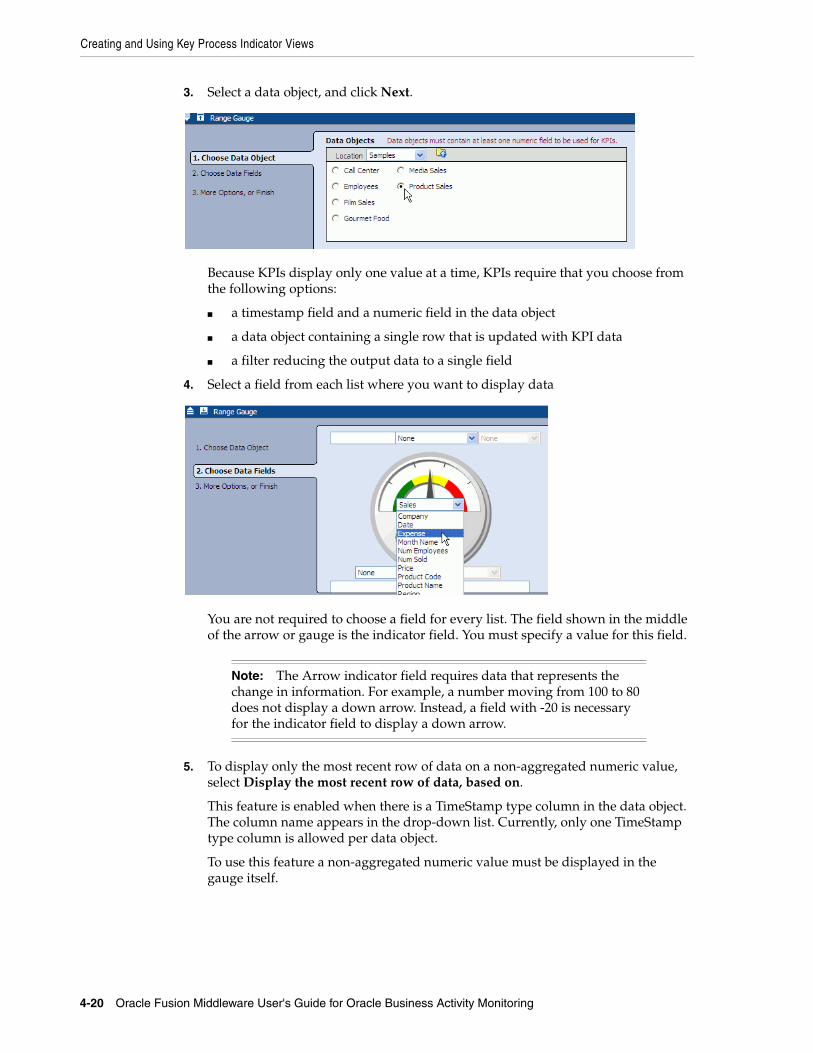
Creating and Using Key Process Indicator Views
4-20 Oracle Fusion Middleware User's Guide for Oracle Business Activity Monitoring
3. Select a data object, and click Next.
Because KPIs display only one value at a time, KPIs require that you choose from the following options:
■ a timestamp field and a numeric field in the data object
■ a data object containing a single row that is updated with KPI data
■ a filter reducing the output data to a single field
4. Select a field from each list where you want to display data
You are not required to choose a field for every list. The field shown in the middle of the arrow or gauge is the indicator field. You must specify a value for this field.
5. To display only the most recent row of data on a non-aggregated numeric value, select Display the most recent row of data, based on.
This feature is enabled when there is a TimeStamp type column in the data object. The column name appears in the drop-down list. Currently, only one TimeStamp type column is allowed per data object.
To use this feature a non-aggregated numeric value must be displayed in the gauge itself.
Note: The Arrow indicator field requires data that represents the change in information. For example, a number moving from 100 to 80 does not display a down arrow. Instead, a field with -20 is necessary for the indicator field to display a down arrow.
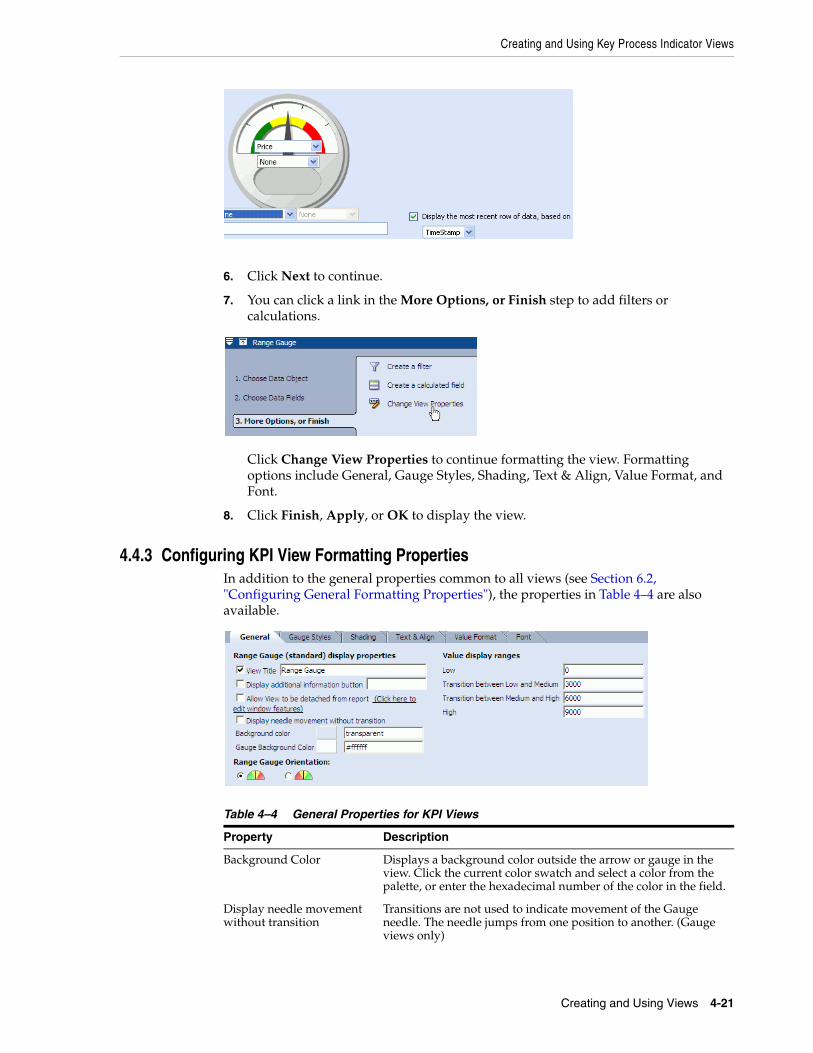
Creating and Using Key Process Indicator Views
Creating and Using Views 4-21
6. Click Next to continue.
7. You can click a link in the More Options, or Finish step to add filters or calculations.
Click Change View Properties to continue formatting the view. Formatting options include General, Gauge Styles, Shading, Text & Align, Value Format, and Font.
8. Click Finish, Apply, or OK to display the view.
4.4.3 Configuring KPI View Formatting PropertiesIn addition to the general properties common to all views (see Section 6.2, "Configuring General Formatting Properties"), the properties in Table 4–4 are also available.
Table 4–4 General Properties for KPI Views
Property Description
Background Color Displays a background color outside the arrow or gauge in the view. Click the current color swatch and select a color from the palette, or enter the hexadecimal number of the color in the field.
Display needle movement without transition
Transitions are not used to indicate movement of the Gauge needle. The needle jumps from one position to another. (Gauge views only)
Creating and Using Key Process Indicator Views
4-22 Oracle Fusion Middleware User's Guide for Oracle Business Activity Monitoring
4.4.4 Selecting a Gauge StyleThe Range Gauge and Dial Gauge views offer a few different styles to choose from: Medallion, Horizon, and High Performance.
To change the appearance of a gauge view, open the View Editor and select Properties. Then select the Gauge Styles tab and choose a style from the drop down list.
Gauge Background Color Displays a background color inside the gauge (Gauge views only). Click the current color swatch and select a color from the palette, or enter the hexadecimal number of the color in the field.
Range Gauge Orientation Indicates whether to display the range colors from green to red, or red to green when reading the gauge left to right. The order you choose should relate to the meaning represented by large numbers in the view. Select whether to display the range colors with green on the left and red on the right or red on the left and green on the right. (Range Gauge only).
Value display ranges Indicates the ranges for Low, Medium, and High on the gauge (Gauge views only).
Range Gauge value display ranges:
Low: Enter the minimum value to display in the gauge. This can be a nonzero value. If the value being measured is lower than this minimum, the gauge arrow changes to yellow instead of black.
Transition between Low and Medium: Enter a value at which the needle leaves the Low range and enters the Medium range of values.
Transition between Medium and High: Enter a value at which the needle leaves the Medium range and enters the High range of values.
High: Enter the maximum value to display in the gauge. If the value being measured is higher than this maximum, the gauge arrow changes to yellow instead of black.
Dial Gauge value display ranges:
Minimum Value: Enter the minimum value to display on the gauge. This can be a nonzero value. If the value being measured is lower than this minimum, the gauge arrow is yellow instead of black.
Maximum Value: Enter the maximum value to display in the gauge. If the value being measured is higher than this maximum, the gauge arrow is yellow instead of black.
Increment: Enter an increment amount to display as lines in the dial. The Maximum Value must be divisible by the number entered here.
Auto Increment: Automatically calculates the increments.
Table 4–4 (Cont.) General Properties for KPI Views
Property Description
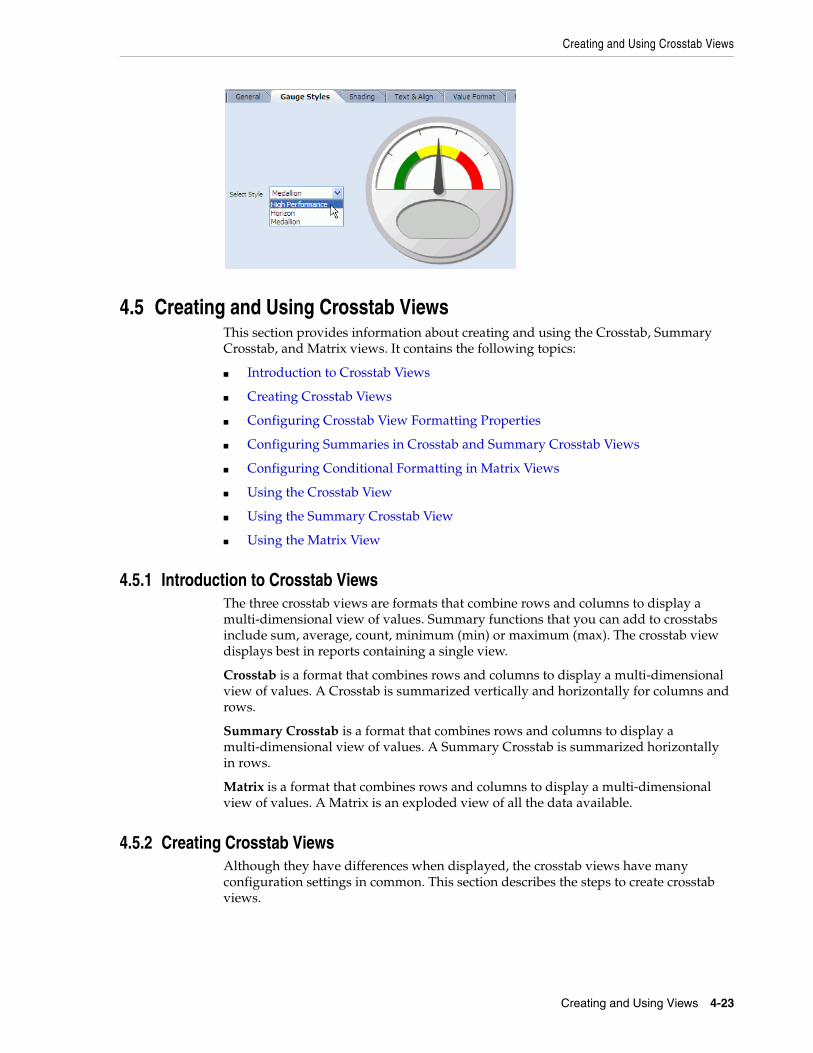
Creating and Using Crosstab Views
Creating and Using Views 4-23
4.5 Creating and Using Crosstab ViewsThis section provides information about creating and using the Crosstab, Summary Crosstab, and Matrix views. It contains the following topics:
■ Introduction to Crosstab Views
■ Creating Crosstab Views
■ Configuring Crosstab View Formatting Properties
■ Configuring Summaries in Crosstab and Summary Crosstab Views
■ Configuring Conditional Formatting in Matrix Views
■ Using the Crosstab View
■ Using the Summary Crosstab View
■ Using the Matrix View
4.5.1 Introduction to Crosstab ViewsThe three crosstab views are formats that combine rows and columns to display a multi-dimensional view of values. Summary functions that you can add to crosstabs include sum, average, count, minimum (min) or maximum (max). The crosstab view displays best in reports containing a single view.
Crosstab is a format that combines rows and columns to display a multi-dimensional view of values. A Crosstab is summarized vertically and horizontally for columns and rows.
Summary Crosstab is a format that combines rows and columns to display a multi-dimensional view of values. A Summary Crosstab is summarized horizontally in rows.
Matrix is a format that combines rows and columns to display a multi-dimensional view of values. A Matrix is an exploded view of all the data available.
4.5.2 Creating Crosstab ViewsAlthough they have differences when displayed, the crosstab views have many configuration settings in common. This section describes the steps to create crosstab views.
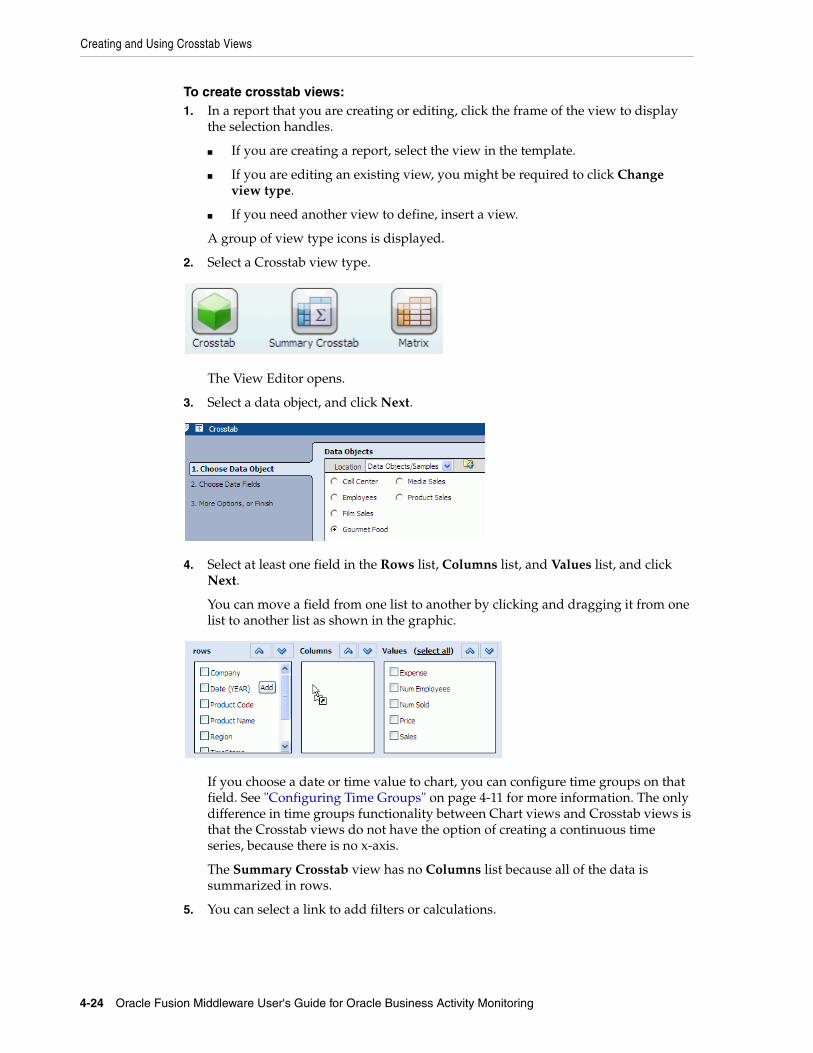
Creating and Using Crosstab Views
4-24 Oracle Fusion Middleware User's Guide for Oracle Business Activity Monitoring
To create crosstab views:1. In a report that you are creating or editing, click the frame of the view to display
the selection handles.
■ If you are creating a report, select the view in the template.
■ If you are editing an existing view, you might be required to click Change view type.
■ If you need another view to define, insert a view.
A group of view type icons is displayed.
2. Select a Crosstab view type.
The View Editor opens.
3. Select a data object, and click Next.
4. Select at least one field in the Rows list, Columns list, and Values list, and click Next.
You can move a field from one list to another by clicking and dragging it from one list to another list as shown in the graphic.
If you choose a date or time value to chart, you can configure time groups on that field. See "Configuring Time Groups" on page 4-11 for more information. The only difference in time groups functionality between Chart views and Crosstab views is that the Crosstab views do not have the option of creating a continuous time series, because there is no x-axis.
The Summary Crosstab view has no Columns list because all of the data is summarized in rows.
5. You can select a link to add filters or calculations.
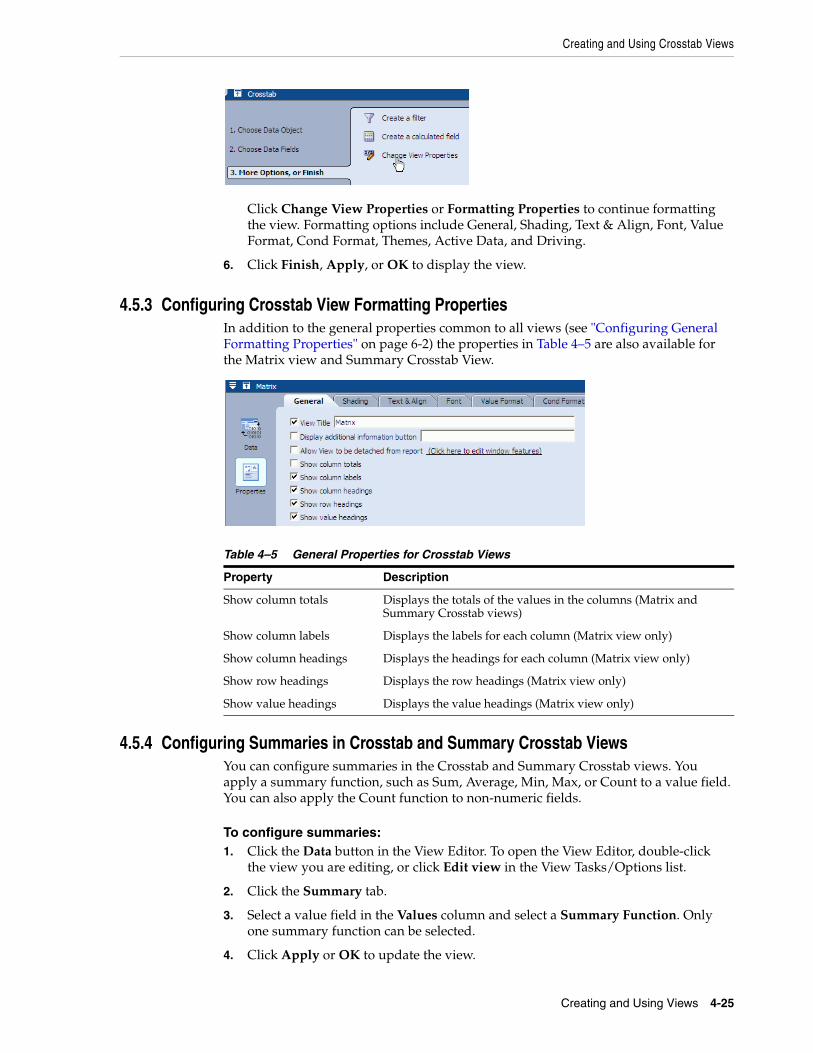
Creating and Using Crosstab Views
Creating and Using Views 4-25
Click Change View Properties or Formatting Properties to continue formatting the view. Formatting options include General, Shading, Text & Align, Font, Value Format, Cond Format, Themes, Active Data, and Driving.
6. Click Finish, Apply, or OK to display the view.
4.5.3 Configuring Crosstab View Formatting PropertiesIn addition to the general properties common to all views (see "Configuring General Formatting Properties" on page 6-2) the properties in Table 4–5 are also available for the Matrix view and Summary Crosstab View.
4.5.4 Configuring Summaries in Crosstab and Summary Crosstab ViewsYou can configure summaries in the Crosstab and Summary Crosstab views. You apply a summary function, such as Sum, Average, Min, Max, or Count to a value field. You can also apply the Count function to non-numeric fields.
To configure summaries:1. Click the Data button in the View Editor. To open the View Editor, double-click
the view you are editing, or click Edit view in the View Tasks/Options list.
2. Click the Summary tab.
3. Select a value field in the Values column and select a Summary Function. Only one summary function can be selected.
4. Click Apply or OK to update the view.
Table 4–5 General Properties for Crosstab Views
Property Description
Show column totals Displays the totals of the values in the columns (Matrix and Summary Crosstab views)
Show column labels Displays the labels for each column (Matrix view only)
Show column headings Displays the headings for each column (Matrix view only)
Show row headings Displays the row headings (Matrix view only)
Show value headings Displays the value headings (Matrix view only)
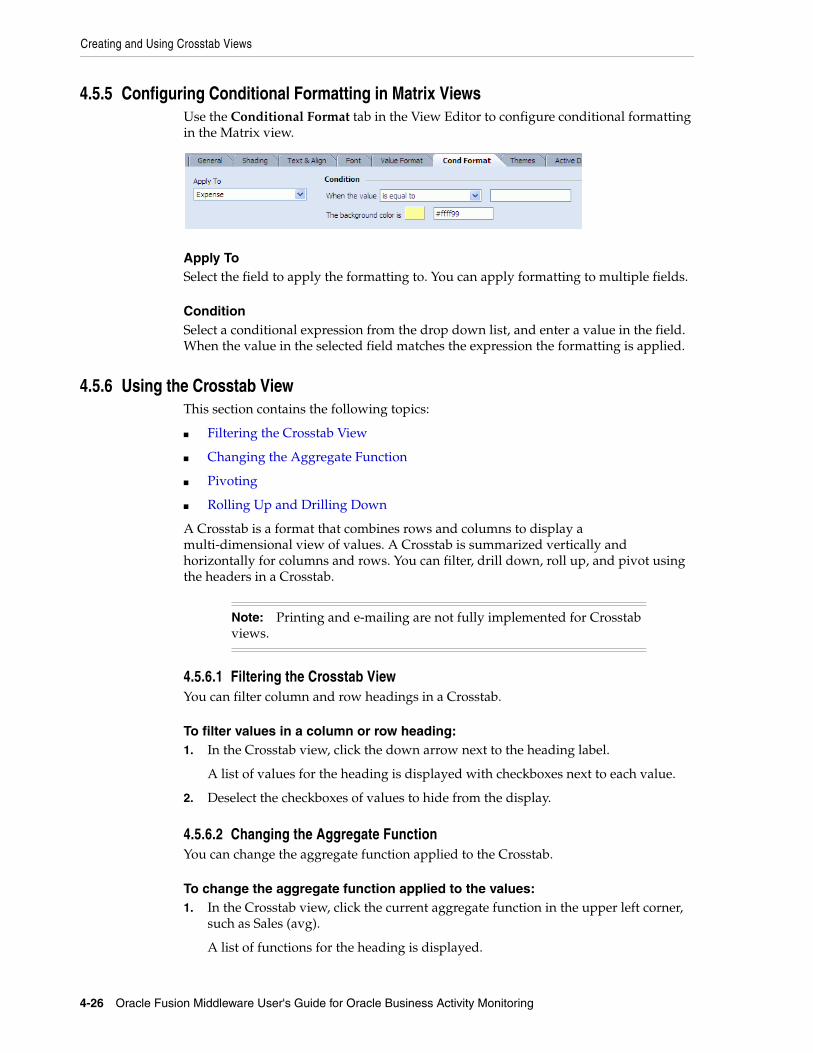
Creating and Using Crosstab Views
4-26 Oracle Fusion Middleware User's Guide for Oracle Business Activity Monitoring
4.5.5 Configuring Conditional Formatting in Matrix ViewsUse the Conditional Format tab in the View Editor to configure conditional formatting in the Matrix view.
Apply ToSelect the field to apply the formatting to. You can apply formatting to multiple fields.
ConditionSelect a conditional expression from the drop down list, and enter a value in the field. When the value in the selected field matches the expression the formatting is applied.
4.5.6 Using the Crosstab ViewThis section contains the following topics:
■ Filtering the Crosstab View
■ Changing the Aggregate Function
■ Pivoting
■ Rolling Up and Drilling Down
A Crosstab is a format that combines rows and columns to display a multi-dimensional view of values. A Crosstab is summarized vertically and horizontally for columns and rows. You can filter, drill down, roll up, and pivot using the headers in a Crosstab.
4.5.6.1 Filtering the Crosstab ViewYou can filter column and row headings in a Crosstab.
To filter values in a column or row heading:1. In the Crosstab view, click the down arrow next to the heading label.
A list of values for the heading is displayed with checkboxes next to each value.
2. Deselect the checkboxes of values to hide from the display.
4.5.6.2 Changing the Aggregate FunctionYou can change the aggregate function applied to the Crosstab.
To change the aggregate function applied to the values:1. In the Crosstab view, click the current aggregate function in the upper left corner,
such as Sales (avg).
A list of functions for the heading is displayed.
Note: Printing and e-mailing are not fully implemented for Crosstab views.
Creating and Using Crosstab Views
Creating and Using Views 4-27
2. Select the aggregate function to apply.
The values update and display.
4.5.6.3 Changing Row and Column OrderYou can change the order of rows (or columns) by dragging a row (or column) above or below (to the left or right) another row (column heading).
4.5.6.4 Pivoting You can pivot data by dragging a column heading to become a row heading in the Crosstab view.
To pivot the view of data:1. Click and drag a heading from a location as a column heading to a row heading.
A red line is displayed on the current row headings to indicate where to display it.
2. Release the mouse button to drop the heading in the other location.
The data displayed in the Crosstab reflects the updated combination of row and column headings.
4.5.6.5 Rolling Up and Drilling DownYou can roll up or drill down in headings.
To roll up or drill down for a heading:1. Click the plus sign (+) to drill down and display the values using the details of the
heading.
2. Click the minus sign (-) to roll up values into a whole number for the heading.
4.5.7 Using the Summary Crosstab ViewThis section contains the following topics:
■ Filtering the Summary Crosstab View
■ Changing the Aggregate Function
■ Rolling Up and Drilling Down
■ Sorting the Summary Crosstab View
A Summary Crosstab is a format that combines rows and columns to display a multi-dimensional view of values. A Summary Crosstab is summarized horizontally in rows. You can filter, change the aggregate function, drill down, roll up, and sort using the headers in a Summary Crosstab.
4.5.7.1 Filtering the Summary Crosstab ViewYou can filter column and row headings in a Summary Crosstab.
To filter values in a column heading:1. In the Summary Crosstab view, click the down arrow next to the heading label.
A list of values for the heading is displayed with checkboxes next to each value.
2. Deselect the checkboxes of values to hide from the display.
Creating and Using the Excel View
4-28 Oracle Fusion Middleware User's Guide for Oracle Business Activity Monitoring
4.5.7.2 Changing the Aggregate FunctionYou can change the aggregate function applied to the Summary Crosstab.
To change the aggregate function applied to the values:1. In the Summary Crosstab view, click the current aggregate function in the upper
left corner, such as Sales (sum).
A list of functions for the heading is displayed.
2. Select the aggregate function to apply.
The values update and display.
4.5.7.3 Rolling Up and Drilling DownYou can roll up or drill down in headings.
To roll up or drill down for a heading:1. Click the plus sign (+) to drill down and display the values using the details of the
heading.
2. Click the minus sign (-) to roll up values into a whole number for the heading.
4.5.7.4 Sorting the Summary Crosstab ViewYou can sort the rows in a Summary Crosstab view on the aggregate column.
To sort the Summary Crosstab view:1. Click the sorting icon next the heading.
2. Select Ascending, Descending, or None.
The rows are sorted.
4.5.8 Using the Matrix ViewA Matrix is a format that combines rows and columns to display a multi-dimensional view of values. A Matrix is an exploded view of all the data available. You cannot sort, filter, drill down, pivot, or change the aggregate function in a Matrix view.
4.6 Creating and Using the Excel ViewThis section provides information about creating and using the Excel spreadsheet view. It contains the following topics:
■ Introduction to the Excel View
■ Creating an Excel View
■ Using the Excel View
4.6.1 Introduction to the Excel ViewThe Excel spreadsheet view displays columns containing rows of data in a Microsoft Excel spreadsheet. This view enables you to save the content externally (outside of the Oracle BAM applications) in a Microsoft Excel spreadsheet.
The Excel view requires that Microsoft Excel version XP, 2003, or 2007 is installed on the client computer.
Creating and Using the Excel View
Creating and Using Views 4-29
4.6.2 Creating an Excel ViewThis section describes the steps to create Excel views.
To create Excel views:1. In a report that you are creating or editing, click the frame of the view to display
the selection handles.
■ If you are creating a report, select the view in the template.
■ If you are editing an existing view, you might be required to click Change view type.
■ If you need another view to define, insert a view.
A group of view type icons is displayed.
2. Select the Excel view type.
A dialog box opens for you to accept a CAB file (oraclebam.cab) that contains an ActiveX control. The ActiveX control enables Microsoft Excel to run inside of Oracle BAM Active Studio.
3. Click Install to accept the CAB file.
The View Editor opens.
4. Select a data object. The data object is the source of data for the report.
5. Click Next.
6. Select the field checkboxes you want to include in the spreadsheet.
Click select none to clear all of the checkboxes. The link switches to select all so that you can select all fields again.
If the data object contains 10 or fewer fields, the fields are automatically selected in the Data Fields list. If it has more than 10, you must manually select fields.
7. Click Next.
The list of additional options is displayed.
8. You can click a link to add data modifiers or formatting properties.
9. Click Change View Properties to continue working with the view. Other options include data transfer and applying macros to run before or after each data update. Formatting options include General, Shading, Text & Align, and Font.
10. Click Finish, Apply, or OK to display the view.
4.6.3 Configuring Excel View Formatting PropertiesIn addition to the general properties common to all views (see "Configuring General Formatting Properties" on page 6-2) the properties in Table 4–6 are available for the Excel view.
Table 4–6 General Properties for Excel Views
Property Description
Hide Excel Toolbar While Viewing
Hides the Microsoft Excel toolbar while the report is in view mode (except Save and Help commands). Enable this property when you do not want report users to execute Excel commands within the view.
Creating and Using the Excel View
4-30 Oracle Fusion Middleware User's Guide for Oracle Business Activity Monitoring
4.6.4 Using the Excel ViewWhen viewing or editing an Excel spreadsheet in Oracle BAM Active Studio, you can use the Microsoft Excel toolbars and menu options available in the Oracle BAM dashboard. However, you cannot use the New and Save toolbar buttons from inside Oracle BAM Active Studio.
4.6.4.1 Saving the Excel Spreadsheet Outside of Oracle BAMYou can save the Excel spreadsheet outside of Oracle BAM Active Studio.
To save the Excel spreadsheet outside of Oracle BAM Active Studio:1. On the Excel toolbar, click File>Save As.
The Save As dialog box opens.
2. Type a file name for the Excel spreadsheet, select a location, and click Save.
4.6.4.2 Viewing Named RangesOracle BAM Active Studio automatically creates named ranges for each column in the Excel spreadsheet view.
To view the named ranges and their definitions:■ On the Excel menu bar, select Insert > Name > Define.
Save in Excel 97-2003 format Gives you the option of saving the Excel view in Microsoft Excel 97 or Microsoft Excel 2003 format if you installed Microsoft Excel 2007. This option is only enabled if Microsoft Excel 2007 is installed on the machine.
If you have Microsoft Excel 2007, and you do not select this option, the view will be saved in Microsoft Excel 2007 format. Therefore, if a user later tries to open the report with Microsoft Excel 97 (XP) or Microsoft Excel 2003, it will fail.
If you have Microsoft Excel 97 or Microsoft Excel 2003, the checkbox will be pre-selected and disabled (because the only option is to save the view in Microsoft Excel 97-2003 format).
Notes:
■ Applying sorting to an entire column includes the header. In most cases, you want the header cell to remain as the header cell. When you sort a column, select only the cells to be sorted.
■ Data that is blank displays as (Null) in an Excel view, although filters on blank strings return the rows containing the blanks as expected. For data objects intended to display in an Excel view, the data designer might prefer to substitute the blank or null values in the data object with other representative values for clarity.
Table 4–6 (Cont.) General Properties for Excel Views
Property Description
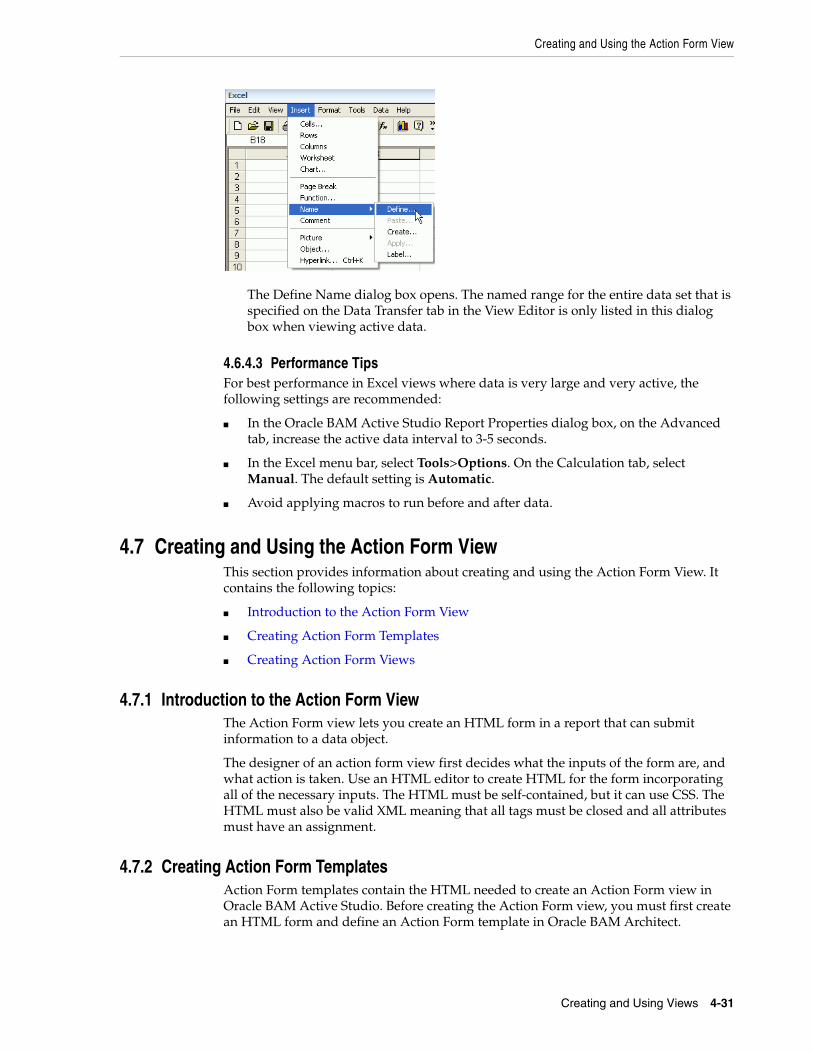
Creating and Using the Action Form View
Creating and Using Views 4-31
The Define Name dialog box opens. The named range for the entire data set that is specified on the Data Transfer tab in the View Editor is only listed in this dialog box when viewing active data.
4.6.4.3 Performance TipsFor best performance in Excel views where data is very large and very active, the following settings are recommended:
■ In the Oracle BAM Active Studio Report Properties dialog box, on the Advanced tab, increase the active data interval to 3-5 seconds.
■ In the Excel menu bar, select Tools>Options. On the Calculation tab, select Manual. The default setting is Automatic.
■ Avoid applying macros to run before and after data.
4.7 Creating and Using the Action Form ViewThis section provides information about creating and using the Action Form View. It contains the following topics:
■ Introduction to the Action Form View
■ Creating Action Form Templates
■ Creating Action Form Views
4.7.1 Introduction to the Action Form ViewThe Action Form view lets you create an HTML form in a report that can submit information to a data object.
The designer of an action form view first decides what the inputs of the form are, and what action is taken. Use an HTML editor to create HTML for the form incorporating all of the necessary inputs. The HTML must be self-contained, but it can use CSS. The HTML must also be valid XML meaning that all tags must be closed and all attributes must have an assignment.
4.7.2 Creating Action Form TemplatesAction Form templates contain the HTML needed to create an Action Form view in Oracle BAM Active Studio. Before creating the Action Form view, you must first create an HTML form and define an Action Form template in Oracle BAM Architect.
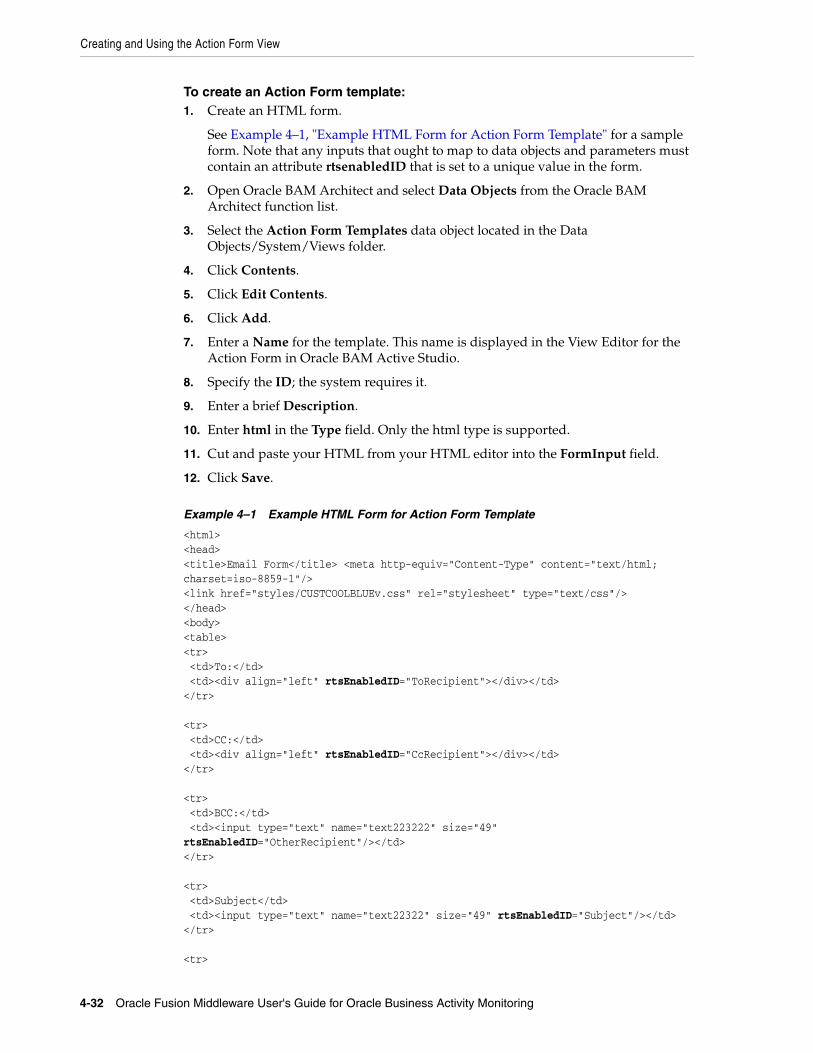
Creating and Using the Action Form View
4-32 Oracle Fusion Middleware User's Guide for Oracle Business Activity Monitoring
To create an Action Form template:1. Create an HTML form.
See Example 4–1, "Example HTML Form for Action Form Template" for a sample form. Note that any inputs that ought to map to data objects and parameters must contain an attribute rtsenabledID that is set to a unique value in the form.
2. Open Oracle BAM Architect and select Data Objects from the Oracle BAM Architect function list.
3. Select the Action Form Templates data object located in the Data Objects/System/Views folder.
4. Click Contents.
5. Click Edit Contents.
6. Click Add.
7. Enter a Name for the template. This name is displayed in the View Editor for the Action Form in Oracle BAM Active Studio.
8. Specify the ID; the system requires it.
9. Enter a brief Description.
10. Enter html in the Type field. Only the html type is supported.
11. Cut and paste your HTML from your HTML editor into the FormInput field.
12. Click Save.
Example 4–1 Example HTML Form for Action Form Template
<html> <head> <title>Email Form</title> <meta http-equiv="Content-Type" content="text/html; charset=iso-8859-1"/> <link href="styles/CUSTCOOLBLUEv.css" rel="stylesheet" type="text/css"/> </head><body><table><tr> <td>To:</td> <td><div align="left" rtsEnabledID="ToRecipient"></div></td></tr> <tr> <td>CC:</td> <td><div align="left" rtsEnabledID="CcRecipient"></div></td></tr> <tr> <td>BCC:</td> <td><input type="text" name="text223222" size="49" rtsEnabledID="OtherRecipient"/></td></tr> <tr> <td>Subject</td> <td><input type="text" name="text22322" size="49" rtsEnabledID="Subject"/></td></tr> <tr>
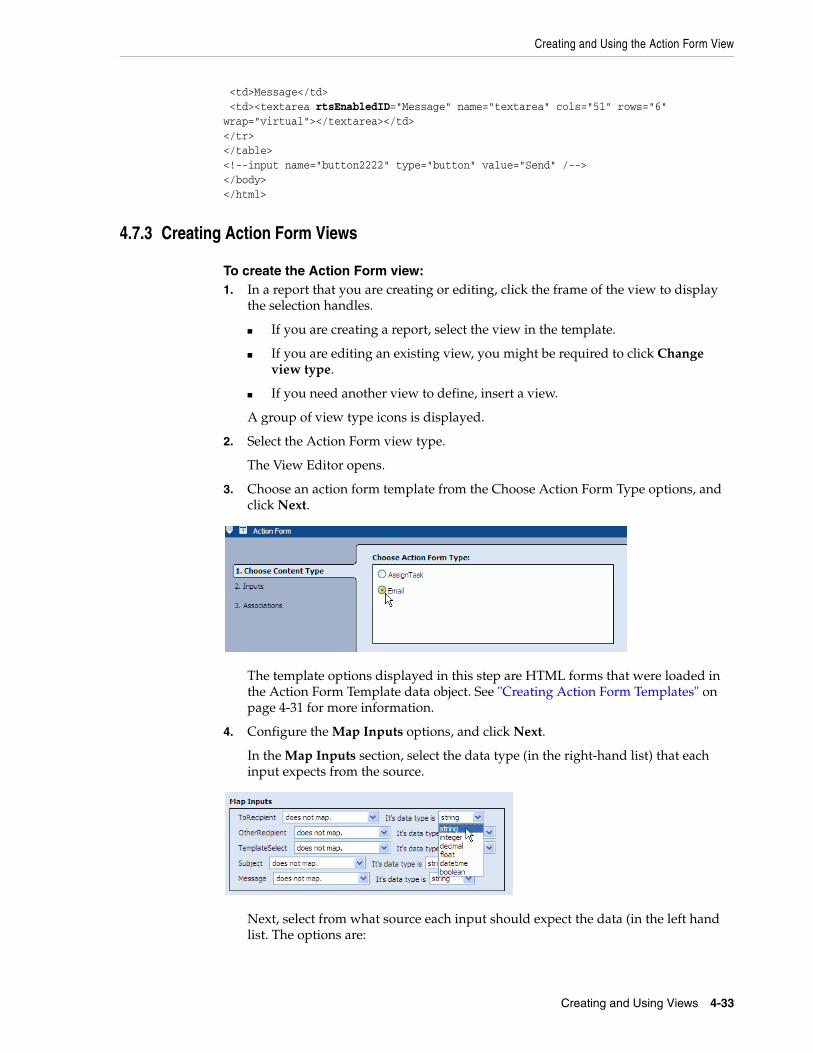
Creating and Using the Action Form View
Creating and Using Views 4-33
<td>Message</td> <td><textarea rtsEnabledID="Message" name="textarea" cols="51" rows="6" wrap="virtual"></textarea></td></tr></table> <!--input name="button2222" type="button" value="Send" /--> </body> </html>
4.7.3 Creating Action Form Views
To create the Action Form view:1. In a report that you are creating or editing, click the frame of the view to display
the selection handles.
■ If you are creating a report, select the view in the template.
■ If you are editing an existing view, you might be required to click Change view type.
■ If you need another view to define, insert a view.
A group of view type icons is displayed.
2. Select the Action Form view type.
The View Editor opens.
3. Choose an action form template from the Choose Action Form Type options, and click Next.
The template options displayed in this step are HTML forms that were loaded in the Action Form Template data object. See "Creating Action Form Templates" on page 4-31 for more information.
4. Configure the Map Inputs options, and click Next.
In the Map Inputs section, select the data type (in the right-hand list) that each input expects from the source.
Next, select from what source each input should expect the data (in the left hand list. The options are:
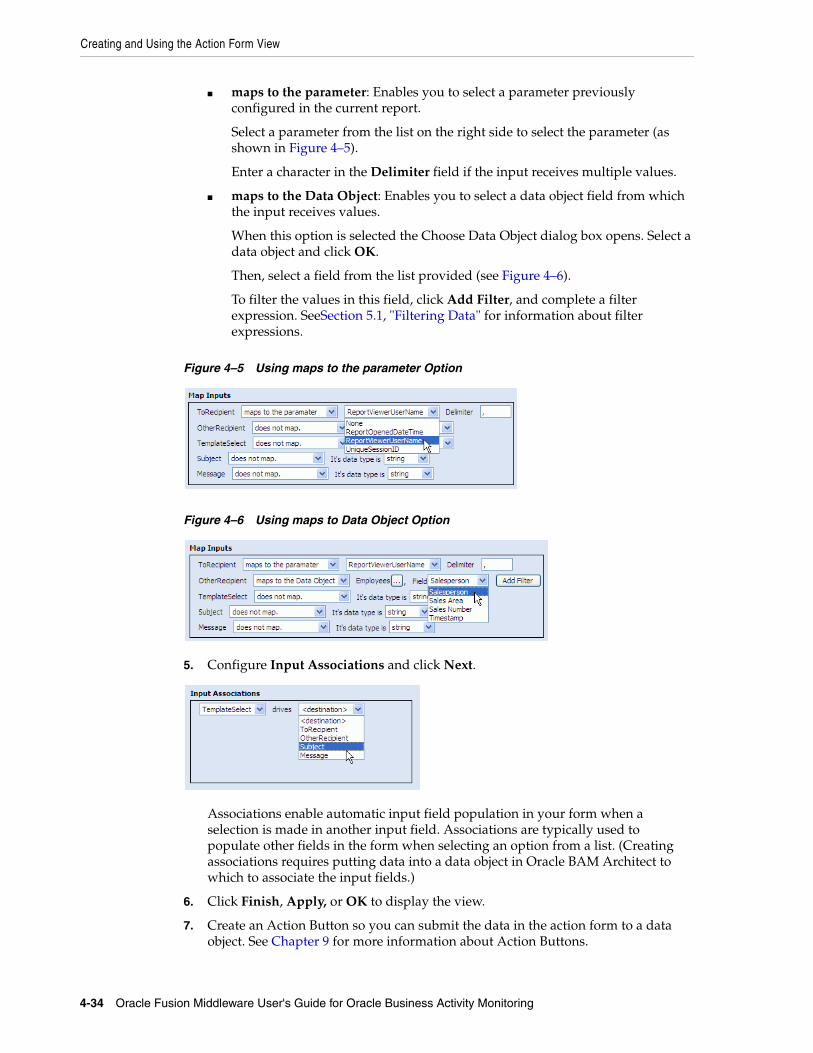
Creating and Using the Action Form View
4-34 Oracle Fusion Middleware User's Guide for Oracle Business Activity Monitoring
■ maps to the parameter: Enables you to select a parameter previously configured in the current report.
Select a parameter from the list on the right side to select the parameter (as shown in Figure 4–5).
Enter a character in the Delimiter field if the input receives multiple values.
■ maps to the Data Object: Enables you to select a data object field from which the input receives values.
When this option is selected the Choose Data Object dialog box opens. Select a data object and click OK.
Then, select a field from the list provided (see Figure 4–6).
To filter the values in this field, click Add Filter, and complete a filter expression. SeeSection 5.1, "Filtering Data" for information about filter expressions.
Figure 4–5 Using maps to the parameter Option
Figure 4–6 Using maps to Data Object Option
5. Configure Input Associations and click Next.
Associations enable automatic input field population in your form when a selection is made in another input field. Associations are typically used to populate other fields in the form when selecting an option from a list. (Creating associations requires putting data into a data object in Oracle BAM Architect to which to associate the input fields.)
6. Click Finish, Apply, or OK to display the view.
7. Create an Action Button so you can submit the data in the action form to a data object. See Chapter 9 for more information about Action Buttons.
Creating and Using the External Content View
Creating and Using Views 4-35
4.8 Creating and Using the External Content ViewThis section provides information about creating and using the External Content view. It contains the following topics:
■ Introduction to the External Content View
■ Creating External Content Views
4.8.1 Introduction to the External Content ViewThe External Content view is for displaying URLs, files, or static images in a report. The External Content view includes only the General tab in Formatting Properties. No other formatting tabs are included.
4.8.2 Creating External Content ViewsExternal content views display either a Web page external to Oracle BAM Active Studio or an image. Images must be in either JPG or GIF format.
To create external content views:1. In a report that you are creating or editing, click the frame of the view to display
the selection handles.
■ If you are creating a report, select the view in the template.
■ If you are editing an existing view, you might be required to click Change view type.
■ If you need another view to define, insert a view.
A group of view type icons is displayed.
2. Click the External Content view type.
The View Editor opens.
3. Enter the Web Page URL for the page you want displayed in this view.
4. To refresh the content automatically, click Yes, and specify how often to refresh the display. Enter a number and select a measurement of time from the list.
5. Click Apply or OK to display the view.
Notes:
■ If users navigate to another page with the External Content view set to refresh, the original URL is displayed again when it refreshes. If the content is static and does not require refreshing, select No for the Refresh this content automatically setting.
■ Because the External Content view displays referenced image files, if you delete the image file from the specified location, a red X is displayed when the report is viewed. The red X indicates that the image cannot be found. Replace the image in the specified location to view it again.
■ Some Web sites contain Java script which causes them to load into the top frame of the Web browser, taking over the entire browser window. Oracle BAM cannot control this behavior, so these URLs should not be used in external content views.
Creating and Using Utility Views
4-36 Oracle Fusion Middleware User's Guide for Oracle Business Activity Monitoring
4.9 Creating and Using Utility ViewsThis section provides information about creating and using the Surface Prompts, Container, Row Group, Column Group, Tab Group, and Dashboard views. It contains the following topics:
■ Introduction to the Utility Views
■ Creating the Surface Prompts View
■ Creating the Container View
■ Creating the Row Group and Column Group Views
■ Creating the Tab Group View
■ Creating the Dashboard View
4.9.1 Introduction to the Utility ViewsThe utility views allow you to add organization and functionality to reports and groups of views.
Surface prompts let report users interact with the report content by selecting from a list of items to display. The Surface Prompt view provides a space on the report for displaying the surface prompts.
The Container, Row Group, and Column Group views allow you to create views within views.
You can split a view into two or more frames using a Container view; however (unlike views within a Row Group or Column Group) views that are created inside a Container are not contained in the Container. They are not bound by the Container borders, so resizing the container does not resize the internal views, and deleting a container does not delete the internal views.
The Container view acts as a visual divider for the dashboard rather than a containment system for them. It is useful when you want to use one continuous splash graphic behind a group of graphs.
You can split a view into two or more frames using a Row Group or Column Group view. These views also contain additional controls for the group of views they contain.
The Tab Group view is used to arrange reports within reports. Tab Group views consist of a multipage collection of reports.
The Dashboard view is used to arrange reports within reports. Dashboard views can consist of a collection of Tab Group reports or a single report of any type.
4.9.2 Creating the Surface Prompts ViewIn addition to the general properties common to all views (see "Configuring General Formatting Properties" on page 6-2), Go Button Text enables you to change the text displayed on the Go button.
Note: Surface prompt views depend upon prompt filters created in other views for content. If there are no prompt filters defined in other views, nothing is displayed in the Surface Prompts view.
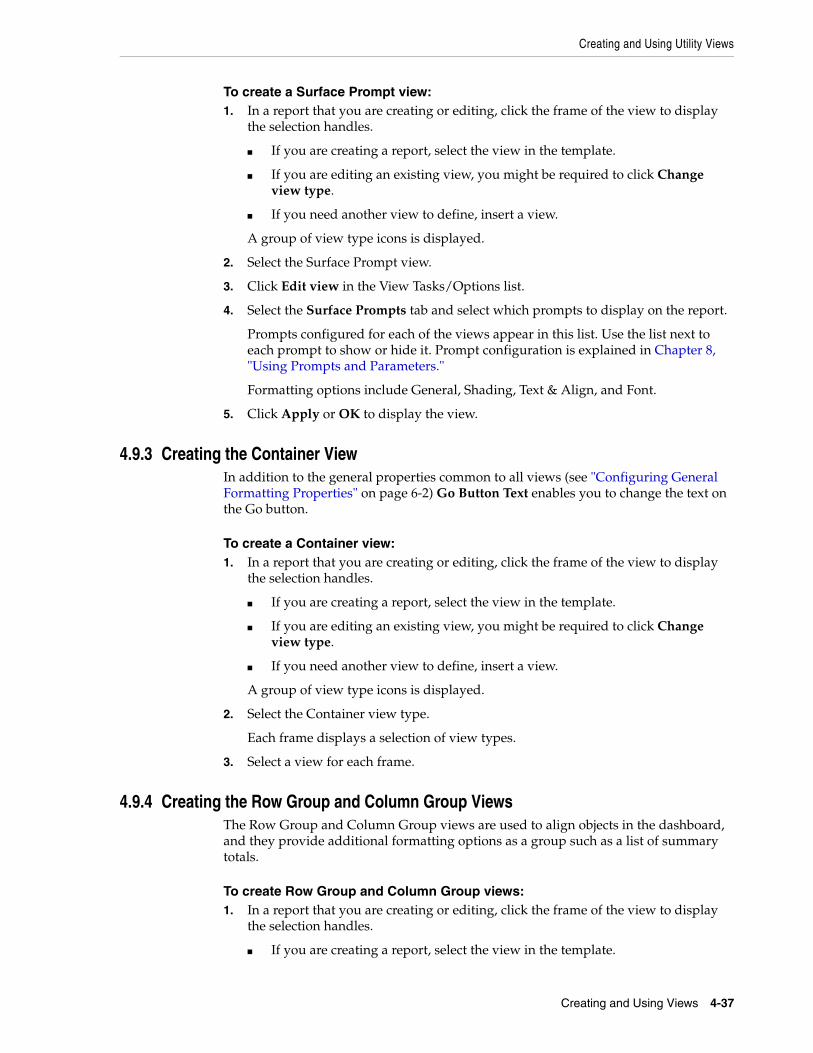
Creating and Using Utility Views
Creating and Using Views 4-37
To create a Surface Prompt view:1. In a report that you are creating or editing, click the frame of the view to display
the selection handles.
■ If you are creating a report, select the view in the template.
■ If you are editing an existing view, you might be required to click Change view type.
■ If you need another view to define, insert a view.
A group of view type icons is displayed.
2. Select the Surface Prompt view.
3. Click Edit view in the View Tasks/Options list.
4. Select the Surface Prompts tab and select which prompts to display on the report.
Prompts configured for each of the views appear in this list. Use the list next to each prompt to show or hide it. Prompt configuration is explained in Chapter 8, "Using Prompts and Parameters."
Formatting options include General, Shading, Text & Align, and Font.
5. Click Apply or OK to display the view.
4.9.3 Creating the Container ViewIn addition to the general properties common to all views (see "Configuring General Formatting Properties" on page 6-2) Go Button Text enables you to change the text on the Go button.
To create a Container view:1. In a report that you are creating or editing, click the frame of the view to display
the selection handles.
■ If you are creating a report, select the view in the template.
■ If you are editing an existing view, you might be required to click Change view type.
■ If you need another view to define, insert a view.
A group of view type icons is displayed.
2. Select the Container view type.
Each frame displays a selection of view types.
3. Select a view for each frame.
4.9.4 Creating the Row Group and Column Group ViewsThe Row Group and Column Group views are used to align objects in the dashboard, and they provide additional formatting options as a group such as a list of summary totals.
To create Row Group and Column Group views:1. In a report that you are creating or editing, click the frame of the view to display
the selection handles.
■ If you are creating a report, select the view in the template.
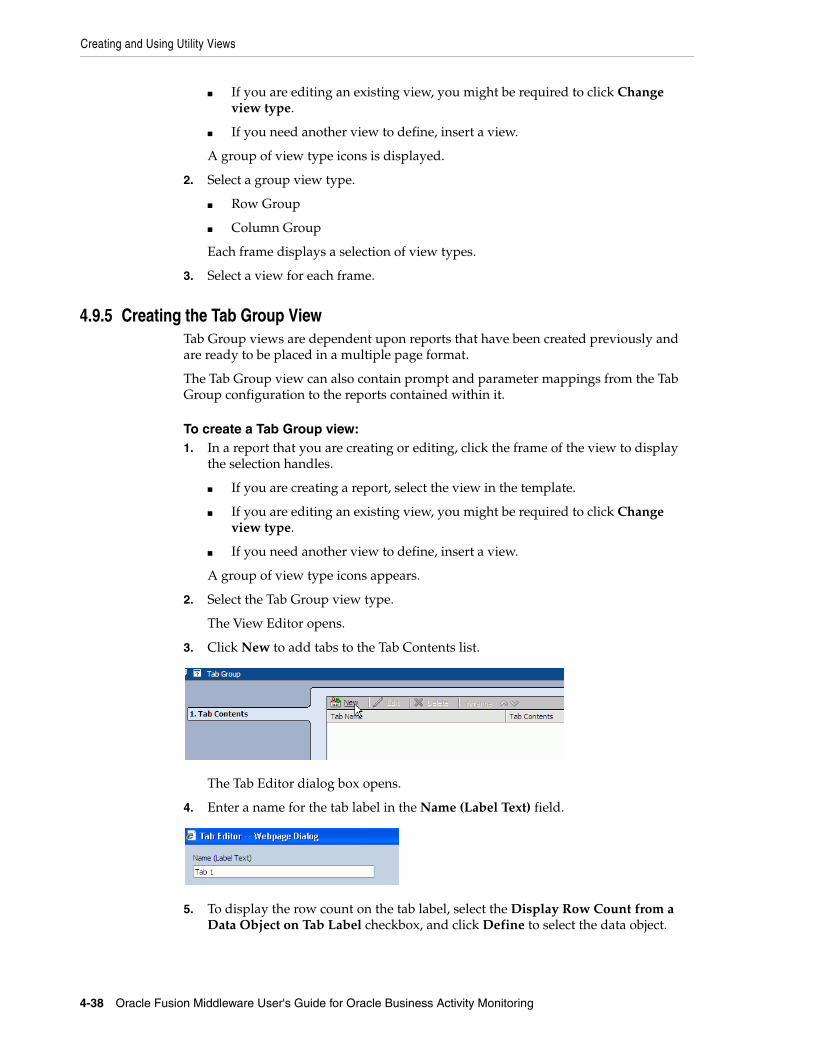
Creating and Using Utility Views
4-38 Oracle Fusion Middleware User's Guide for Oracle Business Activity Monitoring
■ If you are editing an existing view, you might be required to click Change view type.
■ If you need another view to define, insert a view.
A group of view type icons is displayed.
2. Select a group view type.
■ Row Group
■ Column Group
Each frame displays a selection of view types.
3. Select a view for each frame.
4.9.5 Creating the Tab Group ViewTab Group views are dependent upon reports that have been created previously and are ready to be placed in a multiple page format.
The Tab Group view can also contain prompt and parameter mappings from the Tab Group configuration to the reports contained within it.
To create a Tab Group view:1. In a report that you are creating or editing, click the frame of the view to display
the selection handles.
■ If you are creating a report, select the view in the template.
■ If you are editing an existing view, you might be required to click Change view type.
■ If you need another view to define, insert a view.
A group of view type icons appears.
2. Select the Tab Group view type.
The View Editor opens.
3. Click New to add tabs to the Tab Contents list.
The Tab Editor dialog box opens.
4. Enter a name for the tab label in the Name (Label Text) field.
5. To display the row count on the tab label, select the Display Row Count from a Data Object on Tab Label checkbox, and click Define to select the data object.
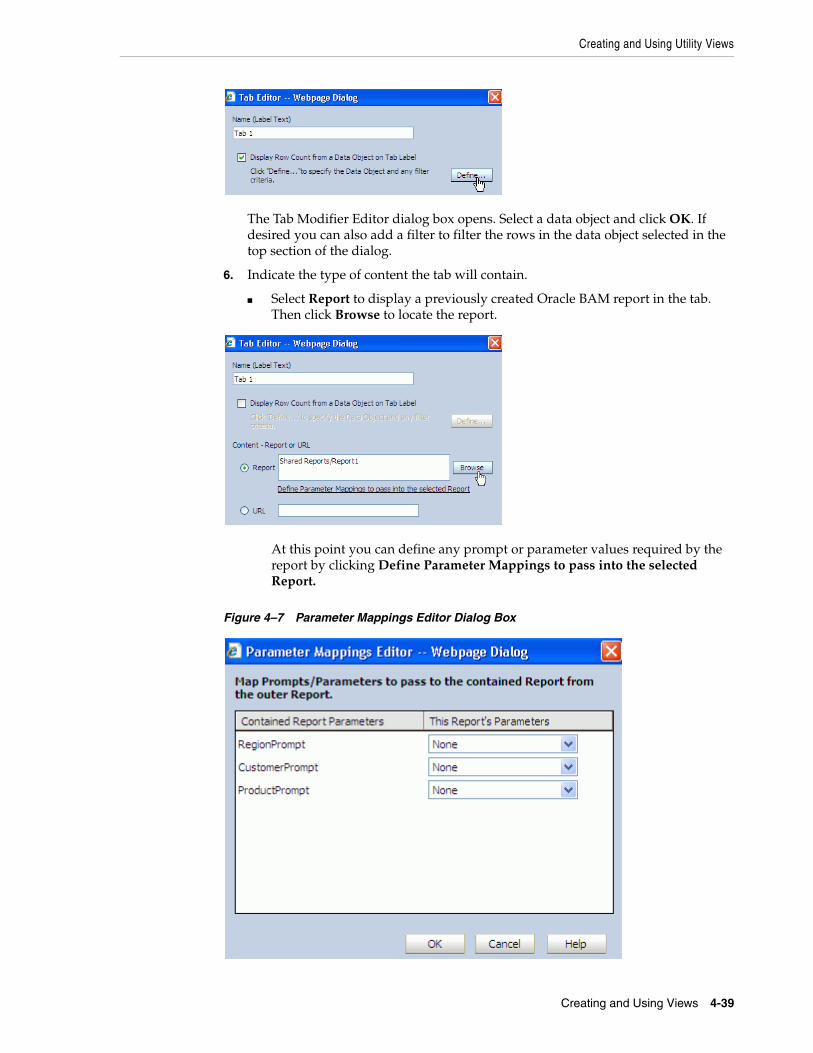
Creating and Using Utility Views
Creating and Using Views 4-39
The Tab Modifier Editor dialog box opens. Select a data object and click OK. If desired you can also add a filter to filter the rows in the data object selected in the top section of the dialog.
6. Indicate the type of content the tab will contain.
■ Select Report to display a previously created Oracle BAM report in the tab. Then click Browse to locate the report.
At this point you can define any prompt or parameter values required by the report by clicking Define Parameter Mappings to pass into the selected Report.
Figure 4–7 Parameter Mappings Editor Dialog Box
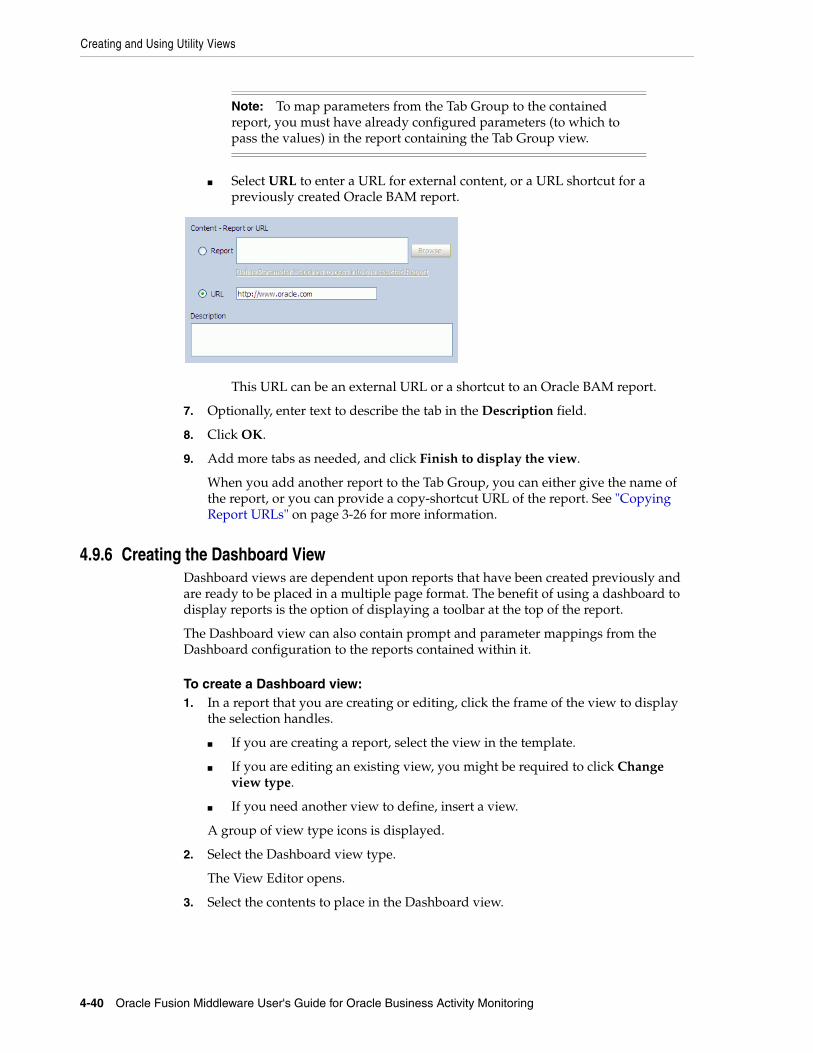
Creating and Using Utility Views
4-40 Oracle Fusion Middleware User's Guide for Oracle Business Activity Monitoring
■ Select URL to enter a URL for external content, or a URL shortcut for a previously created Oracle BAM report.
This URL can be an external URL or a shortcut to an Oracle BAM report.
7. Optionally, enter text to describe the tab in the Description field.
8. Click OK.
9. Add more tabs as needed, and click Finish to display the view.
When you add another report to the Tab Group, you can either give the name of the report, or you can provide a copy-shortcut URL of the report. See "Copying Report URLs" on page 3-26 for more information.
4.9.6 Creating the Dashboard ViewDashboard views are dependent upon reports that have been created previously and are ready to be placed in a multiple page format. The benefit of using a dashboard to display reports is the option of displaying a toolbar at the top of the report.
The Dashboard view can also contain prompt and parameter mappings from the Dashboard configuration to the reports contained within it.
To create a Dashboard view:1. In a report that you are creating or editing, click the frame of the view to display
the selection handles.
■ If you are creating a report, select the view in the template.
■ If you are editing an existing view, you might be required to click Change view type.
■ If you need another view to define, insert a view.
A group of view type icons is displayed.
2. Select the Dashboard view type.
The View Editor opens.
3. Select the contents to place in the Dashboard view.
Note: To map parameters from the Tab Group to the contained report, you must have already configured parameters (to which to pass the values) in the report containing the Tab Group view.
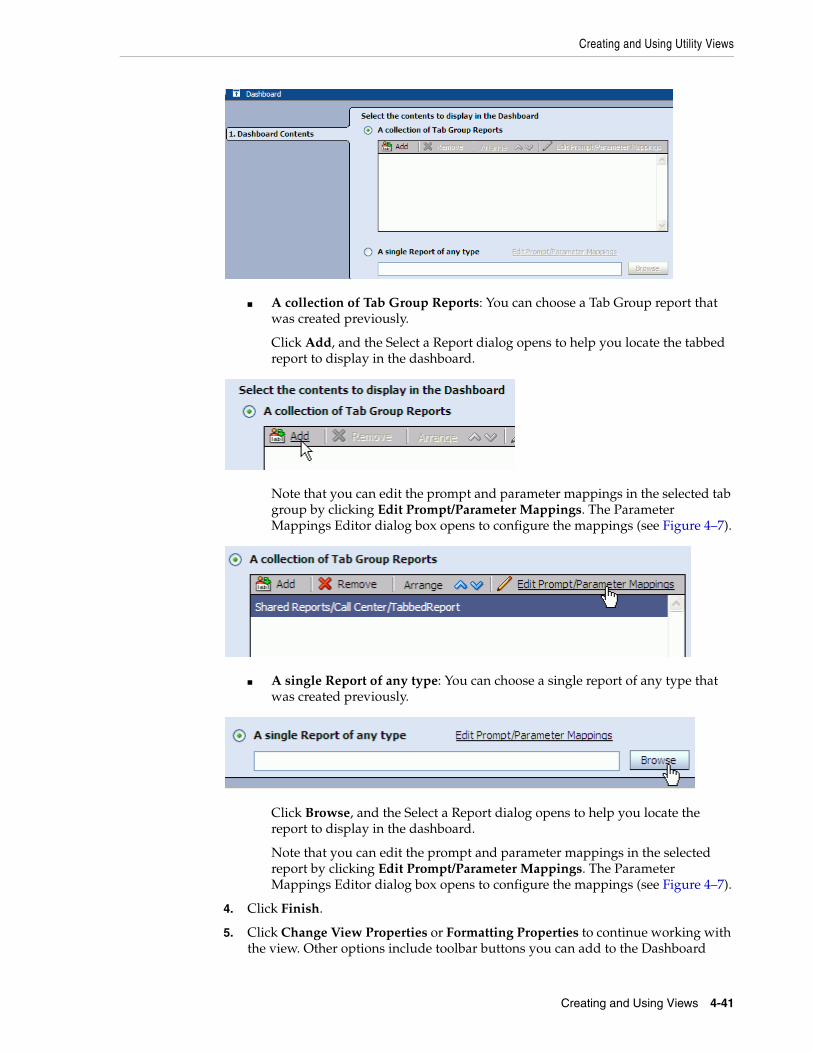
Creating and Using Utility Views
Creating and Using Views 4-41
■ A collection of Tab Group Reports: You can choose a Tab Group report that was created previously.
Click Add, and the Select a Report dialog opens to help you locate the tabbed report to display in the dashboard.
Note that you can edit the prompt and parameter mappings in the selected tab group by clicking Edit Prompt/Parameter Mappings. The Parameter Mappings Editor dialog box opens to configure the mappings (see Figure 4–7).
■ A single Report of any type: You can choose a single report of any type that was created previously.
Click Browse, and the Select a Report dialog opens to help you locate the report to display in the dashboard.
Note that you can edit the prompt and parameter mappings in the selected report by clicking Edit Prompt/Parameter Mappings. The Parameter Mappings Editor dialog box opens to configure the mappings (see Figure 4–7).
4. Click Finish.
5. Click Change View Properties or Formatting Properties to continue working with the view. Other options include toolbar buttons you can add to the Dashboard
Creating and Using Utility Views
4-42 Oracle Fusion Middleware User's Guide for Oracle Business Activity Monitoring
view. Formatting options include Toolbar, General, Shading, Text & Align, and Font. See "Configuring the Dashboard Toolbar" on page 4-42.
6. Click OK or Apply to display the view.
4.9.6.1 Configuring the Dashboard ToolbarThe Dashboard view has a configurable toolbar. The Toolbar tab in the View Editor enables you to control the contents of the toolbar in the Dashboard view.
This toolbar could contain the following buttons:
■ Email enables the end-user to email the report to someone.
■ Print enables the end-user to print the report.
■ Edit Dashboard opens an Oracle BAM Active Studio window with the current dashboard report in edit mode.
■ Edit Tab Group opens an Oracle BAM Active Studio window with the current tabbed report from the dashboard in edit mode. This only applies to dashboard reports that contain a tabbed report.
■ Edit Contents opens an Oracle BAM Active Studio window with the current report from the dashboard edit mode.
Display toolbarEnabling this property displays the toolbar within the Dashboard view.
Available ControlsA list of the controls available for inclusion in the Dashboard toolbar.
Selected ControlsA list of the controls that have been selected to display in the Dashboard toolbar. Controls can be moved from one list to the other using the arrow buttons. The order of appearance (left to right) is controlled with the up and down arrows located on the right side of the Selected Controls list.
Display OptionsIcon and Text Label displays both an icon and a text label for each control on the toolbar.
Icon Only displays only an icon for each control on the toolbar.
Text Only displays only a text label for each control on the toolbar.
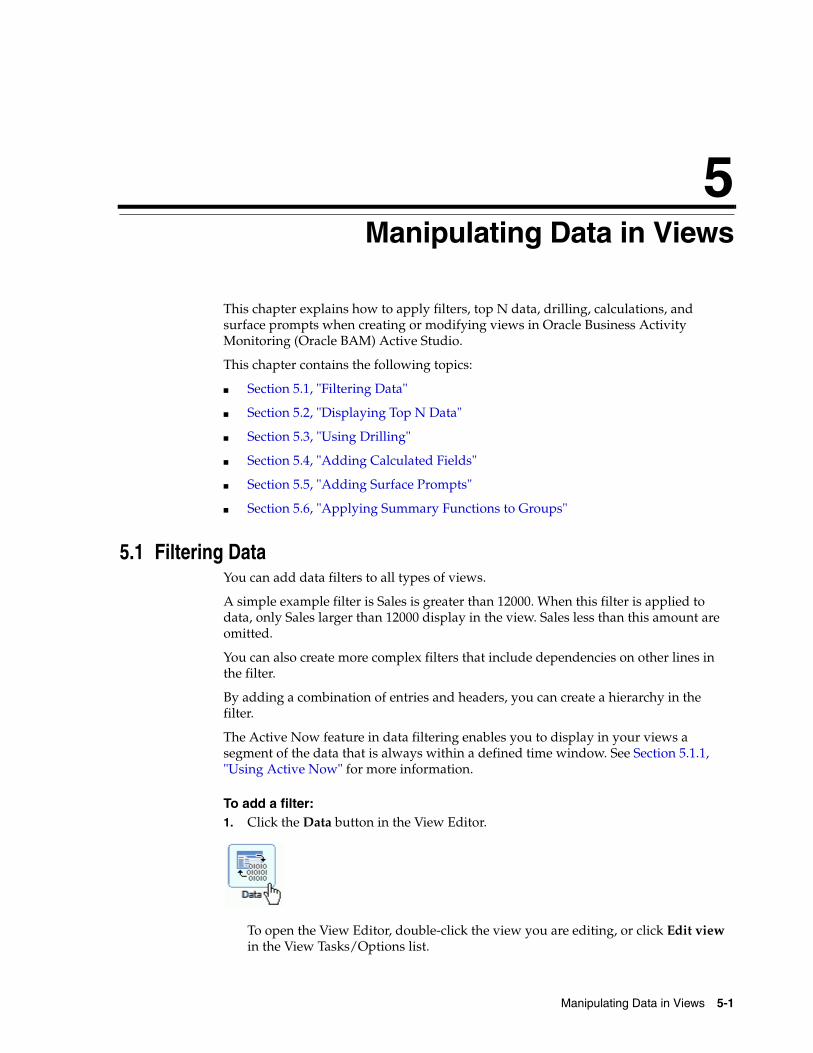
5
Manipulating Data in Views 5-1
5Manipulating Data in Views
This chapter explains how to apply filters, top N data, drilling, calculations, and surface prompts when creating or modifying views in Oracle Business Activity Monitoring (Oracle BAM) Active Studio.
This chapter contains the following topics:
■ Section 5.1, "Filtering Data"
■ Section 5.2, "Displaying Top N Data"
■ Section 5.3, "Using Drilling"
■ Section 5.4, "Adding Calculated Fields"
■ Section 5.5, "Adding Surface Prompts"
■ Section 5.6, "Applying Summary Functions to Groups"
5.1 Filtering DataYou can add data filters to all types of views.
A simple example filter is Sales is greater than 12000. When this filter is applied to data, only Sales larger than 12000 display in the view. Sales less than this amount are omitted.
You can also create more complex filters that include dependencies on other lines in the filter.
By adding a combination of entries and headers, you can create a hierarchy in the filter.
The Active Now feature in data filtering enables you to display in your views a segment of the data that is always within a defined time window. See Section 5.1.1, "Using Active Now" for more information.
To add a filter:1. Click the Data button in the View Editor.
To open the View Editor, double-click the view you are editing, or click Edit view in the View Tasks/Options list.
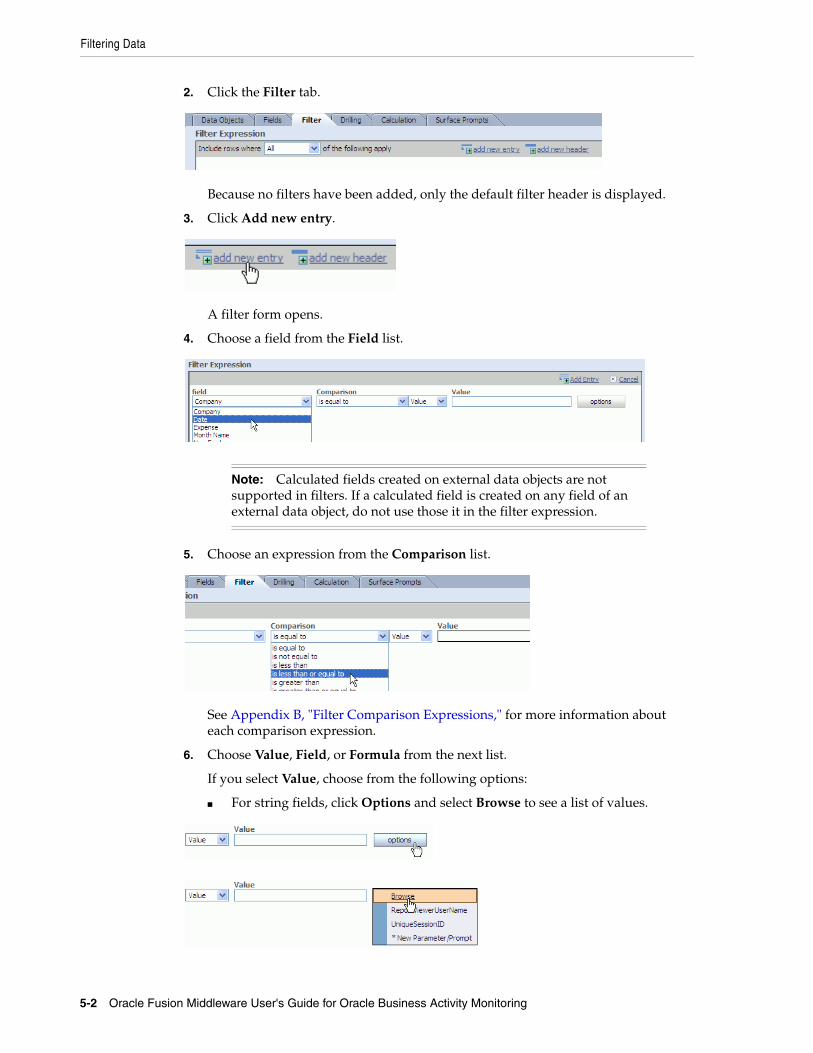
Filtering Data
5-2 Oracle Fusion Middleware User's Guide for Oracle Business Activity Monitoring
2. Click the Filter tab.
Because no filters have been added, only the default filter header is displayed.
3. Click Add new entry.
A filter form opens.
4. Choose a field from the Field list.
5. Choose an expression from the Comparison list.
See Appendix B, "Filter Comparison Expressions," for more information about each comparison expression.
6. Choose Value, Field, or Formula from the next list.
If you select Value, choose from the following options:
■ For string fields, click Options and select Browse to see a list of values.
Note: Calculated fields created on external data objects are not supported in filters. If a calculated field is created on any field of an external data object, do not use those it in the filter expression.
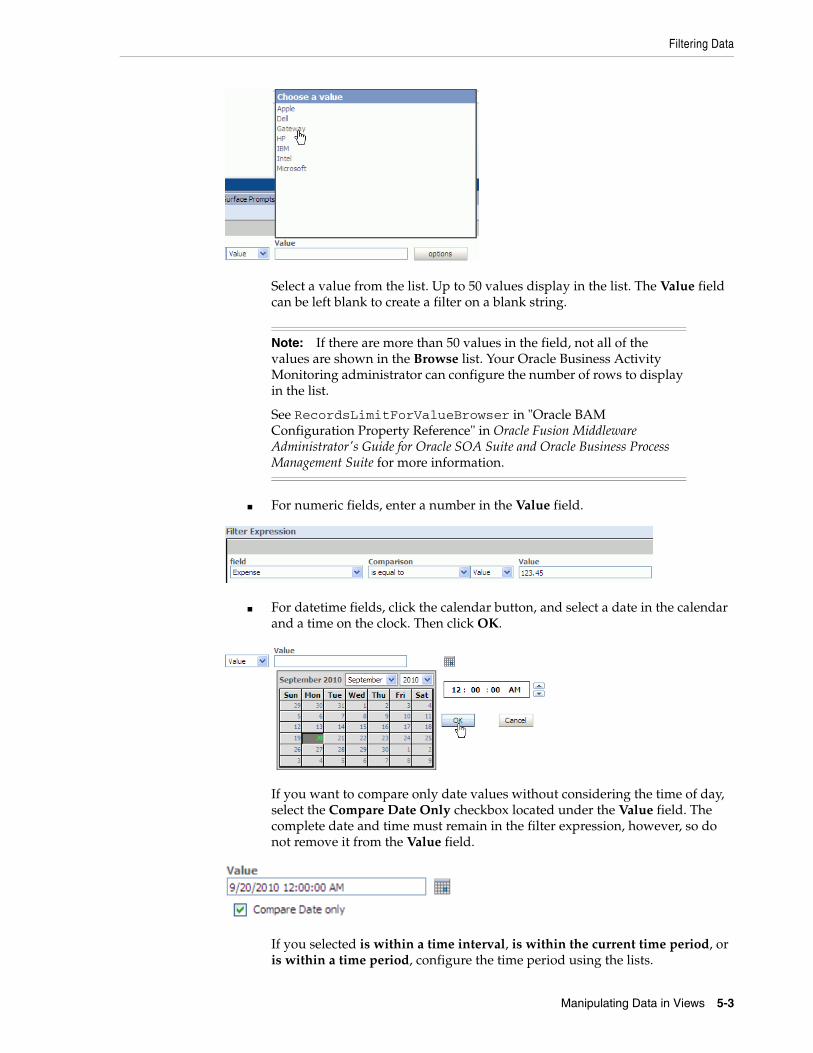
Filtering Data
Manipulating Data in Views 5-3
Select a value from the list. Up to 50 values display in the list. The Value field can be left blank to create a filter on a blank string.
■ For numeric fields, enter a number in the Value field.
■ For datetime fields, click the calendar button, and select a date in the calendar and a time on the clock. Then click OK.
If you want to compare only date values without considering the time of day, select the Compare Date Only checkbox located under the Value field. The complete date and time must remain in the filter expression, however, so do not remove it from the Value field.
If you selected is within a time interval, is within the current time period, or is within a time period, configure the time period using the lists.
Note: If there are more than 50 values in the field, not all of the values are shown in the Browse list. Your Oracle Business Activity Monitoring administrator can configure the number of rows to display in the list.
See RecordsLimitForValueBrowser in "Oracle BAM Configuration Property Reference" in Oracle Fusion Middleware Administrator's Guide for Oracle SOA Suite and Oracle Business Process Management Suite for more information.
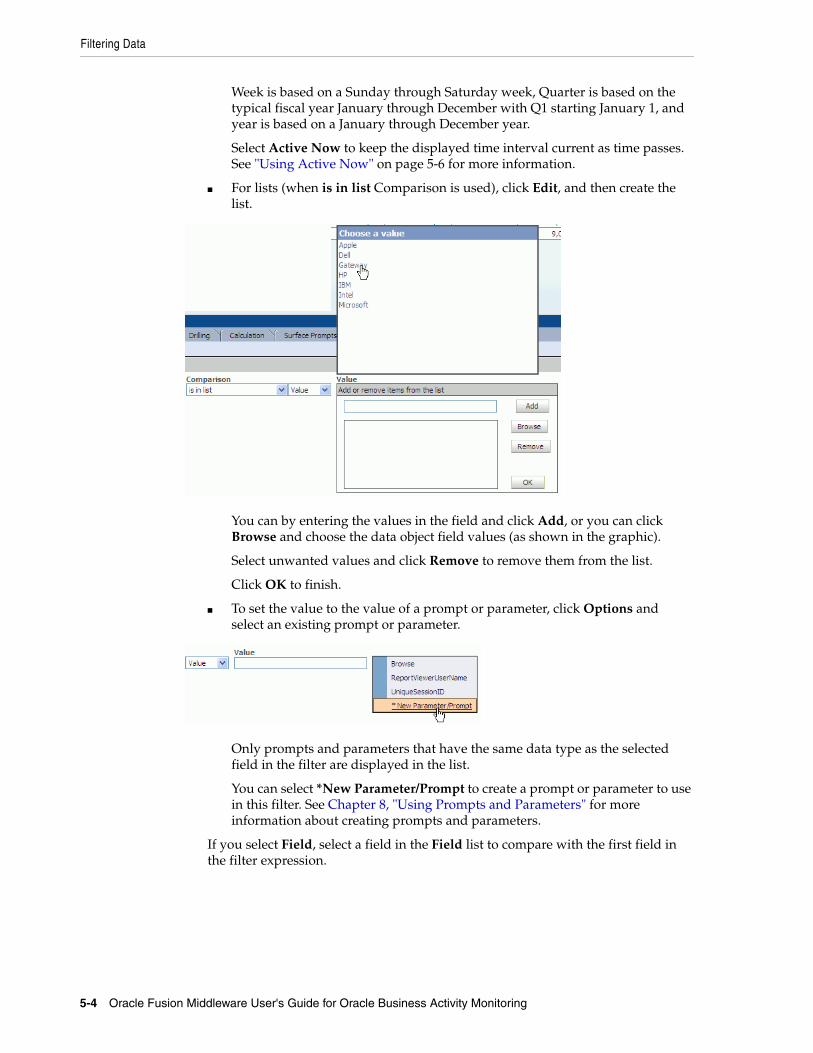
Filtering Data
5-4 Oracle Fusion Middleware User's Guide for Oracle Business Activity Monitoring
Week is based on a Sunday through Saturday week, Quarter is based on the typical fiscal year January through December with Q1 starting January 1, and year is based on a January through December year.
Select Active Now to keep the displayed time interval current as time passes. See "Using Active Now" on page 5-6 for more information.
■ For lists (when is in list Comparison is used), click Edit, and then create the list.
You can by entering the values in the field and click Add, or you can click Browse and choose the data object field values (as shown in the graphic).
Select unwanted values and click Remove to remove them from the list.
Click OK to finish.
■ To set the value to the value of a prompt or parameter, click Options and select an existing prompt or parameter.
Only prompts and parameters that have the same data type as the selected field in the filter are displayed in the list.
You can select *New Parameter/Prompt to create a prompt or parameter to use in this filter. See Chapter 8, "Using Prompts and Parameters" for more information about creating prompts and parameters.
If you select Field, select a field in the Field list to compare with the first field in the filter expression.
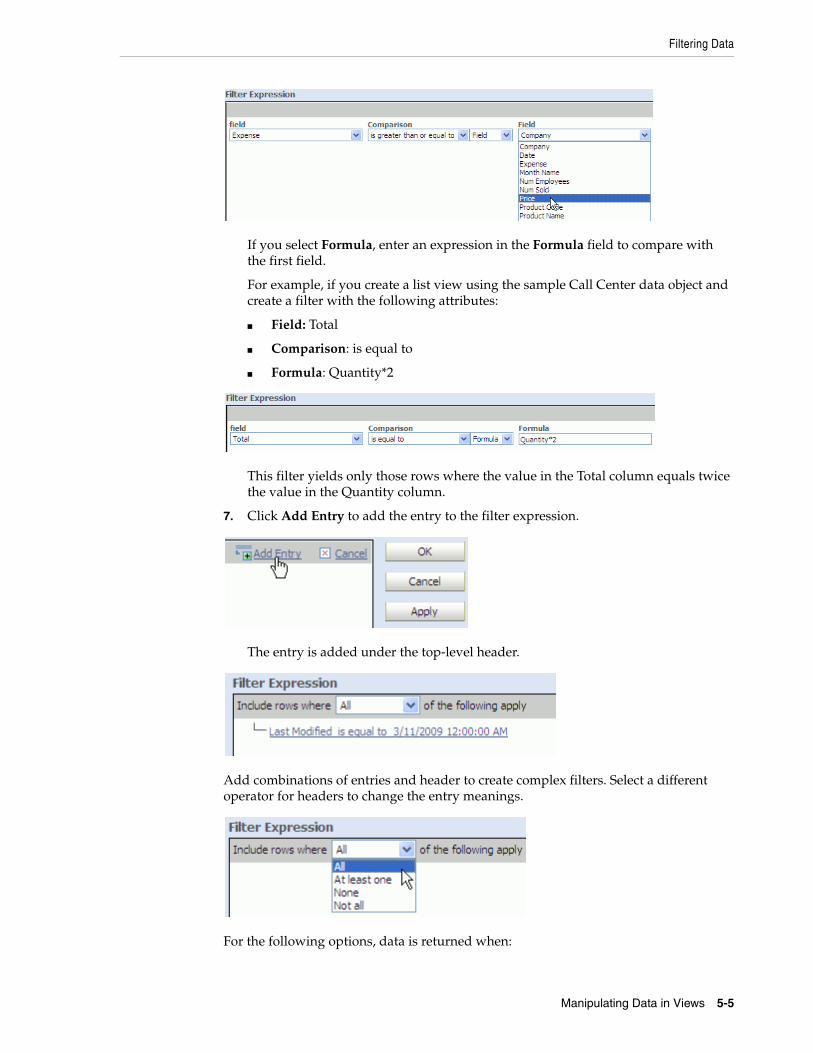
Filtering Data
Manipulating Data in Views 5-5
If you select Formula, enter an expression in the Formula field to compare with the first field.
For example, if you create a list view using the sample Call Center data object and create a filter with the following attributes:
■ Field: Total
■ Comparison: is equal to
■ Formula: Quantity*2
This filter yields only those rows where the value in the Total column equals twice the value in the Quantity column.
7. Click Add Entry to add the entry to the filter expression.
The entry is added under the top-level header.
Add combinations of entries and header to create complex filters. Select a different operator for headers to change the entry meanings.
For the following options, data is returned when:
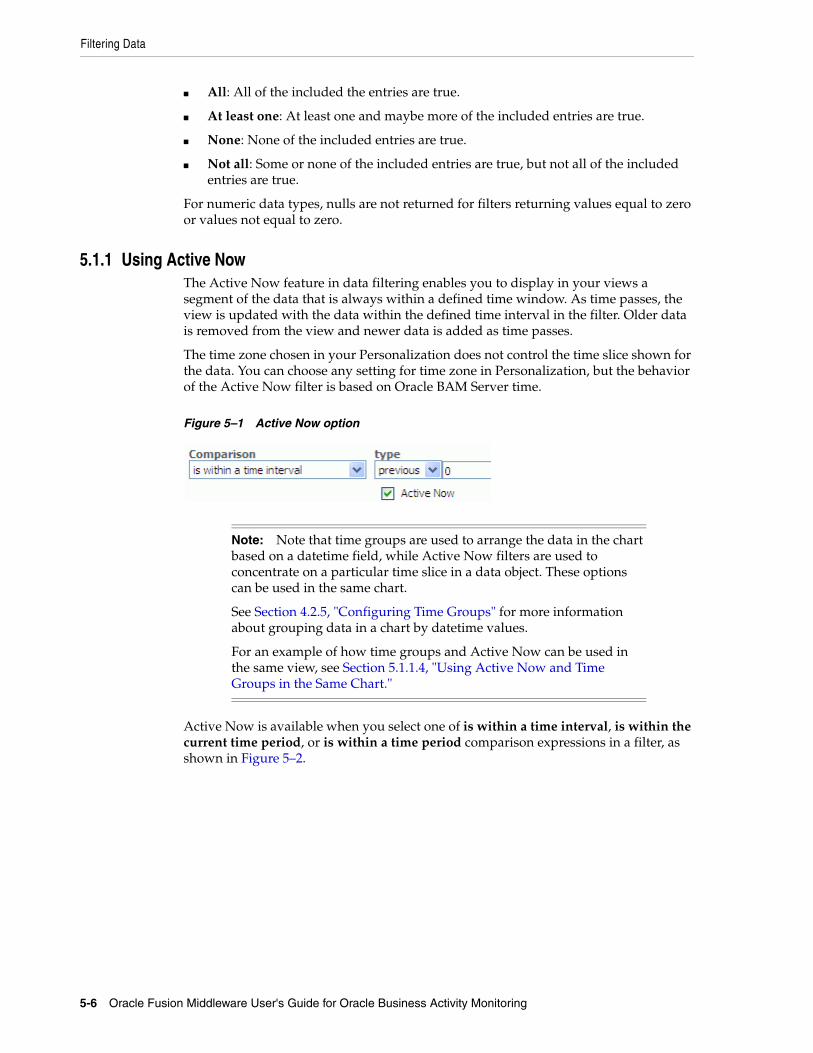
Filtering Data
5-6 Oracle Fusion Middleware User's Guide for Oracle Business Activity Monitoring
■ All: All of the included the entries are true.
■ At least one: At least one and maybe more of the included entries are true.
■ None: None of the included entries are true.
■ Not all: Some or none of the included entries are true, but not all of the included entries are true.
For numeric data types, nulls are not returned for filters returning values equal to zero or values not equal to zero.
5.1.1 Using Active NowThe Active Now feature in data filtering enables you to display in your views a segment of the data that is always within a defined time window. As time passes, the view is updated with the data within the defined time interval in the filter. Older data is removed from the view and newer data is added as time passes.
The time zone chosen in your Personalization does not control the time slice shown for the data. You can choose any setting for time zone in Personalization, but the behavior of the Active Now filter is based on Oracle BAM Server time.
Figure 5–1 Active Now option
Active Now is available when you select one of is within a time interval, is within the current time period, or is within a time period comparison expressions in a filter, as shown in Figure 5–2.
Note: Note that time groups are used to arrange the data in the chart based on a datetime field, while Active Now filters are used to concentrate on a particular time slice in a data object. These options can be used in the same chart.
See Section 4.2.5, "Configuring Time Groups" for more information about grouping data in a chart by datetime values.
For an example of how time groups and Active Now can be used in the same view, see Section 5.1.1.4, "Using Active Now and Time Groups in the Same Chart."
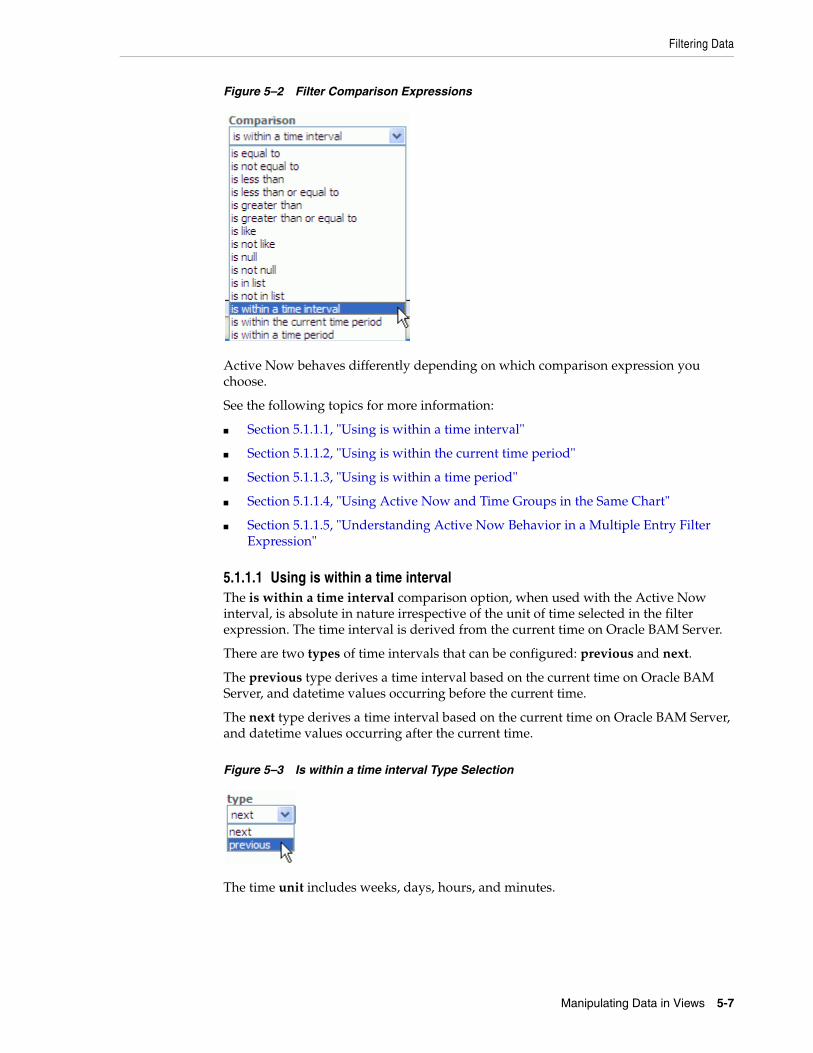
Filtering Data
Manipulating Data in Views 5-7
Figure 5–2 Filter Comparison Expressions
Active Now behaves differently depending on which comparison expression you choose.
See the following topics for more information:
■ Section 5.1.1.1, "Using is within a time interval"
■ Section 5.1.1.2, "Using is within the current time period"
■ Section 5.1.1.3, "Using is within a time period"
■ Section 5.1.1.4, "Using Active Now and Time Groups in the Same Chart"
■ Section 5.1.1.5, "Understanding Active Now Behavior in a Multiple Entry Filter Expression"
5.1.1.1 Using is within a time intervalThe is within a time interval comparison option, when used with the Active Now interval, is absolute in nature irrespective of the unit of time selected in the filter expression. The time interval is derived from the current time on Oracle BAM Server.
There are two types of time intervals that can be configured: previous and next.
The previous type derives a time interval based on the current time on Oracle BAM Server, and datetime values occurring before the current time.
The next type derives a time interval based on the current time on Oracle BAM Server, and datetime values occurring after the current time.
Figure 5–3 Is within a time interval Type Selection
The time unit includes weeks, days, hours, and minutes.
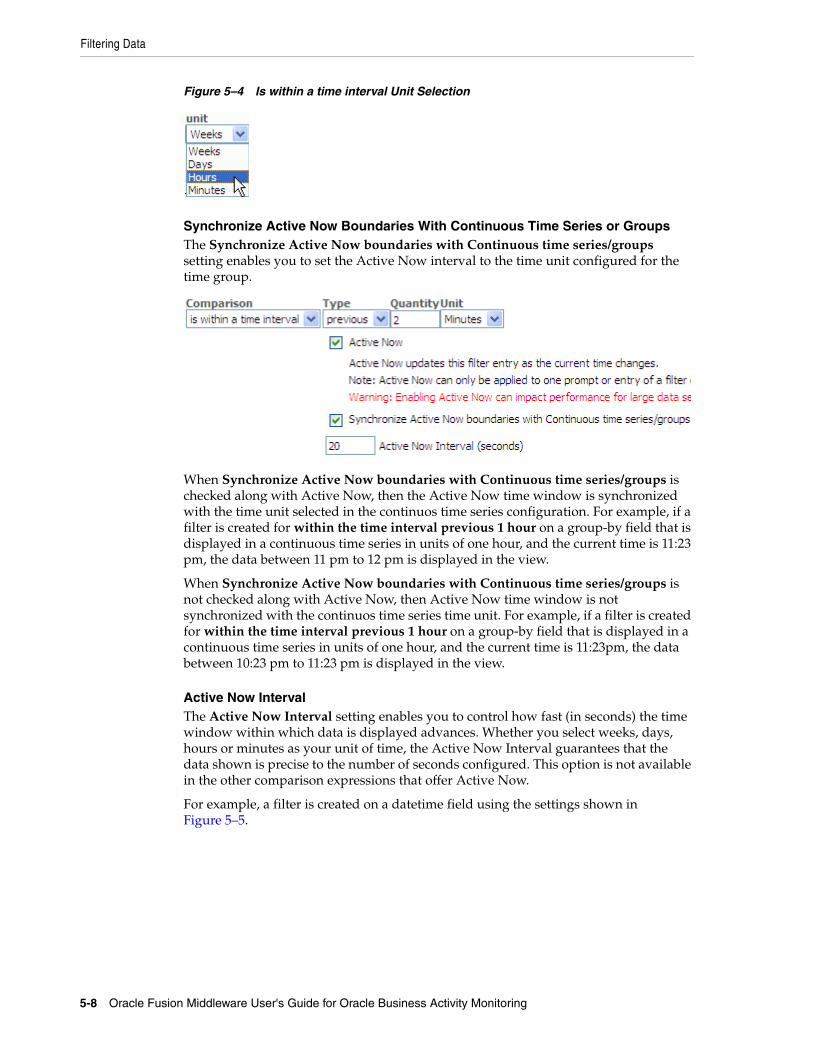
Filtering Data
5-8 Oracle Fusion Middleware User's Guide for Oracle Business Activity Monitoring
Figure 5–4 Is within a time interval Unit Selection
Synchronize Active Now Boundaries With Continuous Time Series or GroupsThe Synchronize Active Now boundaries with Continuous time series/groups setting enables you to set the Active Now interval to the time unit configured for the time group.
When Synchronize Active Now boundaries with Continuous time series/groups is checked along with Active Now, then the Active Now time window is synchronized with the time unit selected in the continuos time series configuration. For example, if a filter is created for within the time interval previous 1 hour on a group-by field that is displayed in a continuous time series in units of one hour, and the current time is 11:23 pm, the data between 11 pm to 12 pm is displayed in the view.
When Synchronize Active Now boundaries with Continuous time series/groups is not checked along with Active Now, then Active Now time window is not synchronized with the continuos time series time unit. For example, if a filter is created for within the time interval previous 1 hour on a group-by field that is displayed in a continuous time series in units of one hour, and the current time is 11:23pm, the data between 10:23 pm to 11:23 pm is displayed in the view.
Active Now IntervalThe Active Now Interval setting enables you to control how fast (in seconds) the time window within which data is displayed advances. Whether you select weeks, days, hours or minutes as your unit of time, the Active Now Interval guarantees that the data shown is precise to the number of seconds configured. This option is not available in the other comparison expressions that offer Active Now.
For example, a filter is created on a datetime field using the settings shown in Figure 5–5.
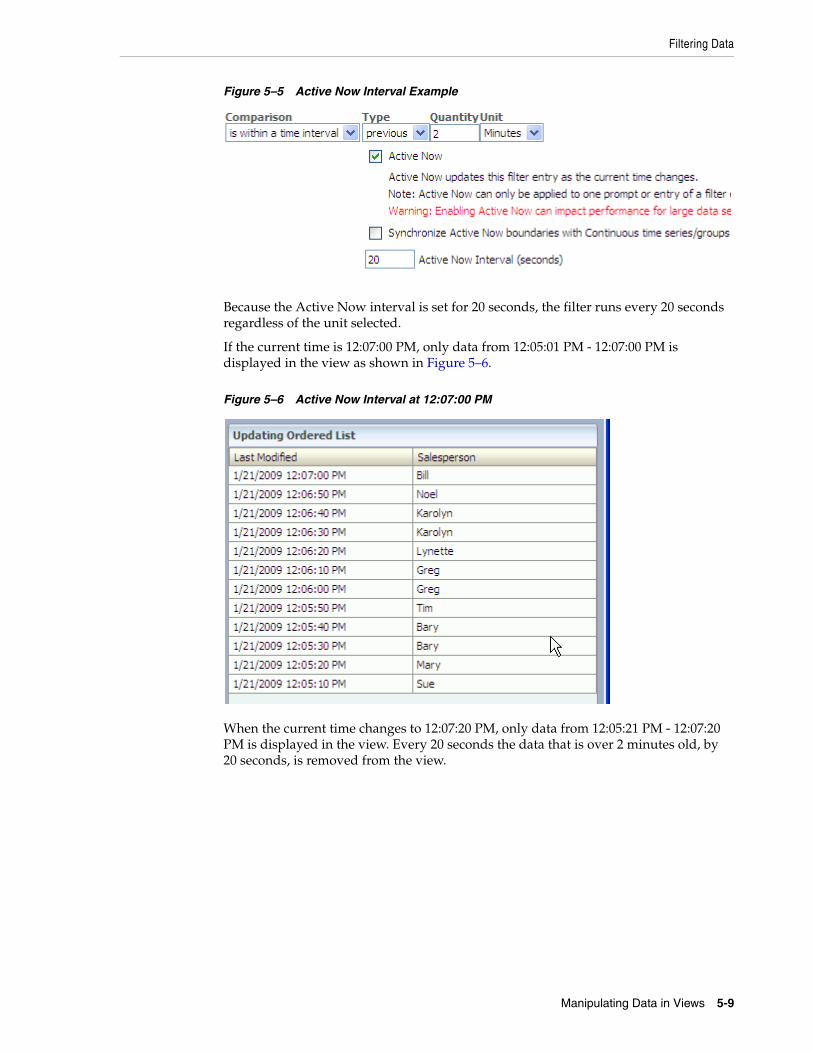
Filtering Data
Manipulating Data in Views 5-9
Figure 5–5 Active Now Interval Example
Because the Active Now interval is set for 20 seconds, the filter runs every 20 seconds regardless of the unit selected.
If the current time is 12:07:00 PM, only data from 12:05:01 PM - 12:07:00 PM is displayed in the view as shown in Figure 5–6.
Figure 5–6 Active Now Interval at 12:07:00 PM
When the current time changes to 12:07:20 PM, only data from 12:05:21 PM - 12:07:20 PM is displayed in the view. Every 20 seconds the data that is over 2 minutes old, by 20 seconds, is removed from the view.
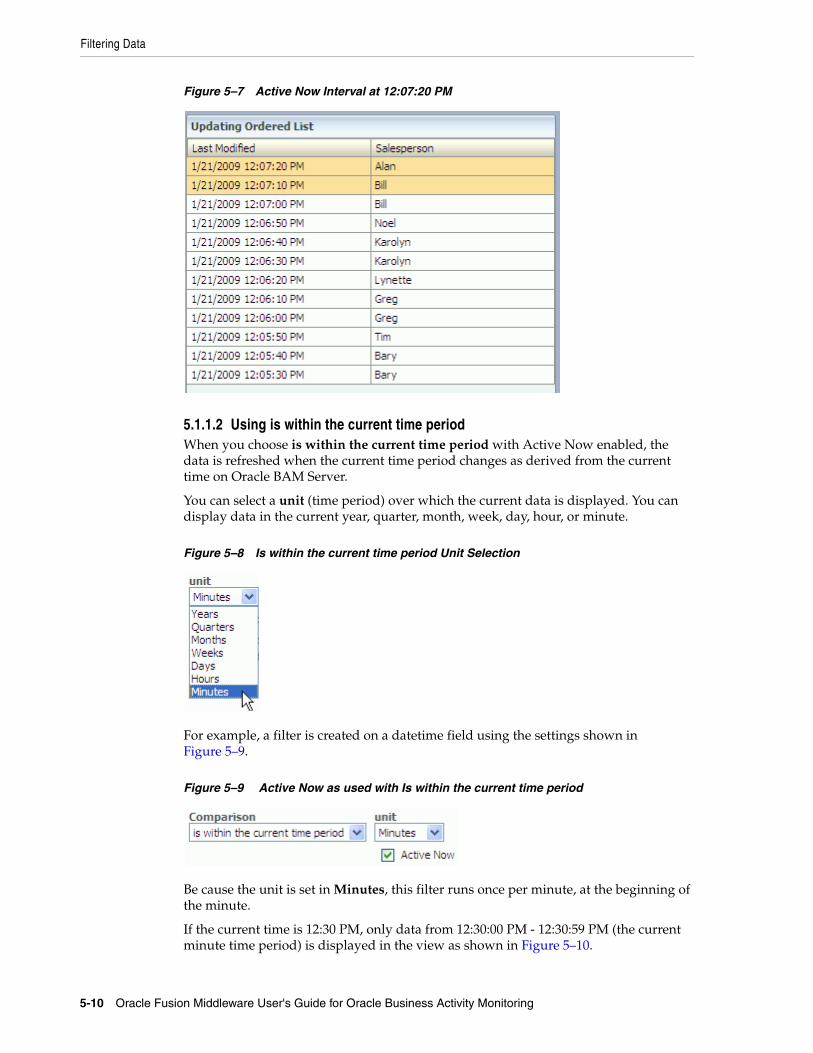
Filtering Data
5-10 Oracle Fusion Middleware User's Guide for Oracle Business Activity Monitoring
Figure 5–7 Active Now Interval at 12:07:20 PM
5.1.1.2 Using is within the current time periodWhen you choose is within the current time period with Active Now enabled, the data is refreshed when the current time period changes as derived from the current time on Oracle BAM Server.
You can select a unit (time period) over which the current data is displayed. You can display data in the current year, quarter, month, week, day, hour, or minute.
Figure 5–8 Is within the current time period Unit Selection
For example, a filter is created on a datetime field using the settings shown in Figure 5–9.
Figure 5–9 Active Now as used with Is within the current time period
Be cause the unit is set in Minutes, this filter runs once per minute, at the beginning of the minute.
If the current time is 12:30 PM, only data from 12:30:00 PM - 12:30:59 PM (the current minute time period) is displayed in the view as shown in Figure 5–10.
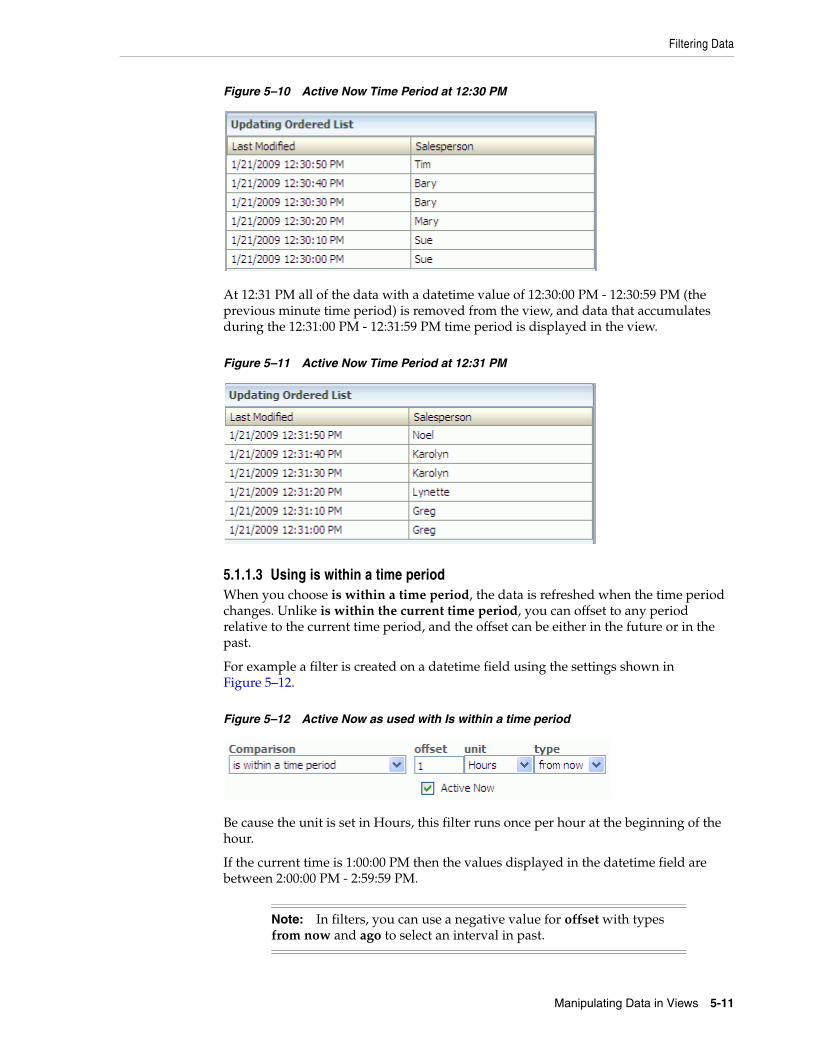
Filtering Data
Manipulating Data in Views 5-11
Figure 5–10 Active Now Time Period at 12:30 PM
At 12:31 PM all of the data with a datetime value of 12:30:00 PM - 12:30:59 PM (the previous minute time period) is removed from the view, and data that accumulates during the 12:31:00 PM - 12:31:59 PM time period is displayed in the view.
Figure 5–11 Active Now Time Period at 12:31 PM
5.1.1.3 Using is within a time periodWhen you choose is within a time period, the data is refreshed when the time period changes. Unlike is within the current time period, you can offset to any period relative to the current time period, and the offset can be either in the future or in the past.
For example a filter is created on a datetime field using the settings shown in Figure 5–12.
Figure 5–12 Active Now as used with Is within a time period
Be cause the unit is set in Hours, this filter runs once per hour at the beginning of the hour.
If the current time is 1:00:00 PM then the values displayed in the datetime field are between 2:00:00 PM - 2:59:59 PM.
Note: In filters, you can use a negative value for offset with types from now and ago to select an interval in past.
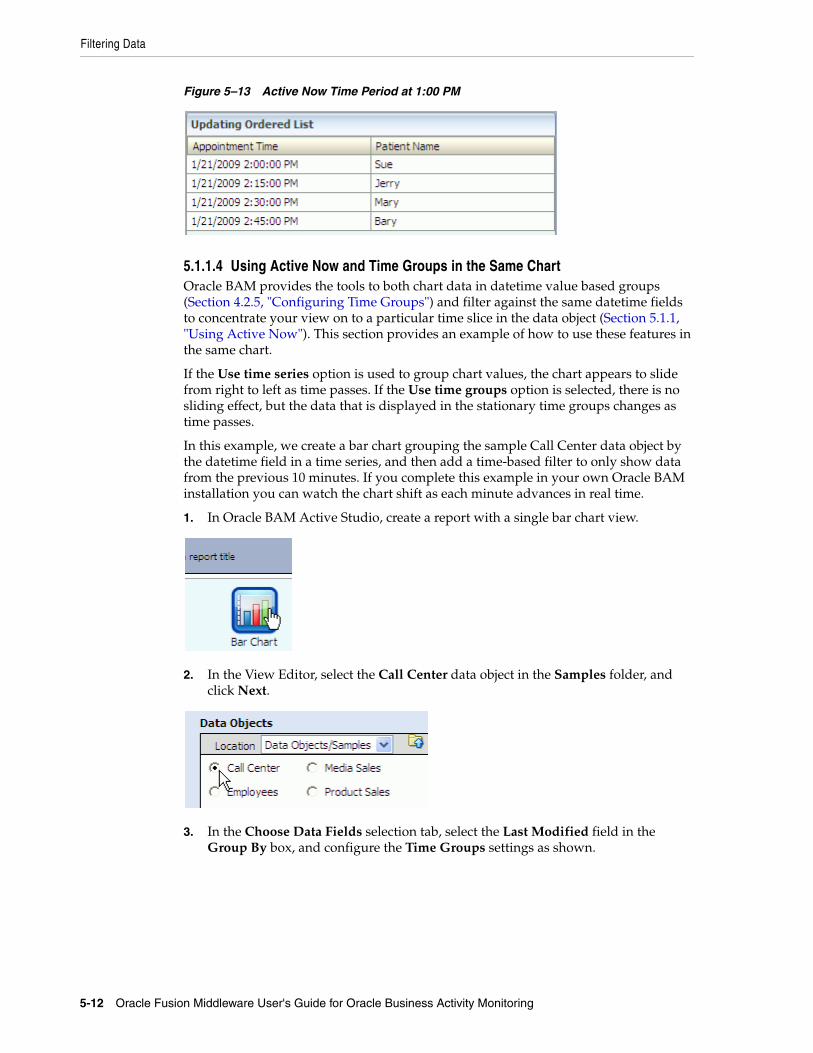
Filtering Data
5-12 Oracle Fusion Middleware User's Guide for Oracle Business Activity Monitoring
Figure 5–13 Active Now Time Period at 1:00 PM
5.1.1.4 Using Active Now and Time Groups in the Same ChartOracle BAM provides the tools to both chart data in datetime value based groups (Section 4.2.5, "Configuring Time Groups") and filter against the same datetime fields to concentrate your view on to a particular time slice in the data object (Section 5.1.1, "Using Active Now"). This section provides an example of how to use these features in the same chart.
If the Use time series option is used to group chart values, the chart appears to slide from right to left as time passes. If the Use time groups option is selected, there is no sliding effect, but the data that is displayed in the stationary time groups changes as time passes.
In this example, we create a bar chart grouping the sample Call Center data object by the datetime field in a time series, and then add a time-based filter to only show data from the previous 10 minutes. If you complete this example in your own Oracle BAM installation you can watch the chart shift as each minute advances in real time.
1. In Oracle BAM Active Studio, create a report with a single bar chart view.
2. In the View Editor, select the Call Center data object in the Samples folder, and click Next.
3. In the Choose Data Fields selection tab, select the Last Modified field in the Group By box, and configure the Time Groups settings as shown.
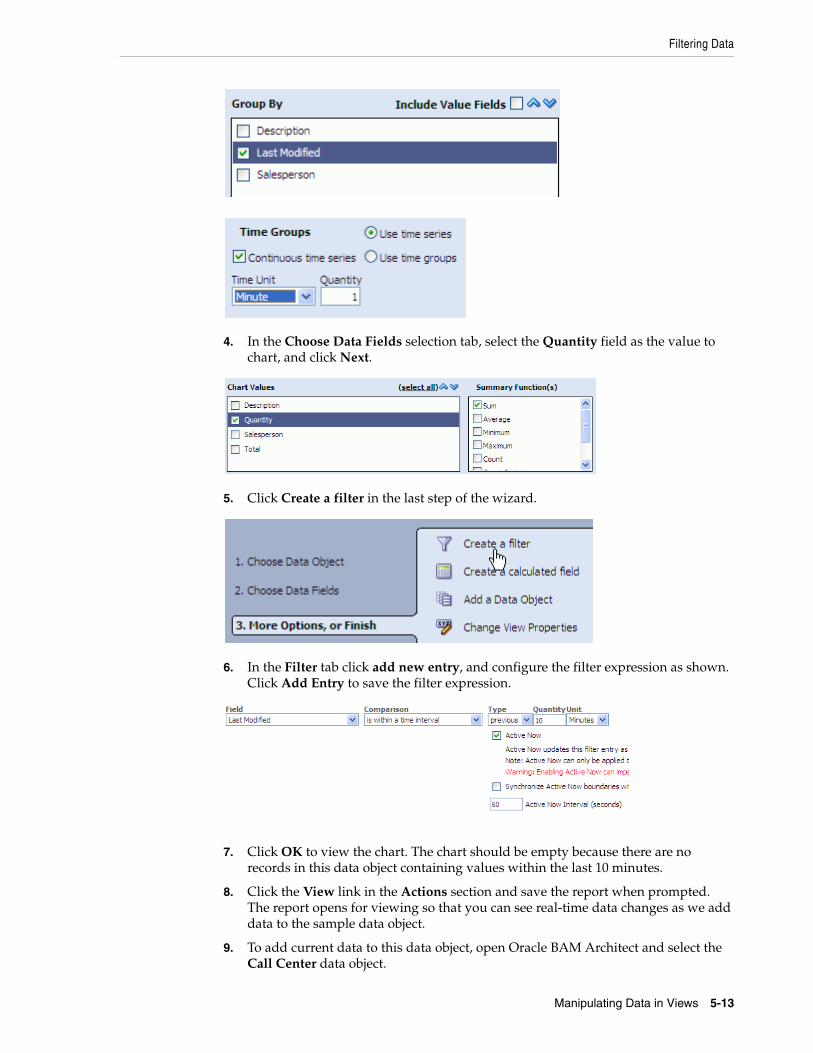
Filtering Data
Manipulating Data in Views 5-13
4. In the Choose Data Fields selection tab, select the Quantity field as the value to chart, and click Next.
5. Click Create a filter in the last step of the wizard.
6. In the Filter tab click add new entry, and configure the filter expression as shown. Click Add Entry to save the filter expression.
7. Click OK to view the chart. The chart should be empty because there are no records in this data object containing values within the last 10 minutes.
8. Click the View link in the Actions section and save the report when prompted. The report opens for viewing so that you can see real-time data changes as we add data to the sample data object.
9. To add current data to this data object, open Oracle BAM Architect and select the Call Center data object.
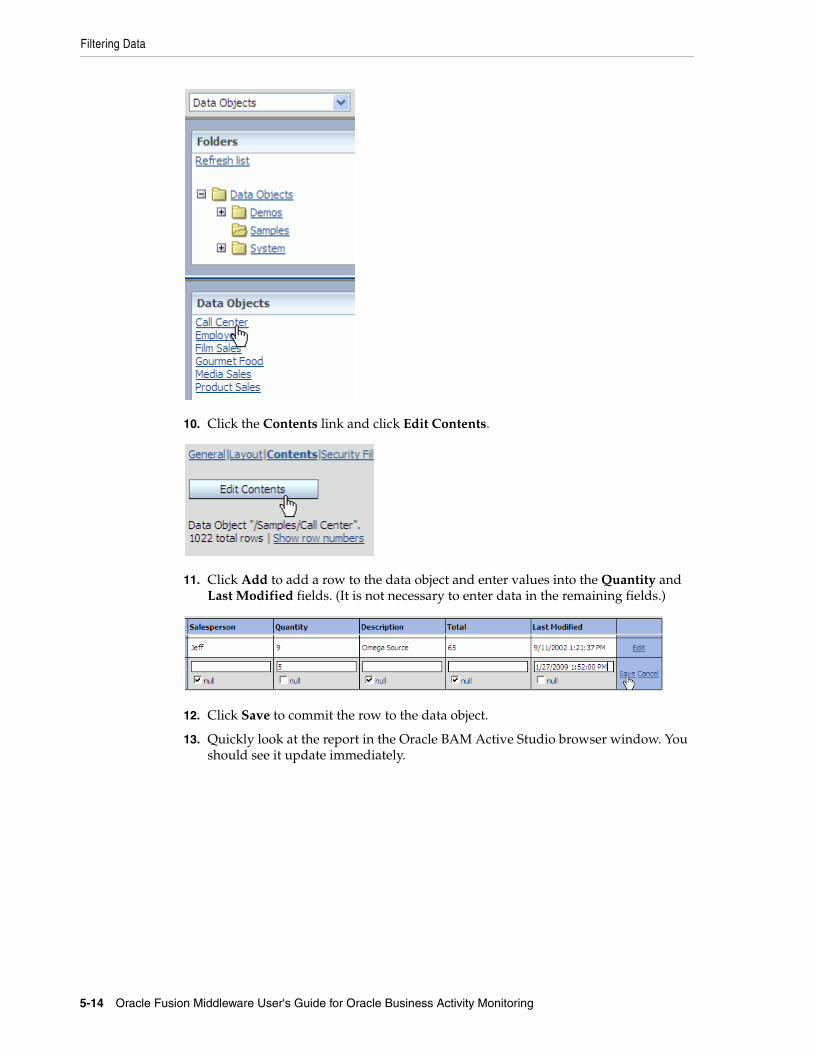
Filtering Data
5-14 Oracle Fusion Middleware User's Guide for Oracle Business Activity Monitoring
10. Click the Contents link and click Edit Contents.
11. Click Add to add a row to the data object and enter values into the Quantity and Last Modified fields. (It is not necessary to enter data in the remaining fields.)
12. Click Save to commit the row to the data object.
13. Quickly look at the report in the Oracle BAM Active Studio browser window. You should see it update immediately.
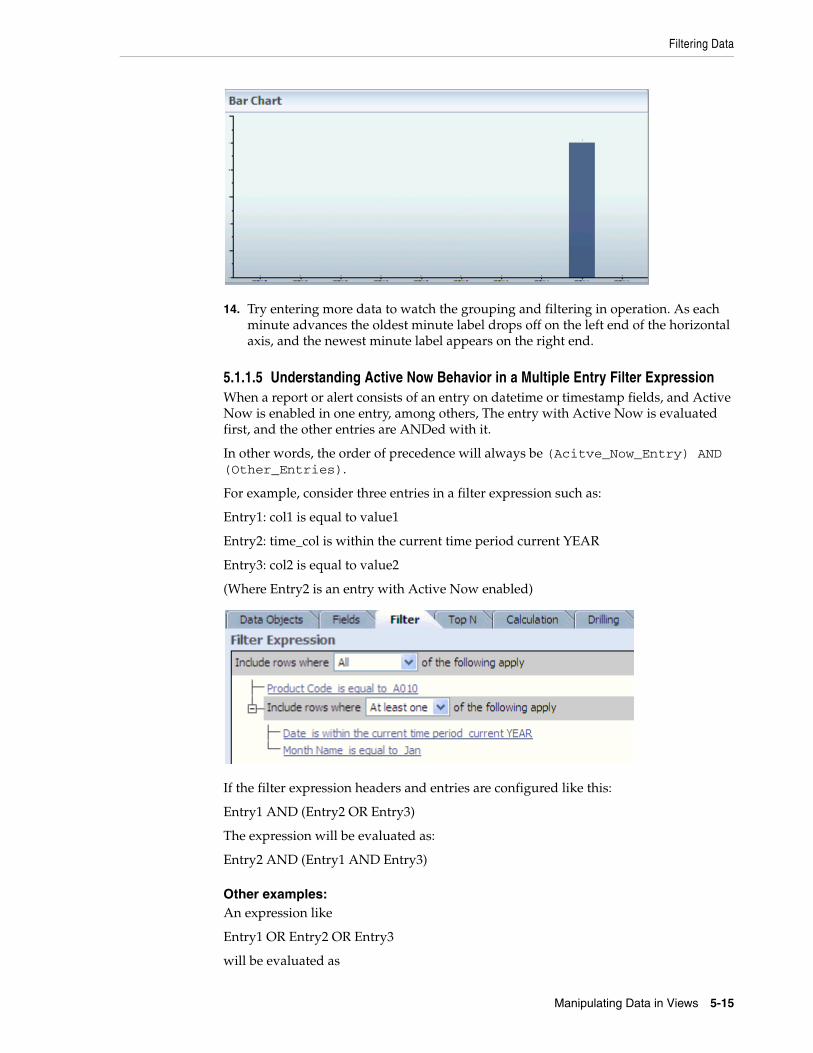
Filtering Data
Manipulating Data in Views 5-15
14. Try entering more data to watch the grouping and filtering in operation. As each minute advances the oldest minute label drops off on the left end of the horizontal axis, and the newest minute label appears on the right end.
5.1.1.5 Understanding Active Now Behavior in a Multiple Entry Filter ExpressionWhen a report or alert consists of an entry on datetime or timestamp fields, and Active Now is enabled in one entry, among others, The entry with Active Now is evaluated first, and the other entries are ANDed with it.
In other words, the order of precedence will always be (Acitve_Now_Entry) AND (Other_Entries).
For example, consider three entries in a filter expression such as:
Entry1: col1 is equal to value1
Entry2: time_col is within the current time period current YEAR
Entry3: col2 is equal to value2
(Where Entry2 is an entry with Active Now enabled)
If the filter expression headers and entries are configured like this:
Entry1 AND (Entry2 OR Entry3)
The expression will be evaluated as:
Entry2 AND (Entry1 AND Entry3)
Other examples:An expression like
Entry1 OR Entry2 OR Entry3
will be evaluated as
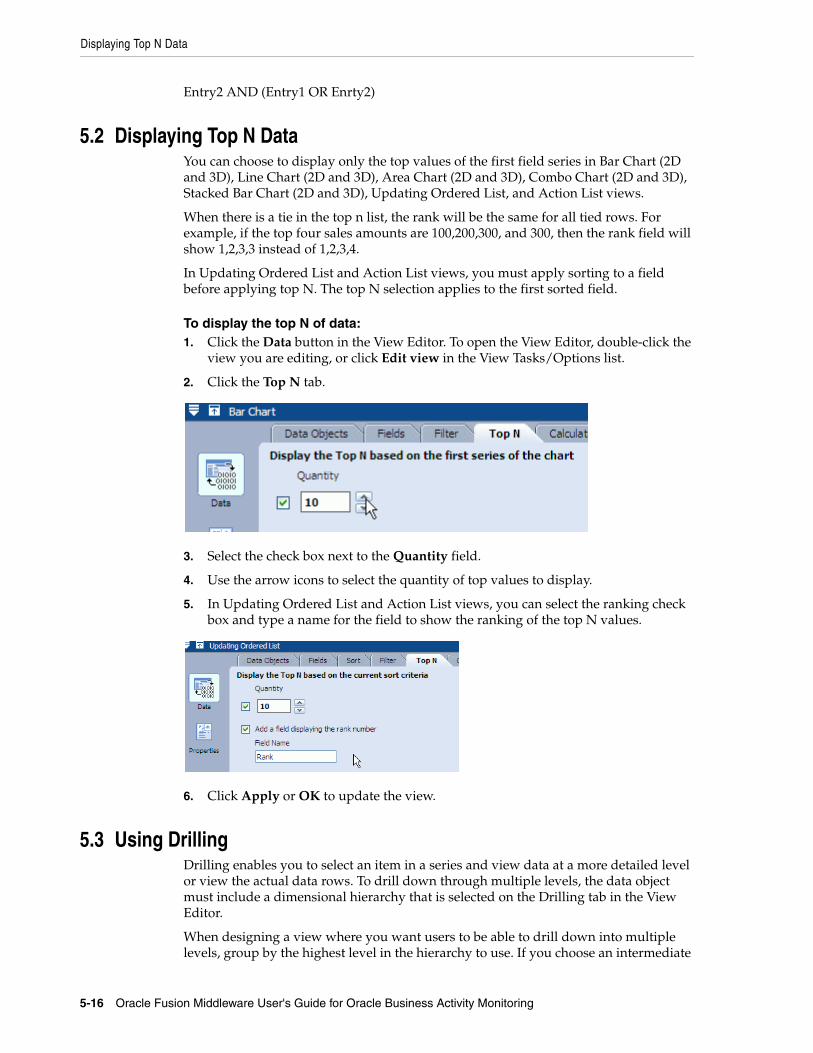
Displaying Top N Data
5-16 Oracle Fusion Middleware User's Guide for Oracle Business Activity Monitoring
Entry2 AND (Entry1 OR Enrty2)
5.2 Displaying Top N DataYou can choose to display only the top values of the first field series in Bar Chart (2D and 3D), Line Chart (2D and 3D), Area Chart (2D and 3D), Combo Chart (2D and 3D), Stacked Bar Chart (2D and 3D), Updating Ordered List, and Action List views.
When there is a tie in the top n list, the rank will be the same for all tied rows. For example, if the top four sales amounts are 100,200,300, and 300, then the rank field will show 1,2,3,3 instead of 1,2,3,4.
In Updating Ordered List and Action List views, you must apply sorting to a field before applying top N. The top N selection applies to the first sorted field.
To display the top N of data:1. Click the Data button in the View Editor. To open the View Editor, double-click the
view you are editing, or click Edit view in the View Tasks/Options list.
2. Click the Top N tab.
3. Select the check box next to the Quantity field.
4. Use the arrow icons to select the quantity of top values to display.
5. In Updating Ordered List and Action List views, you can select the ranking check box and type a name for the field to show the ranking of the top N values.
6. Click Apply or OK to update the view.
5.3 Using DrillingDrilling enables you to select an item in a series and view data at a more detailed level or view the actual data rows. To drill down through multiple levels, the data object must include a dimensional hierarchy that is selected on the Drilling tab in the View Editor.
When designing a view where you want users to be able to drill down into multiple levels, group by the highest level in the hierarchy to use. If you choose an intermediate
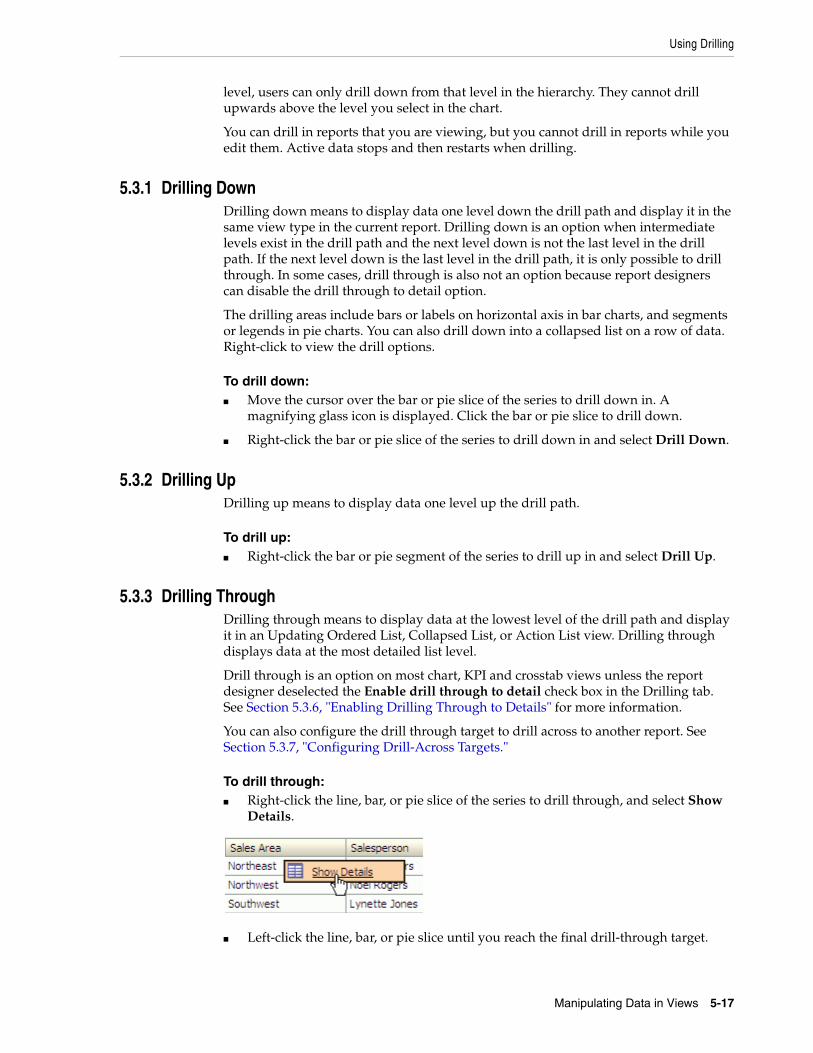
Using Drilling
Manipulating Data in Views 5-17
level, users can only drill down from that level in the hierarchy. They cannot drill upwards above the level you select in the chart.
You can drill in reports that you are viewing, but you cannot drill in reports while you edit them. Active data stops and then restarts when drilling.
5.3.1 Drilling DownDrilling down means to display data one level down the drill path and display it in the same view type in the current report. Drilling down is an option when intermediate levels exist in the drill path and the next level down is not the last level in the drill path. If the next level down is the last level in the drill path, it is only possible to drill through. In some cases, drill through is also not an option because report designers can disable the drill through to detail option.
The drilling areas include bars or labels on horizontal axis in bar charts, and segments or legends in pie charts. You can also drill down into a collapsed list on a row of data. Right-click to view the drill options.
To drill down:■ Move the cursor over the bar or pie slice of the series to drill down in. A
magnifying glass icon is displayed. Click the bar or pie slice to drill down.
■ Right-click the bar or pie slice of the series to drill down in and select Drill Down.
5.3.2 Drilling UpDrilling up means to display data one level up the drill path.
To drill up:■ Right-click the bar or pie segment of the series to drill up in and select Drill Up.
5.3.3 Drilling ThroughDrilling through means to display data at the lowest level of the drill path and display it in an Updating Ordered List, Collapsed List, or Action List view. Drilling through displays data at the most detailed list level.
Drill through is an option on most chart, KPI and crosstab views unless the report designer deselected the Enable drill through to detail check box in the Drilling tab. See Section 5.3.6, "Enabling Drilling Through to Details" for more information.
You can also configure the drill through target to drill across to another report. See Section 5.3.7, "Configuring Drill-Across Targets."
To drill through:■ Right-click the line, bar, or pie slice of the series to drill through, and select Show
Details.
■ Left-click the line, bar, or pie slice until you reach the final drill-through target.
Using Drilling
5-18 Oracle Fusion Middleware User's Guide for Oracle Business Activity Monitoring
5.3.4 Drilling AcrossDrilling across means replacing a view with another report (the target), replacing the entire report with another report, or opening a report in a separate window.
To drill across:■ Right-click the view and select the target report name.
■ Select Menu in the view title bar and select the target report name.
Depending on how it is configured, the report replaces the current view, replaces the entire report, or opens in a separate window.
See Section 5.3.7, "Configuring Drill-Across Targets" for more information.
5.3.5 Adding Drilling Hierarchies to ViewsYou can select drilling hierarchies to enable Drill Through in the following views:
■ Collapsed List
■ Bar Chart (2D and 3D)
■ Line Chart (2D and 3D)
■ Area Chart (2D and 3D)
■ Combo Chart (2D and 3D)
■ Pie Chart (2D and 3D)
■ Stacked Bar Chart (2D and 3D)
You can select a data object that contains dimensions in hierarchies. You create hierarchies in data objects using Oracle BAM Architect.
To select a drilling hierarchy:1. In a report that you are editing, select the Drilling tab.
2. Select the hierarchy to use during drilling.
If no items display in the list, the data object does not have any drilling hierarchies defined. For information about configuring hierarchies in data objects, see Oracle Fusion Middleware Developer's Guide for Oracle SOA Suite.
3. Deselect Enable drill through to detail to prevent users from drilling to the underlying data, which are displayed in an Updating Ordered List or Action List view.
4. Click OK or Apply.
5.3.6 Enabling Drilling Through to DetailsWhether or not the data object has a dimensional hierarchy defined, you can drill through to view detailed data (shown in an Updating Ordered List or Action List) in any of the following views:
■ Collapsed List
■ Bar Chart (2D and 3D)
■ Line Chart (2D and 3D)
■ Area Chart (2D and 3D)
Using Drilling
Manipulating Data in Views 5-19
■ Combo Chart (2D and 3D)
■ Pie Chart (2D and 3D)
■ Stacked Bar Chart (2D and 3D)
■ Arrow
■ Market Arrow
■ Range Gauge
■ Dial Gauge
■ Crosstab
■ Summary Crosstab
■ Matrix
Not all views that allow drilling through to details allow hierarchical drilling.
To enable drilling through to details:1. In a report that you are editing, click the Drilling tab.
2. Select Enable drill through to detail.
3. Select whether the details should appear in an Updating Ordered List or Action List view.
4. Select the fields to display in the detail view. If none are selected all fields selected to create the view (on the Fields tab) and the drilling hierarchy are displayed.
5. Click OK or Apply.
5.3.7 Configuring Drill-Across TargetsYou can configure any view to drill across to another target report. You can replace the current view with the target report, replace the entire report with the target report, or open the target report in a separate window. You can create many drill-across targets in a view.
Drilling across cannot be done from surface prompts, container, tabbed group, row and column group, dashboard, external content, and action form views.
To configure a drill-across target:1. In a report that you are editing, select the Drilling tab.
2. In the Drill Across Menu box click New Target. The Drill Across Action Creation and Edit dialog box opens.
3. Select a Destination Type.
■ Replace the Current View replaces the space occupied by the current view with the target report.
■ Replace the Current Report replaces the entire report with the target report. If you select this option you can see bread crumbs at the top of the report. To turn off the bread crumbs, click Change Report Properties, select the Advanced tab, and uncheck the Show Breadcrumbs box.
■ Launch a New Window opens a separate browser in which to display the target report. You can configure the properties of a separate browser window that opens when a user clicks a hyperlink in a list view, by selecting Click here to edit the window features.
Using Drilling
5-20 Oracle Fusion Middleware User's Guide for Oracle Business Activity Monitoring
4. Optionally select context options.
■ Show With Context includes the target in the right-click menu in any data row or chart element.
■ Show With No Context includes the target in the right-click menu outside of the data rows and chart elements, and it includes the target in the view title bar menu.
5. Click Next.
6. Click Browse to select a target report. To drill across to a URL, see Section 5.3.8, "Drilling Across to a URL" for more information.
7. Click Next.
8. Optionally, map fields to parameters and prompts in the target report.
When the target report contains prompts and parameters, you can send values to them by mapping fields in this step. The value is chosen from the data row or chart element you clicked when choosing the target. For example if you right-click a bar in a Bar Chart view, the group value represented in that bar that are mapped to a prompt or parameter is sent to the target report.
9. Click OK to close the dialog box.
10. To configure this drill-across target to be a drill-through target, click Drill Through in the Drill Across Menu box, and deselect Enable drill through to details in the Drill Level Properties box.
11. Click OK or Apply in the View Editor.
5.3.8 Drilling Across to a URLWhen launching a target in a separate window you can choose any URL, rather than a report, as the target.
To configure a drill-across URL target:1. In a report that you are editing, select the Drilling tab.
2. In the Drill Across Menu box click New Target. The Drill Across Action Creation and Edit dialog box opens.
3. Select Launch a New Window.
4. Optionally select a context option.
■ Show With Context includes the target in the right-click menu when the mouse is in any data row or chart element.
■ Show With No Context includes the target in the right-click menu outside of the data rows and chart elements, and it includes the target in the view title bar menu.
5. Click Next.
6. Enter a URL in the Destination URL field.
7. Enter a Destination Name that appears in the drilling menu.
8. Edit window features as desired.
You can configure the properties of a separate browser window that opens when a user clicks a hyperlink in a list view, by selecting Click here to edit the window features.
Adding Calculated Fields
Manipulating Data in Views 5-21
9. Click Next.
10. Map fields to external parameters to build a query string.
11. Click OK to dismiss the dialog box.
12. Click OK or Apply in the View Editor.
5.4 Adding Calculated FieldsYou can add calculated fields to views in reports. You can create a calculation based on other fields in the view, for example, fields such as Sales and Costs. The calculator includes aggregate functions, string functions, and date/time functions that you combine with existing data fields to create calculated fields. Then, you can add these calculated fields to the view or create more calculated fields based on other calculated fields.
If you create an aggregated calculated field for a list view, you are not able to add it as a field in the list.
To add a calculated field:1. Click the Data button in the View Editor. To open the View Editor, double-click the
view you are editing, or click Edit view in the View Tasks/Options list.
2. Select the Calculation tab.
3. Start a calculated field expression:
■ Select a number, operator, or parenthesis button on the calculator.
■ Select a field from the Field list and click Insert Field.
■ Select a function from Expression list and click Insert Expr. See Appendix A, "Calculation Operators and Expressions" for more information.
■ Type directly in the calculated field area.
See Section 5.4.2, "Using Decimal Type Numbers in Calculations" for information about using Decimal type constants in calculation expressions.
■ Click Group By and select one or more fields to group by. You cannot group on a calculation that does not perform any aggregation.
4. When you have created the calculated field expression, click Enter.
A basic syntax check is performed and displays either a green check mark if the syntax passes or a red exclamation mark if the syntax does not pass.
If the calculation passes the syntax check, the field is displayed in the calculated fields list on the right.
5. To add the field to the view, click the Fields tab in the View Editor and click the check box next to the field name.
6. Click Apply or OK to update the view.
Note: You can insert HTML strings in an expression to add formatting to a calculated field. See Section 5.4.1, "Using HTML in Calculations" for more information.
Adding Calculated Fields
5-22 Oracle Fusion Middleware User's Guide for Oracle Business Activity Monitoring
To rename a calculated field:1. Select the field in the calculated fields list, and click Rename.
The Rename dialog box opens.
2. Enter a name for the calculated field, and click OK.
You cannot rename a calculated field to an existing field name.
The field name must start with a letter or underscore and contain no more than 30 characters (letters, numbers, and underscores). Spaces are not valid.
If you include a calculated field in a view either as a field or in a filter or other applications, and then you rename it, the calculated field might not perform correctly in the view. Rename a calculated field before adding it to a view or a filter.
To delete a calculated field:Select the field and click Delete.
The calculated field is deleted.
The calculated field must not be used in any other tab (for example, it cannot be selected in the View Editor Fields tab) prior to deleting in the Calculation tab.
5.4.1 Using HTML in CalculationsYou can add HTML tags to calculated fields to add special formatting to the field.
The following example guides you through the steps for using HTML in calculated fields.
1. Create a report using the Streaming List view.
2. When the View Editor opens, select the Call Center data object in the Samples folder and click Next.
3. Select all of the fields and click Next.
4. Click Create a calculated field.
5. Enter the following in the expression box:
If(Total > 50)
Then(Concat("<div style='color:red'>",Total,"</div>"))
Else(Concat("<div style='color:green'>",Total,"</div>"))
6. Click Enter. The field name appears in the calculated fields list.
7. Click Apply.
8. Select the Fields tab.
9. Select the calculated field and click Apply.
10. Select the Properties icon and select the Value Format tab.
11. Select the calculated field from the Apply To list.
12. Select HTML from the Category list.
13. Click OK. The calculated field shows the Total values in green or red.
Adding Calculated Fields
Manipulating Data in Views 5-23
5.4.2 Using Decimal Type Numbers in CalculationsConstant values of type Decimal used in a calculated field require the "D" character suffix.
For example, 10D, 55.45D, 8999.6767D.
This requirement is applicable to calculated columns in Oracle BAM data objects and calculated fields in reports created in Oracle BAM Active Studio.
Usage of the "D" suffix is mandatory for operators such as If, IfNull(), and so on, that require all operands to be of same type. While using constants as operands with other fields of type Decimal in these operations, you must add the character "D" as a suffix to all of the constants in the expression.
■ Numeric constants without a decimal point (.) and without the "D" suffix are interpreted as type Integer (for example, 0, 5, 9, 676).
■ Numeric constants with a decimal point (.) and without the "D" suffix are interpreted as type Float (for example, 78.6, 78.9 9.0, 0.0).
■ Numeric constants with the "D" suffix and with or without a decimal point are interpreted as type Decimal.
Usage example:For a field Field1 of type Decimal, a calculation formula could be:
If(Field1 == 0.0D) Then (111111D) Else (222222D)
IfNull(Field1, 0.0D)
5.4.3 Formatting Date Subtractions in Calculated FieldsCalculated fields involving date subtractions such as datetime–datetime, timestamp–datetime or datetime–timestamp, can be created in both Oracle BAM Active Studio and Oracle BAM Architect.
When you add a calculated field involving a date subtraction, the result is an integer displayed in seconds (for example, 82,944,000). To format the result in Days, H:mm:ss (for example, 40 Days, 7:40:33), change the number value format property of the calculated field.
If the calculated field is created in Oracle BAM Architect, you can only change the value format property of the calculated field when you use the field in a view in Oracle BAM Active Studio. The following example guides you through the steps for formatting a date subtraction calculated field in Oracle BAM Active Studio.
1. In the View Editor, click the Properties icon and then click the Value Format tab.
2. Select the calculated field from the Apply To list.
Select a field that involves a date subtraction. The date subtraction formatting feature does not apply to integer only fields.
3. Select Number in the Category list.
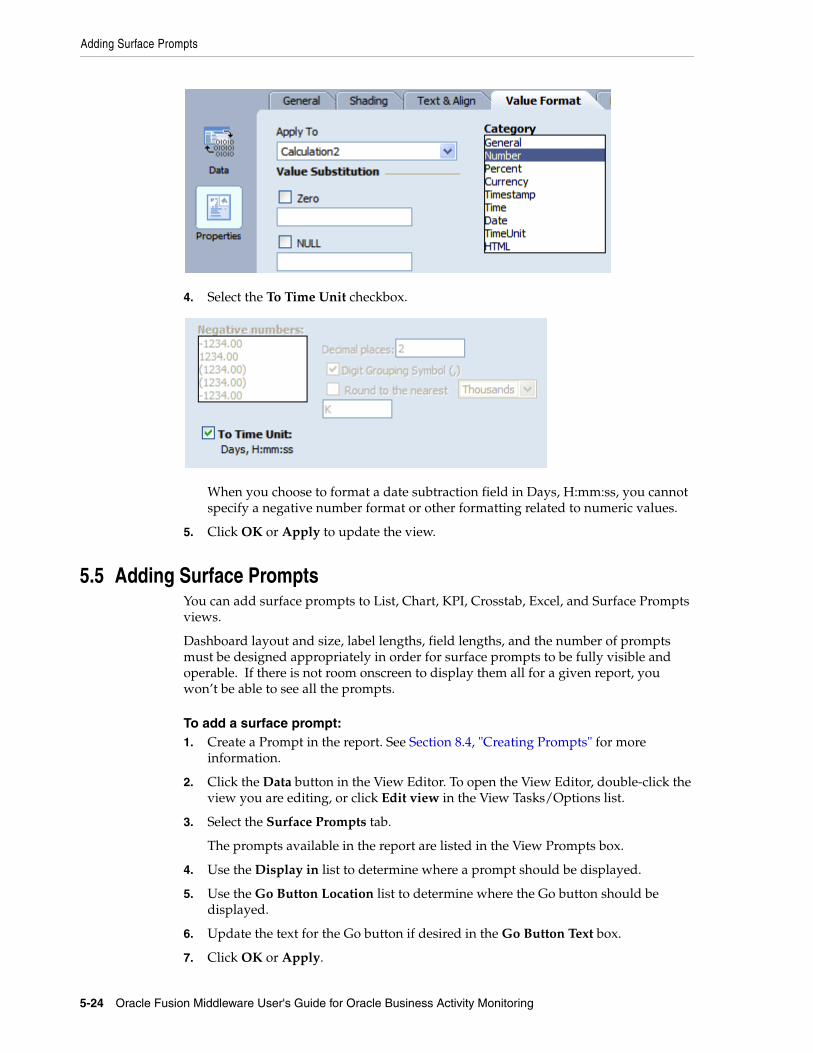
Adding Surface Prompts
5-24 Oracle Fusion Middleware User's Guide for Oracle Business Activity Monitoring
4. Select the To Time Unit checkbox.
When you choose to format a date subtraction field in Days, H:mm:ss, you cannot specify a negative number format or other formatting related to numeric values.
5. Click OK or Apply to update the view.
5.5 Adding Surface PromptsYou can add surface prompts to List, Chart, KPI, Crosstab, Excel, and Surface Prompts views.
Dashboard layout and size, label lengths, field lengths, and the number of prompts must be designed appropriately in order for surface prompts to be fully visible and operable. If there is not room onscreen to display them all for a given report, you won’t be able to see all the prompts.
To add a surface prompt:1. Create a Prompt in the report. See Section 8.4, "Creating Prompts" for more
information.
2. Click the Data button in the View Editor. To open the View Editor, double-click the view you are editing, or click Edit view in the View Tasks/Options list.
3. Select the Surface Prompts tab.
The prompts available in the report are listed in the View Prompts box.
4. Use the Display in list to determine where a prompt should be displayed.
5. Use the Go Button Location list to determine where the Go button should be displayed.
6. Update the text for the Go button if desired in the Go Button Text box.
7. Click OK or Apply.
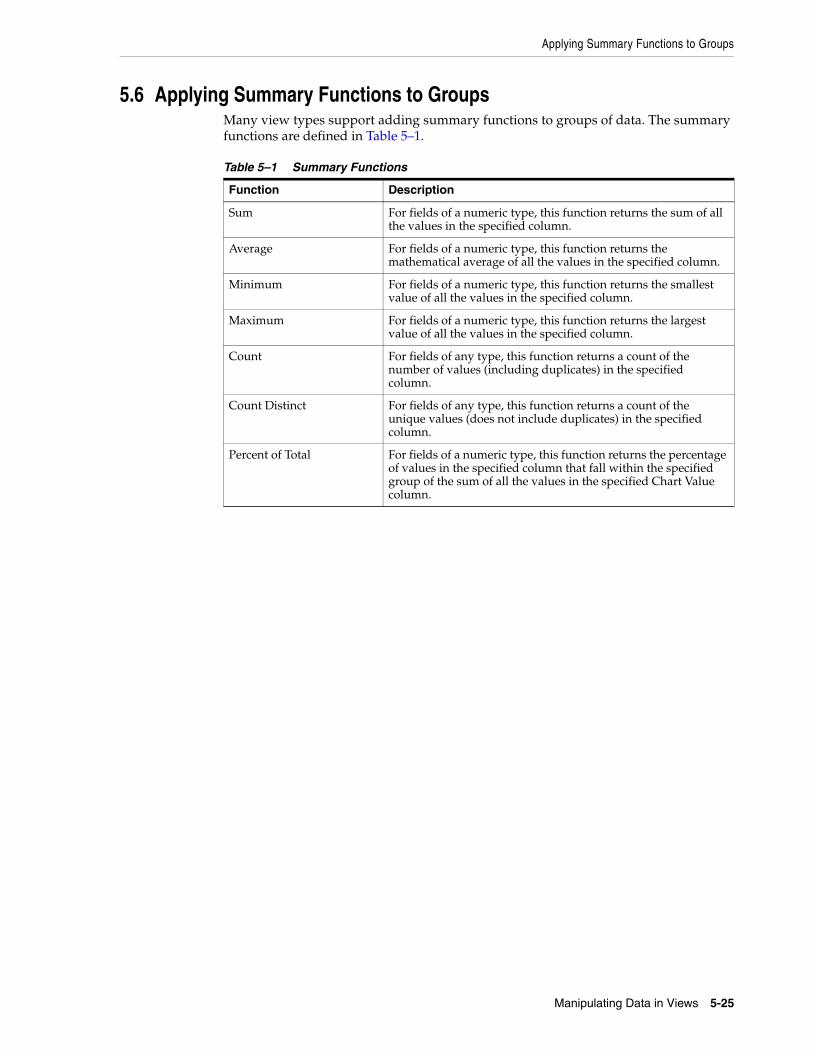
Applying Summary Functions to Groups
Manipulating Data in Views 5-25
5.6 Applying Summary Functions to GroupsMany view types support adding summary functions to groups of data. The summary functions are defined in Table 5–1.
Table 5–1 Summary Functions
Function Description
Sum For fields of a numeric type, this function returns the sum of all the values in the specified column.
Average For fields of a numeric type, this function returns the mathematical average of all the values in the specified column.
Minimum For fields of a numeric type, this function returns the smallest value of all the values in the specified column.
Maximum For fields of a numeric type, this function returns the largest value of all the values in the specified column.
Count For fields of any type, this function returns a count of the number of values (including duplicates) in the specified column.
Count Distinct For fields of any type, this function returns a count of the unique values (does not include duplicates) in the specified column.
Percent of Total For fields of a numeric type, this function returns the percentage of values in the specified column that fall within the specified group of the sum of all the values in the specified Chart Value column.

Applying Summary Functions to Groups
5-26 Oracle Fusion Middleware User's Guide for Oracle Business Activity Monitoring
6
Formatting Views 6-1
6Formatting Views
This chapter provides detailed information about specific formatting options available for each view in Oracle Business Activity Monitoring (Oracle BAM) Active Studio, for example axis properties in chart views, color themes in crosstab and matrix views, and active data display properties in list views. General formatting properties for view titles and background color, font and text alignment in view labels, and value formatting in fields containing numeric and datetime values are also included.
This chapter contains the following topics:
■ Section 6.1, "Introduction to Formatting Views"
■ Section 6.2, "Configuring General Formatting Properties"
■ Section 6.3, "Configuring Axis Properties"
■ Section 6.4, "Configuring View Borders, Shading, and Background Color"
■ Section 6.5, "Configuring Text Alignment"
■ Section 6.6, "Displaying Data Labels"
■ Section 6.7, "Configuring Font Formats"
■ Section 6.8, "Configuring Themes"
■ Section 6.9, "Configuring Value Formats"
■ Section 6.10, "Configuring the Display of Active Data"
■ Section 6.11, "Setting a View-Level Poll Mode Refresh Interval"
■ Section 6.12, "Configuring Patterns"
6.1 Introduction to Formatting ViewsFormatting changes the way parts of the view look. A report can contain several views of different types. You apply formatting to each view in a report.
Formatting includes tasks such as adding display titles, formatting text and colors, and changing value formats. Several formatting features apply to specific view types only. Because each of the view types has different characteristics and structures, formatting options change depending on the view type.
When you create or edit a view, select the Properties button to display the formatting options.
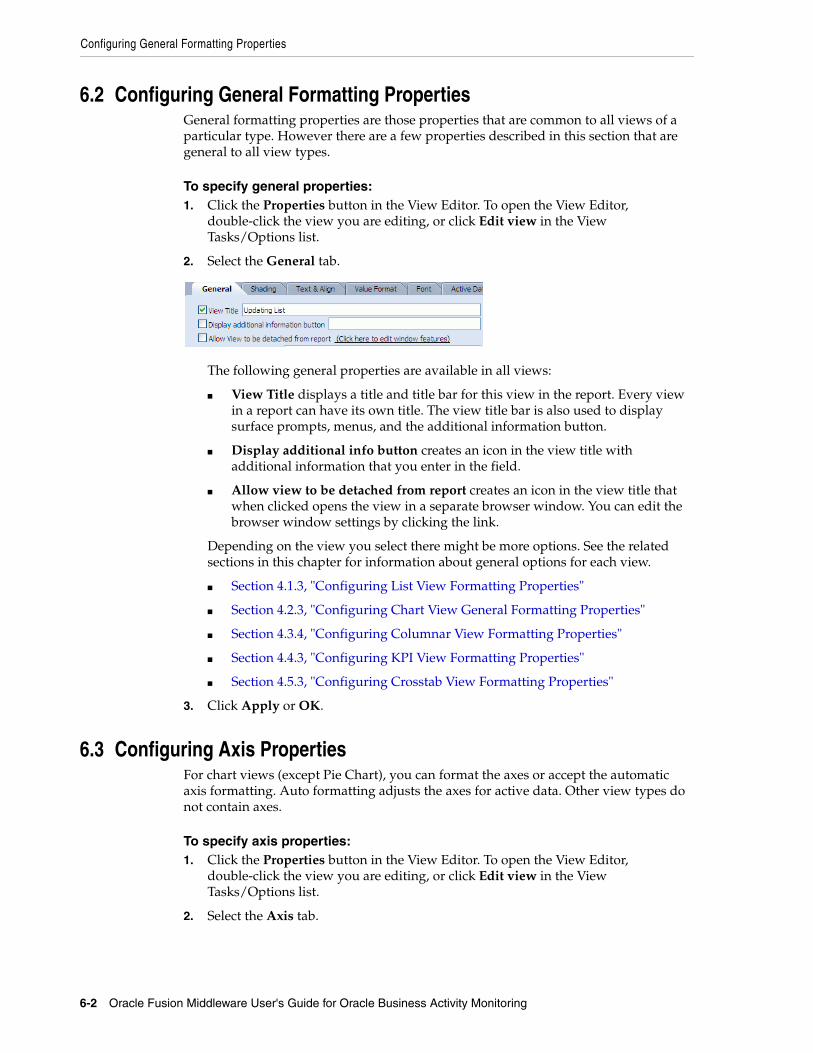
Configuring General Formatting Properties
6-2 Oracle Fusion Middleware User's Guide for Oracle Business Activity Monitoring
6.2 Configuring General Formatting PropertiesGeneral formatting properties are those properties that are common to all views of a particular type. However there are a few properties described in this section that are general to all view types.
To specify general properties:1. Click the Properties button in the View Editor. To open the View Editor,
double-click the view you are editing, or click Edit view in the View Tasks/Options list.
2. Select the General tab.
The following general properties are available in all views:
■ View Title displays a title and title bar for this view in the report. Every view in a report can have its own title. The view title bar is also used to display surface prompts, menus, and the additional information button.
■ Display additional info button creates an icon in the view title with additional information that you enter in the field.
■ Allow view to be detached from report creates an icon in the view title that when clicked opens the view in a separate browser window. You can edit the browser window settings by clicking the link.
Depending on the view you select there might be more options. See the related sections in this chapter for information about general options for each view.
■ Section 4.1.3, "Configuring List View Formatting Properties"
■ Section 4.2.3, "Configuring Chart View General Formatting Properties"
■ Section 4.3.4, "Configuring Columnar View Formatting Properties"
■ Section 4.4.3, "Configuring KPI View Formatting Properties"
■ Section 4.5.3, "Configuring Crosstab View Formatting Properties"
3. Click Apply or OK.
6.3 Configuring Axis PropertiesFor chart views (except Pie Chart), you can format the axes or accept the automatic axis formatting. Auto formatting adjusts the axes for active data. Other view types do not contain axes.
To specify axis properties:1. Click the Properties button in the View Editor. To open the View Editor,
double-click the view you are editing, or click Edit view in the View Tasks/Options list.
2. Select the Axis tab.
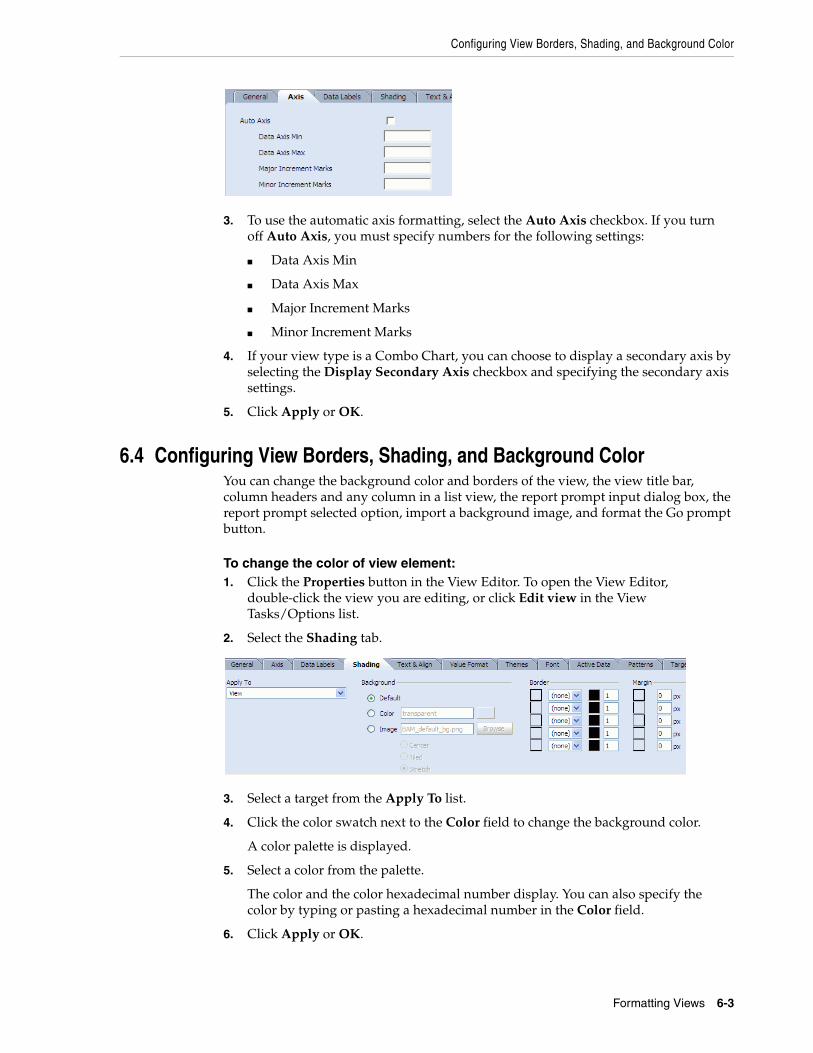
Configuring View Borders, Shading, and Background Color
Formatting Views 6-3
3. To use the automatic axis formatting, select the Auto Axis checkbox. If you turn off Auto Axis, you must specify numbers for the following settings:
■ Data Axis Min
■ Data Axis Max
■ Major Increment Marks
■ Minor Increment Marks
4. If your view type is a Combo Chart, you can choose to display a secondary axis by selecting the Display Secondary Axis checkbox and specifying the secondary axis settings.
5. Click Apply or OK.
6.4 Configuring View Borders, Shading, and Background ColorYou can change the background color and borders of the view, the view title bar, column headers and any column in a list view, the report prompt input dialog box, the report prompt selected option, import a background image, and format the Go prompt button.
To change the color of view element:1. Click the Properties button in the View Editor. To open the View Editor,
double-click the view you are editing, or click Edit view in the View Tasks/Options list.
2. Select the Shading tab.
3. Select a target from the Apply To list.
4. Click the color swatch next to the Color field to change the background color.
A color palette is displayed.
5. Select a color from the palette.
The color and the color hexadecimal number display. You can also specify the color by typing or pasting a hexadecimal number in the Color field.
6. Click Apply or OK.
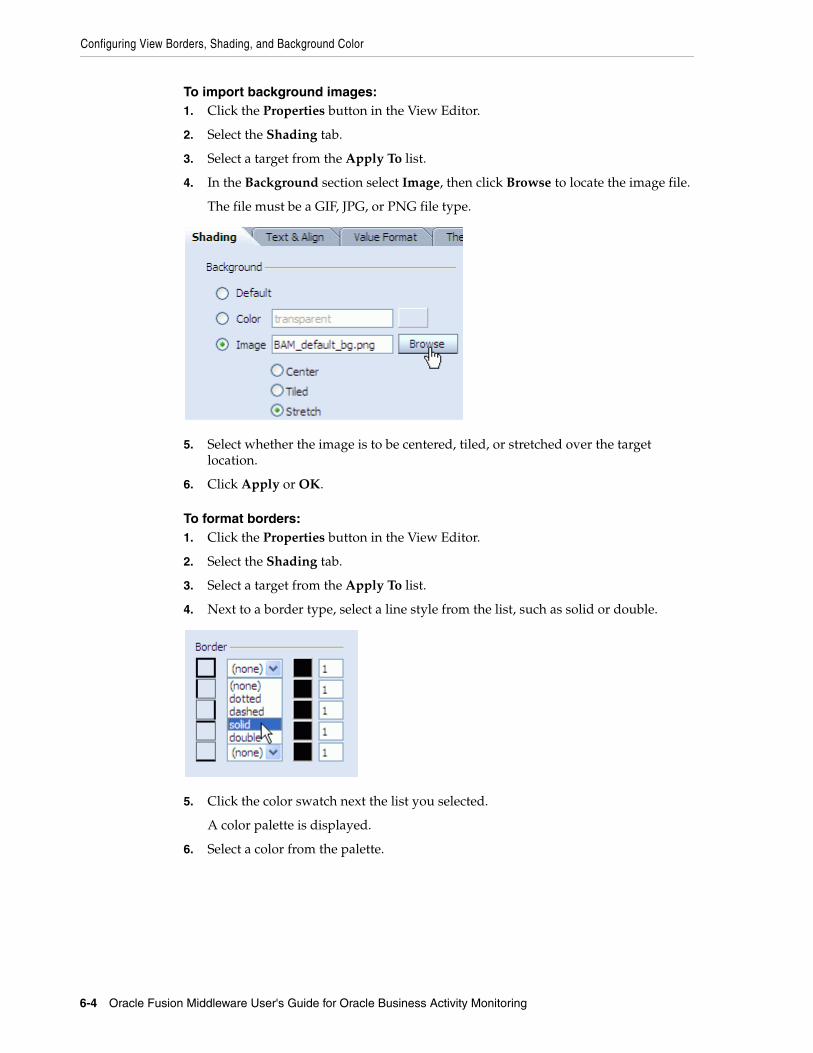
Configuring View Borders, Shading, and Background Color
6-4 Oracle Fusion Middleware User's Guide for Oracle Business Activity Monitoring
To import background images:1. Click the Properties button in the View Editor.
2. Select the Shading tab.
3. Select a target from the Apply To list.
4. In the Background section select Image, then click Browse to locate the image file.
The file must be a GIF, JPG, or PNG file type.
5. Select whether the image is to be centered, tiled, or stretched over the target location.
6. Click Apply or OK.
To format borders:1. Click the Properties button in the View Editor.
2. Select the Shading tab.
3. Select a target from the Apply To list.
4. Next to a border type, select a line style from the list, such as solid or double.
5. Click the color swatch next the list you selected.
A color palette is displayed.
6. Select a color from the palette.
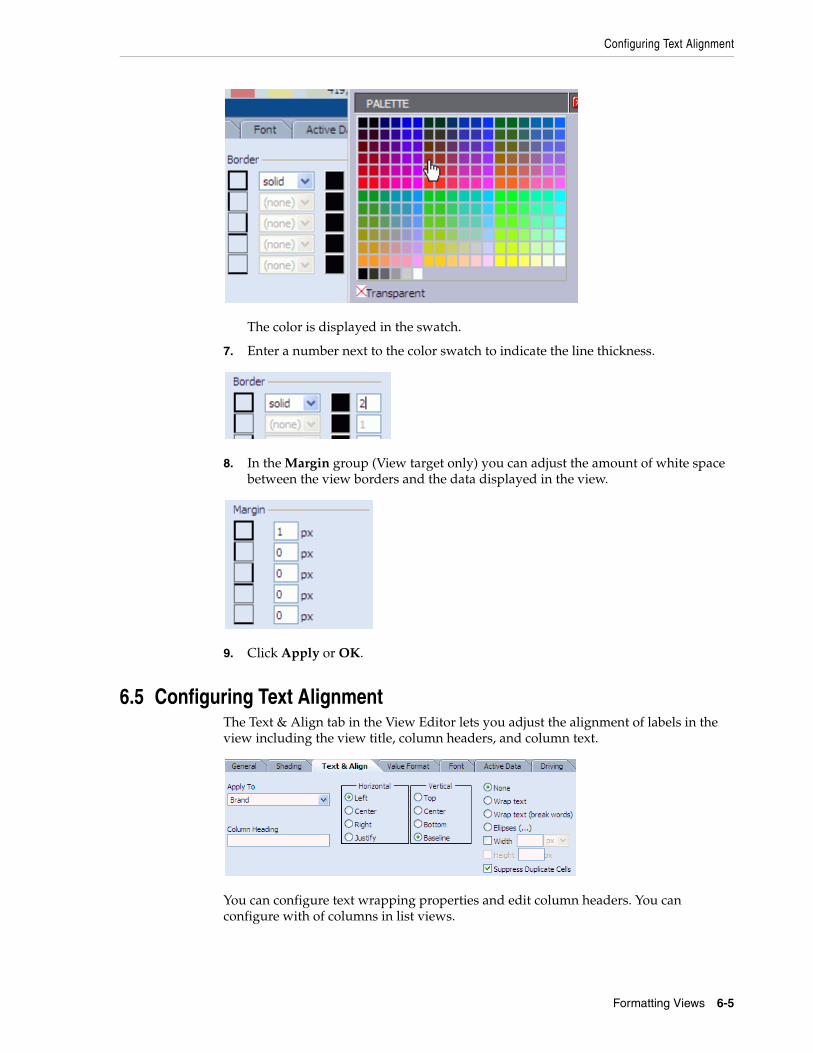
Configuring Text Alignment
Formatting Views 6-5
The color is displayed in the swatch.
7. Enter a number next to the color swatch to indicate the line thickness.
8. In the Margin group (View target only) you can adjust the amount of white space between the view borders and the data displayed in the view.
9. Click Apply or OK.
6.5 Configuring Text AlignmentThe Text & Align tab in the View Editor lets you adjust the alignment of labels in the view including the view title, column headers, and column text.
You can configure text wrapping properties and edit column headers. You can configure with of columns in list views.
Configuring Text Alignment
6-6 Oracle Fusion Middleware User's Guide for Oracle Business Activity Monitoring
To format text alignment:1. Click the Properties button in the View Editor. To open the View Editor,
double-click the view you are editing, or click Edit view in the View Tasks/Options list.
2. Select the Text & Align tab.
3. Select a target from the Apply To list.
4. Edit the column heading name by entering a name in the Column Heading text field. This name is displayed in the view but does not change the column name in the data object.
5. Select an option for horizontal text alignment, and where applicable, for vertical text alignment.
6. Choose from the following properties:
■ None applies no formatting. Text longer than the column is wide is truncated.
■ Wrap text causes data to start on a new line if the column is not wide enough to display all information.
■ Wrap text (break words) breaks long words to wrap them. No hyphen is used.
■ Ellipses truncates data after a set width and displays ellipses as an indicator in list view types only.
■ Width is the set width for the column measured in pixels, inches, or percentage.
You can change the width of the column by choosing the column name in the Text and Align properties tab, and set the pixel value for width, for example, 150. By default, all of the columns have variable width in the report, so if you configure it to be a fixed width, as mentioned, you can increase or decrease the width. If you configure a fixed width for only one column, space is taken away from the remaining columns, but if you configure a fixed width for all of the columns, a scroll bar appears at the bottom of the view to help the user navigate the width of the view.
■ Height is the set height for the row measured in pixels.
■ Suppress Duplicate Cells lets you hide duplicate values in a particular column. See Section 6.5.1, "Suppressing Duplicate Fields" for more information.
7. Click Apply or OK.
6.5.1 Suppressing Duplicate FieldsWhen you create a view with an updating ordered list or action list, you can sort it by one or more columns and then hide the duplicate data in each row so that the list resembles a columnar report.
For example, if you create an updating ordered list on Film Sales data object and then sorted the list by Brand first, then by Description, it would look like this:
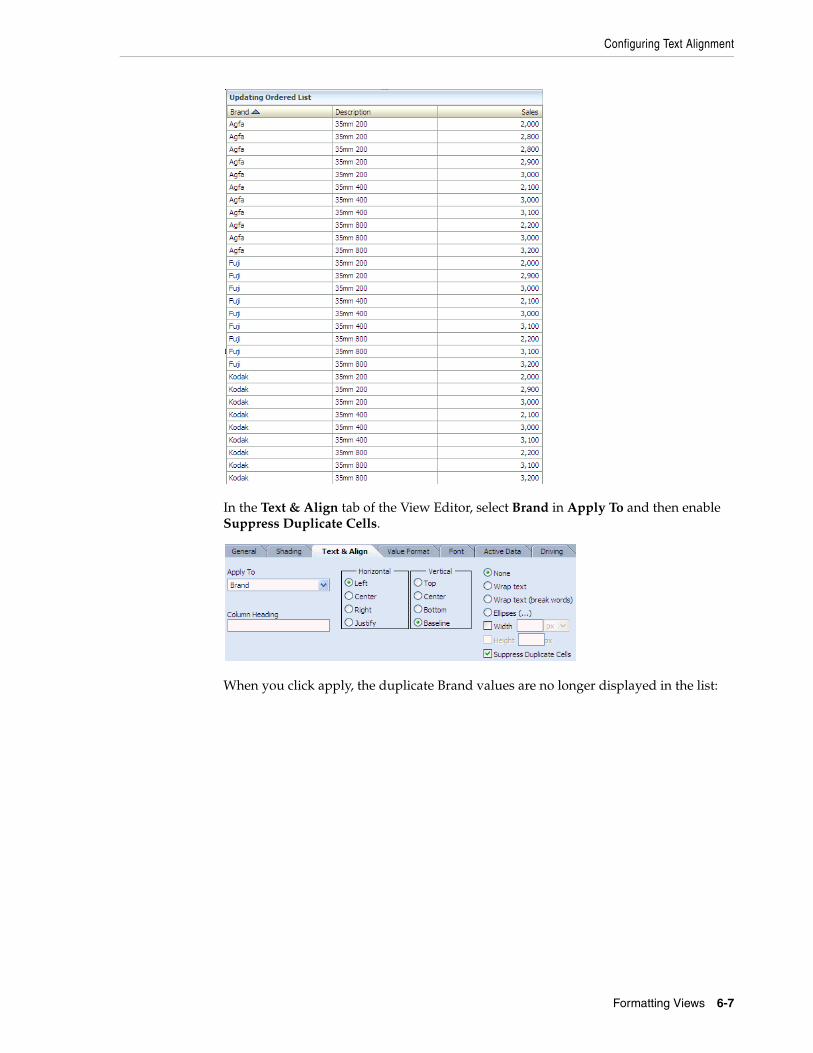
Configuring Text Alignment
Formatting Views 6-7
In the Text & Align tab of the View Editor, select Brand in Apply To and then enable Suppress Duplicate Cells.
When you click apply, the duplicate Brand values are no longer displayed in the list:
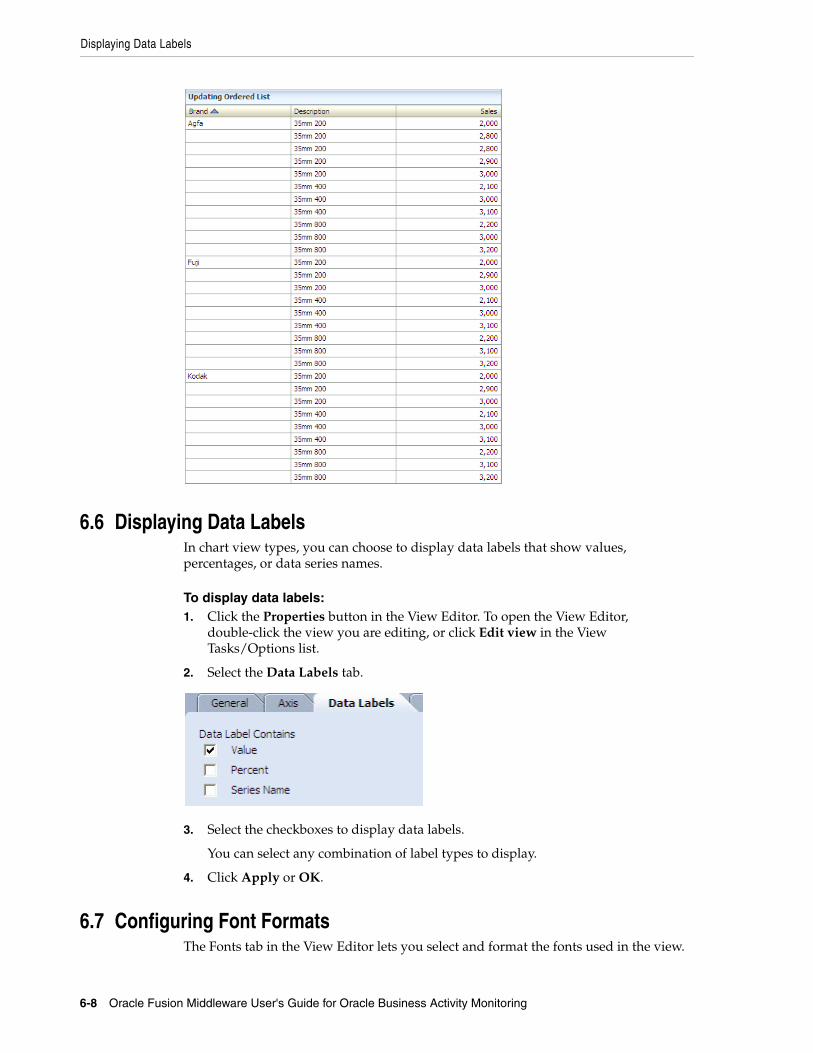
Displaying Data Labels
6-8 Oracle Fusion Middleware User's Guide for Oracle Business Activity Monitoring
6.6 Displaying Data LabelsIn chart view types, you can choose to display data labels that show values, percentages, or data series names.
To display data labels:1. Click the Properties button in the View Editor. To open the View Editor,
double-click the view you are editing, or click Edit view in the View Tasks/Options list.
2. Select the Data Labels tab.
3. Select the checkboxes to display data labels.
You can select any combination of label types to display.
4. Click Apply or OK.
6.7 Configuring Font FormatsThe Fonts tab in the View Editor lets you select and format the fonts used in the view.
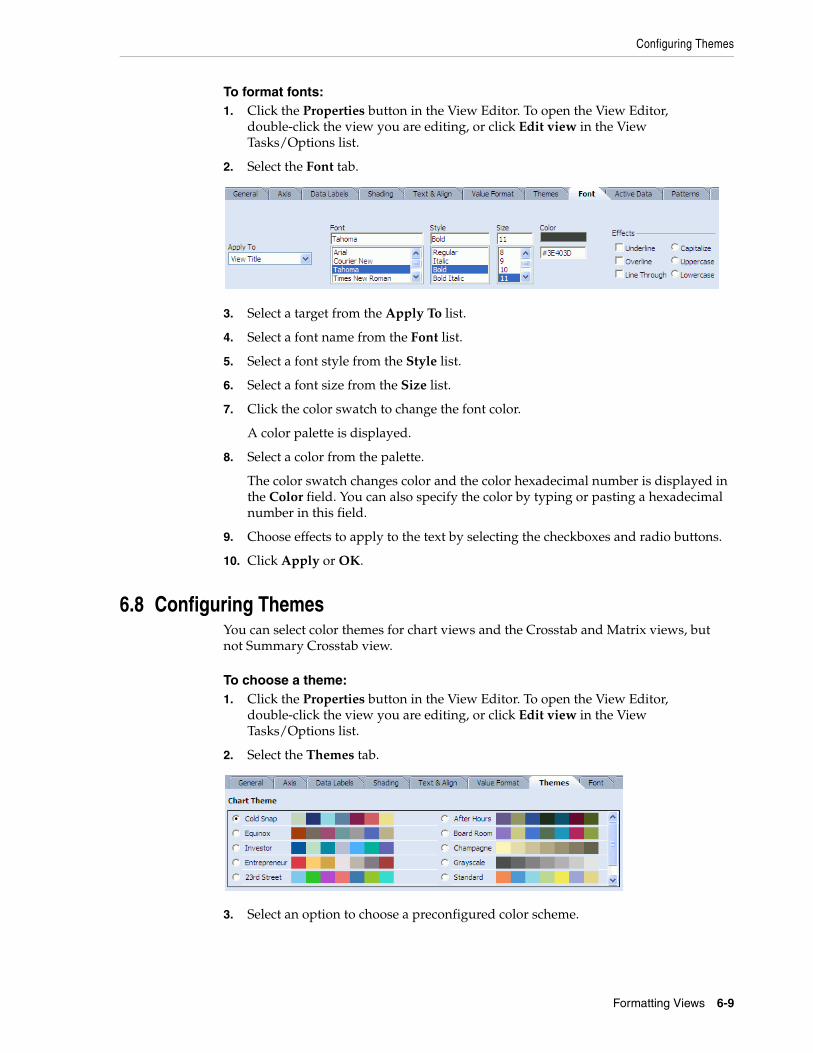
Configuring Themes
Formatting Views 6-9
To format fonts:1. Click the Properties button in the View Editor. To open the View Editor,
double-click the view you are editing, or click Edit view in the View Tasks/Options list.
2. Select the Font tab.
3. Select a target from the Apply To list.
4. Select a font name from the Font list.
5. Select a font style from the Style list.
6. Select a font size from the Size list.
7. Click the color swatch to change the font color.
A color palette is displayed.
8. Select a color from the palette.
The color swatch changes color and the color hexadecimal number is displayed in the Color field. You can also specify the color by typing or pasting a hexadecimal number in this field.
9. Choose effects to apply to the text by selecting the checkboxes and radio buttons.
10. Click Apply or OK.
6.8 Configuring ThemesYou can select color themes for chart views and the Crosstab and Matrix views, but not Summary Crosstab view.
To choose a theme:1. Click the Properties button in the View Editor. To open the View Editor,
double-click the view you are editing, or click Edit view in the View Tasks/Options list.
2. Select the Themes tab.
3. Select an option to choose a preconfigured color scheme.
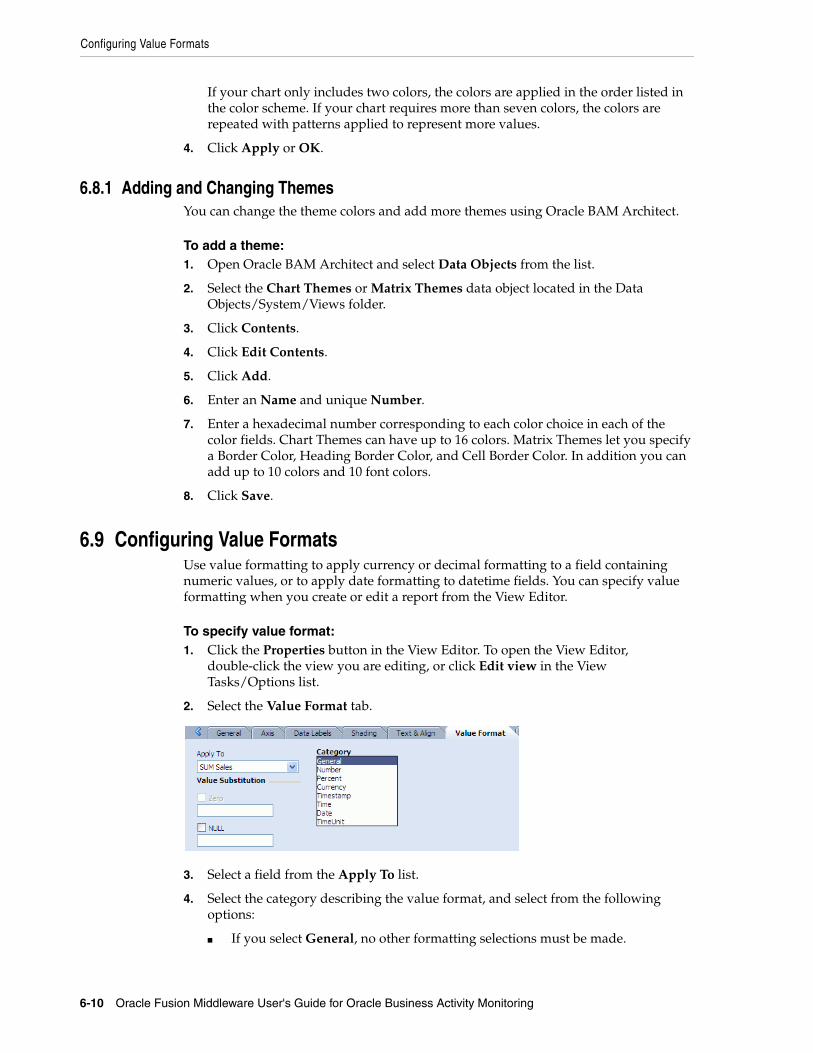
Configuring Value Formats
6-10 Oracle Fusion Middleware User's Guide for Oracle Business Activity Monitoring
If your chart only includes two colors, the colors are applied in the order listed in the color scheme. If your chart requires more than seven colors, the colors are repeated with patterns applied to represent more values.
4. Click Apply or OK.
6.8.1 Adding and Changing ThemesYou can change the theme colors and add more themes using Oracle BAM Architect.
To add a theme:1. Open Oracle BAM Architect and select Data Objects from the list.
2. Select the Chart Themes or Matrix Themes data object located in the Data Objects/System/Views folder.
3. Click Contents.
4. Click Edit Contents.
5. Click Add.
6. Enter an Name and unique Number.
7. Enter a hexadecimal number corresponding to each color choice in each of the color fields. Chart Themes can have up to 16 colors. Matrix Themes let you specify a Border Color, Heading Border Color, and Cell Border Color. In addition you can add up to 10 colors and 10 font colors.
8. Click Save.
6.9 Configuring Value FormatsUse value formatting to apply currency or decimal formatting to a field containing numeric values, or to apply date formatting to datetime fields. You can specify value formatting when you create or edit a report from the View Editor.
To specify value format:1. Click the Properties button in the View Editor. To open the View Editor,
double-click the view you are editing, or click Edit view in the View Tasks/Options list.
2. Select the Value Format tab.
3. Select a field from the Apply To list.
4. Select the category describing the value format, and select from the following options:
■ If you select General, no other formatting selections must be made.
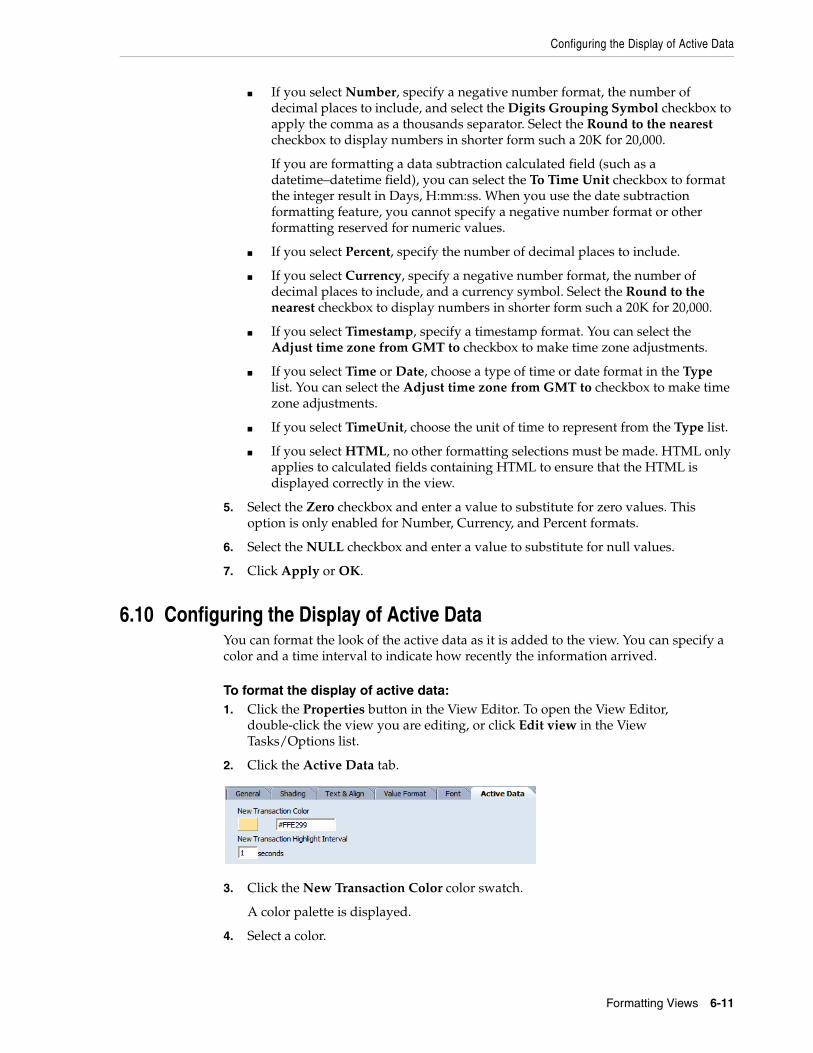
Configuring the Display of Active Data
Formatting Views 6-11
■ If you select Number, specify a negative number format, the number of decimal places to include, and select the Digits Grouping Symbol checkbox to apply the comma as a thousands separator. Select the Round to the nearest checkbox to display numbers in shorter form such a 20K for 20,000.
If you are formatting a data subtraction calculated field (such as a datetime–datetime field), you can select the To Time Unit checkbox to format the integer result in Days, H:mm:ss. When you use the date subtraction formatting feature, you cannot specify a negative number format or other formatting reserved for numeric values.
■ If you select Percent, specify the number of decimal places to include.
■ If you select Currency, specify a negative number format, the number of decimal places to include, and a currency symbol. Select the Round to the nearest checkbox to display numbers in shorter form such a 20K for 20,000.
■ If you select Timestamp, specify a timestamp format. You can select the Adjust time zone from GMT to checkbox to make time zone adjustments.
■ If you select Time or Date, choose a type of time or date format in the Type list. You can select the Adjust time zone from GMT to checkbox to make time zone adjustments.
■ If you select TimeUnit, choose the unit of time to represent from the Type list.
■ If you select HTML, no other formatting selections must be made. HTML only applies to calculated fields containing HTML to ensure that the HTML is displayed correctly in the view.
5. Select the Zero checkbox and enter a value to substitute for zero values. This option is only enabled for Number, Currency, and Percent formats.
6. Select the NULL checkbox and enter a value to substitute for null values.
7. Click Apply or OK.
6.10 Configuring the Display of Active DataYou can format the look of the active data as it is added to the view. You can specify a color and a time interval to indicate how recently the information arrived.
To format the display of active data:1. Click the Properties button in the View Editor. To open the View Editor,
double-click the view you are editing, or click Edit view in the View Tasks/Options list.
2. Click the Active Data tab.
3. Click the New Transaction Color color swatch.
A color palette is displayed.
4. Select a color.
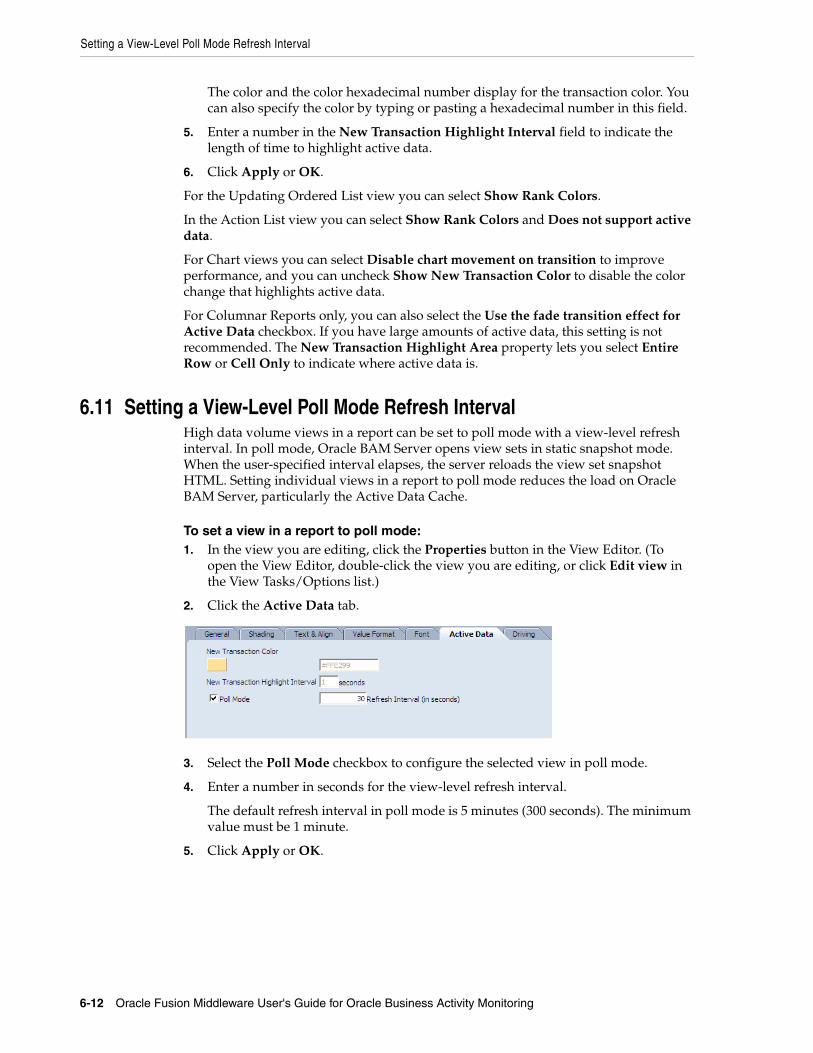
Setting a View-Level Poll Mode Refresh Interval
6-12 Oracle Fusion Middleware User's Guide for Oracle Business Activity Monitoring
The color and the color hexadecimal number display for the transaction color. You can also specify the color by typing or pasting a hexadecimal number in this field.
5. Enter a number in the New Transaction Highlight Interval field to indicate the length of time to highlight active data.
6. Click Apply or OK.
For the Updating Ordered List view you can select Show Rank Colors.
In the Action List view you can select Show Rank Colors and Does not support active data.
For Chart views you can select Disable chart movement on transition to improve performance, and you can uncheck Show New Transaction Color to disable the color change that highlights active data.
For Columnar Reports only, you can also select the Use the fade transition effect for Active Data checkbox. If you have large amounts of active data, this setting is not recommended. The New Transaction Highlight Area property lets you select Entire Row or Cell Only to indicate where active data is.
6.11 Setting a View-Level Poll Mode Refresh IntervalHigh data volume views in a report can be set to poll mode with a view-level refresh interval. In poll mode, Oracle BAM Server opens view sets in static snapshot mode. When the user-specified interval elapses, the server reloads the view set snapshot HTML. Setting individual views in a report to poll mode reduces the load on Oracle BAM Server, particularly the Active Data Cache.
To set a view in a report to poll mode:1. In the view you are editing, click the Properties button in the View Editor. (To
open the View Editor, double-click the view you are editing, or click Edit view in the View Tasks/Options list.)
2. Click the Active Data tab.
3. Select the Poll Mode checkbox to configure the selected view in poll mode.
4. Enter a number in seconds for the view-level refresh interval.
The default refresh interval in poll mode is 5 minutes (300 seconds). The minimum value must be 1 minute.
5. Click Apply or OK.
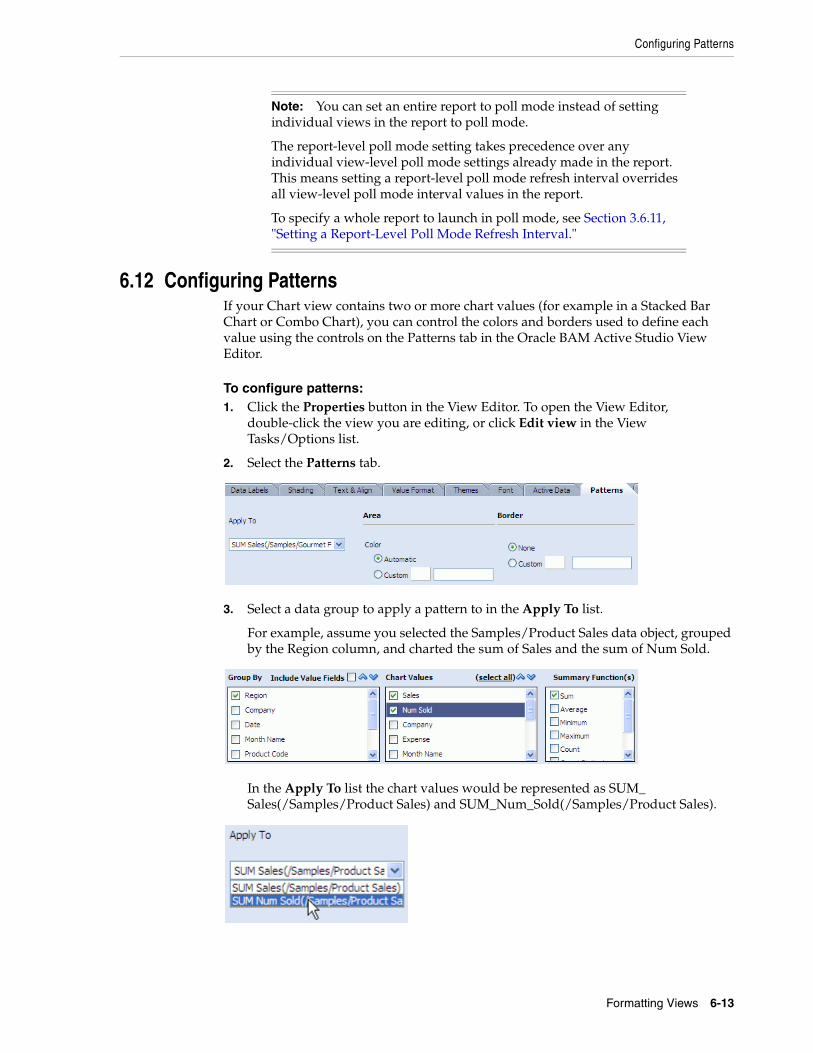
Configuring Patterns
Formatting Views 6-13
6.12 Configuring PatternsIf your Chart view contains two or more chart values (for example in a Stacked Bar Chart or Combo Chart), you can control the colors and borders used to define each value using the controls on the Patterns tab in the Oracle BAM Active Studio View Editor.
To configure patterns:1. Click the Properties button in the View Editor. To open the View Editor,
double-click the view you are editing, or click Edit view in the View Tasks/Options list.
2. Select the Patterns tab.
3. Select a data group to apply a pattern to in the Apply To list.
For example, assume you selected the Samples/Product Sales data object, grouped by the Region column, and charted the sum of Sales and the sum of Num Sold.
In the Apply To list the chart values would be represented as SUM_Sales(/Samples/Product Sales) and SUM_Num_Sold(/Samples/Product Sales).
Note: You can set an entire report to poll mode instead of setting individual views in the report to poll mode.
The report-level poll mode setting takes precedence over any individual view-level poll mode settings already made in the report. This means setting a report-level poll mode refresh interval overrides all view-level poll mode interval values in the report.
To specify a whole report to launch in poll mode, see Section 3.6.11, "Setting a Report-Level Poll Mode Refresh Interval."
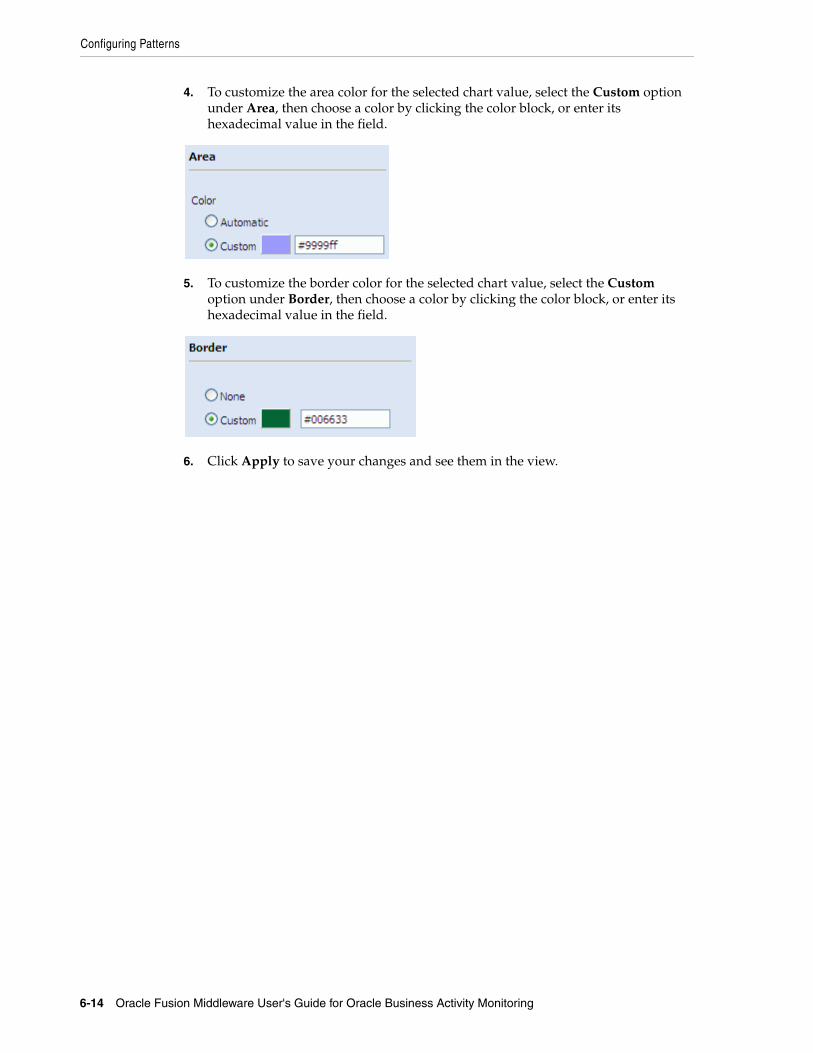
Configuring Patterns
6-14 Oracle Fusion Middleware User's Guide for Oracle Business Activity Monitoring
4. To customize the area color for the selected chart value, select the Custom option under Area, then choose a color by clicking the color block, or enter its hexadecimal value in the field.
5. To customize the border color for the selected chart value, select the Custom option under Border, then choose a color by clicking the color block, or enter its hexadecimal value in the field.
6. Click Apply to save your changes and see them in the view.
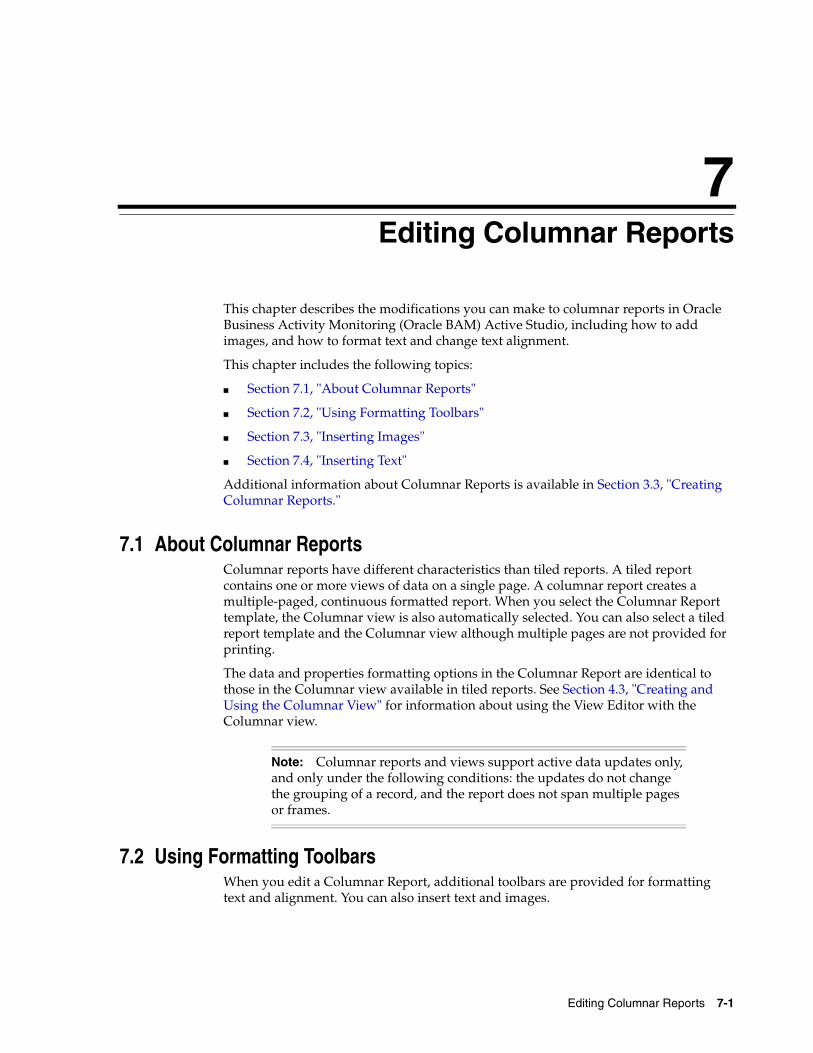
7
Editing Columnar Reports 7-1
7Editing Columnar Reports
This chapter describes the modifications you can make to columnar reports in Oracle Business Activity Monitoring (Oracle BAM) Active Studio, including how to add images, and how to format text and change text alignment.
This chapter includes the following topics:
■ Section 7.1, "About Columnar Reports"
■ Section 7.2, "Using Formatting Toolbars"
■ Section 7.3, "Inserting Images"
■ Section 7.4, "Inserting Text"
Additional information about Columnar Reports is available in Section 3.3, "Creating Columnar Reports."
7.1 About Columnar ReportsColumnar reports have different characteristics than tiled reports. A tiled report contains one or more views of data on a single page. A columnar report creates a multiple-paged, continuous formatted report. When you select the Columnar Report template, the Columnar view is also automatically selected. You can also select a tiled report template and the Columnar view although multiple pages are not provided for printing.
The data and properties formatting options in the Columnar Report are identical to those in the Columnar view available in tiled reports. See Section 4.3, "Creating and Using the Columnar View" for information about using the View Editor with the Columnar view.
7.2 Using Formatting ToolbarsWhen you edit a Columnar Report, additional toolbars are provided for formatting text and alignment. You can also insert text and images.
Note: Columnar reports and views support active data updates only, and only under the following conditions: the updates do not change the grouping of a record, and the report does not span multiple pages or frames.
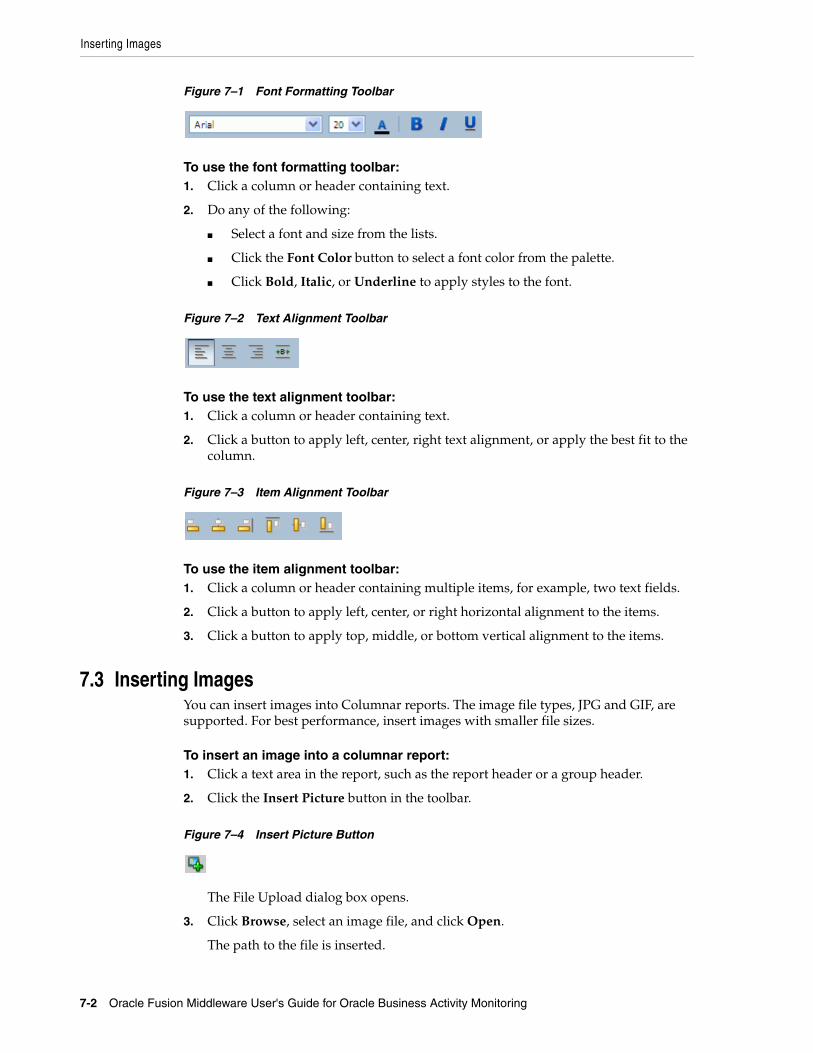
Inserting Images
7-2 Oracle Fusion Middleware User's Guide for Oracle Business Activity Monitoring
Figure 7–1 Font Formatting Toolbar
To use the font formatting toolbar:1. Click a column or header containing text.
2. Do any of the following:
■ Select a font and size from the lists.
■ Click the Font Color button to select a font color from the palette.
■ Click Bold, Italic, or Underline to apply styles to the font.
Figure 7–2 Text Alignment Toolbar
To use the text alignment toolbar:1. Click a column or header containing text.
2. Click a button to apply left, center, right text alignment, or apply the best fit to the column.
Figure 7–3 Item Alignment Toolbar
To use the item alignment toolbar:1. Click a column or header containing multiple items, for example, two text fields.
2. Click a button to apply left, center, or right horizontal alignment to the items.
3. Click a button to apply top, middle, or bottom vertical alignment to the items.
7.3 Inserting ImagesYou can insert images into Columnar reports. The image file types, JPG and GIF, are supported. For best performance, insert images with smaller file sizes.
To insert an image into a columnar report:1. Click a text area in the report, such as the report header or a group header.
2. Click the Insert Picture button in the toolbar.
Figure 7–4 Insert Picture Button
The File Upload dialog box opens.
3. Click Browse, select an image file, and click Open.
The path to the file is inserted.
Inserting Text
Editing Columnar Reports 7-3
4. Click Upload.
5. After the file is uploaded, click OK.
The image is displayed in the report. The image is copied to the server.
To delete images:1. Click the image in the report.
2. Click the Delete Object button in the toolbar.
Figure 7–5 Delete Object Button
The image is deleted.
7.4 Inserting TextYou can insert text into Columnar reports.
To insert text into a columnar report:1. Click a text area in the report, such as the report header or a group header.
2. Click the Insert Text button in the toolbar.
Figure 7–6 Insert Text Button
The text field opens.
3. Highlight the text and replace it.
To delete inserted text:1. Click the text box in the report.
2. Click the Delete Object button in the toolbar.
The text is deleted.

Inserting Text
7-4 Oracle Fusion Middleware User's Guide for Oracle Business Activity Monitoring
8
Using Prompts and Parameters 8-1
8Using Prompts and Parameters
This chapter describes how to add parameters and prompts to reports that you create in Oracle Business Activity Monitoring (Oracle BAM) Active Studio, to allow users to specify values so that limited or customized views of the data can be presented in the reports. It also describes how to use parameters to construct report URLs, and how to use a view selection change to drive a prompt or parameter in another view.
This chapter contains the following topics:
■ Section 8.1, "About Prompts and Parameters"
■ Section 8.2, "Creating Parameters"
■ Section 8.3, "Creating Custom Parameters"
■ Section 8.4, "Creating Prompts"
■ Section 8.5, "Working with Prompts and Parameters"
■ Section 8.6, "Using Parameters in Report URLs"
■ Section 8.7, "Driving Prompts and Parameters from Other Views"
8.1 About Prompts and ParametersParameters are similar to variables that represent substituted values. Prompts are dialog boxes displayed before the report opens so that the user can specify a parameter value. You can create prompts that display when a user views a report. The user must specify a value in the prompt dialog box which is used to limit or customize the view of data in the report. You can also create parameters that contain values. Parameters are not displayed to the user when the report is run.
You must apply prompts and parameters in a report by using them in filters. You can create prompts and parameters from the Report Properties dialog box or when you are creating a filter. The Prompts and Parameters page in the Report Properties dialog box provides a central way to manage, edit, and delete both prompts and parameters for the entire report.
After prompts and parameters are created, they are listed in order by name in the Report Properties dialog box. The data type and default values display next to the prompt or parameter name. You can change the order that prompts display by arranging them in the list. The Arrange buttons and Preview buttons are disabled for parameters because they are not viewed by end users.
You can create alerts on reports that contain prompts or parameters, but only one alert action option is available. See "Send a parameterized message" in Oracle Fusion Middleware Developer's Guide for Oracle SOA Suite for more information.
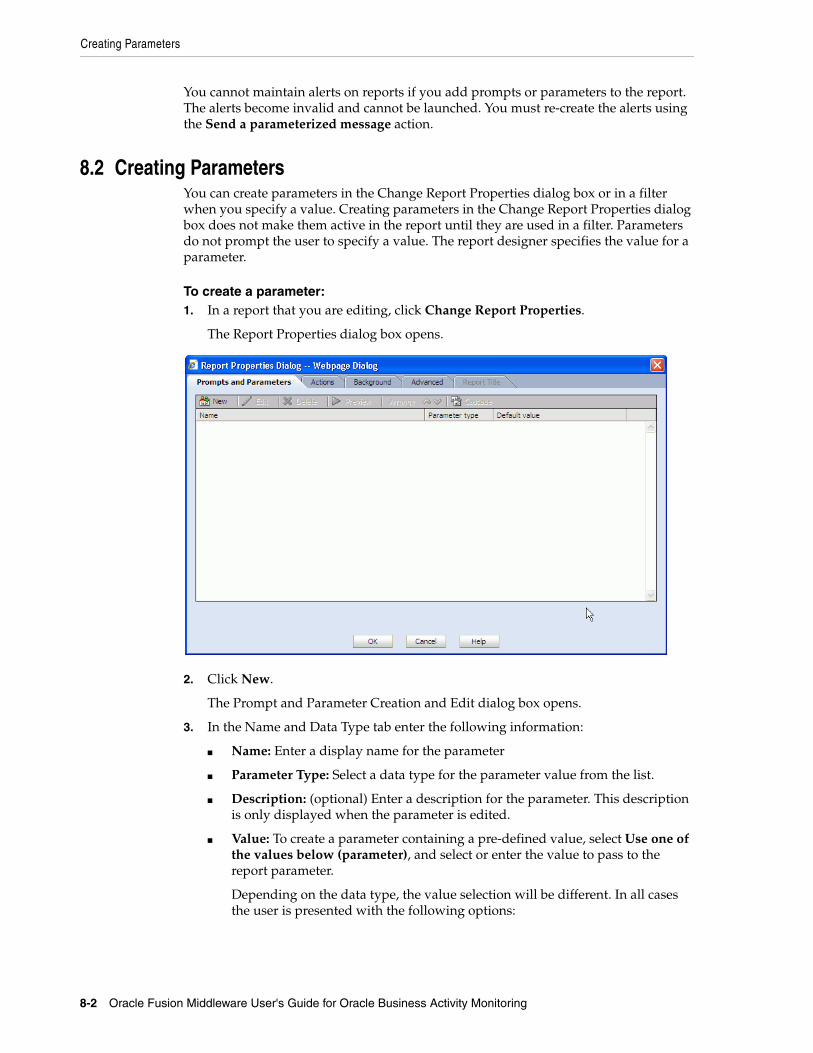
Creating Parameters
8-2 Oracle Fusion Middleware User's Guide for Oracle Business Activity Monitoring
You cannot maintain alerts on reports if you add prompts or parameters to the report. The alerts become invalid and cannot be launched. You must re-create the alerts using the Send a parameterized message action.
8.2 Creating ParametersYou can create parameters in the Change Report Properties dialog box or in a filter when you specify a value. Creating parameters in the Change Report Properties dialog box does not make them active in the report until they are used in a filter. Parameters do not prompt the user to specify a value. The report designer specifies the value for a parameter.
To create a parameter:1. In a report that you are editing, click Change Report Properties.
The Report Properties dialog box opens.
2. Click New.
The Prompt and Parameter Creation and Edit dialog box opens.
3. In the Name and Data Type tab enter the following information:
■ Name: Enter a display name for the parameter
■ Parameter Type: Select a data type for the parameter value from the list.
■ Description: (optional) Enter a description for the parameter. This description is only displayed when the parameter is edited.
■ Value: To create a parameter containing a pre-defined value, select Use one of the values below (parameter), and select or enter the value to pass to the report parameter.
Depending on the data type, the value selection will be different. In all cases the user is presented with the following options:
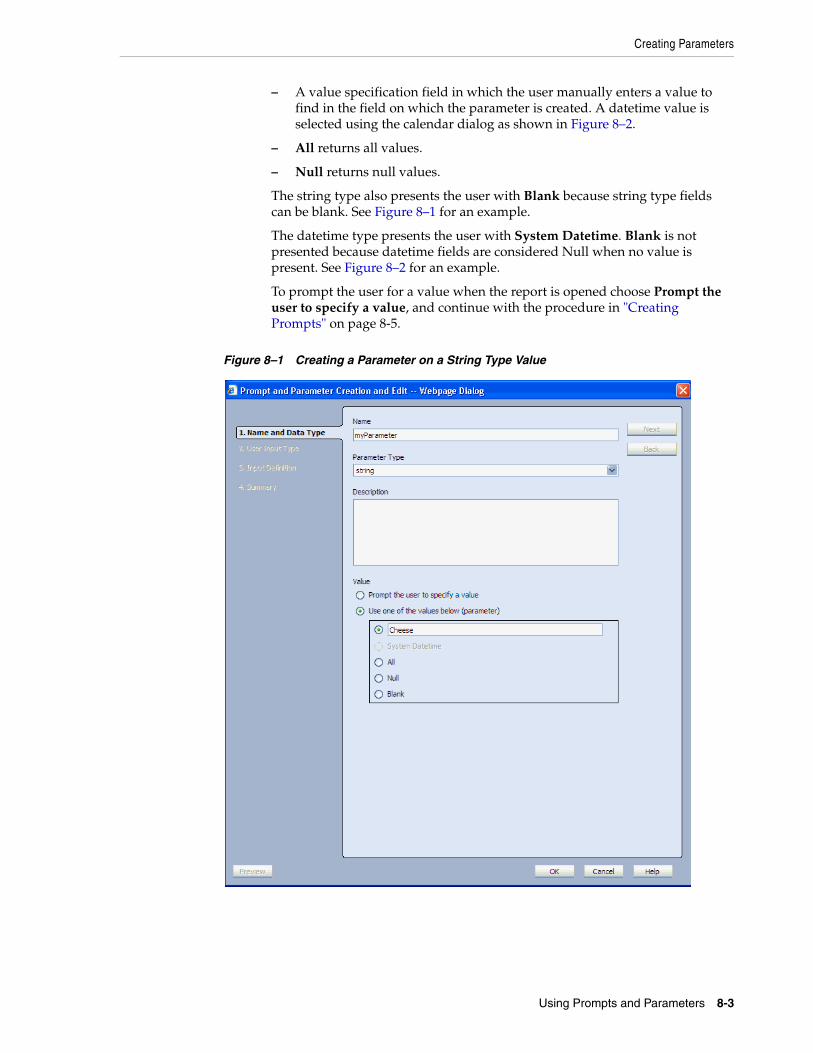
Creating Parameters
Using Prompts and Parameters 8-3
– A value specification field in which the user manually enters a value to find in the field on which the parameter is created. A datetime value is selected using the calendar dialog as shown in Figure 8–2.
– All returns all values.
– Null returns null values.
The string type also presents the user with Blank because string type fields can be blank. See Figure 8–1 for an example.
The datetime type presents the user with System Datetime. Blank is not presented because datetime fields are considered Null when no value is present. See Figure 8–2 for an example.
To prompt the user for a value when the report is opened choose Prompt the user to specify a value, and continue with the procedure in "Creating Prompts" on page 8-5.
Figure 8–1 Creating a Parameter on a String Type Value
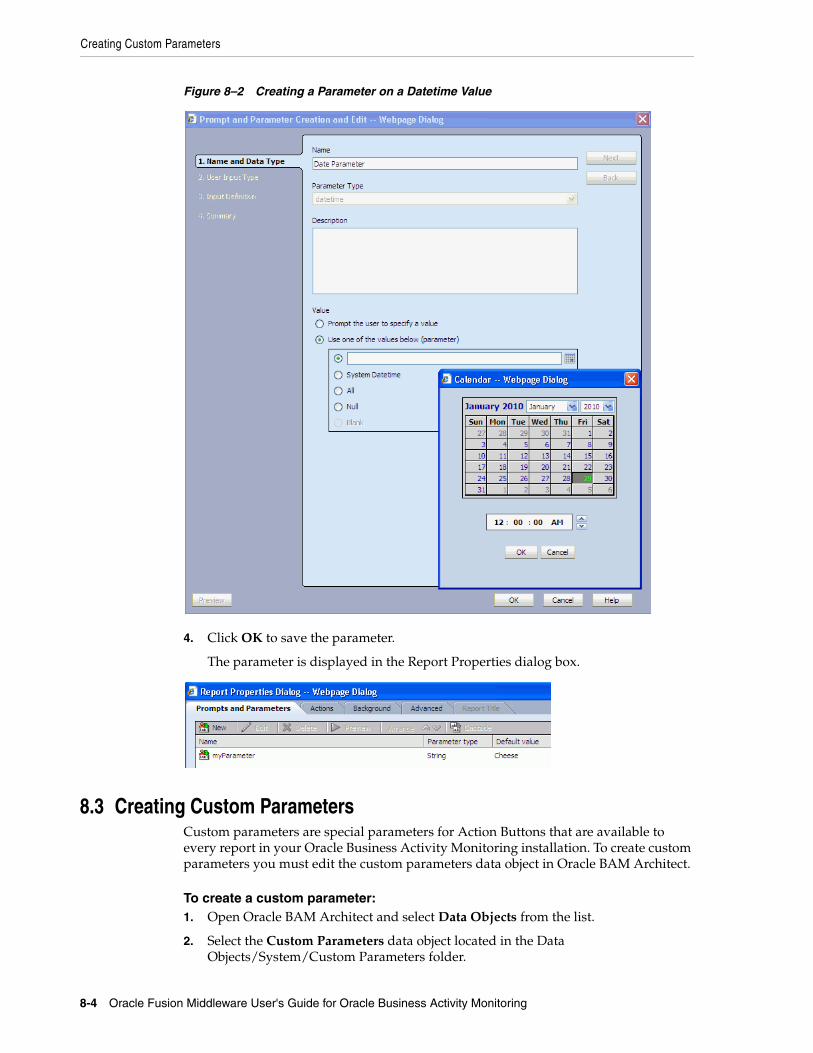
Creating Custom Parameters
8-4 Oracle Fusion Middleware User's Guide for Oracle Business Activity Monitoring
Figure 8–2 Creating a Parameter on a Datetime Value
4. Click OK to save the parameter.
The parameter is displayed in the Report Properties dialog box.
8.3 Creating Custom ParametersCustom parameters are special parameters for Action Buttons that are available to every report in your Oracle Business Activity Monitoring installation. To create custom parameters you must edit the custom parameters data object in Oracle BAM Architect.
To create a custom parameter:1. Open Oracle BAM Architect and select Data Objects from the list.
2. Select the Custom Parameters data object located in the Data Objects/System/Custom Parameters folder.
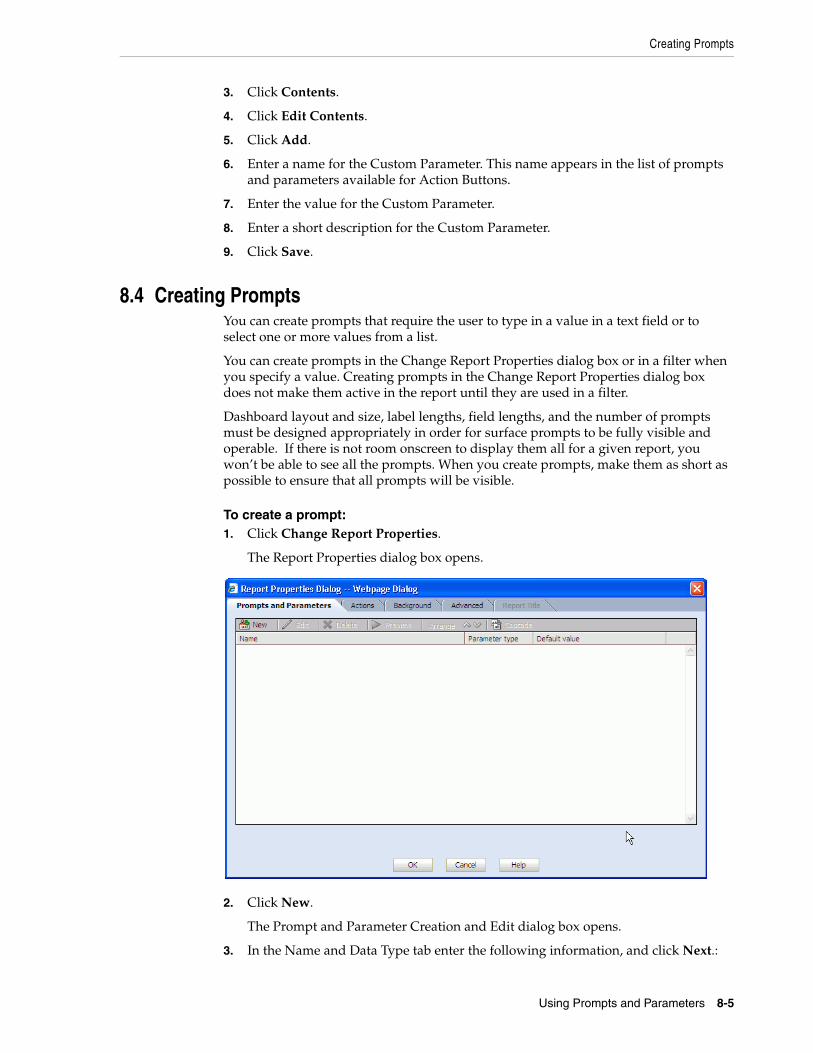
Creating Prompts
Using Prompts and Parameters 8-5
3. Click Contents.
4. Click Edit Contents.
5. Click Add.
6. Enter a name for the Custom Parameter. This name appears in the list of prompts and parameters available for Action Buttons.
7. Enter the value for the Custom Parameter.
8. Enter a short description for the Custom Parameter.
9. Click Save.
8.4 Creating PromptsYou can create prompts that require the user to type in a value in a text field or to select one or more values from a list.
You can create prompts in the Change Report Properties dialog box or in a filter when you specify a value. Creating prompts in the Change Report Properties dialog box does not make them active in the report until they are used in a filter.
Dashboard layout and size, label lengths, field lengths, and the number of prompts must be designed appropriately in order for surface prompts to be fully visible and operable. If there is not room onscreen to display them all for a given report, you won’t be able to see all the prompts. When you create prompts, make them as short as possible to ensure that all prompts will be visible.
To create a prompt:1. Click Change Report Properties.
The Report Properties dialog box opens.
2. Click New.
The Prompt and Parameter Creation and Edit dialog box opens.
3. In the Name and Data Type tab enter the following information, and click Next.:
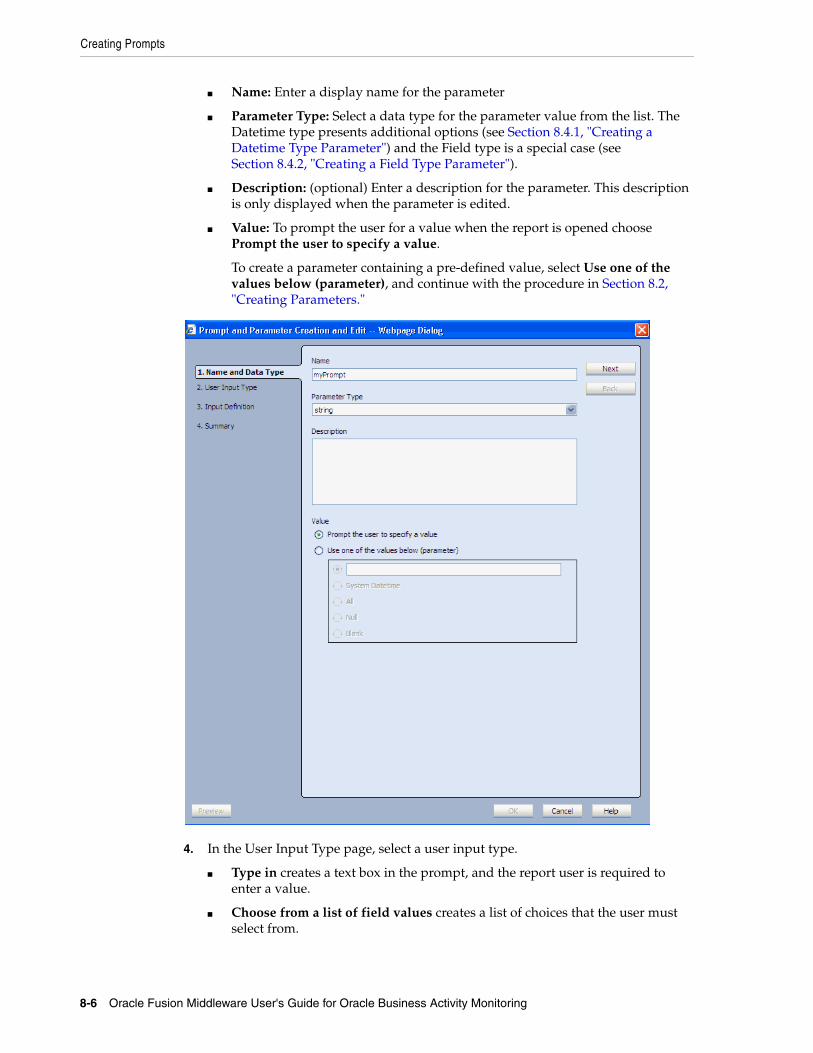
Creating Prompts
8-6 Oracle Fusion Middleware User's Guide for Oracle Business Activity Monitoring
■ Name: Enter a display name for the parameter
■ Parameter Type: Select a data type for the parameter value from the list. The Datetime type presents additional options (see Section 8.4.1, "Creating a Datetime Type Parameter") and the Field type is a special case (see Section 8.4.2, "Creating a Field Type Parameter").
■ Description: (optional) Enter a description for the parameter. This description is only displayed when the parameter is edited.
■ Value: To prompt the user for a value when the report is opened choose Prompt the user to specify a value.
To create a parameter containing a pre-defined value, select Use one of the values below (parameter), and continue with the procedure in Section 8.2, "Creating Parameters."
4. In the User Input Type page, select a user input type.
■ Type in creates a text box in the prompt, and the report user is required to enter a value.
■ Choose from a list of field values creates a list of choices that the user must select from.
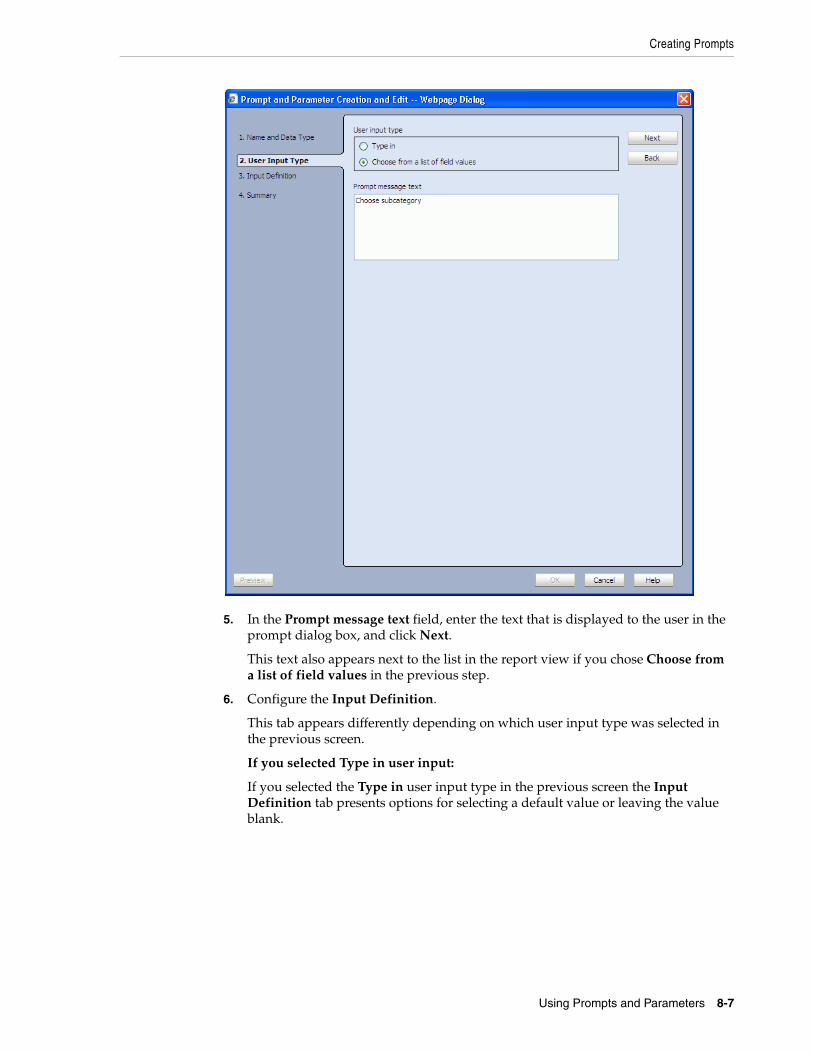
Creating Prompts
Using Prompts and Parameters 8-7
5. In the Prompt message text field, enter the text that is displayed to the user in the prompt dialog box, and click Next.
This text also appears next to the list in the report view if you chose Choose from a list of field values in the previous step.
6. Configure the Input Definition.
This tab appears differently depending on which user input type was selected in the previous screen.
If you selected Type in user input:
If you selected the Type in user input type in the previous screen the Input Definition tab presents options for selecting a default value or leaving the value blank.
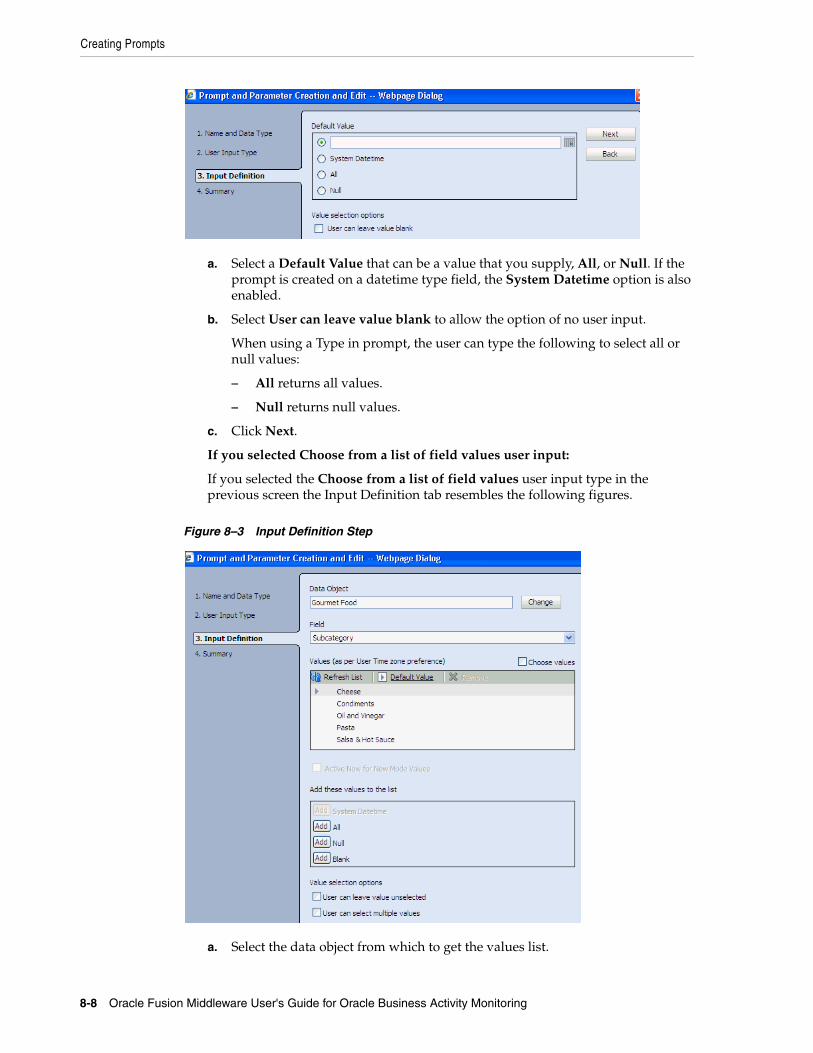
Creating Prompts
8-8 Oracle Fusion Middleware User's Guide for Oracle Business Activity Monitoring
a. Select a Default Value that can be a value that you supply, All, or Null. If the prompt is created on a datetime type field, the System Datetime option is also enabled.
b. Select User can leave value blank to allow the option of no user input.
When using a Type in prompt, the user can type the following to select all or null values:
– All returns all values.
– Null returns null values.
c. Click Next.
If you selected Choose from a list of field values user input:
If you selected the Choose from a list of field values user input type in the previous screen the Input Definition tab resembles the following figures.
Figure 8–3 Input Definition Step
a. Select the data object from which to get the values list.
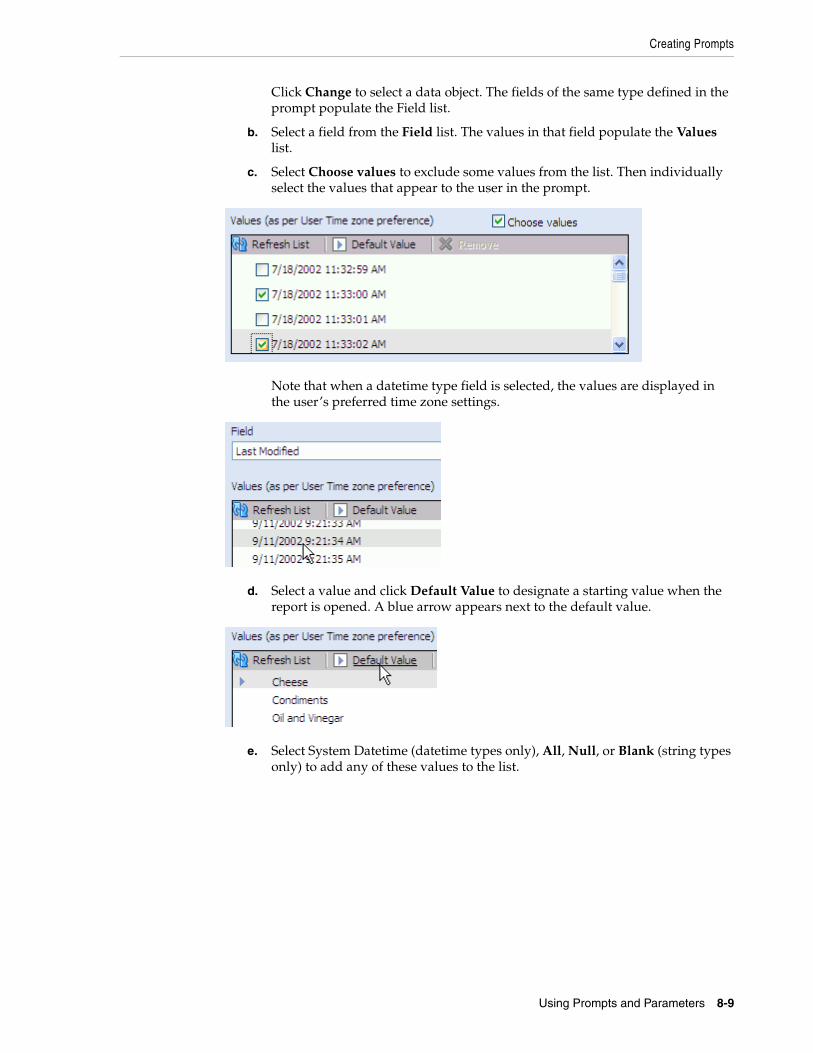
Creating Prompts
Using Prompts and Parameters 8-9
Click Change to select a data object. The fields of the same type defined in the prompt populate the Field list.
b. Select a field from the Field list. The values in that field populate the Values list.
c. Select Choose values to exclude some values from the list. Then individually select the values that appear to the user in the prompt.
Note that when a datetime type field is selected, the values are displayed in the user’s preferred time zone settings.
d. Select a value and click Default Value to designate a starting value when the report is opened. A blue arrow appears next to the default value.
e. Select System Datetime (datetime types only), All, Null, or Blank (string types only) to add any of these values to the list.
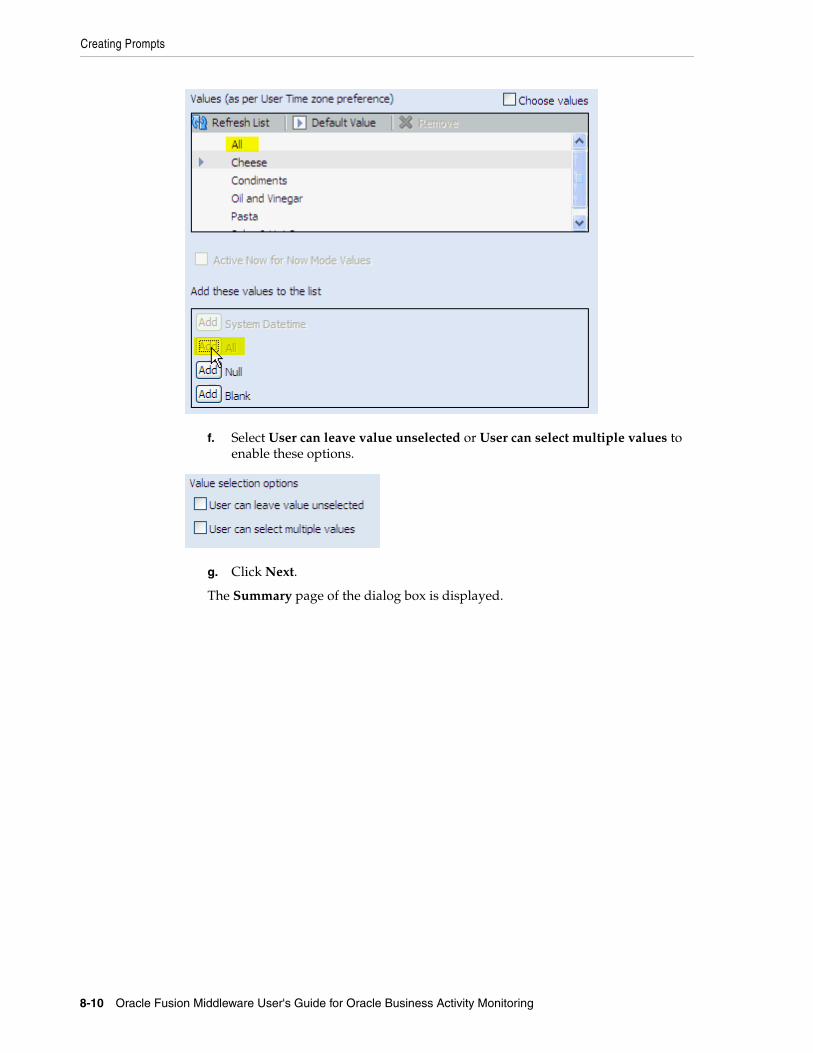
Creating Prompts
8-10 Oracle Fusion Middleware User's Guide for Oracle Business Activity Monitoring
f. Select User can leave value unselected or User can select multiple values to enable these options.
g. Click Next.
The Summary page of the dialog box is displayed.
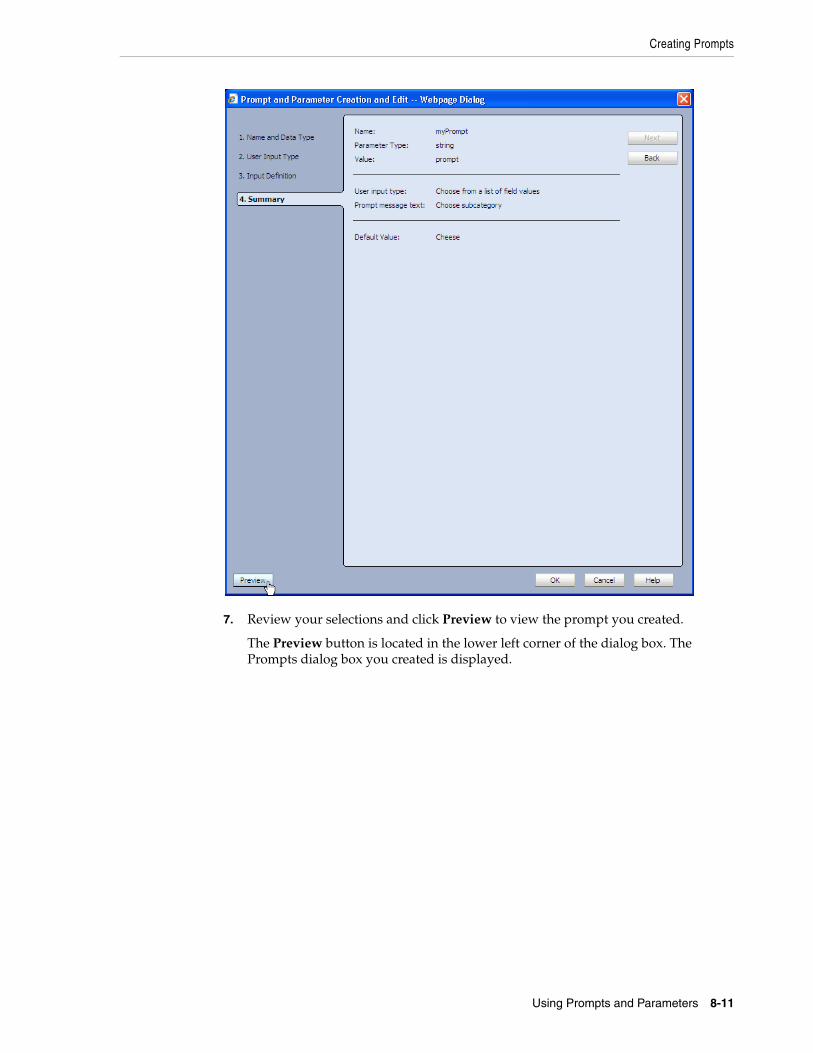
Creating Prompts
Using Prompts and Parameters 8-11
7. Review your selections and click Preview to view the prompt you created.
The Preview button is located in the lower left corner of the dialog box. The Prompts dialog box you created is displayed.
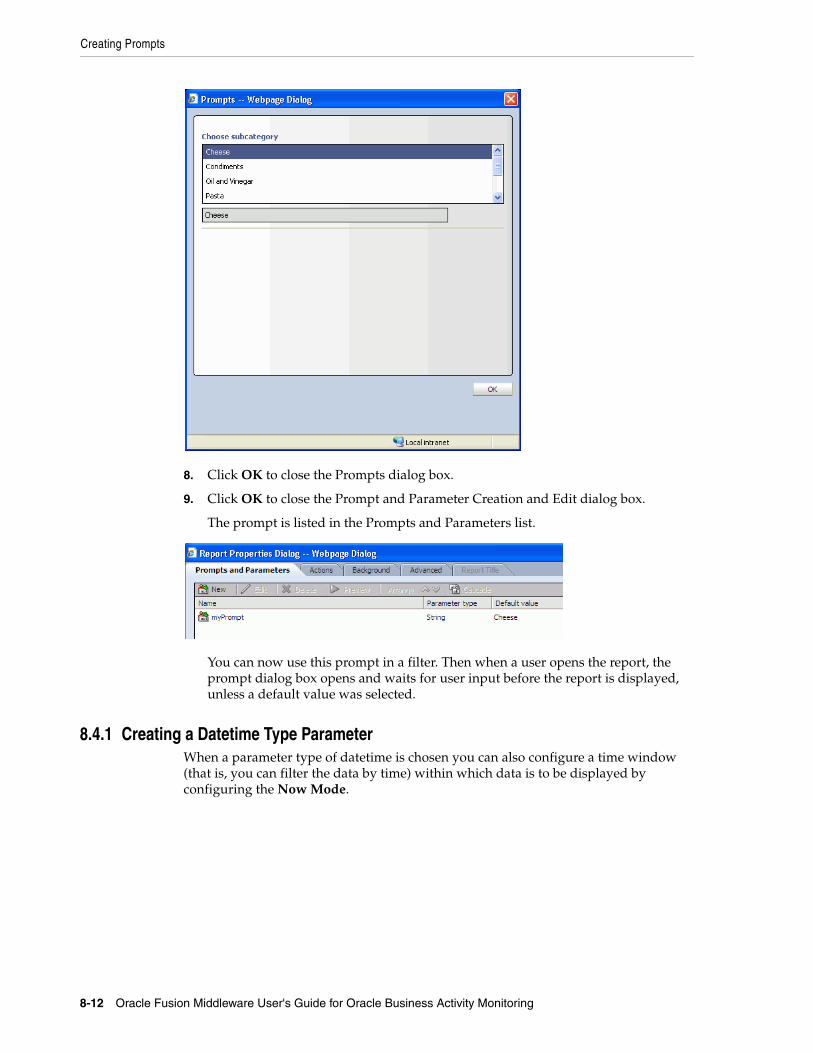
Creating Prompts
8-12 Oracle Fusion Middleware User's Guide for Oracle Business Activity Monitoring
8. Click OK to close the Prompts dialog box.
9. Click OK to close the Prompt and Parameter Creation and Edit dialog box.
The prompt is listed in the Prompts and Parameters list.
You can now use this prompt in a filter. Then when a user opens the report, the prompt dialog box opens and waits for user input before the report is displayed, unless a default value was selected.
8.4.1 Creating a Datetime Type ParameterWhen a parameter type of datetime is chosen you can also configure a time window (that is, you can filter the data by time) within which data is to be displayed by configuring the Now Mode.
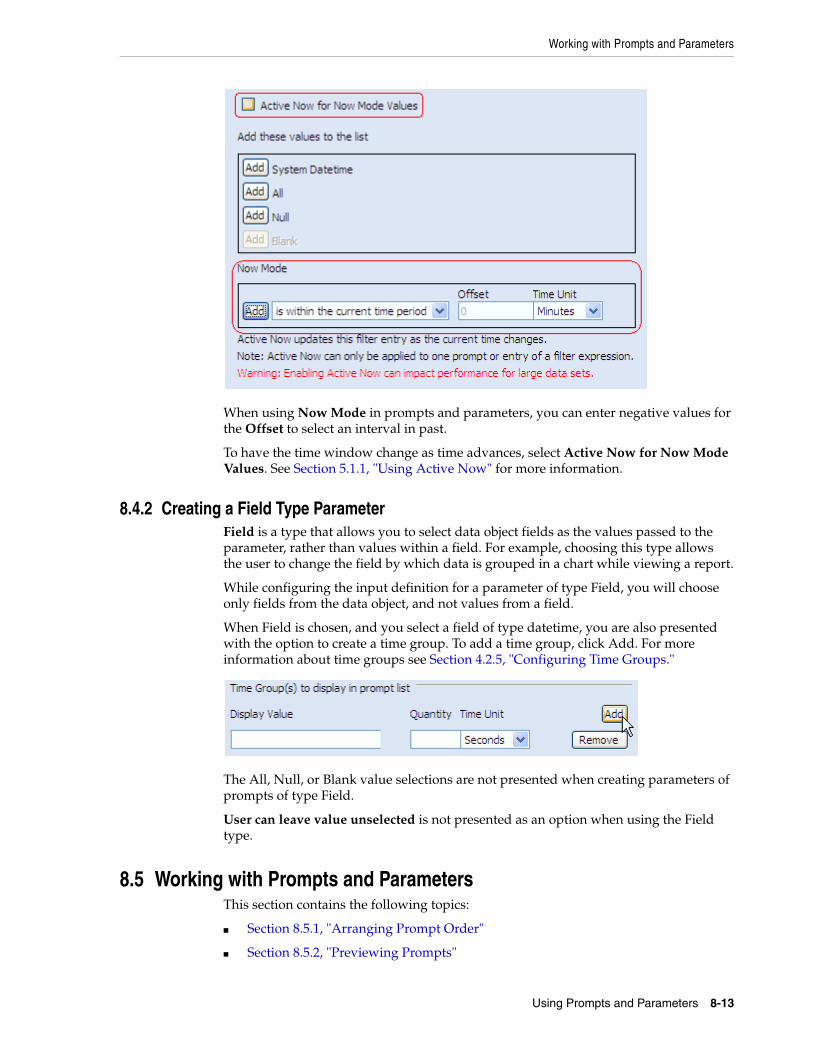
Working with Prompts and Parameters
Using Prompts and Parameters 8-13
When using Now Mode in prompts and parameters, you can enter negative values for the Offset to select an interval in past.
To have the time window change as time advances, select Active Now for Now Mode Values. See Section 5.1.1, "Using Active Now" for more information.
8.4.2 Creating a Field Type ParameterField is a type that allows you to select data object fields as the values passed to the parameter, rather than values within a field. For example, choosing this type allows the user to change the field by which data is grouped in a chart while viewing a report.
While configuring the input definition for a parameter of type Field, you will choose only fields from the data object, and not values from a field.
When Field is chosen, and you select a field of type datetime, you are also presented with the option to create a time group. To add a time group, click Add. For more information about time groups see Section 4.2.5, "Configuring Time Groups."
The All, Null, or Blank value selections are not presented when creating parameters of prompts of type Field.
User can leave value unselected is not presented as an option when using the Field type.
8.5 Working with Prompts and ParametersThis section contains the following topics:
■ Section 8.5.1, "Arranging Prompt Order"
■ Section 8.5.2, "Previewing Prompts"
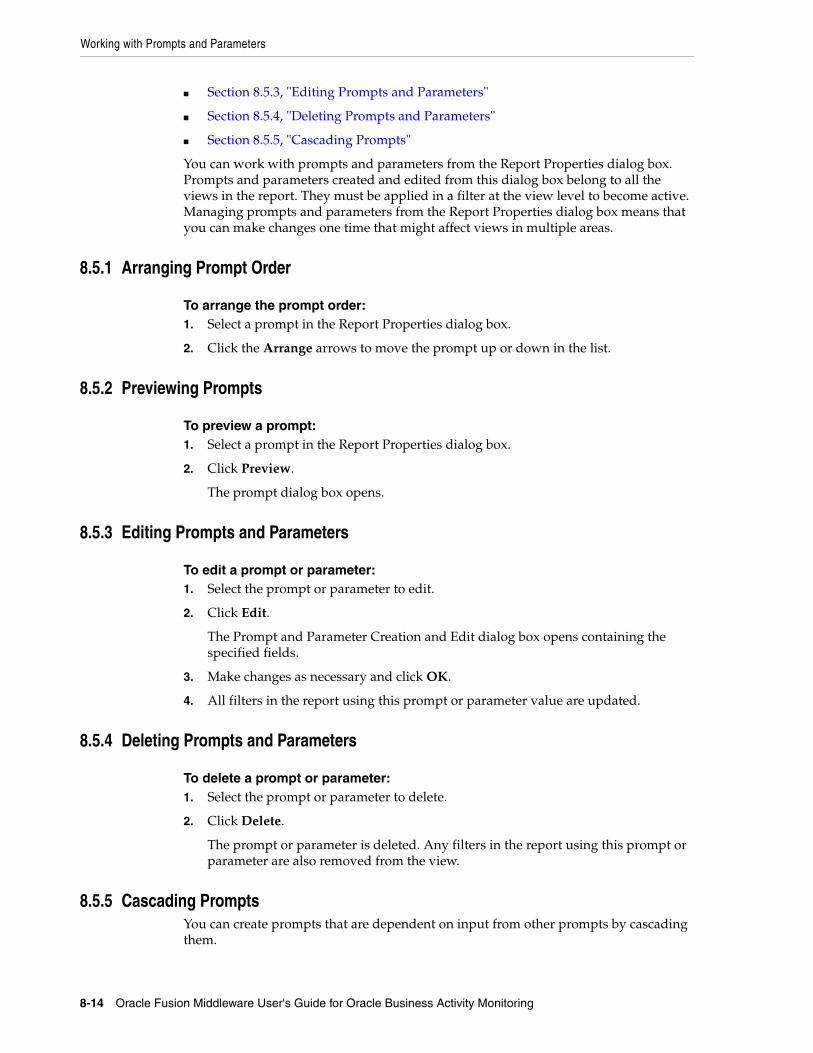
Working with Prompts and Parameters
8-14 Oracle Fusion Middleware User's Guide for Oracle Business Activity Monitoring
■ Section 8.5.3, "Editing Prompts and Parameters"
■ Section 8.5.4, "Deleting Prompts and Parameters"
■ Section 8.5.5, "Cascading Prompts"
You can work with prompts and parameters from the Report Properties dialog box. Prompts and parameters created and edited from this dialog box belong to all the views in the report. They must be applied in a filter at the view level to become active. Managing prompts and parameters from the Report Properties dialog box means that you can make changes one time that might affect views in multiple areas.
8.5.1 Arranging Prompt Order
To arrange the prompt order:1. Select a prompt in the Report Properties dialog box.
2. Click the Arrange arrows to move the prompt up or down in the list.
8.5.2 Previewing Prompts
To preview a prompt:1. Select a prompt in the Report Properties dialog box.
2. Click Preview.
The prompt dialog box opens.
8.5.3 Editing Prompts and Parameters
To edit a prompt or parameter:1. Select the prompt or parameter to edit.
2. Click Edit.
The Prompt and Parameter Creation and Edit dialog box opens containing the specified fields.
3. Make changes as necessary and click OK.
4. All filters in the report using this prompt or parameter value are updated.
8.5.4 Deleting Prompts and Parameters
To delete a prompt or parameter:1. Select the prompt or parameter to delete.
2. Click Delete.
The prompt or parameter is deleted. Any filters in the report using this prompt or parameter are also removed from the view.
8.5.5 Cascading PromptsYou can create prompts that are dependent on input from other prompts by cascading them.
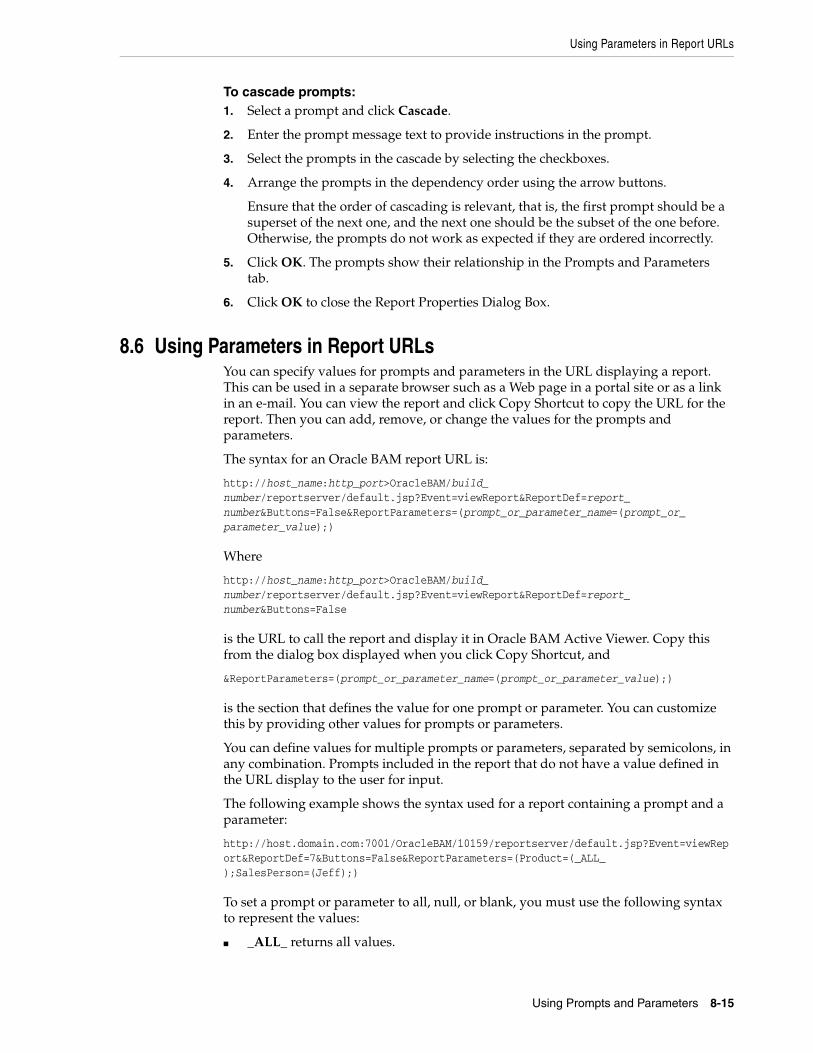
Using Parameters in Report URLs
Using Prompts and Parameters 8-15
To cascade prompts:1. Select a prompt and click Cascade.
2. Enter the prompt message text to provide instructions in the prompt.
3. Select the prompts in the cascade by selecting the checkboxes.
4. Arrange the prompts in the dependency order using the arrow buttons.
Ensure that the order of cascading is relevant, that is, the first prompt should be a superset of the next one, and the next one should be the subset of the one before. Otherwise, the prompts do not work as expected if they are ordered incorrectly.
5. Click OK. The prompts show their relationship in the Prompts and Parameters tab.
6. Click OK to close the Report Properties Dialog Box.
8.6 Using Parameters in Report URLsYou can specify values for prompts and parameters in the URL displaying a report. This can be used in a separate browser such as a Web page in a portal site or as a link in an e-mail. You can view the report and click Copy Shortcut to copy the URL for the report. Then you can add, remove, or change the values for the prompts and parameters.
The syntax for an Oracle BAM report URL is:
http://host_name:http_port>OracleBAM/build_number/reportserver/default.jsp?Event=viewReport&ReportDef=report_number&Buttons=False&ReportParameters=(prompt_or_parameter_name=(prompt_or_parameter_value);)
Where
http://host_name:http_port>OracleBAM/build_number/reportserver/default.jsp?Event=viewReport&ReportDef=report_number&Buttons=False
is the URL to call the report and display it in Oracle BAM Active Viewer. Copy this from the dialog box displayed when you click Copy Shortcut, and
&ReportParameters=(prompt_or_parameter_name=(prompt_or_parameter_value);)
is the section that defines the value for one prompt or parameter. You can customize this by providing other values for prompts or parameters.
You can define values for multiple prompts or parameters, separated by semicolons, in any combination. Prompts included in the report that do not have a value defined in the URL display to the user for input.
The following example shows the syntax used for a report containing a prompt and a parameter:
http://host.domain.com:7001/OracleBAM/10159/reportserver/default.jsp?Event=viewReport&ReportDef=7&Buttons=False&ReportParameters=(Product=(_ALL_);SalesPerson=(Jeff);)
To set a prompt or parameter to all, null, or blank, you must use the following syntax to represent the values:
■ _ALL_ returns all values.
Driving Prompts and Parameters from Other Views
8-16 Oracle Fusion Middleware User's Guide for Oracle Business Activity Monitoring
■ _NULL_ returns null values.
■ _BLANK_ returns blank values.
8.7 Driving Prompts and Parameters from Other ViewsThis section contains the following topics:
■ Section 8.7.1, "Configuring Driving"
■ Section 8.7.2, "A Driving Example"
Changing a view by making a selection in another view is called Driving. Driving enables you to use a selection in one view to drive a prompt or parameter in another view. For example you might use a column in a List view to drive a Bar Chart view showing a graphical view of a subset of the data in the list.
To drive a view it must have a prompt or parameter that is used in a filter in the view (Action Form views do not have filters, so you only need to configure a parameter to use driving on an Action Form view) Also, drilling must not be enabled for driving to work. Drilling overrides driving.
The view that drives the other views, the Driver, is not required to contain a prompt or parameter, but there is some configuration involved.
Driving is available in all List and Crosstab views.
8.7.1 Configuring Driving
To configure driving:1. Create a parameter or prompt and use it in a filter in the target chart.
2. Edit the driver view. The driver view is the view that is passing the value to the target view's prompt or parameter.
Click the Properties button in the View Editor. To open the View Editor, double-click the view you are editing, or click Edit view in the View Tasks/Options list.
3. Select the Driving tab.
4. Select the prompt or parameter you created in step 1 for any column of data you want to use to drive views that are using that prompt or parameter in a filter.
5. To enable driving on several values select the Turn Multi-select On checkbox.
Multi-select enables you to select several values in a column. Multi-select only works if you have a prompt that enables multiple values configured in the view it drives.
6. Click Apply or OK.
8.7.2 A Driving ExampleThe following is an example of driving a chart from a list view. This example uses the Call Center data object.
Step 1: Create a report with Streaming List and 3D Bar Chart views1. In Oracle BAM Active Studio, select the Home, My Reports, or Shared Reports
tab.
Driving Prompts and Parameters from Other Views
Using Prompts and Parameters 8-17
2. Click Create a New Report.
3. Select a tiled report template with two view areas.
4. In the top view area select the Streaming List view.
The View Editor opens.
5. In the View Editor, open the Samples folder and select the Call Center data object.
6. Click Next.
7. In the Data Fields selection screen, select all of the fields, and click Next.
8. Click Finish.
9. In the bottom view area select the 3D Bar Chart view.
The View Editor opens.
10. In the View Editor, open the Samples folder and select the Call Center data object.
11. Click Next.
12. Select Description in the Group By list.
13. Select Quantity in the Chart Values list.
14. Verify that Sum is selected in the Summary Function list.
15. Click Next and click Finish.
Step 2: Create a filter with a prompt in the 3D Bar Chart view1. In the report, select the 3D Bar Chart view, and click Edit view in the View
Tasks/Options list.
The View Editor opens.
2. Select the Filter tab.
3. Click add new entry.
4. Select Salesperson from the field list.
5. Select is equal to from the Comparison list.
6. Select Value.
7. Click Options and select *New Parameter/Prompt.
The Prompt and Parameter Creation and Edit dialog box opens.
8. Enter Salesperson in the Name field and click Next.
9. Enter Select a salesperson in the Prompt message text box and click Next.
10. Select Salesperson from the Field list.
11. Select the ALL checkbox.
12. Select ALL in the Values list and click Default Value.
An arrow appears next to the ALL value in the list.
13. Select User can select multiple values and click Next.
14. Click OK.
The Prompt and Parameter Creation and Edit dialog box closes and the prompt expression appears in the Value field.
Driving Prompts and Parameters from Other Views
8-18 Oracle Fusion Middleware User's Guide for Oracle Business Activity Monitoring
15. Click add entry in the Filter tab.
16. Click OK in the View Editor.
The Prompts dialog box opens.
17. Click OK.
The 3D Bar Chart shows the quantity of each product description sold by all of the salespersons in the data object.
Step 3: Configure Driving in the Streaming List view1. In the report, select the Streaming List view, and click Edit view in the View
Tasks/Options list.
The View Editor opens.
2. Click the Properties icon in the View Editor.
3. Select the Driving tab.
4. In the Map Fields to Prompts/Parameters list, select Salesperson in the list next to Salesperson.
5. Click OK.
The View Editor closes.
Step 4: Save the report and test the driving1. Click Save Report in the Actions list.
The Save a Report dialog box opens.
2. Select a name and location for the report and click OK.
3. Click View in the Actions list.
The prompt dialog box opens.
4. Click OK.
5. When the report is loaded, select Sue from the Salesperson column in the Streaming List view.
The text color in the selected row changes so that you can see which Salesperson was selected. The bars in the Bar Chart view change to display the quantity of each product description sold by Sue.
Step 5: Configure Multi-selectMulti-select enables you to select several rows in a list to drive the chart. Multi-select only works if you configured the prompt to allow the user select multiple values as described in "Step 2: Create a filter with a prompt in the 3D Bar Chart view".
1. Edit the Streaming List view.
2. Select the Driving tab in the View Editor.
3. Select Turn Multi-select On and click OK.
4. Save the report and view it.
5. When the report is loaded, select Sue from the Salesperson column in the Streaming List view.
The text color in the selected row changes so that you can see which Salesperson was selected.
Driving Prompts and Parameters from Other Views
Using Prompts and Parameters 8-19
6. Select Mary from the Salesperson column in the Streaming List view.
The text in Sue's row stays colored, and the text in Mary's row is colored also. The 3D Bar Chart shows the quantity of each product description sold by both Sue and Mary.
7. Select Mary again from the Salesperson column in the Streaming List view. The text color change is reversed, and the 3D Bar Chart shows Sue's sales only.

Driving Prompts and Parameters from Other Views
8-20 Oracle Fusion Middleware User's Guide for Oracle Business Activity Monitoring
9
Using Action Buttons 9-1
9Using Action Buttons
This chapter describes how to add and use Action Buttons in reports that you create in Oracle Business Activity Monitoring (Oracle BAM) Active Studio, to allow report users to take some action with selected data in the reports.
This chapter contains the following topics:
■ Section 9.1, "About Action Buttons"
■ Section 9.2, "Creating Action Buttons"
9.1 About Action ButtonsAction Buttons let you manually take some action on data in a report. Action Buttons can take data from an Action List or an Action Form to execute a read/write action on data input or selections from that action list or form. Action Buttons can also invoke actions without any data inputs if they are defined without reference to an Action List or Action Form.
Action Buttons can appear in any report, but some actions can be defined only in the Action List view. In order to do some action with the selected data in an Action List or Action Form you must create Action Buttons.
9.2 Creating Action ButtonsThis section provides information about creating Action Buttons. It contains the following topics:
■ Section 9.2.1, "Creating Action Buttons"
■ Section 9.2.2, "Configuring Insert Action Types"
■ Section 9.2.3, "Configuring Constant Value Update Action Types"
■ Section 9.2.4, "Configuring Edit Column Update Action Types"
■ Section 9.2.5, "Configuring Delete Action Types"
■ Section 9.2.6, "Configuring Open a URL Action Types"
■ Section 9.2.7, "Configuring View a Report Action Types"
■ Section 9.2.8, "Configuring Reset a Form Action Types"
■ Section 9.2.9, "Configuring Refresh a View Action Types"
■ Section 9.2.10, "Configuring Show a Confirmation Message Action Types"
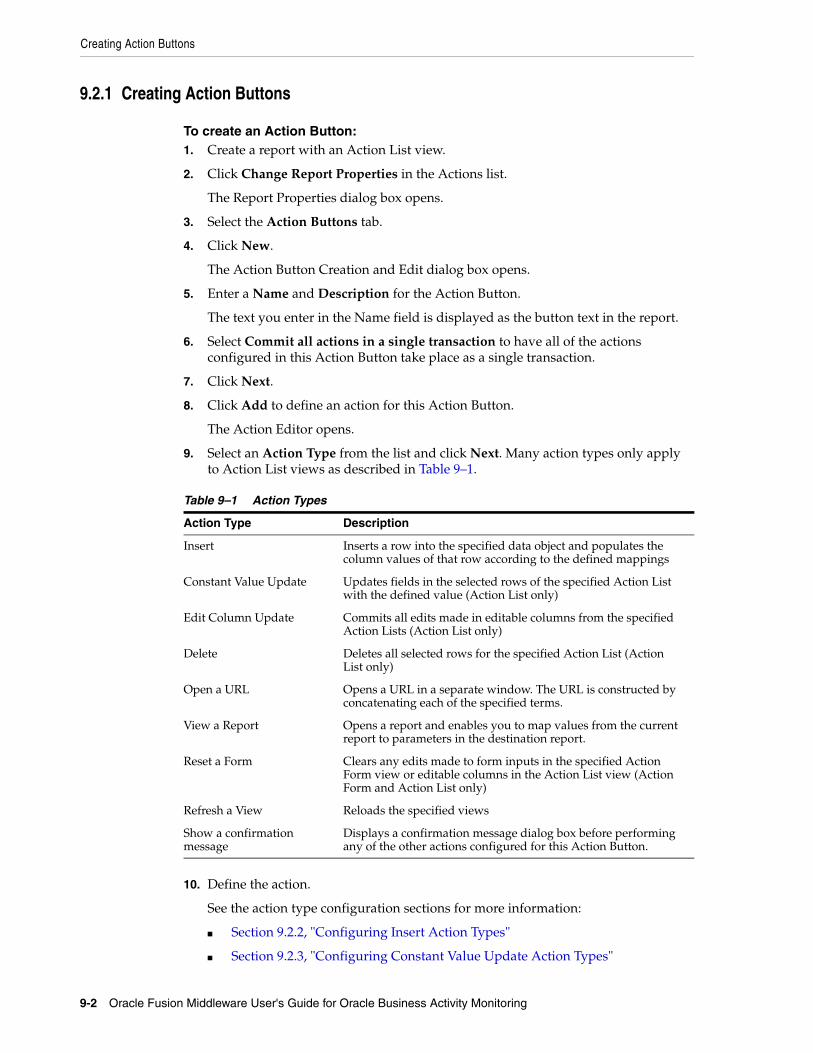
Creating Action Buttons
9-2 Oracle Fusion Middleware User's Guide for Oracle Business Activity Monitoring
9.2.1 Creating Action Buttons
To create an Action Button:1. Create a report with an Action List view.
2. Click Change Report Properties in the Actions list.
The Report Properties dialog box opens.
3. Select the Action Buttons tab.
4. Click New.
The Action Button Creation and Edit dialog box opens.
5. Enter a Name and Description for the Action Button.
The text you enter in the Name field is displayed as the button text in the report.
6. Select Commit all actions in a single transaction to have all of the actions configured in this Action Button take place as a single transaction.
7. Click Next.
8. Click Add to define an action for this Action Button.
The Action Editor opens.
9. Select an Action Type from the list and click Next. Many action types only apply to Action List views as described in Table 9–1.
10. Define the action.
See the action type configuration sections for more information:
■ Section 9.2.2, "Configuring Insert Action Types"
■ Section 9.2.3, "Configuring Constant Value Update Action Types"
Table 9–1 Action Types
Action Type Description
Insert Inserts a row into the specified data object and populates the column values of that row according to the defined mappings
Constant Value Update Updates fields in the selected rows of the specified Action List with the defined value (Action List only)
Edit Column Update Commits all edits made in editable columns from the specified Action Lists (Action List only)
Delete Deletes all selected rows for the specified Action List (Action List only)
Open a URL Opens a URL in a separate window. The URL is constructed by concatenating each of the specified terms.
View a Report Opens a report and enables you to map values from the current report to parameters in the destination report.
Reset a Form Clears any edits made to form inputs in the specified Action Form view or editable columns in the Action List view (Action Form and Action List only)
Refresh a View Reloads the specified views
Show a confirmation message
Displays a confirmation message dialog box before performing any of the other actions configured for this Action Button.
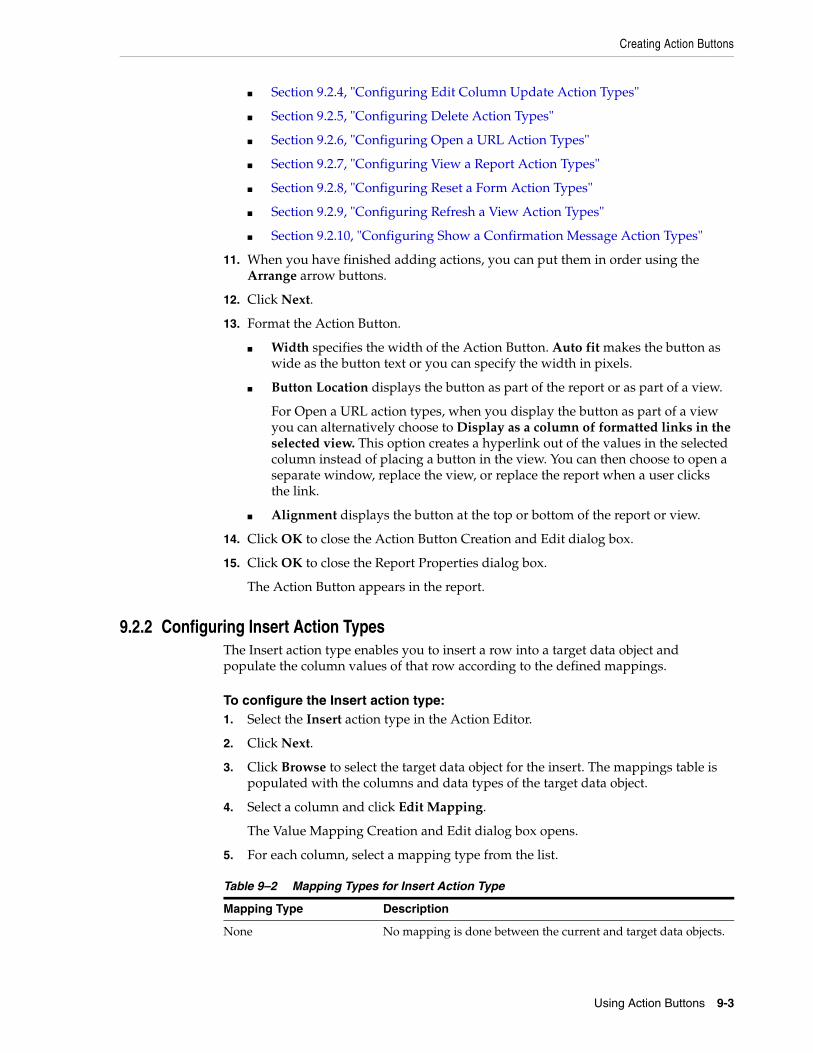
Creating Action Buttons
Using Action Buttons 9-3
■ Section 9.2.4, "Configuring Edit Column Update Action Types"
■ Section 9.2.5, "Configuring Delete Action Types"
■ Section 9.2.6, "Configuring Open a URL Action Types"
■ Section 9.2.7, "Configuring View a Report Action Types"
■ Section 9.2.8, "Configuring Reset a Form Action Types"
■ Section 9.2.9, "Configuring Refresh a View Action Types"
■ Section 9.2.10, "Configuring Show a Confirmation Message Action Types"
11. When you have finished adding actions, you can put them in order using the Arrange arrow buttons.
12. Click Next.
13. Format the Action Button.
■ Width specifies the width of the Action Button. Auto fit makes the button as wide as the button text or you can specify the width in pixels.
■ Button Location displays the button as part of the report or as part of a view.
For Open a URL action types, when you display the button as part of a view you can alternatively choose to Display as a column of formatted links in the selected view. This option creates a hyperlink out of the values in the selected column instead of placing a button in the view. You can then choose to open a separate window, replace the view, or replace the report when a user clicks the link.
■ Alignment displays the button at the top or bottom of the report or view.
14. Click OK to close the Action Button Creation and Edit dialog box.
15. Click OK to close the Report Properties dialog box.
The Action Button appears in the report.
9.2.2 Configuring Insert Action TypesThe Insert action type enables you to insert a row into a target data object and populate the column values of that row according to the defined mappings.
To configure the Insert action type:1. Select the Insert action type in the Action Editor.
2. Click Next.
3. Click Browse to select the target data object for the insert. The mappings table is populated with the columns and data types of the target data object.
4. Select a column and click Edit Mapping.
The Value Mapping Creation and Edit dialog box opens.
5. For each column, select a mapping type from the list.
Table 9–2 Mapping Types for Insert Action Type
Mapping Type Description
None No mapping is done between the current and target data objects.
Creating Action Buttons
9-4 Oracle Fusion Middleware User's Guide for Oracle Business Activity Monitoring
To populate the inserted row in the target data object with values, each column can be mapped to a different source of data.
If a column is mapped to None, null is inserted for that column. If the column is non-nullable, the default value for the data type is used. For example, if there is no mapping specified for a non-nullable integer column, zero (0) is inserted. String is the only data type that does not have a default value. Therefore, if you attempt to insert null into a non-nullable string column, the action fails.
6. Click Next.
7. Enter the definition for the type you selected.
8. Click OK to close the Value Mapping Creation and Edit dialog box.
9. Edit the mappings for any of the other columns.
10. Click OK to close the Action Editor.
9.2.3 Configuring Constant Value Update Action TypesThe Constant Value Update action type enables you to update fields in the selected rows of the specified Action List with a specified value. This action type is used in Action List views only.
Constant Value A constant value is inserted in the target data object. The specified value is validated against the data type of the column populated by this mapping. If you specify a string value for an integer column, an error message occurs.
Prompt/Parameter The value held by the prompt or parameter is used as the value to insert in the target data object. It always retrieves the current value of a prompt or parameter even if it is changed by driving or surface prompts. To use this option the report must contain a prompt or parameter which is assigned to a filter in a view, or a custom parameter must be created in Server BAM Architect. See Chapter 8 for more information.
Client Cookie Maps the value of a cookie that resides on the client where this report is viewed.
Unique button click ID Maps a unique ID number (randomly generated) to the target field.
Value from an ActionList view
A value from the selected rows in an Action List is inserted into the target data object. The Insert a separate row for each into the Destination Data Object option causes there to be multiple result sets. In the Insert action type this results in multiple rows inserted in the target data object.
A special case arises when there are multiple Value from an ActionList view mappings used in a single Action Button, and if more than one of those mappings have the Insert a separate row option selected. For example, if there are two rows selected in one Action List and three rows selected in another Action List, it results in 6 rows inserted into the target data object.
Value from an ActionForm view
A value from the selected input field in an Action Form is inserted into the target data object. Any inputs that have an rtsEnabledID attribute in the HTML is represented in the list of values.
Table 9–2 (Cont.) Mapping Types for Insert Action Type
Mapping Type Description
Creating Action Buttons
Using Action Buttons 9-5
To configure the Constant Value Update action type:1. Select the Constant Value Update action type in the Action Editor.
2. Click Next.
3. Select an Action List view.
4. Select a field in the Column list and enter a value in the Value field. Select Null if you want the value to be null.
5. Click OK to close the Action Editor.
9.2.4 Configuring Edit Column Update Action TypesThe Edit Column Update action type commits all edits made in editable columns from the specified Action Lists. The user does not have to select the checkboxes to specify which rows should be updated. This action type is used in Action List views only.
To configure the Edit Column Update action type:1. Select the Edit Column Update action type in the Action Editor.
2. Click Next.
3. Select one or more Action List views with editable columns.
4. Click OK to close the Action Editor.
9.2.5 Configuring Delete Action TypesThe Delete action type deletes all selected rows in the specified Action List. This action type is used in Action List views only.
To configure the Delete action type:1. Select the Delete action type in the Action Editor.
2. Click Next.
3. Select one or more Action List views.
If only one Action List is selected, and there are no other actions defined for the Action Button, you are given the choice to display the Action Button either as a regular button or a trashcan icon in the final step of the Action Button Creation and Edit dialog box.
4. Click OK to close the Action Editor.
9.2.6 Configuring Open a URL Action TypesThe Open a URL action type opens a URL in a separate window. The URL is constructed by concatenating each of the specified terms.
To open a report URL, you should use the View a Report action described in Section 9.2.7, "Configuring View a Report Action Types."
To configure the Open a URL action type:1. Select the Open a URL action type in the Action Editor.
2. Click Next.
3. Click New Term.
The Value Mapping Creation and Edit dialog box opens.
Creating Action Buttons
9-6 Oracle Fusion Middleware User's Guide for Oracle Business Activity Monitoring
4. Choose a mapping type to create a term.
5. Click Next.
6. Enter the definition for the type you selected.
7. Click OK to close the Value Mapping Creation and Edit dialog box.
8. Select the Encode checkbox to encode the term.
9. Create more terms if necessary.
10. Select Click here to edit window features to change the browser window properties if necessary.
11. Enter a maximum number of windows to open.
When you use the Value from an Action List view mapping type and the user selects multiple rows in the list, you can open a separate URL for every checked row in the Action List. The maximum specified here limits the total number of windows that can be opened simultaneously. Opening too many windows simultaneously can cause the client system to malfunction.
12. Arrange the terms in the correct order using the Arrange arrow buttons.
13. Click OK to close the Action Editor.
9.2.7 Configuring View a Report Action TypesThe View a Report action type opens a report and enables you to map values from the current report to parameters in the destination report.
To configure the View a Report action type:1. Select the View a Report action type in the Action Editor.
Table 9–3 Mapping Types for Open a URL Action Type
Mapping Type Description
Constant Value A constant value is inserted in the target data object. The specified value is validated against the data type of the column populated by this mapping. If you specify a string value for an integer column, an error message occurs.
Prompt/Parameter The value held by the prompt or parameter is used as the value to insert in the target data object. It always retrieves the current value of a prompt or parameter even if it is changed by driving or surface prompts. To use this option the report must contain a prompt or parameter which is assigned to a filter in a view, or a custom parameter must be created in Server BAM Architect. See Chapter 8 for more information.
Client Cookie The value of a cookie that resides on the client where this report is viewed.
Unique button click ID A unique ID number (randomly generated).
Value from a List view A selected value in any List view. This is made possible when you elect to display a column as hyperlinks instead of creating a button for an action. See Section 9.2, "Creating Action Buttons", step 13. The Open a separate URL for each selected row option results in multiple URLs opened in separate browser windows.
Value from an Action Form view
The value of the selected input field. Any inputs that have an rtsEnabledID attribute in the HTML is represented in the list of values.
Creating Action Buttons
Using Action Buttons 9-7
2. Click Next.
3. Click Browse to select the target report to open.
4. Define mappings for each parameter in the target report.
5. Select a parameter or prompt in the parameter column.
6. Click Edit Mapping. The Value Mapping Creation and Edit dialog box opens.
7. Select a mapping type from the list
8. Click Next.
9. Enter the definition for the type you selected.
10. Click OK to close the Value Mapping Creation and Edit dialog box.
11. Edit the mappings for any of the other parameters.
12. Select Click here to edit window features to change the browser window properties if necessary. This is the browser window that the target report opens in.
13. Enter a maximum number of browser windows that can open.
14. Click OK to close the Action Editor.
9.2.8 Configuring Reset a Form Action TypesThe Reset a Form action type clears any edits made to form inputs in the specified Action Form view or editable columns in the Action List view.
To configure the Reset a Form action type:1. Select the Reset a Form action type in the Action Editor.
2. Click Next.
Table 9–4 Mapping Types for View a Report Action Type
Mapping Type Description
None No mapping is done.
Constant Value A constant value. The specified value is validated against the data type of the column populated by this mapping. If you specify a string value for an integer column, an error message occurs.
Prompt/Parameter The value held by the prompt or parameter is used as the value for the target parameter. It always retrieves the current value of a prompt or parameter even if it is changed by driving or surface prompts. To use this option the report must contain a prompt or parameter which is assigned to a filter in a view, or a custom parameter must be created in Server BAM Architect. See Chapter 8 for more information.
Client Cookie The value of a cookie that resides on the client where this report is viewed.
Unique button click ID A unique ID number (randomly generated).
Value from an ActionList view
A value from the selected rows in an Action List.
Value from an ActionForm view
A value from the selected input field in an Action Form. Any inputs that have an rtsEnabledID attribute in the HTML is represented in the list of values.
Creating Action Buttons
9-8 Oracle Fusion Middleware User's Guide for Oracle Business Activity Monitoring
3. Select one or more Action Form or Action List views.
4. Click OK to close the Action Editor.
9.2.9 Configuring Refresh a View Action TypesThe Refresh a view action type reloads the specified views. This action is not needed for most views because they support active data and automatically update when the data changes. This action is useful for views that do not support active data:
■ External Content. This view can display any external URL, and it might be useful to supply a refresh button in the view if the content changes.
■ Action List with editable columns. Action Lists do not support active data when one or more columns is editable, so it is useful to supply a refresh button to display any changes to the data.
To configure the Refresh a view action type:1. Select the Refresh a view action type in the Action Editor.
2. Click Next.
3. Select one or more views.
4. Click OK to close the Action Editor.
9.2.10 Configuring Show a Confirmation Message Action TypesThe Show a confirmation message action type displays a confirmation message dialog box before performing any of the other actions configured for this Action Button.
To configure the Show a confirmation message action type:1. Select the Show a confirmation message action type in the Action Editor.
2. Click Next.
3. Enter the text to display in the confirmation dialog box.
4. Click OK to close the Action Editor.
10
Organizing and Sharing Reports 10-1
10Organizing and Sharing Reports
This chapter describes how to organize reports in folders, and copy and move reports in Oracle Business Activity Monitoring (Oracle BAM) Active Studio. It also describes how to share reports and set permissions to report folders so that other users can view and access the reports.
This chapter contains the following topics:
■ Section 10.1, "Organizing Your Reports"
■ Section 10.2, "Creating New Folders"
■ Section 10.3, "Setting Folder Permissions"
■ Section 10.4, "Working with Folders"
■ Section 10.5, "Copying Reports and Folders"
■ Section 10.6, "Moving Reports and Folders"
■ Section 10.7, "Sharing Reports with Other Users"
■ Section 10.8, "Deleting Shared Reports"
10.1 Organizing Your ReportsYou can organize reports by creating folders and moving reports into folders. You can also create copies of reports and share reports with other users. When you create a folder in the Shared Reports tab, you can assign permissions by associating users and actions with the folder.
10.2 Creating New FoldersYou can create folders for organizing your reports from the My Reports tab or the Shared Reports tab. Then you can copy or move reports into separate folders for different purposes or users.
After creating folders in the Shared Reports tab, you can set folder permissions to limit which users can view the reports it contains.
To create a folder:1. Click Create a new folder in the Organize list.
A dialog box for naming the folder opens.
2. Type a name for the folder and click OK.
Setting Folder Permissions
10-2 Oracle Fusion Middleware User's Guide for Oracle Business Activity Monitoring
The folder is created as a subfolder under My Reports or Shared Reports, based on where you created it.
You can create a hierarchy of folders within folders. The full folder path including the report name is limited to 255 characters. If you have many subfolder levels and long report names, you might encounter this limit.
10.3 Setting Folder PermissionsWhen you create folders in the Shared Reports tab or move folders to the Shared Reports tab, you can set permissions on the folder so that other users can view and access the reports contained in the folder. Permissions are unlimited on folders created in Shared Reports until you apply permissions for specific users. You are not required to set permissions on folders in the My Reports tab.
To set permissions on a folder:1. In the Shared Reports tab, click the folder to set permissions on.
2. Click Folder Permissions in the Actions list.
The Folder Permissions dialog box opens.
3. Click Add user or Add group to add users or groups.
The Select Names dialog box opens.
4. Click one or more users or groups to access to this folder, and click OK.
The users are added to the list in the Folder Permissions dialog box.
5. Select a user or group and check the permissions to assign. The options include:
View. Can open and close folder, can view reports in this folder.
Create and View. Can rename folders and reports, can edit folder permissions if folder owner, can copy folder and reports to other folders, can create folders and reports and save them in this folder.
Create, View, and Delete. Can delete folders and reports in this folder, can move folders and reports to other folders.
If you have multiple users in the list, you must select each one individually and assign permissions. Different users might have different permissions on the same folder.
6. Click OK to save your changes.
Reports placed directly in Shared Reports have open permissions. Only place reports there if you want all users to see them.
To delete a user from a folder permissions list:1. In the Shared Reports tab, click the folder to change permissions on.
2. Click Folder Permissions in the Actions list.
The Folder Permissions dialog box opens.
3. Click a user and click Delete.
Note: Changes made to data object and folder permissions, and to security filters in Oracle BAM are immediate.
Copying Reports and Folders
Organizing and Sharing Reports 10-3
The user is deleted from the list.
4. Click OK to save your changes.
10.4 Working with FoldersWhen you select a folder on the My Reports tab or Shared Reports tab, the actions for working with folders display in the Actions list. You must have certain folder permissions to perform folder tasks.
To open a folder:1. Click the folder to open.
2. Click Open Folder in the Actions list. You can also double-click a folder to open it.
The folder is opened, and the contents of the folder is displayed.
Click the Folder list in the toolbar to select a folder more than one level up.
To rename a folder:1. Click the folder to rename.
2. Click Rename Folder in the Actions list.
3. Enter a name and click OK.
The folder is renamed. You must assign unique folder names within a containing folder.
To close a folder:■ Click Close Folder in the Actions list.
The current folder is closed, and the contents of the containing folder is displayed.
To delete a folder:1. Click the folder to delete.
2. Click Delete Folder in the Actions list.
The folder is deleted.
10.5 Copying Reports and FoldersYou can copy reports into other folders within My Reports or to a folder in Shared Reports. Copying reports does not move the original report. Report names in the folders you copy to must be unique. You must have certain folder permissions to perform folder tasks.
To copy a report to another folder:1. Select the report to copy in the My Reports tab or the Shared Reports tab.
2. Click Copy to in the Organize list.
A dialog box showing the folder structure opens.
3. Click a folder to copy the report to.
4. Click Copy.
A message is displayed to confirm that the report was copied.
Moving Reports and Folders
10-4 Oracle Fusion Middleware User's Guide for Oracle Business Activity Monitoring
You can copy folders into other folders in the same way.
10.6 Moving Reports and FoldersYou can move reports into other folders within My Reports or to a folder in Shared Reports. Moving reports moves the original report. Report names in the folders you move to must be unique. You must have certain folder permissions to perform folder tasks.
To move a report to another folder:1. Select the report to move in the My Reports tab or the Shared Reports tab.
2. Click Move to in the Organize list.
A dialog box showing the folder structure opens.
3. Click a folder to copy the report to.
4. Click Move.
A message opens to confirm that the report was copied.
You can move folders into other folders in the same way.
10.7 Sharing Reports with Other UsersReports that other users share with you display in folders on the Shared Reports tab. Depending on the rights assigned with the shared subfolder, you can view, create, edit, or delete shared reports.
After creating reports, you can choose users to share your reports with by moving the reports into shared subfolders and assigning users and permissions to the folder.
To share a report:1. Copy or move the report into a folder in the Shared Reports tab.
2. Assign permissions to users to have access to the folder. A user must have the permission to view the contents of the folder to see the reports it contains.
10.8 Deleting Shared ReportsYou can stop sharing reports with other users by either removing their permissions to the folder or by moving or deleting specific reports. You can also move or delete the entire folder.
When you remove folder permissions or remove shared reports or folders, any alerts that a user created based on the report in that shared location are disabled.
Note: Changes to permissions on folders and reports can take 20 minutes to propagate throughout the system.
11
Archiving and Purging Data 11-1
11Archiving and Purging Data
This chapter contains information about using Oracle Data Integrator to archive and purge data in Oracle Business Activity Monitoring (Oracle BAM).
This chapter contains the following topics:
■ Section 11.1, "Archiving Data"
■ Section 11.2, "Purging Data"
11.1 Archiving DataOracle BAM is integrated with Oracle Data Integrator which can be used to move large amounts of data into and out of the Oracle BAM schema. Use Oracle Data Integrator to extract, archive and purge data in a production environment. See Chapter 54 "Using Oracle Data Integrator With Oracle BAM" in Oracle Fusion Middleware Developer's Guide for Oracle SOA Suite for more information.
11.2 Purging DataThere are two methods by which you can purge data in Oracle BAM:
■ Manually clear the contents of the data object in Oracle BAM Architect. See "Clearing Data Objects" in Oracle Fusion Middleware Developer's Guide for Oracle SOA Suite for more information.
■ Construct an alert using the Delete rows from a Data Object action. See "Delete rows from a Data Object" in Oracle Fusion Middleware Developer's Guide for Oracle SOA Suite for information about using this alert action. For general information about creating alerts see "Creating Oracle BAM Alerts in Oracle Fusion Middleware Developer's Guide for Oracle SOA Suite.

Purging Data
11-2 Oracle Fusion Middleware User's Guide for Oracle Business Activity Monitoring
A
Calculation Operators and Expressions A-1
ACalculation Operators and Expressions
This appendix provides examples and the syntax for operators and expressions you can use in calculations when creating calculated fields in a data object or report view in Oracle Business Activity Monitoring (Oracle BAM) Active Studio.
This appendix contains the following topics:
■ Calculation Operators
■ Avg
■ Ceiling
■ Concat
■ Count
■ CountDistinct
■ DateAdd
■ DayName
■ DayOfMonth
■ DayOfWeek
■ DayOfYear
■ Floor
■ Hour
■ If
■ IfNull
■ Length
■ Lower
■ Max
■ Min
■ Minute
■ Month
■ MonthName
■ Now
■ PercentOfTotal
■ Power
Calculation Operators
A-2 Oracle Fusion Middleware User's Guide for Oracle Business Activity Monitoring
■ Quarter
■ Repeat
■ Replace
■ Round
■ Second
■ Substring
■ Sum
■ Switch
■ TrimEnd
■ TrimStart
■ Upper
■ Week
■ Year
A.1 Calculation Operators
Field names containing any special characters, such as the operators listed in Table A–1 double quotation marks, or spaces, must be surrounded with curly braces {}. If field names contain only numbers, letters and underscores and begin with a letter or underscore they do not need curly braces. For example, if the field name is Sales, the correct way to enter this in a calculation is Sales. However, if the field name is Sales+Costs, the correct way to enter this in a calculation is {Sales+Costs}.
Double quotes must be escaped with another set of double quotes if used inside double quotes. For example, Length("""Hello World, "" I said").
A.2 AvgReturns the average of all values for the given field. Avg can accept one field parameter of type Integer, Float, or Decimal.
Table A–1 Operators Used in Calculated Fields
Operator Function
+ (plus sign) Add
- (minus sign) Subtract
* (asterisk) Multiply
/ (slash) Divide
% (percent sign) Modulus
() (parentheses) Parentheses determine the order of operations
&& (double ampersand) Logical AND
! (exclamation point) Logical NOT
|| (double pipe) Logical OR
== (double equal sign) Equality
Count
Calculation Operators and Expressions A-3
Syntax:
Avg(Number)
Example:
Avg(Revenue)
A.3 CeilingReturns the smallest integer greater than or equal to the specified value. Ceiling(2.9) returns 3 and Ceiling(-2.3) returns -2. Ceiling can accept one field parameter of type Integer, Float, or Decimal or a numeric value may be entered.
Syntax:
Ceiling(Number)
Examples:
Ceiling(Total)Ceiling(3.7)
A.4 ConcatConcatenates several strings into one. Concat can accept multiple field parameters of type String, or string values may be entered.
Syntax:
Concat(String1,String2, ... ,StringN)
This example uses Concat with If (see Section A.14, "If") on strings of HTML to load images in a calculated HTML field (see Section 5.4.1, "Using HTML in Calculations" for more information):
If ({Excess Capacity} > 16) Then (Concat ("<img src='../Images/round_green16px.gif' alt='",
{Excess Capacity},"' />"))Else (If ({Excess Capacity} < 1) Then
(Concat("<img src='../Images/round_red16px.gif' alt='",{Excess Capacity},"' />"))
Else (Concat("<img src='../Images/round_amber16px.gif' alt='",{Excess Capacity},"' />")))
A.5 CountReturns a count of all non-null values. Count can accept one field parameter of any type.
Syntax:
Count(Field)
Example:
Count(SaleComplete)
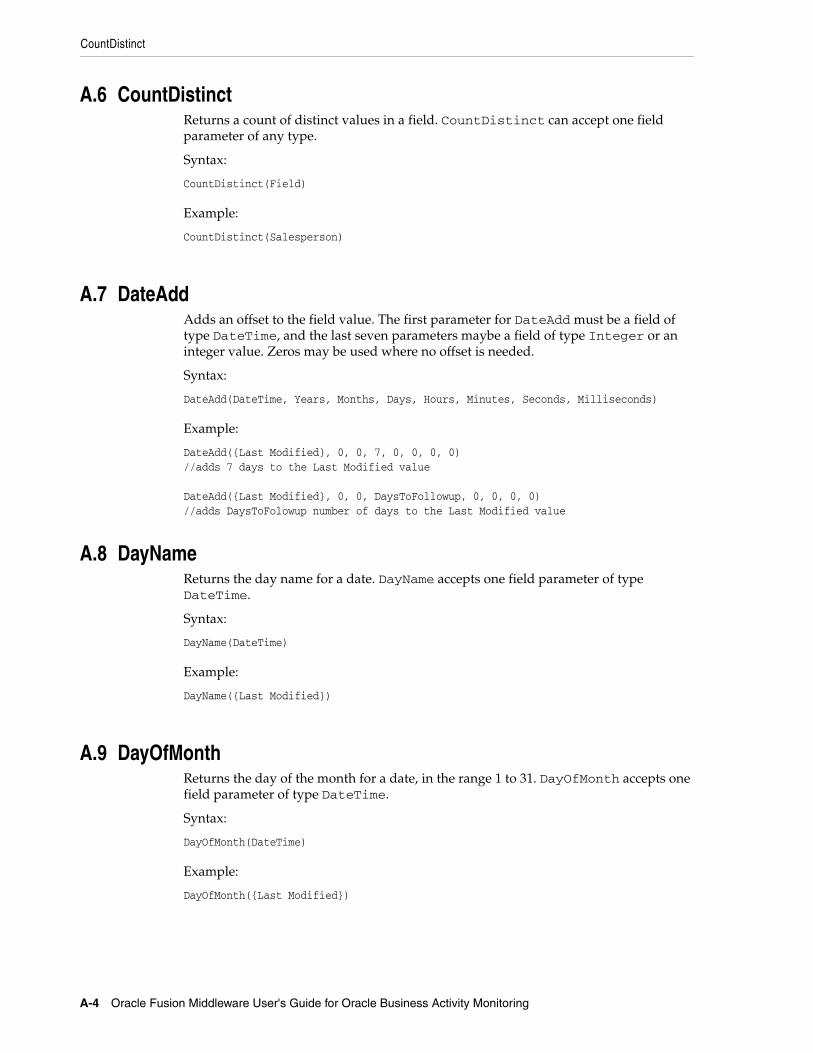
CountDistinct
A-4 Oracle Fusion Middleware User's Guide for Oracle Business Activity Monitoring
A.6 CountDistinctReturns a count of distinct values in a field. CountDistinct can accept one field parameter of any type.
Syntax:
CountDistinct(Field)
Example:
CountDistinct(Salesperson)
A.7 DateAddAdds an offset to the field value. The first parameter for DateAdd must be a field of type DateTime, and the last seven parameters maybe a field of type Integer or an integer value. Zeros may be used where no offset is needed.
Syntax:
DateAdd(DateTime, Years, Months, Days, Hours, Minutes, Seconds, Milliseconds)
Example:
DateAdd({Last Modified}, 0, 0, 7, 0, 0, 0, 0)//adds 7 days to the Last Modified value
DateAdd({Last Modified}, 0, 0, DaysToFollowup, 0, 0, 0, 0)//adds DaysToFolowup number of days to the Last Modified value
A.8 DayNameReturns the day name for a date. DayName accepts one field parameter of type DateTime.
Syntax:
DayName(DateTime)
Example:
DayName({Last Modified})
A.9 DayOfMonthReturns the day of the month for a date, in the range 1 to 31. DayOfMonth accepts one field parameter of type DateTime.
Syntax:
DayOfMonth(DateTime)
Example:
DayOfMonth({Last Modified})
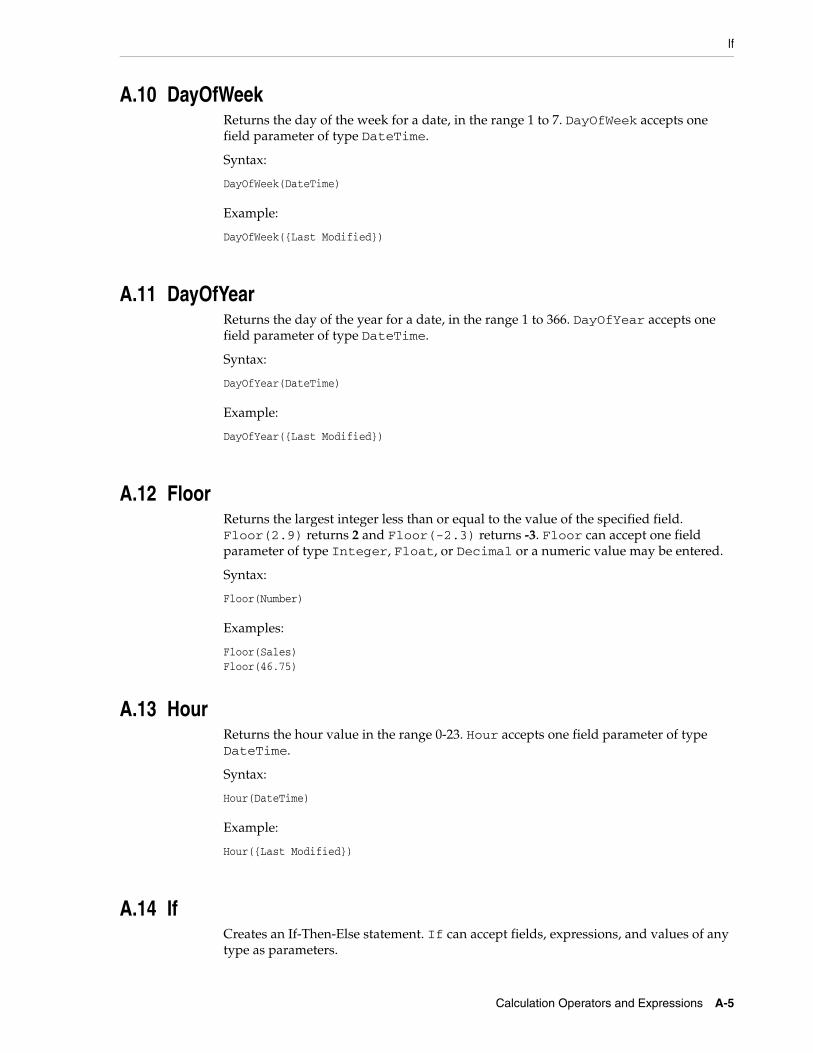
If
Calculation Operators and Expressions A-5
A.10 DayOfWeekReturns the day of the week for a date, in the range 1 to 7. DayOfWeek accepts one field parameter of type DateTime.
Syntax:
DayOfWeek(DateTime)
Example:
DayOfWeek({Last Modified})
A.11 DayOfYearReturns the day of the year for a date, in the range 1 to 366. DayOfYear accepts one field parameter of type DateTime.
Syntax:
DayOfYear(DateTime)
Example:
DayOfYear({Last Modified})
A.12 FloorReturns the largest integer less than or equal to the value of the specified field. Floor(2.9) returns 2 and Floor(-2.3) returns -3. Floor can accept one field parameter of type Integer, Float, or Decimal or a numeric value may be entered.
Syntax:
Floor(Number)
Examples:
Floor(Sales)Floor(46.75)
A.13 HourReturns the hour value in the range 0-23. Hour accepts one field parameter of type DateTime.
Syntax:
Hour(DateTime)
Example:
Hour({Last Modified})
A.14 IfCreates an If-Then-Else statement. If can accept fields, expressions, and values of any type as parameters.
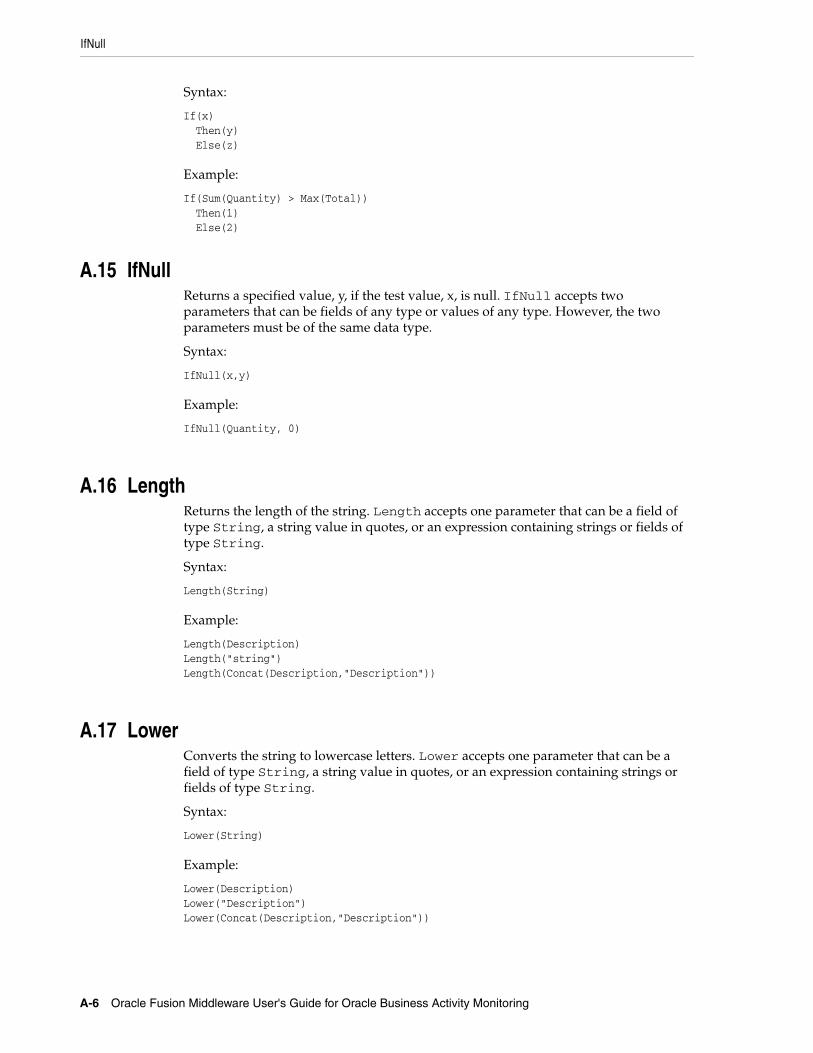
IfNull
A-6 Oracle Fusion Middleware User's Guide for Oracle Business Activity Monitoring
Syntax:
If(x)Then(y)Else(z)
Example:
If(Sum(Quantity) > Max(Total))Then(1)Else(2)
A.15 IfNullReturns a specified value, y, if the test value, x, is null. IfNull accepts two parameters that can be fields of any type or values of any type. However, the two parameters must be of the same data type.
Syntax:
IfNull(x,y)
Example:
IfNull(Quantity, 0)
A.16 LengthReturns the length of the string. Length accepts one parameter that can be a field of type String, a string value in quotes, or an expression containing strings or fields of type String.
Syntax:
Length(String)
Example:
Length(Description)Length("string")Length(Concat(Description,"Description"))
A.17 LowerConverts the string to lowercase letters. Lower accepts one parameter that can be a field of type String, a string value in quotes, or an expression containing strings or fields of type String.
Syntax:
Lower(String)
Example:
Lower(Description)Lower("Description")Lower(Concat(Description,"Description"))
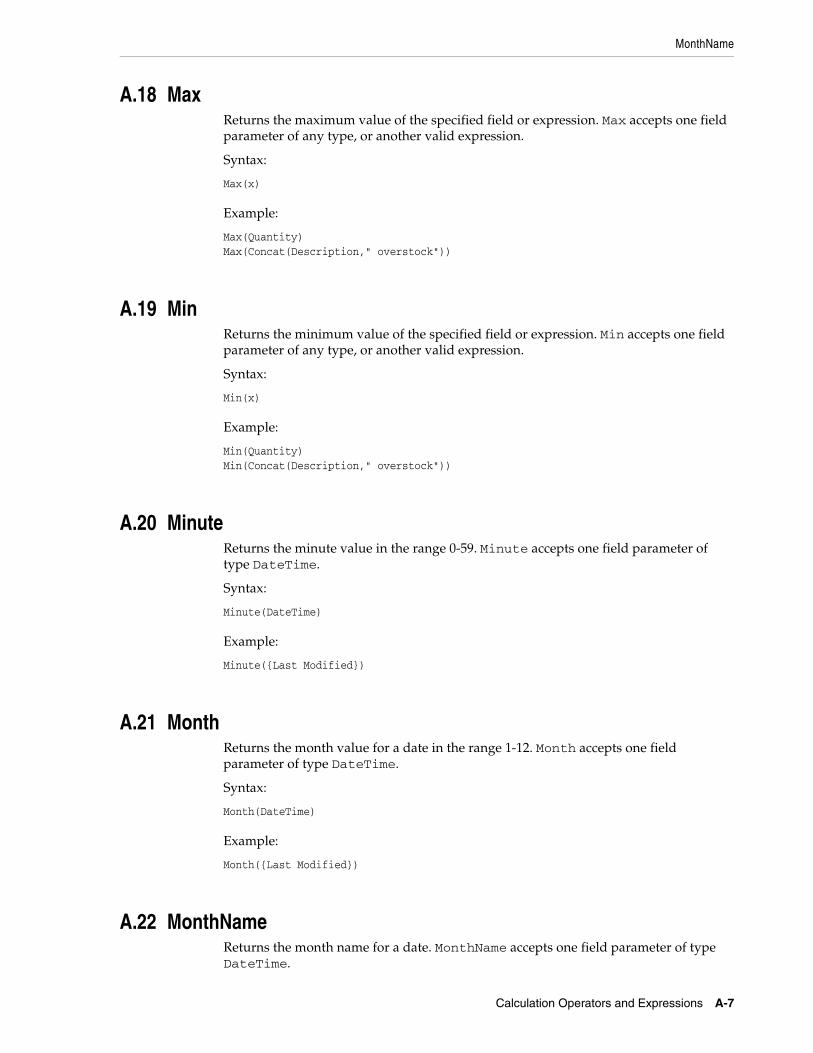
MonthName
Calculation Operators and Expressions A-7
A.18 MaxReturns the maximum value of the specified field or expression. Max accepts one field parameter of any type, or another valid expression.
Syntax:
Max(x)
Example:
Max(Quantity)Max(Concat(Description," overstock"))
A.19 MinReturns the minimum value of the specified field or expression. Min accepts one field parameter of any type, or another valid expression.
Syntax:
Min(x)
Example:
Min(Quantity)Min(Concat(Description," overstock"))
A.20 MinuteReturns the minute value in the range 0-59. Minute accepts one field parameter of type DateTime.
Syntax:
Minute(DateTime)
Example:
Minute({Last Modified})
A.21 MonthReturns the month value for a date in the range 1-12. Month accepts one field parameter of type DateTime.
Syntax:
Month(DateTime)
Example:
Month({Last Modified})
A.22 MonthNameReturns the month name for a date. MonthName accepts one field parameter of type DateTime.
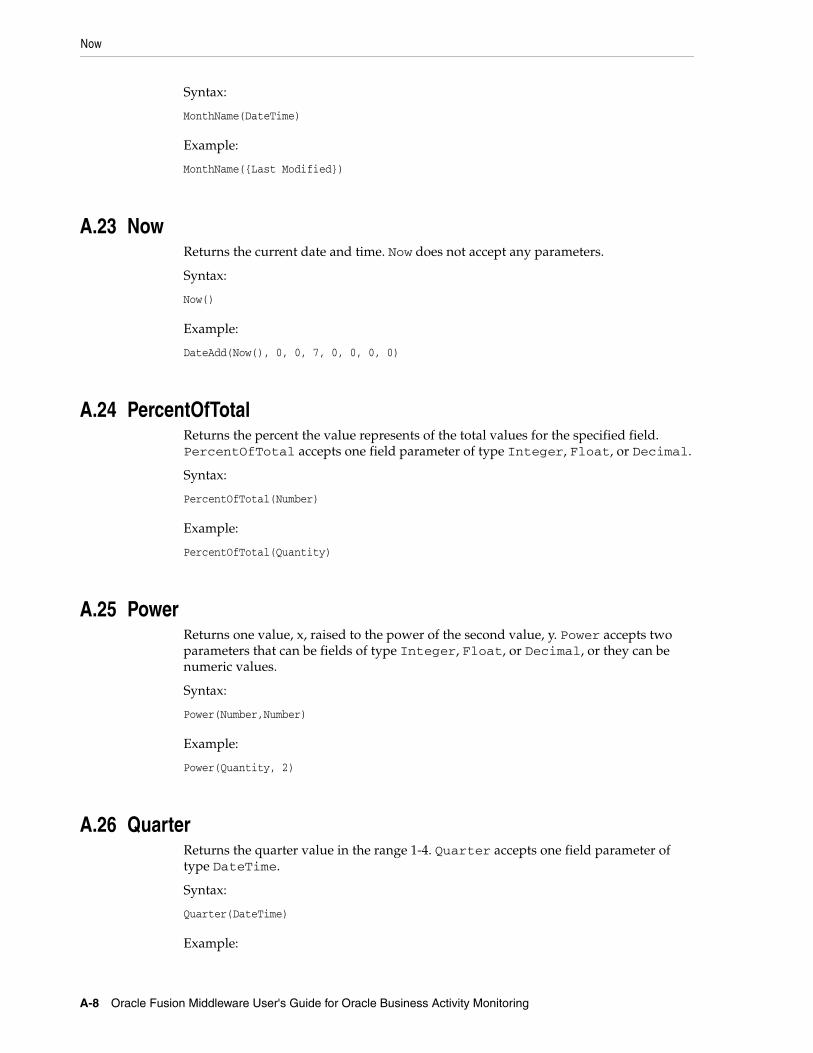
Now
A-8 Oracle Fusion Middleware User's Guide for Oracle Business Activity Monitoring
Syntax:
MonthName(DateTime)
Example:
MonthName({Last Modified})
A.23 NowReturns the current date and time. Now does not accept any parameters.
Syntax:
Now()
Example:
DateAdd(Now(), 0, 0, 7, 0, 0, 0, 0)
A.24 PercentOfTotalReturns the percent the value represents of the total values for the specified field. PercentOfTotal accepts one field parameter of type Integer, Float, or Decimal.
Syntax:
PercentOfTotal(Number)
Example:
PercentOfTotal(Quantity)
A.25 PowerReturns one value, x, raised to the power of the second value, y. Power accepts two parameters that can be fields of type Integer, Float, or Decimal, or they can be numeric values.
Syntax:
Power(Number,Number)
Example:
Power(Quantity, 2)
A.26 QuarterReturns the quarter value in the range 1-4. Quarter accepts one field parameter of type DateTime.
Syntax:
Quarter(DateTime)
Example:
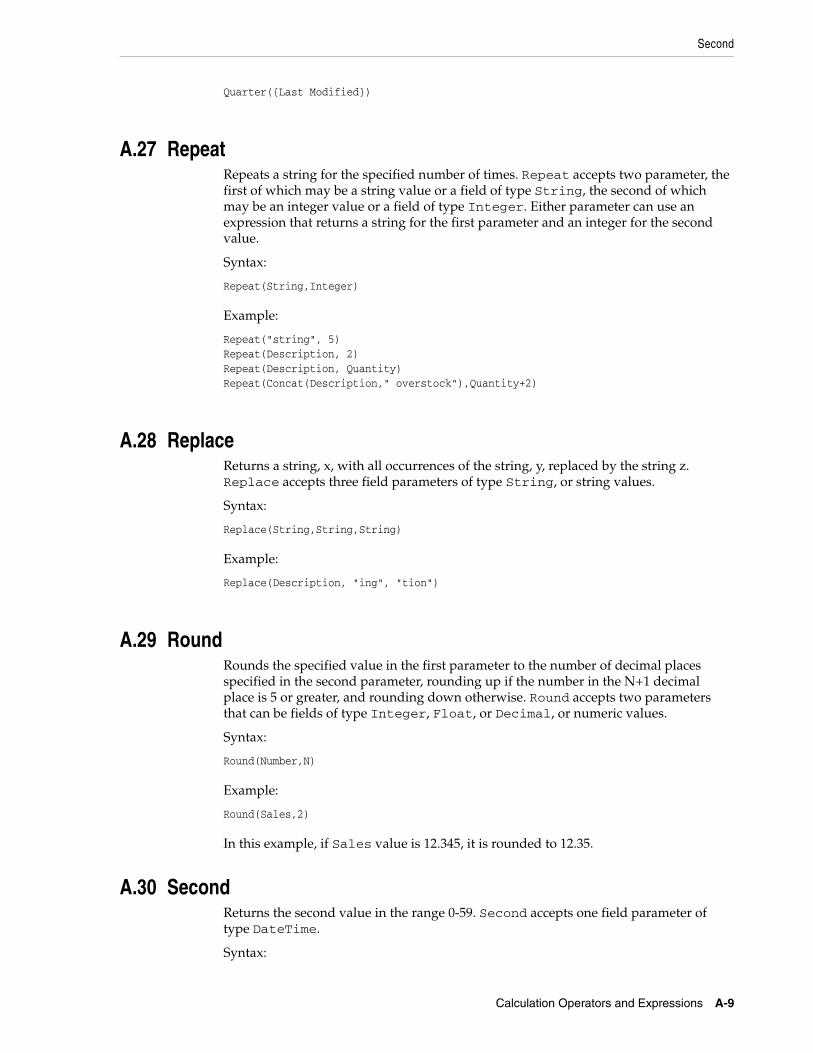
Second
Calculation Operators and Expressions A-9
Quarter({Last Modified})
A.27 RepeatRepeats a string for the specified number of times. Repeat accepts two parameter, the first of which may be a string value or a field of type String, the second of which may be an integer value or a field of type Integer. Either parameter can use an expression that returns a string for the first parameter and an integer for the second value.
Syntax:
Repeat(String,Integer)
Example:
Repeat("string", 5)Repeat(Description, 2)Repeat(Description, Quantity)Repeat(Concat(Description," overstock"),Quantity+2)
A.28 ReplaceReturns a string, x, with all occurrences of the string, y, replaced by the string z. Replace accepts three field parameters of type String, or string values.
Syntax:
Replace(String,String,String)
Example:
Replace(Description, "ing", "tion")
A.29 RoundRounds the specified value in the first parameter to the number of decimal places specified in the second parameter, rounding up if the number in the N+1 decimal place is 5 or greater, and rounding down otherwise. Round accepts two parameters that can be fields of type Integer, Float, or Decimal, or numeric values.
Syntax:
Round(Number,N)
Example:
Round(Sales,2)
In this example, if Sales value is 12.345, it is rounded to 12.35.
A.30 SecondReturns the second value in the range 0-59. Second accepts one field parameter of type DateTime.
Syntax:
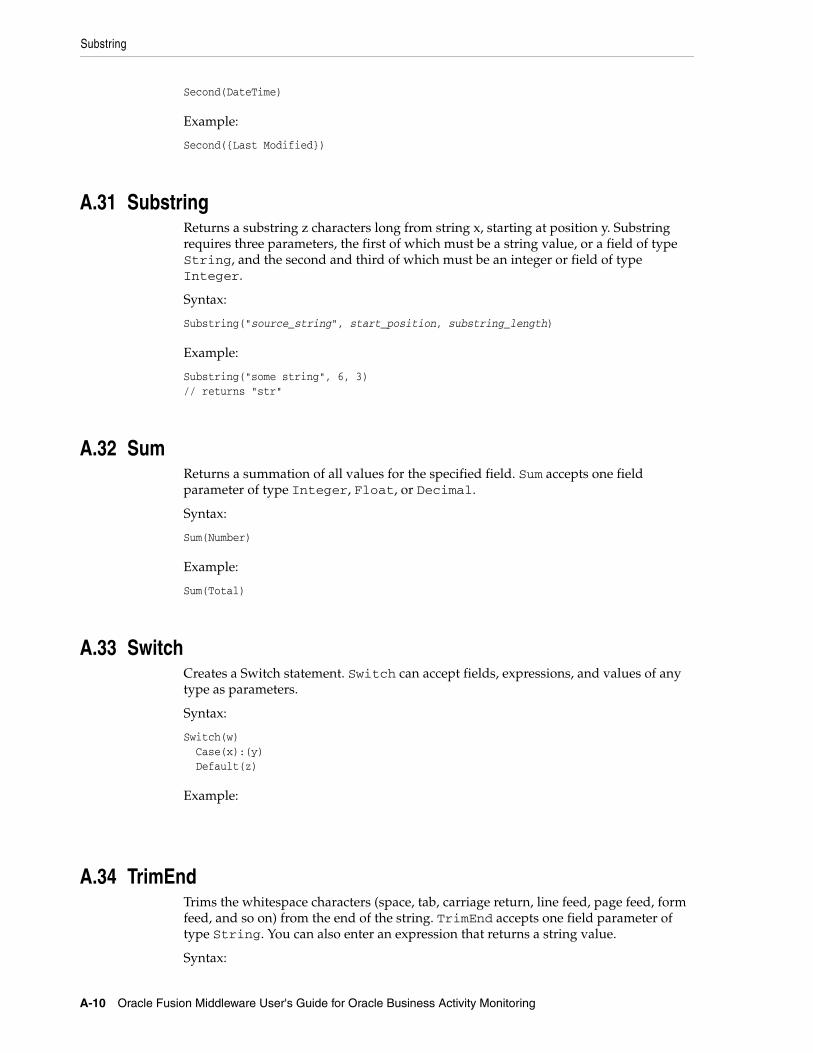
Substring
A-10 Oracle Fusion Middleware User's Guide for Oracle Business Activity Monitoring
Second(DateTime)
Example:
Second({Last Modified})
A.31 SubstringReturns a substring z characters long from string x, starting at position y. Substring requires three parameters, the first of which must be a string value, or a field of type String, and the second and third of which must be an integer or field of type Integer.
Syntax:
Substring("source_string", start_position, substring_length)
Example:
Substring("some string", 6, 3)// returns "str"
A.32 SumReturns a summation of all values for the specified field. Sum accepts one field parameter of type Integer, Float, or Decimal.
Syntax:
Sum(Number)
Example:
Sum(Total)
A.33 SwitchCreates a Switch statement. Switch can accept fields, expressions, and values of any type as parameters.
Syntax:
Switch(w)Case(x):(y)Default(z)
Example:
A.34 TrimEndTrims the whitespace characters (space, tab, carriage return, line feed, page feed, form feed, and so on) from the end of the string. TrimEnd accepts one field parameter of type String. You can also enter an expression that returns a string value.
Syntax:
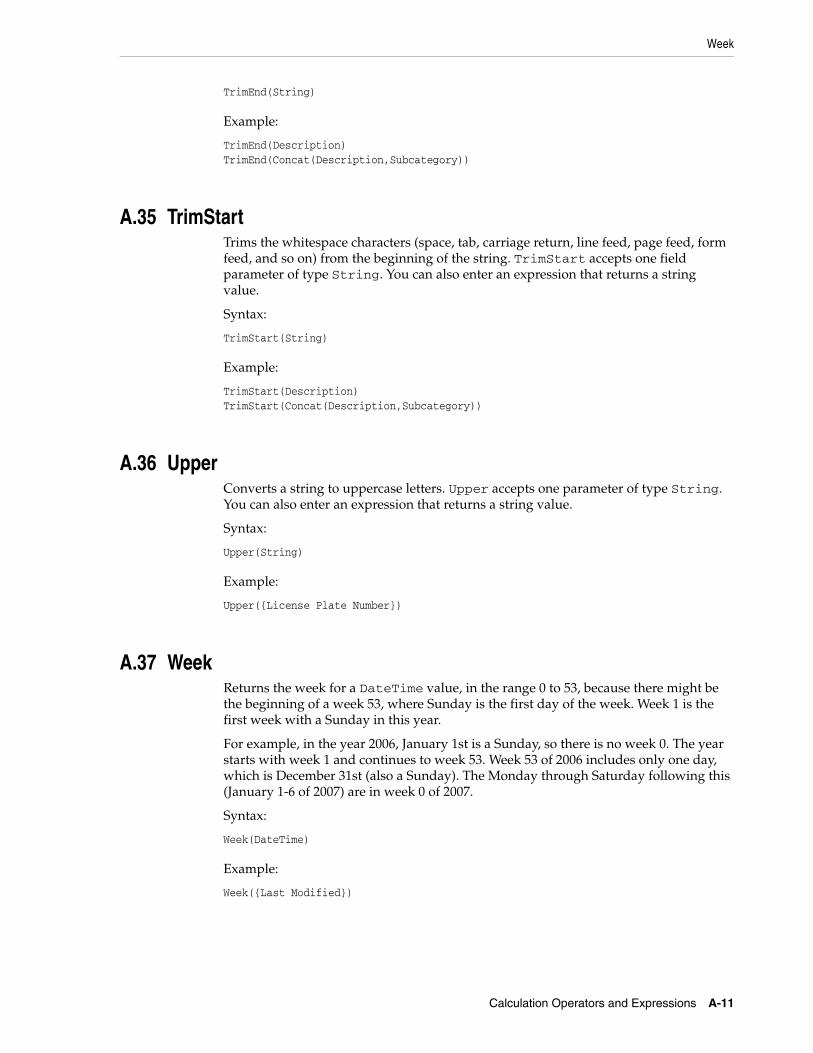
Week
Calculation Operators and Expressions A-11
TrimEnd(String)
Example:
TrimEnd(Description)TrimEnd(Concat(Description,Subcategory))
A.35 TrimStartTrims the whitespace characters (space, tab, carriage return, line feed, page feed, form feed, and so on) from the beginning of the string. TrimStart accepts one field parameter of type String. You can also enter an expression that returns a string value.
Syntax:
TrimStart(String)
Example:
TrimStart(Description)TrimStart(Concat(Description,Subcategory))
A.36 UpperConverts a string to uppercase letters. Upper accepts one parameter of type String. You can also enter an expression that returns a string value.
Syntax:
Upper(String)
Example:
Upper({License Plate Number})
A.37 WeekReturns the week for a DateTime value, in the range 0 to 53, because there might be the beginning of a week 53, where Sunday is the first day of the week. Week 1 is the first week with a Sunday in this year.
For example, in the year 2006, January 1st is a Sunday, so there is no week 0. The year starts with week 1 and continues to week 53. Week 53 of 2006 includes only one day, which is December 31st (also a Sunday). The Monday through Saturday following this (January 1-6 of 2007) are in week 0 of 2007.
Syntax:
Week(DateTime)
Example:
Week({Last Modified})
Year
A-12 Oracle Fusion Middleware User's Guide for Oracle Business Activity Monitoring
A.38 YearReturns the year value in the range 1000-9999. Year accepts one parameter of type DateTime.
Syntax:
Year(DateTime)
Example:
Year({Last Modified})
B
Filter Comparison Expressions B-1
BFilter Comparison Expressions
This appendix describes the comparison expressions you can use when adding data filters in report views using Oracle Business Activity Monitoring (Oracle BAM) Active Studio.
This appendix contains the following topics:
■ Section B.1, "Filter Comparison Expressions"
■ Section B.2, "Exceptions for Timestamp Filter Expressions"
For more information about creating filters in report views, see Section 5.1, "Filtering Data."
B.1 Filter Comparison Expressionsis equal to returns exact value. See Section B.2, "Exceptions for Timestamp Filter Expressions" for exceptions.
is not equal to returns all values except specified value.
is less than returns values less than specified value.
is less than or equal to returns values less than or equal to specified value.
is greater than returns values greater than specified value.
is greater than or equal to returns values greater than or equal to specified value.
is like returns values that match a string pattern. Include an underscore (_) as a wildcard for a single character in a string, and a percent symbol (%) as a wildcard for one character or more. Wildcard characters can be combined, for example, %mm _00 would return all columns (35mm 200, 35mm 400, 35mm 800). Do not enter any spaces in the expression because spaces are treated as characters in the data match.
is not like returns values that do not match a string pattern. You can use the wildcard characters permitted in is like comparison expression.
is null returns values where the column is null.
is not null returns values where the column is not null.
is in list returns values included in a list. To build a list, click Edit. Type a value in the field and click Add to add it to the list. Add as many values as needed. Click Remove to remove a value. Click OK to close the dialog box. See Section B.2, "Exceptions for Timestamp Filter Expressions" for exceptions.
is not in list returns values not included in the list.
Exceptions for Timestamp Filter Expressions
B-2 Oracle Fusion Middleware User's Guide for Oracle Business Activity Monitoring
is within a time interval returns the values that occur within the specified time interval. When filtering on a datetime or timestamp field, select Active Now to keep the displayed time interval current as time passes. Configure the Active Now Interval to specify how often to refresh the display. See Section 5.1.1, "Using Active Now" for more information.
is within the current time period returns the values that occur within the specified time unit. When filtering on a datetime or timestamp field, select Active Now to keep the displayed time period current as time passes. See Section 5.1.1, "Using Active Now" for more information.
is within a time period returns the values that occur within the specified time period. When filtering on a datetime or timestamp field, select Active Now to keep the displayed time period current as time passes. See Section 5.1.1, "Using Active Now" for more information.
B.2 Exceptions for Timestamp Filter ExpressionsNote that is equal to and is in list filters is not satisfied for fields containing time stamp data type because the time stamp values in the Oracle database are stored with a microsecond precision, and Oracle BAM does not have the option in the Time selection within Oracle BAM Active Studio filter creation user interface to include microseconds.
You can work around this limitation using the is equal to by creating two filters: one using the comparison is greater than or equal to and the desired value, and a second filter using the comparison less than and the next second of the value.
For example, if you want is equal to be satisfied for 10:05:30 11:14:35 AM,
In the filter headers, choose All for Include rows where x of the following apply.
In the first filter, choose the comparison expression is greater than or equal to and the value 10:05:30 11:14:35 AM.
In the second filter, choose the comparison expression is less than and the value 10:05:30 11:14:36 AM.
C
Date and Time in Oracle BAM C-1
CDate and Time in Oracle BAM
This appendix describes how to set time zone preferences in Oracle Business Activity Monitoring (Oracle BAM), and configure date and time behavior in reports and alerts.
This appendix contains the following topics:
■ Section C.1, "General Transformation and Formatting Of Date and Time"
■ Section C.2, "Personalized Time Zone Settings"
■ Section C.3, "Date (Datetime and Timestamp) Configuration in Reports"
■ Section C.4, "Date and Time in Alerts"
■ Section C.5, "Date and Time in Enterprise Message Sources"
C.1 General Transformation and Formatting Of Date and TimeAll of the data that is sent to Oracle BAM is stored in oracle BAM data objects in the server time zone.
Oracle BAM Architect displays data in the server time zone.
The data in filters and prompts is also in the server time zone by default.
Transformation: Time zone setting in the Active Studio and Active Viewer personalize dialog is used by default to transform times from Oracle BAM Server time to the preference of the user in their locale.
Time-based alerts always use the time zone settings configured in the user preferences.
Reports may define their own date pattern and transformation, or use the time zone settings configured in the user preferences.
Formatting: All display of dates in the Web browser is formatted as per the Web browser locale.
For alerts that e-mail reports to users, there is no Web browser in the use case, so the user preference is used for formatting.
C.2 Personalized Time Zone SettingsA Time Zone preference can be set in the Personalize dialog in Oracle BAM Active Studio and Oracle BAM Active Viewer. This feature helps to maintain the default preference for a user. A user can set any one of the following:
Date (Datetime and Timestamp) Configuration in Reports
C-2 Oracle Fusion Middleware User's Guide for Oracle Business Activity Monitoring
■ GMT for reports and locale time zone for alerts.
■ Your locale time zone (Asia/Calcutta).
■ Choose a time zone preference.
A user can also indicate if the time should be adjusted for daylight savings.
The user’s indicated Time Zone preference in is used for displaying time in reports and time-based alerts.
■ In reports, this is applicable only when a report contains datetime data in GMT, and value formatting is specified as Each users time zone preference.
■ In time-based alerts, if time zone preference is not set, then it would be set to the Web browser's locale time zone for that user, and the alert also provides a link to override the default setting.
C.3 Date (Datetime and Timestamp) Configuration in Reports
Report View:No date or time transformation is done to the date column values if there are no settings specified in "Value Format".
Pattern and transformation can be overridden using "Value Format":
■ Date pattern (e.g. m/d/yy or MM/dd/yy H.mm.ss or Long date and time ...) for date columns can be defined using "Value Format".
■ Date transformation (adjust from GMT) for date columns can be defined using "Value Format". One out of the following options can be selected for transformation:
– Each users time zone preference.
– Each browser's locale time zone.
– Specific user defined time zone selected from a predefined list.
A user can also mention if the transformation should take daylight savings time into account.
Dates are transformed as per user preference in prompts.
Report Creation/Edit:In filter expressions, dates are input in default time zone, as it is displayed in Oracle BAM Architect. Dates are transformed as per user preference in prompts.
C.4 Date and Time in AlertsAlerts UI displays Date-Time in user preferred time zone, and formats it according to the locale setting of the user's browser. User can set his time zone settings for alerts from the "Personalize" link in Active Studio/Active Viewer/Architect.
If there is no time zone set for for a particulr user, it is set to his local time zone when he first tries to access the Alerts editor to create or edit an alert.
If the alert has been configured to run as a different user (using the "Run As" feature), time zone setting of the "Run As" user will be considered. Again, if the "Run As" user does not have Alerts time zone preference, set, current user's (alert creator's) local time zone will be set as his alerts time zone preference.
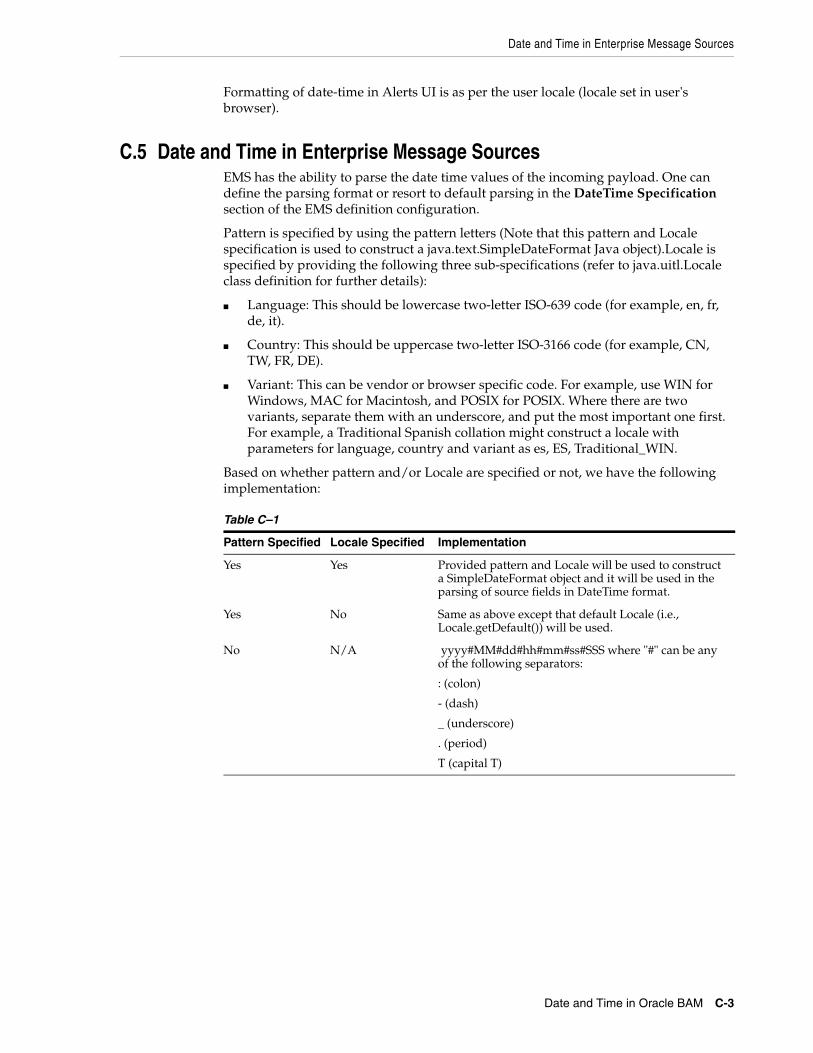
Date and Time in Enterprise Message Sources
Date and Time in Oracle BAM C-3
Formatting of date-time in Alerts UI is as per the user locale (locale set in user's browser).
C.5 Date and Time in Enterprise Message SourcesEMS has the ability to parse the date time values of the incoming payload. One can define the parsing format or resort to default parsing in the DateTime Specification section of the EMS definition configuration.
Pattern is specified by using the pattern letters (Note that this pattern and Locale specification is used to construct a java.text.SimpleDateFormat Java object).Locale is specified by providing the following three sub-specifications (refer to java.uitl.Locale class definition for further details):
■ Language: This should be lowercase two-letter ISO-639 code (for example, en, fr, de, it).
■ Country: This should be uppercase two-letter ISO-3166 code (for example, CN, TW, FR, DE).
■ Variant: This can be vendor or browser specific code. For example, use WIN for Windows, MAC for Macintosh, and POSIX for POSIX. Where there are two variants, separate them with an underscore, and put the most important one first. For example, a Traditional Spanish collation might construct a locale with parameters for language, country and variant as es, ES, Traditional_WIN.
Based on whether pattern and/or Locale are specified or not, we have the following implementation:
Table C–1
Pattern Specified Locale Specified Implementation
Yes Yes Provided pattern and Locale will be used to construct a SimpleDateFormat object and it will be used in the parsing of source fields in DateTime format.
Yes No Same as above except that default Locale (i.e., Locale.getDefault()) will be used.
No N/A yyyy#MM#dd#hh#mm#ss#SSS where "#" can be any of the following separators:
: (colon)
- (dash)
_ (underscore)
. (period)
T (capital T)

Date and Time in Enterprise Message Sources
C-4 Oracle Fusion Middleware User's Guide for Oracle Business Activity Monitoring
D
Troubleshooting D-1
DTroubleshooting
This appendix describes common issues that can occur due to Oracle Business Activity Monitoring (Oracle BAM) configuration settings that must be adjusted.
This appendix contains the following topics:
■ Section D.1, "Upgrade Issues"
■ Section D.2, "Startup and Login Issues"
■ Section D.3, "Oracle BAM Web Application Issues"
■ Section D.4, "Oracle BAM Server Issues"
■ Section D.5, "Oracle BAM Adapter Issues"
■ Section D.6, "Oracle BAM Sensor Action Issues"
■ Section D.7, "Oracle BAM ICommand Issues"
■ Section D.8, "Oracle BAM Issues With Oracle Enterprise Manager Fusion Middleware Control Console"
■ Section D.9, "Oracle BAM Issues With Oracle WebLogic Server Administrative Console"
■ Section D.10, "Oracle BAM Issues With Oracle Data Integrator"
■ Section D.11, "Database Issues"
■ Section D.12, "Using the Logs"
D.1 Upgrade IssuesThis section contains information about troubleshooting upgrade issues. It contains the following topics:
■ Section D.1.1, "Open 10.1.3.x Oracle JDeveloper Project with Oracle BAM sensor actions in Oracle JDeveloper 11g"
D.1.1 Open 10.1.3.x Oracle JDeveloper Project with Oracle BAM sensor actions in Oracle JDeveloper 11g
When trying to migrate SOA composite project from Oracle JDeveloper 10g to 11g:
Exception occurred during invocation of JCA binding:
JCA Binding execute of Reference operation 'writetoBAM' failed due to: javax.resource.ResourceException: oracle.bam.common.security.authentication.AuthenticationException: BAM-00400:
Startup and Login Issues
D-2 Oracle Fusion Middleware User's Guide for Oracle Business Activity Monitoring
Authentication failed.
Exception occurred during invocation of JCA binding:
JCA Binding execute of Reference operation 'writetoBAM' failed due to: javax.resource.ResourceException: javax.xml.soap.SOAPException: S:Server:BAM-06146: Cannot upsert rows in Data Object "/Samples/Employees".oracle.bam.adc.api.exceptions.BatchingException: BAM-01500: No value specified for key column "_Sales_Number".
Consider the following:
1. Because there were changes on Oracle BAM adapter connection/interaction specification on 11g, Oracle JDeveloper migration process should handle it. If not, re-configure each sensor action and JCA adapter to update with new content of connection and interaction specification.
2. On the RMI authentication failure, check the configuration properties of outbound connection pools to ensure valid information is provided.
3. On the SOAP failure, the exception is related to a missing key for inserting rows into an Oracle BAM data object. Check your Composite XSLT rule for propagating data correctly. In addition, check the SOAP settings for the previous scenarios.
D.2 Startup and Login IssuesIf your Oracle Business Activity Monitoring software does not run after installation, or there are problems with the Start Page, check the following points:
■ Section D.2.1, "Database is Running and Reachable"
■ Section D.2.2, "404 Error"
■ Section D.2.3, "Authentication Failed Exception"
■ Section D.2.4, "Buttons Grayed Out on the Start Page"
D.2.1 Database is Running and ReachableVerify that the database is running and reachable. You should be able to connect to the database as system user.
C:\>sqlplus system/welcome@orcl
Error ORA-12154 could indicate that the Oracle TNS Listener service is not running.
If the database is on a remote machine you must run the command on the database installed machine, or you should have sqlplus on the local host.
D.2.2 404 ErrorThe following 404 error occurs on attempt to start Oracle BAM Web applications:
Error 404--Not FoundFrom RFC 2068 Hypertext Transfer Protocol -- HTTP/1.1:10.4.5 404 Not Found
Verify that the port number is correct and the URL is exactly in the following format (which is case-sensitive):
http://host_name:port_number/OracleBAM
Oracle BAM Web Application Issues
Troubleshooting D-3
D.2.3 Authentication Failed ExceptionIf Oracle BAM is configured with Oracle Internet Directory, make sure you have the DefaultAuthenticator provider set to OPTIONAL in Oracle WebLogic Server Console, otherwise the authentication fails.
D.2.4 Buttons Grayed Out on the Start PageThis can happen when the user account is not recognized. The user might be part of a group unknown to Oracle BAM. The known groups are BamAdministrators, BamReportArchitects, BamReportCreators, and BamReportViewers.
See "Managing Oracle Business Activity Monitoring" in Oracle Fusion Middleware Administrator's Guide for Oracle SOA Suite for information about Oracle BAM user management.
D.3 Oracle BAM Web Application IssuesThis section contains information about troubleshooting issues encountered with the Oracle BAM Active Viewer, Active Studio, Architect, Administrator applications, And the Oracle BAM Event Engine and Report Cache. It contains the following topics:
■ Section D.3.1, "Loss of Active Data"
■ Section D.3.2, "Active Data is Intermittent"
■ Section D.3.3, "Reports Get Stuck"
■ Section D.3.4, "Printing Issues"
■ Section D.3.5, "Unable to Create or View Report With No Permissions on System Folder"
■ Section D.3.6, "Cannot Configure More Than 50 Prompt Values in a Report"
■ Section D.3.7, "Not All Values Are Displayed in the Filter Value Browse List"
■ Section D.3.8, "Action Form Error"
■ Section D.3.9, "Report Says "Reconnecting" Indefinitely."
■ Section D.3.10, "Data Object Name Is Different in Oracle BAM Architect and Oracle Enterprise Manager Fusion Middleware Control"
■ Section D.3.11, "Rows Truncated in List Views"
■ Section D.3.12, "Exception Message While Creating or Viewing Charts and KPIs"
■ Section D.3.13, "Cannot Reuse a User Name"
■ Section D.3.14, "Timing Is Off Between Active Now and Continuous Time Series"
■ Section D.3.15, "Exception Thrown Drilling Across Between Reports"
D.3.1 Loss of Active DataActive Data is not pushed to Oracle BAM Reports.
Manually change the Compression setting in the webcache.xml file to set compression to NO under the SITE element:
<COMPRESSION ENABLED="NO"/>
Restart Oracle WebCache after this change.
Oracle BAM Web Application Issues
D-4 Oracle Fusion Middleware User's Guide for Oracle Business Activity Monitoring
The compression needs to be turned off because if it is on, then Oracle WebCache will buffer the Oracle BAM active data to a certain threshold size before it compresses the data and returns the data to Oracle BAM Active Viewer. When the compression is disabled for the SITE, Oracle WebCache does not buffer and the active data is seen in Oracle BAM Active Viewer instantaneously.
See also: Section D.3.9, "Report Says "Reconnecting" Indefinitely."
If none of the above suggestions resolve your issue:
■ Contact Oracle Support Services and get a Java script patch along with instructions on how to configure Internet Explorer to generate client side logs.
■ Contact Oracle Support Services and configure Oracle BAM loggers on the server side.
D.3.2 Active Data is IntermittentIf any reports that are dependent upon a data object from which data (more than 10,000 rows) is being deleted (via alert action Delete rows from a Data Object) are open at the time the action executes, the active data is stopped on the viewsets and reloaded after deletion is complete.
In addition, during Delete rows from a Data Object execution, any alerts that are dependent on that data object are temporarily disabled internally. While this action is being run, any new alert created using that data object, or any dependent existing alerts that are disabled and reenabled, will result in the system getting stuck. It is recommended that users do not create, disable, or reenable any alerts dependent on the data object while this action is in process.
D.3.3 Reports Get StuckIf a user attempts to open a report while the alert action Delete rows from a Data Object for a dependent data object is in process (while deleting) more than 10,000 rows), the report will get stuck or the outcome may be undefined. It is recommended that users do not open reports dependent on the data object while this action is in process.
See Section D.3.2, "Active Data is Intermittent" for related information.
D.3.4 Printing IssuesParts of a report do not print. Sides appear truncated.
Print layout must be set to Landscape in the Oracle BAM Personalize dialog and in your printer driver.
See Oracle Fusion Middleware User's Guide for Oracle Business Activity Monitoring for more information.
D.3.5 Unable to Create or View Report With No Permissions on System FolderA user assigned to a non-Administrator role may be unable to create or view reports, but has the privileges to do so, and gets the following error:
DATAOBJECTPERMISSIONMISSINGEXCEPTION_ACTIVESTUDIO_REPORTEDITOR_EDITREPORT
Exception Message BAM-01257: Insufficient permission to perform the requested action.
Oracle BAM Web Application Issues
Troubleshooting D-5
This is due to the user not having at least Read permissions on the /System folder in Oracle BAM Architect.
D.3.6 Cannot Configure More Than 50 Prompt Values in a ReportIf you want to configure more than 50 prompt values in a report you must change the RecordsLimitForValueBrowser configuration property in the BAMWebConfig.xml file.
Restart Oracle BAM for the change to take effect.
See "Configuring Advanced Properties" in Oracle Fusion Middleware Administrator's Guide for Oracle SOA Suite for more information.
D.3.7 Not All Values Are Displayed in the Filter Value Browse ListIn configuring filters on string fields, you can browse a list of values to select and filter on. If there are more than 50 values in the field, not all of the values are shown in the list.
You can increase the number of values to display in the list by changing the value for the RecordsLimitForValueBrowser setting in the BAMWebConfig.xml file. The default is 50 values.
Restart Oracle BAM for the change to take effect.
See "Configuring Advanced Properties" in Oracle Fusion Middleware Administrator's Guide for Oracle SOA Suite for more information.
D.3.8 Action Form ErrorThe following error occurs when no Action Form Types are found in System>Views>Action Form Templates data object:
SAXPARSEEXCEPTION_ACTIVESTUDIO_VIEWEDITOR_INPUTS
Be sure to create an entry in the Action Form Template data object before attempting to create an Action Form view.
D.3.9 Report Says "Reconnecting" IndefinitelyClick Reprompt to refresh the report. This can happen when Oracle BAM Server is stopped or restarted, as in failover.
If the above suggestion does not resolve your issue, contact Oracle Support Services and get a Java script patch along with instructions on how to configure Internet Explorer to generate client side logs.
D.3.10 Data Object Name Is Different in Oracle BAM Architect and Oracle Enterprise Manager Fusion Middleware Control
Special characters used in the creation of data objects in Oracle BAM Architect will be substituted in the data object name before the name string is shown in the Oracle BAM ADC Performance Summary page in Oracle Enterprise Manager Fusion Middleware Control. This is due to the different naming conventions used by Oracle BAM Architect and Enterprise Manager Monitoring module.
Oracle BAM Web Application Issues
D-6 Oracle Fusion Middleware User's Guide for Oracle Business Activity Monitoring
D.3.11 Rows Truncated in List ViewsOracle BAM truncates the data to be shown in list views to 64,000 rows. The ADCMaxViewsetRowCount configuration property in BAMServerConfig.xml controls the number of rows shown in list views, and this value can be changed.
D.3.12 Exception Message While Creating or Viewing Charts and KPIs
Could not initialize class sun.awt.X11GraphicsEnvironmentIf you see this message, an environment variable must be unset on the Oracle BAM Server host, and you must restart Oracle BAM Server.
On all UNIX installations of Oracle BAM, due to a behavior of the Java AWT APIs that Oracle BAM uses, Oracle BAM Server must be started with the DISPLAY environment variable unset.
$ unsetenv DISPLAY
D.3.13 Cannot Reuse a User NameWhen you delete a user you cannot re-use that user name until you resolve the old instance with Oracle BAM. Oracle BAM will mark the deleted user inactive when you delete the user in Oracle WebLogic Server.
If you attempt to reuse the same user name for a new account, Oracle BAM does not consider the newly added user to be the same user as the one previously deleted. You must delete the original user from Oracle BAM using Oracle BAM Administrator (and optionally transfer the user’s Oracle BAM objects to another valid user). Once the inactive user is removed from Oracle BAM you can reuse the user name.
See "Removing Invalid Users from Oracle BAM Administrator" in Oracle Fusion Middleware Administrator's Guide for Oracle SOA Suite for information about removing users from Oracle BAM.
There are two reasons for requiring the user name resolution in Oracle BAM:
1) A new user with the same name should not be assigned the old user’s Oracle BAM objects automatically. For example, a user named John Smith could leave the company and a new (different) John Smith could join the company. It is undesirable to hand all of the original John Smith’s Oracle BAM objects (reports, data objects, security settings) to the new John Smith. Although their names are the same, they are not the same person, and Oracle BAM-assigned GUIDs are not the same.
Table D–1 DMS Naming Special Character Replacement
Character DMS Replacement Character
Space " " or Period "." Underscore "_"
Control Character Underscore "_"
"<" "("
">" ")"
"&" "^"
"" (double quote) "'" (backquote) That is, a backquote replaces a double quote.
'' (single quote) " (backquote). That is, a backquote replaces a single quote.
Oracle BAM Server Issues
Troubleshooting D-7
2) You might wish to keep and reassign to other users the objects owned b y the old user. Oracle BAM does not automatically delete the old John Smith from Oracle BAM because that would destroy his Oracle BAM objects. Oracle BAM makes the user inactive to give the administrator a chance to transfer his Oracle BAM objects to another user before truly deleting him from Oracle BAM.
D.3.14 Timing Is Off Between Active Now and Continuous Time SeriesAt times data cannot be synchronized between Active Now and the Continuous Time Series (CTS) because the difference in time between the two is very small.
Example 1:
Chances are there that Active Now (using the within time interval case) will start somewhere in the middle of the interval (for example at the 16th second) and the CTS would show 10 to 19 second interval. Now for the next 10 seconds, chart would have already displayed 20 to 30 second interval, but Active Now would only push the data from 16th to 26th second and will only push the next set of changelists at 36th second. That is why you may see updates happening at the 2nd group of a chart.
The other option is to choose the CTS synchronize option while designing the report. This will work, only if the time unit chosen is same in both CTS and Active Now.
Example 2:
In this example, CTS is designed with 10 second intervals but Active Now is for previous 2 minutes. So if you synchronize, the Active Now interval will be 60 seconds (1 minute) and would not match the CTS's 10 second interval.
In this case the CTS synchronize option would not work.
D.3.15 Exception Thrown Drilling Across Between ReportsMicrosoft SQL Server has a limitation where the query cannot be nested too deeply; however, some features of Oracle BAM may require deep nesting in certain cases, and in those cases Microsoft SQL Server will throw following error:
SQLEXCEPTION_NULL_NULL_NULL[FMWGEN][SQLServer JDBC Driver][SQLServer]Some part of your SQL statement is nested too deeply. Rewrite the query or break it up into smaller queries.
This happens when using a drill across from one report to another. If a lot of unique IDs are passed from one report to the other, and a very large nested query is generated, then Microsoft SQL Server cannot process the query, resulting in the above mentioned exception.
D.4 Oracle BAM Server IssuesThis section contains information about troubleshooting issues encountered with the Oracle BAM Server. It contains the following topics:
■ Section D.4.1, "Enterprise Message Source Not Receiving Messages"
D.4.1 Enterprise Message Source Not Receiving MessagesWhen setting up enterprise message sources on remote destinations on Oracle WebLogic Server JMS, Global Trust must be set up properly.
See "Enabling Global Trust" in Oracle Fusion Middleware Securing Oracle WebLogic Server for information about setting up Global Trust.
Oracle BAM Adapter Issues
D-8 Oracle Fusion Middleware User's Guide for Oracle Business Activity Monitoring
D.5 Oracle BAM Adapter IssuesThis section contains information about troubleshooting issues encountered with SOA-Oracle BAM integration issues using the Oracle BAM JCA adapter. It contains the following topics:
■ Section D.5.1, "SOA Server Invalid User Name Exception"
■ Section D.5.2, "SOA Server Authentication Error With Correct Credential Configuration"
■ Section D.5.3, "Illegal Argument Exception on Oracle WebLogic Server Console Upon Restart or Editing Deployment of Oracle BAM Adapter"
D.5.1 SOA Server Invalid User Name ExceptionFrom the SOA Server log, observed the following:
<env:Envelope@ xmlns:env="http://schemas.xmlsoap.org/soap/envelope/"><env:Header/><env:Body><env:Fault><faultcode>env:Server</faultcode><faultstring>Exception occuredwhen binding was invoked.Exception occured during invocation of JCA binding: "JCA Binding execute ofReference operation 'writetoBAM' failed due to: Invalid user name in theinteraction spec.".The invoked JCA adapter raised a resource exception.Please examine the above error message carefully to determine a resolution.</faultstring><faultactor/><detail><exception/></detail></env:Fault></env:Body></env:Envelope>
■ Use the Oracle WebLogic Server Console to check the Oracle BAM adapter configuration properties for outbound connection pool setting.
■ If you were using plain text to store credentials,
Go to Oracle WebLogic Server Console>Deployment>OracleBamAdapter>Configuration>Outbound Connection Pool, and check each connection pool setting for correct user name and password information.
■ If you have verified that everything is correct in Oracle WebLogic Server Console, and you have verified that the connection properties are saved into the corresponding Plan.xml file, click Save and try restarting Oracle WebLogic Server (this requirement is due to Oracle WebLogic Server Console behavior, or if you have any pre-existing connection pool instance opened).
■ If you were using credential mapping to store user name and password, see "Configuring Credential Mapping" in Oracle Fusion Middleware Administrator's Guide for Oracle SOA Suite.
D.5.2 SOA Server Authentication Error With Correct Credential ConfigurationWith SOA and BAM deployed on two separate WLS domain.
Security Exception Observed on RMI invocation from SOA to BAM ADC EJB
From SOA Server Log:
Caused by: java.lang.SecurityException: [Security:090398]Invalid Subject: principals=weblogic, Administrators...Caused by: java.lang.SecurityException: [Security:090398]Invalid Subject: principals=weblogic, Administrators
Oracle BAM Adapter Issues
Troubleshooting D-9
at weblogic.security.service.SecurityServiceManager.seal(SecurityServiceManager.java:835)...
From BAM Server Log:
<Jan 30, 2009 4:59:40 PM PST> <Warning> <RMI> <BEA-080003> <RuntimeException thrown by rmi server: weblogic.jndi.internal.AdminRoleBasedDispatchServerRef@9, implementation: 'weblogic.jndi.internal.RootNamingNode@4e229e', oid: '9', implementationClassName: 'weblogic.jndi.internal.RootNamingNode'java.lang.SecurityException: [Security:090398]Invalid Subject: principals=weblogic, Administrators.java.lang.SecurityException: [Security:090398]Invalid Subject: principals=weblogic, Administratorsat weblogic.security.service.SecurityServiceManager.seal(SecurityServiceManager.java:835)at weblogic.security.service.SecurityServiceManager.getSealedSubjectFromWire(SecurityServiceManager.java:524)at weblogic.rjvm.MsgAbbrevInputStream.getSubject(MsgAbbrevInputStream.java:315)at weblogic.rmi.internal.BasicServerRef.acceptRequest(BasicServerRef.java:875)at weblogic.rmi.internal.BasicServerRef.dispatch(BasicServerRef.java:310)Truncated. see log file for complete stacktrace
You must set up Trusted Domain on both Oracle WebLogic Server domains.
Go to Oracle WebLogic Server Administration Console>Respected Domainssoainfra or bam>Security and do the following:
1. Navigate to Home>Domain>Security, and check Cross Domain Security Enabled.
2. Click Advanced, enter the desired password in the Credential and Confirm Credential fields, and click Save.
3. Repeat this configuration change for both domains using the same password value.
4. Restart both Oracle WebLogic Servers.
D.5.3 Illegal Argument Exception on Oracle WebLogic Server Console Upon Restart or Editing Deployment of Oracle BAM Adapter
Using integrated SOA deployment from an Oracle JDeveloper installation.
Upon start of the Oracle BAM Adapter deployed on the Oracle WebLogic Server administrative server, Oracle WebLogic Server Console displays the following error:
java.lang.IllegalArgumentException:[J2EE Deployment SPI:260134]Unable to identify application for start operation.
The SOA deployment shipped with Oracle JDeveloper will have Oracle BAM Adapter in non-active status by default, to save the load and start up time on SOA Server for this scenario.
Once you retarget the Oracle BAM Adapter component to the Oracle WebLogic Server administrative server, the component will start automatically.
1. Go to Oracle WebLogic Server Console>Deployment>OracleBamAdapter.
Oracle BAM Sensor Action Issues
D-10 Oracle Fusion Middleware User's Guide for Oracle Business Activity Monitoring
2. Select the component (OracleBamAdapter) you would like to start.
3. Navigate to the Target tab.
4. Select the Server (Admin Server), and click Save.
D.6 Oracle BAM Sensor Action IssuesThis section contains information about troubleshooting issues encountered with the Oracle BAM sensor actions used in Oracle JDeveloper in BPEL processes. It contains the following topics:
■ Section D.6.1, "Loggers for Troubleshooting Oracle BAM Sensors Actions"
D.6.1 Loggers for Troubleshooting Oracle BAM Sensors ActionsUse the oracle.soa.bpel.engine.sensor and oracle.bam.adapter loggers to troubleshoot Oracle BAM sensor action issues. See "Configuring Oracle Business Activity Monitoring" in Oracle Fusion Middleware Administrator's Guide for Oracle SOA Suite for information about configuring the logger.
D.7 Oracle BAM ICommand IssuesThis section contains information about troubleshooting issues encountered with the Oracle BAM ICommand utility. It contains the following topics:
■ Section D.7.1, "JDBC Connection Pool Error"
■ Section D.7.2, "ICommand Fails to Connect With Oracle BAM Server"
■ Section D.7.3, "Unavailable External Data Source Error"
D.7.1 JDBC Connection Pool ErrorIf your encounter error warnings in Oracle BAM ICommand or Oracle BAM Server such as:
weblogic.jdbc.extensions.PoolDisabledSQLException: weblogic.common.resourcepool.ResourceDisabledException: Pool BAMDataSource is disabled, cannot allocate resources to applications
Then the maximum connection pool capacity of BAMDataSource should be increased by logging into Oracle WebLogic Server Console>Datasources>BAMDataSource>Configuration-Connection Pool>Maximum Capacity, and set BAMDataSource to 200 (default 100).
D.7.2 ICommand Fails to Connect With Oracle BAM ServerWhen Oracle BAM is installed, ICommand looks for the Oracle BAM server on port 9001 by default. If the Oracle BAM server port number is changed from the default (9001) during the setup and configuration of Oracle BAM using the Oracle Weblogic Configuration Wizard, then the user must manually change the port number from 9001 to the new port number in the file BAMICommandConfig.xml.
The property to change is
<ADCServerPort>9001</ADCServerPort>
The BAMICommandConfig.xml file is located in ${ORACLE.HOME}/bam/config.
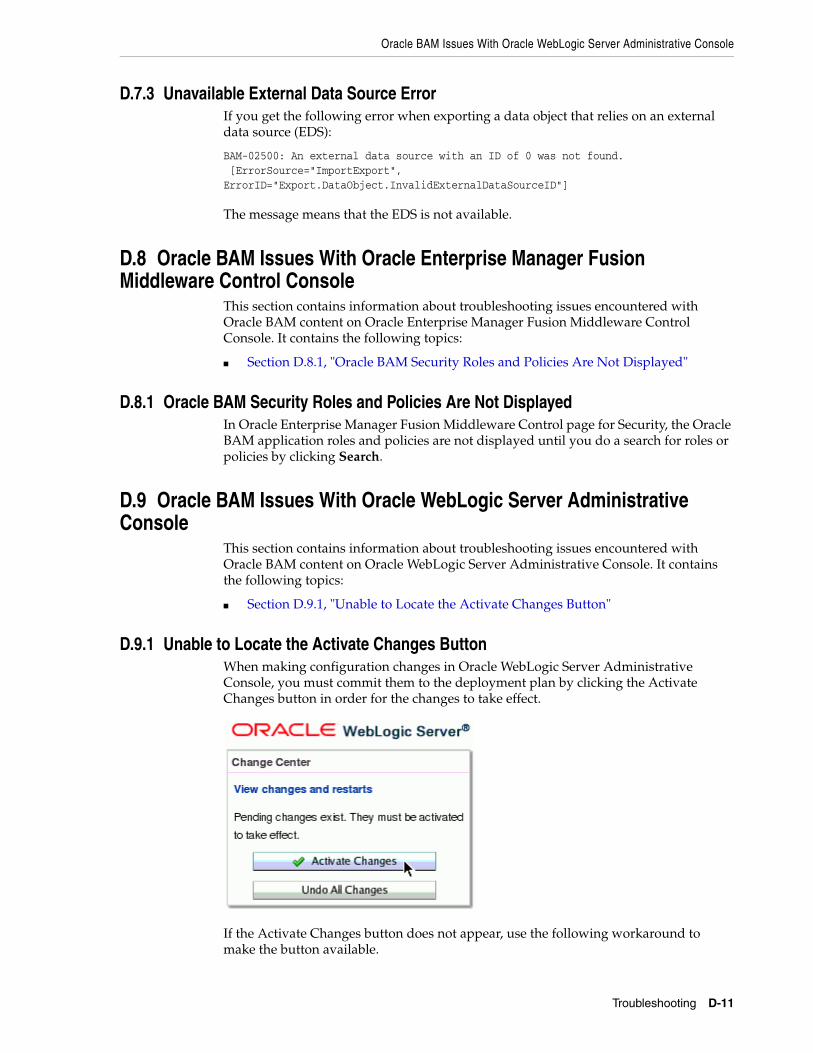
Oracle BAM Issues With Oracle WebLogic Server Administrative Console
Troubleshooting D-11
D.7.3 Unavailable External Data Source ErrorIf you get the following error when exporting a data object that relies on an external data source (EDS):
BAM-02500: An external data source with an ID of 0 was not found. [ErrorSource="ImportExport", ErrorID="Export.DataObject.InvalidExternalDataSourceID"]
The message means that the EDS is not available.
D.8 Oracle BAM Issues With Oracle Enterprise Manager Fusion Middleware Control Console
This section contains information about troubleshooting issues encountered with Oracle BAM content on Oracle Enterprise Manager Fusion Middleware Control Console. It contains the following topics:
■ Section D.8.1, "Oracle BAM Security Roles and Policies Are Not Displayed"
D.8.1 Oracle BAM Security Roles and Policies Are Not DisplayedIn Oracle Enterprise Manager Fusion Middleware Control page for Security, the Oracle BAM application roles and policies are not displayed until you do a search for roles or policies by clicking Search.
D.9 Oracle BAM Issues With Oracle WebLogic Server Administrative Console
This section contains information about troubleshooting issues encountered with Oracle BAM content on Oracle WebLogic Server Administrative Console. It contains the following topics:
■ Section D.9.1, "Unable to Locate the Activate Changes Button"
D.9.1 Unable to Locate the Activate Changes ButtonWhen making configuration changes in Oracle WebLogic Server Administrative Console, you must commit them to the deployment plan by clicking the Activate Changes button in order for the changes to take effect.
If the Activate Changes button does not appear, use the following workaround to make the button available.
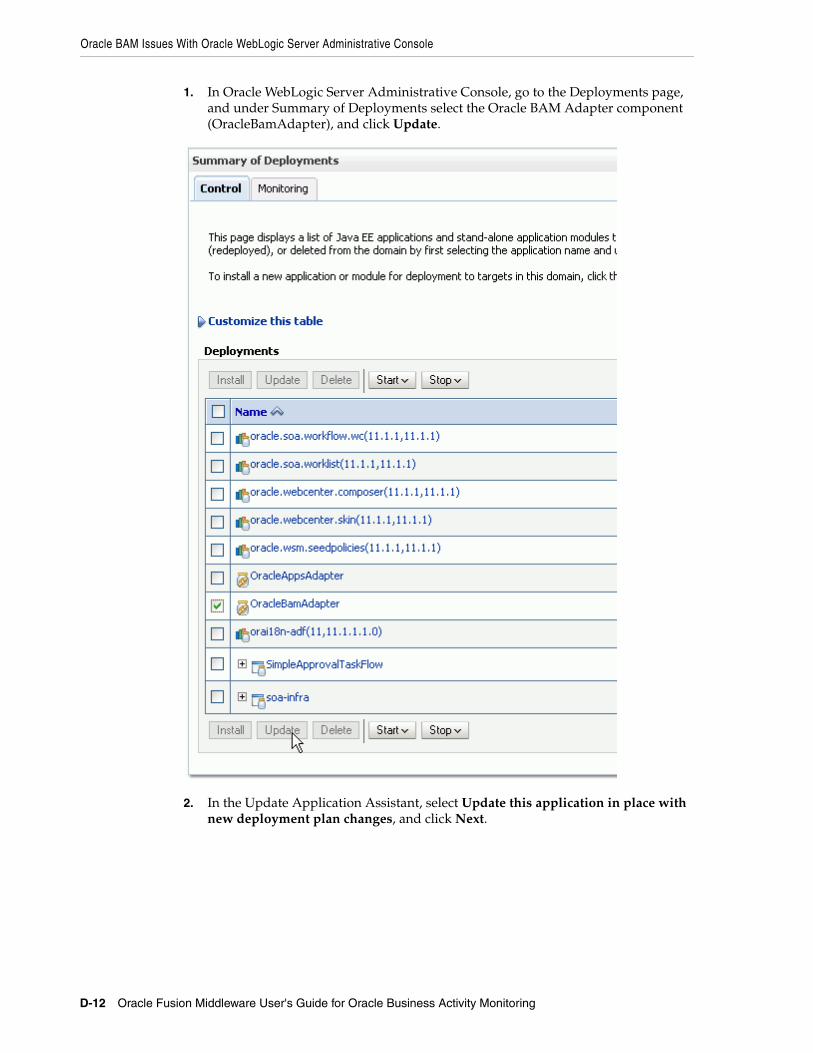
Oracle BAM Issues With Oracle WebLogic Server Administrative Console
D-12 Oracle Fusion Middleware User's Guide for Oracle Business Activity Monitoring
1. In Oracle WebLogic Server Administrative Console, go to the Deployments page, and under Summary of Deployments select the Oracle BAM Adapter component (OracleBamAdapter), and click Update.
2. In the Update Application Assistant, select Update this application in place with new deployment plan changes, and click Next.
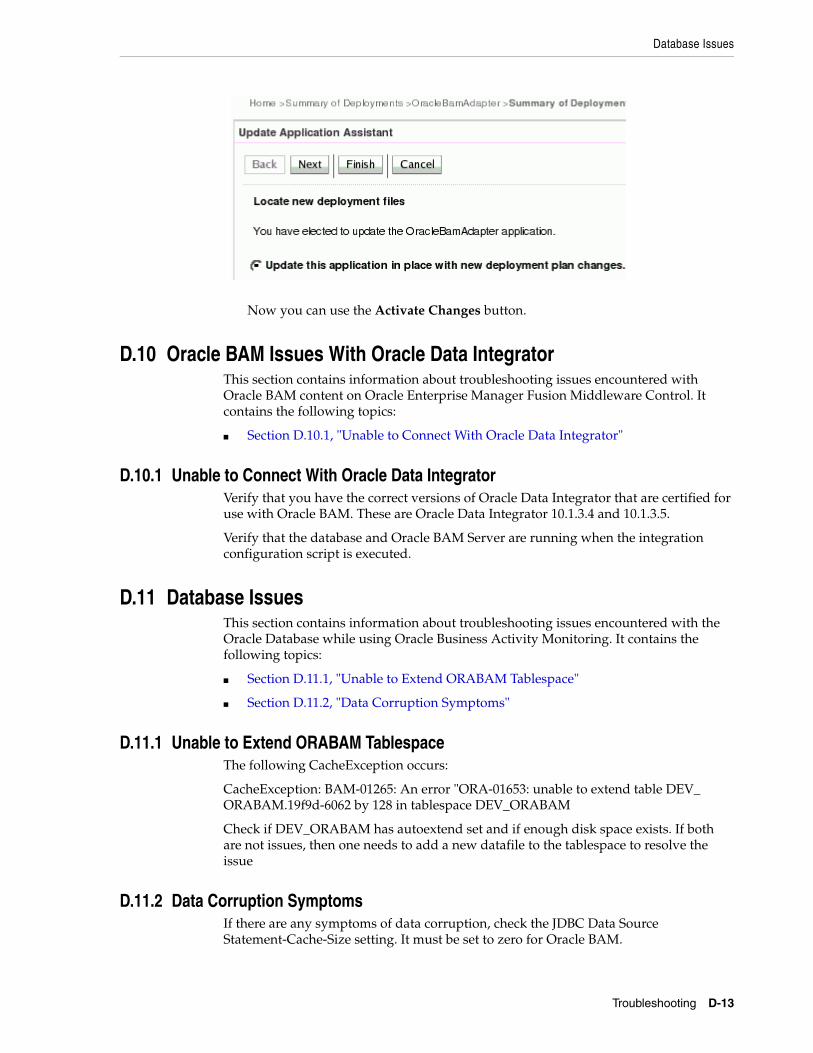
Database Issues
Troubleshooting D-13
Now you can use the Activate Changes button.
D.10 Oracle BAM Issues With Oracle Data IntegratorThis section contains information about troubleshooting issues encountered with Oracle BAM content on Oracle Enterprise Manager Fusion Middleware Control. It contains the following topics:
■ Section D.10.1, "Unable to Connect With Oracle Data Integrator"
D.10.1 Unable to Connect With Oracle Data IntegratorVerify that you have the correct versions of Oracle Data Integrator that are certified for use with Oracle BAM. These are Oracle Data Integrator 10.1.3.4 and 10.1.3.5.
Verify that the database and Oracle BAM Server are running when the integration configuration script is executed.
D.11 Database IssuesThis section contains information about troubleshooting issues encountered with the Oracle Database while using Oracle Business Activity Monitoring. It contains the following topics:
■ Section D.11.1, "Unable to Extend ORABAM Tablespace"
■ Section D.11.2, "Data Corruption Symptoms"
D.11.1 Unable to Extend ORABAM TablespaceThe following CacheException occurs:
CacheException: BAM-01265: An error "ORA-01653: unable to extend table DEV_ORABAM.19f9d-6062 by 128 in tablespace DEV_ORABAM
Check if DEV_ORABAM has autoextend set and if enough disk space exists. If both are not issues, then one needs to add a new datafile to the tablespace to resolve the issue
D.11.2 Data Corruption SymptomsIf there are any symptoms of data corruption, check the JDBC Data Source Statement-Cache-Size setting. It must be set to zero for Oracle BAM.
Using the Logs
D-14 Oracle Fusion Middleware User's Guide for Oracle Business Activity Monitoring
For single instance database installs, the statement cache size will already be set to 0 (zero) by default. Do not change this to a non-zero value.
For installs against an Oracle RAC database, the statement cache size must manually be set to 0 for each Oracle RAC data source; otherwise, data corruption may occur and the Oracle BAM Active Data Cache may need to be restored from a backup (or reinitialized if no backups are available).
D.12 Using the LogsOracle Business Activity Monitoring logs are configured and viewable using Oracle Enterprise Manager Fusion Middleware Control. See Oracle Fusion Middleware Administrator's Guide for Oracle SOA Suite for more information.
Index-1
Index
Aaction buttons, 4-7
configuringconstant value update types, 9-4delete types, 9-5edit column update types, 9-5insert types, 9-3open a URL types, 9-5refresh a view types, 9-8reset a form types, 9-7show a confirmation message types, 9-8view a report types, 9-6
creating, 9-1overview, 9-1
action formoverview, 4-31
action form viewscreating, 4-33example, 4-32templates, 4-31
action list view, 4-6actions in Active Studio interface, 2-13active data
retrieval interval, 3-21starting and stopping, 3-30
active data architecture, 1-1Active Data Cache, 1-4active data formatting, 6-11Active Now Interval, 5-8Active Studio, 1-5Active Studio interface
actions, 2-13alerts, 2-13folders, 2-13guide text, 2-14reports, 2-13tabs, 2-12toolbars, 2-12View Editor, 2-14View Tasks/Options list, 2-13
Active Studio overview, 2-11Active Viewer, 1-5Administrator, 1-6aggregate functions in calculations, A-1alerts, 1-2
alerts in Active Studio interface, 2-13aligning text in views, 6-5Architect, 1-6archive data, 11-1axis properties in views, 6-2
Bbackground color, 3-18background image, 3-18borders and shading in views, 6-3browser settings, 2-1buttons in action lists, 4-7buttons, action
configuringconstant value update types, 9-4delete types, 9-5edit column update types, 9-5insert types, 9-3open a URL types, 9-5refresh a view types, 9-8reset a form types, 9-7show a confirmation message types, 9-8view a report types, 9-6
creating, 9-1overview, 9-1
Ccalculations
aggregate functions, A-1datetime functions, A-1expressions, A-1string functions, A-1using date subtractions, 5-23using HTML, 5-22
calculations in views, 5-21cascading prompts, 8-20changing view types, 3-20chart views
creating, 4-8general properties, 4-10multiple data objects, 4-14pie chart, 4-16statistical process control, 4-14
chart views overview, 4-7
Index-2
column group view, 4-37columnar reports
creating, 3-7grouping items, 3-10inserting images, 7-2inserting text, 7-3overview, 7-1quick formatting, 3-12summary functions, 3-11toolbars, 3-12, 7-1
columnar views, 4-17general properties, 4-18summaries, 4-18
container views, 4-37continuous time series, 4-11copying report URLs, 3-26creating and delivering reports, 3-1crosstab views
filtering, 4-26general properties, 4-25, 4-29overview, 4-23pivoting, 4-27rolling up and drilling down, 4-27summaries, 4-25using, 4-26
custom parameters, 8-6
Ddashboard view, 4-40data filtering, 5-1data labels in views, 6-8data object
replacing in a view, 3-20data objects, using multiple in a chart, 4-14date subtractions, formatting in calculated
fields, 5-23datetime functions in calculations, A-1deleting reports, 3-23deleting views, 3-19drilling
acrossviews, 5-18
down, 5-17hierarchies, 5-18overview, 5-16targets, 5-19through, 5-17to URLs, 5-20up, 5-17
drilling downcrosstab view, 4-27summary crosstab view, 4-28
drivingconfiguration, 8-22
driving example, 8-23driving prompts and parameters, 8-22
Eediting reports, 3-17e-mailing reports, 3-24enterprise message sources, 1-3Event Engine, 1-4examples
action form template, 4-32driving, 8-23
Excel views, 4-29performance tips, 4-31using, 4-30
expressions in calculations, A-1external content views, 4-35
creating, 4-35
Ffiltering
crosstab view, 4-26summary crosstab view, 4-27
filtering data in views, 5-1folders
copying, 10-3moving, 10-4reports
managing, 10-3permissions, 10-2
folders in Active Studio interface, 2-13folders, for reports, 10-1font formatting in views, 6-8formatting report titles, 3-18
Ggeneral properties in views, 6-2grouping items in a columnar report, 3-10groups, time, 4-11guide text in Active Studio interface, 2-14
Hhierarchies in drilling, 5-18high performance gauge, 4-22home tab, setting defaults, 2-9horizon gauge, 4-22HTML in calculations, 5-22
Iimages in columnar reports, 7-2inserting views, 3-19Internet Explorer settings, 2-1
Kkey process indicator views, 4-19
general properties, 4-21
Index-3
Llabels in views, 6-8list view general properties, 4-4list views
creating, 4-2overview, 4-1sorting, 4-5
Mmatrix views
using, 4-28medallion gauge, 4-22message sources, 1-3
Ooffline, saving reports, 3-27overview of Active Studio, 2-11
Pparameters
creating, 8-2custom, 8-6deleting, 8-19driving, 8-22driving example, 8-23editing, 8-19in report URLs, 8-20overview, 8-1
pie chart, 4-16pivoting
crosstab view, 4-27poll mode
refresh interval in reports, 3-22refresh interval in views, 6-12
popup blockers, 2-2printing options, 2-5printing reports, 3-25prompts
cascading, 8-20creating, 8-7deleting, 8-19driving, 8-22driving example, 8-23editing, 8-19ordering, 8-19overview, 8-1previewing, 8-19
purge data, 11-1
Rrefresh interval, poll mode
setting in reports, 3-22setting in views, 6-12
renaming reports, 3-15report creation and delivery, 3-1reports
adding titles, 3-17background color or image, 3-18columnar
creating, 3-7toolbars, 7-1
columnar, overview, 7-1copying, 10-3creating, 3-2deleting, 3-23deleting shared, 10-4editing, 3-17e-mailing, 3-24folders
creating, 10-1managing, 10-3permissions, 10-2
formatting titles, 3-18home tab defaults, 2-9loading indicator settings, 2-8moving, 10-4organizing, 10-1poll mode and refresh interval, 3-22printing, 3-25printing options, 2-5renaming, 3-15saving, 3-13saving offline, 3-15, 3-27sharing, 10-4URLs, 3-26viewing, 3-27
Reports Engine, 1-6reports in Active Studio interface, 2-13resizing views, 3-19rolling up
crosstab view, 4-27summary crosstab view, 4-28
row group view, 4-37
Ssaving offline, 3-15saving offline reports, 3-27saving reports, 3-13shading and borders in views, 6-3Shared Reports tab, 3-2sorting
lists, 4-5summary crosstab, 4-28
sources, message, 1-3statistical process control charts, 4-14string functions in calculations, A-1summaries in columnar views, 4-18summaries in crosstab views, 4-25summaries, in collapsed list view, 4-6summary crosstab view, using, 4-27summary crosstab views
filtering, 4-27rolling up and drilling down, 4-28sorting, 4-28summaries, 4-25
Index-4
summary functionsin a columnar report, 3-11
surface prompts views, 4-36surface prompts, creating, 5-24Synchronize Active Now boundaries with
Continuous time series/groups, 5-8
Ttab group view, 4-38tabs
Shared Reports, 3-2tabs in Active Studio interface, 2-12targets, drill across, 5-19templates in action form views, 4-31text alignment in views, 6-5text, inserting in columnar reports, 7-3themes in views, 6-9tiled reports, creating, 3-2time groups, 4-11titles, formatting, 3-18titles, in reports, 3-17toolbars
columnar reports, 7-1in columnar reports, 3-12
toolbars in Active Studio interface, 2-12top N data, 5-16
UURLs
parameters in, 8-20URLs for reports, 3-26URLs, drilling to, 5-20utility views, 4-36
Vvalue formatting in views, 6-10View Editor, 2-14, 3-17view editor
driving, 8-22View Editor in Active Studio interface, 2-14View Tasks/Options list in Active Studio
interface, 2-13viewing reports, 3-27views
action formcreating, 4-33example, 4-32overview, 4-31templates, 4-31
action list, 4-6active data, 6-11adding calculations, 5-21adding surface prompts, 5-24axis properties, 6-2borders and shading, 6-3changing type, 3-20charts
creating, 4-8
general properties, 4-10overview, 4-7pie chart, 4-16statistical process control, 4-14
collapsed list, 4-6column group, 4-37columnar, 4-17
general properties, 4-18summaries, 4-18
container, 4-37creating lists, 4-2crosstab, 4-23
filtering, 4-26general properties, 4-25, 4-29pivoting, 4-27rolling up and drilling down, 4-27summaries, 4-25using, 4-26
dashboard, 4-40data labels, 6-8deleting, 3-19drilling down, 5-17drilling hierarchies, 5-18drilling overview, 5-16drilling through, 5-17drilling up, 5-17Excel, 4-29
performance tips, 4-31using, 4-30
external content, 4-35creating, 4-35
filtering data in, 5-1font formatting, 6-8general properties, 6-2
lists, 4-4inserting, 3-19key process indicator
general properties, 4-21key process indicators, 4-19lists, 4-1
sorting, 4-5matrix, 4-28poll mode and refresh interval, 6-12resizing, 3-19row group, 4-37spreadsheet, 4-28summary crosstab
filtering, 4-27rolling up and drilling down, 4-28sorting, 4-28summaries, 4-25using, 4-27
surface prompts, 4-36tab group, 4-38text alignment, 6-5themes, 6-9top N data, 5-16utility, 4-36value formatting, 6-10