Oracle 10g Performance Enhancements / Features on...
39
Transcript of Oracle 10g Performance Enhancements / Features on...

Oracle 10g Performance Enhancements / Features on
zLinux
Thomas NiewelPrincipal Sales ConsultantBusiness Unit Database
Oracle Germany
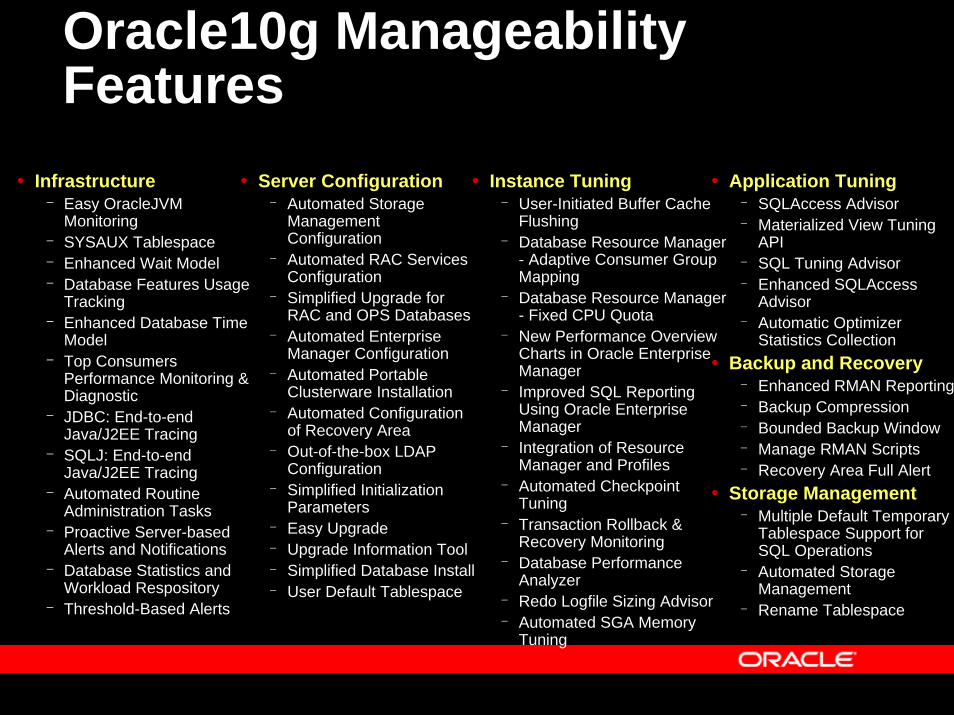
Oracle10g Manageability Features
Infrastructure– Easy OracleJVM
Monitoring– SYSAUX Tablespace– Enhanced Wait Model– Database Features Usage
Tracking– Enhanced Database Time
Model– Top Consumers
Performance Monitoring & Diagnostic
– JDBC: End-to-end Java/J2EE Tracing
– SQLJ: End-to-end Java/J2EE Tracing
– Automated Routine Administration Tasks
– Proactive Server-based Alerts and Notifications
– Database Statistics and Workload Respository
– Threshold-Based Alerts
Server Configuration– Automated Storage
Management Configuration
– Automated RAC Services Configuration
– Simplified Upgrade for RAC and OPS Databases
– Automated Enterprise Manager Configuration
– Automated Portable Clusterware Installation
– Automated Configuration of Recovery Area
– Out-of-the-box LDAP Configuration
– Simplified Initialization Parameters
– Easy Upgrade– Upgrade Information Tool– Simplified Database Install– User Default Tablespace
Instance Tuning– User-Initiated Buffer Cache
Flushing– Database Resource Manager
- Adaptive Consumer Group Mapping
– Database Resource Manager - Fixed CPU Quota
– New Performance Overview Charts in Oracle Enterprise Manager
– Improved SQL Reporting Using Oracle Enterprise Manager
– Integration of Resource Manager and Profiles
– Automated Checkpoint Tuning
– Transaction Rollback & Recovery Monitoring
– Database Performance Analyzer
– Redo Logfile Sizing Advisor– Automated SGA Memory
Tuning
Application Tuning– SQLAccess Advisor– Materialized View Tuning
API– SQL Tuning Advisor– Enhanced SQLAccess
Advisor– Automatic Optimizer
Statistics CollectionBackup and Recovery
– Enhanced RMAN Reporting– Backup Compression– Bounded Backup Window– Manage RMAN Scripts– Recovery Area Full Alert
Storage Management– Multiple Default Temporary
Tablespace Support for SQL Operations
– Automated Storage Management
– Rename Tablespace
Oracle 10g on z/Linux
The focus of this presentation is z/Linux(and a little bit generic functionality)
• Sizing the Database Cache
• Async I/O
• XSTOR Page Migrations if running under VM
• Some important Oracle 10g features

Oracle 10g on z/LinuxStorage issues
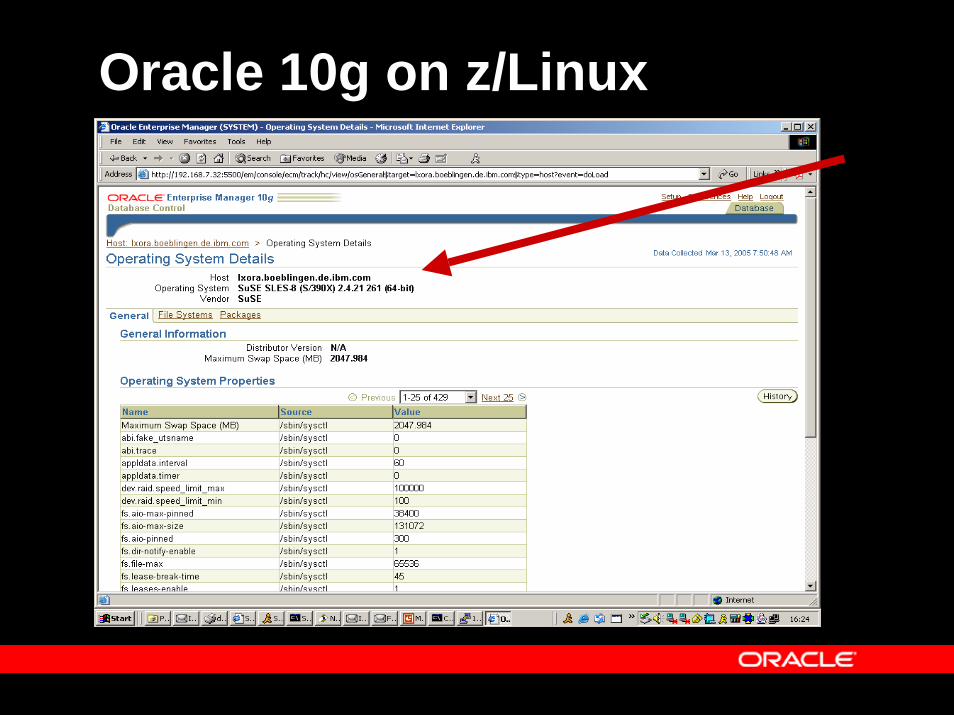
Oracle 10g on z/Linux
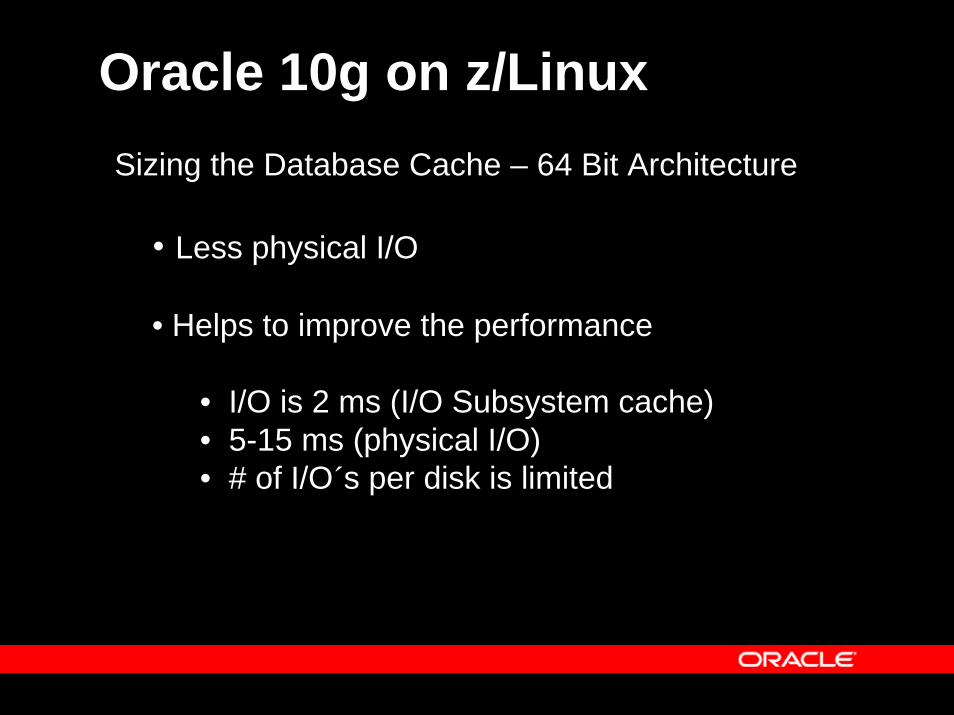
Oracle 10g on z/LinuxSizing the Database Cache – 64 Bit Architecture
• Less physical I/O
• Helps to improve the performance
• I/O is 2 ms (I/O Subsystem cache)• 5-15 ms (physical I/O)• # of I/O´s per disk is limited
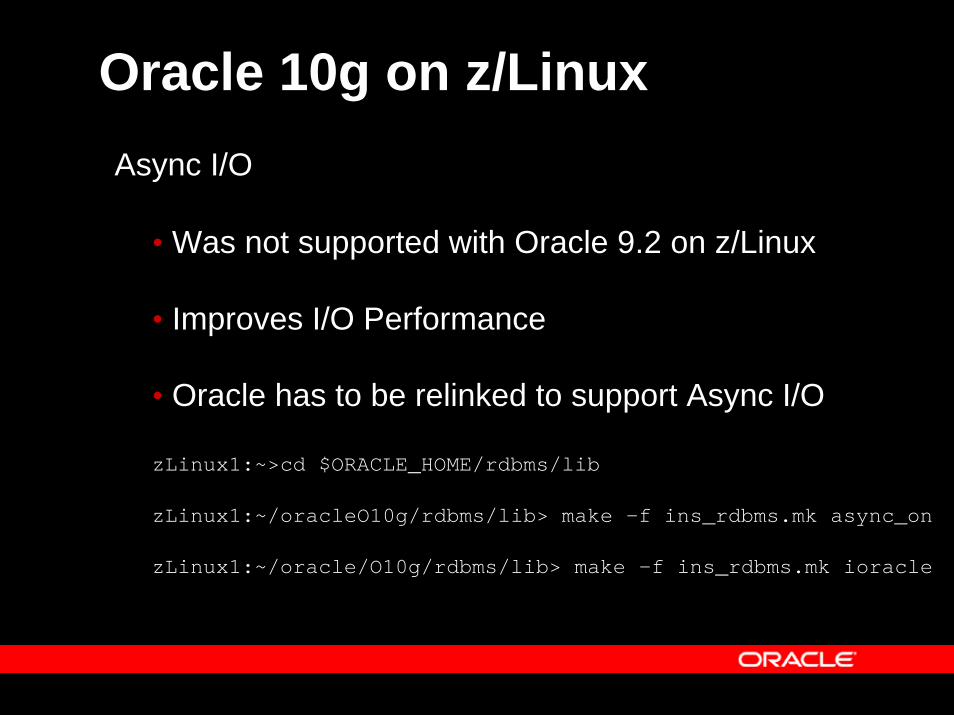
Oracle 10g on z/LinuxAsync I/O
• Was not supported with Oracle 9.2 on z/Linux
• Improves I/O Performance
• Oracle has to be relinked to support Async I/O
zLinux1:~>cd $ORACLE_HOME/rdbms/lib
zLinux1:~/oracleO10g/rdbms/lib> make -f ins_rdbms.mk async_on
zLinux1:~/oracle/O10g/rdbms/lib> make -f ins_rdbms.mk ioracle
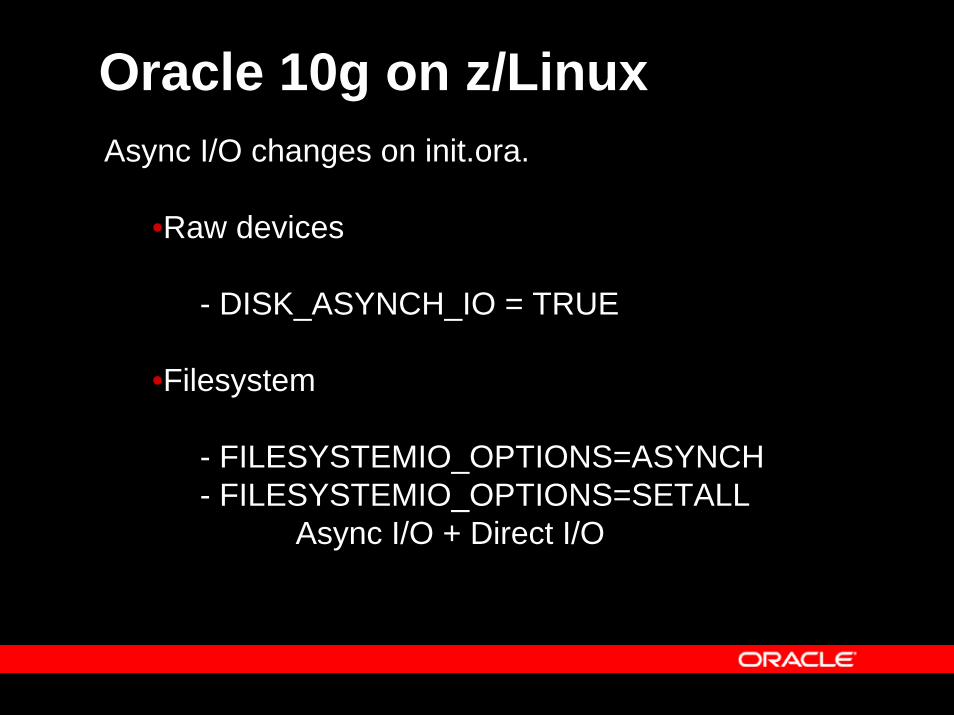
Oracle 10g on z/LinuxAsync I/O changes on init.ora.
•Raw devices
- DISK_ASYNCH_IO = TRUE
•Filesystem
- FILESYSTEMIO_OPTIONS=ASYNCH - FILESYSTEMIO_OPTIONS=SETALL
Async I/O + Direct I/O
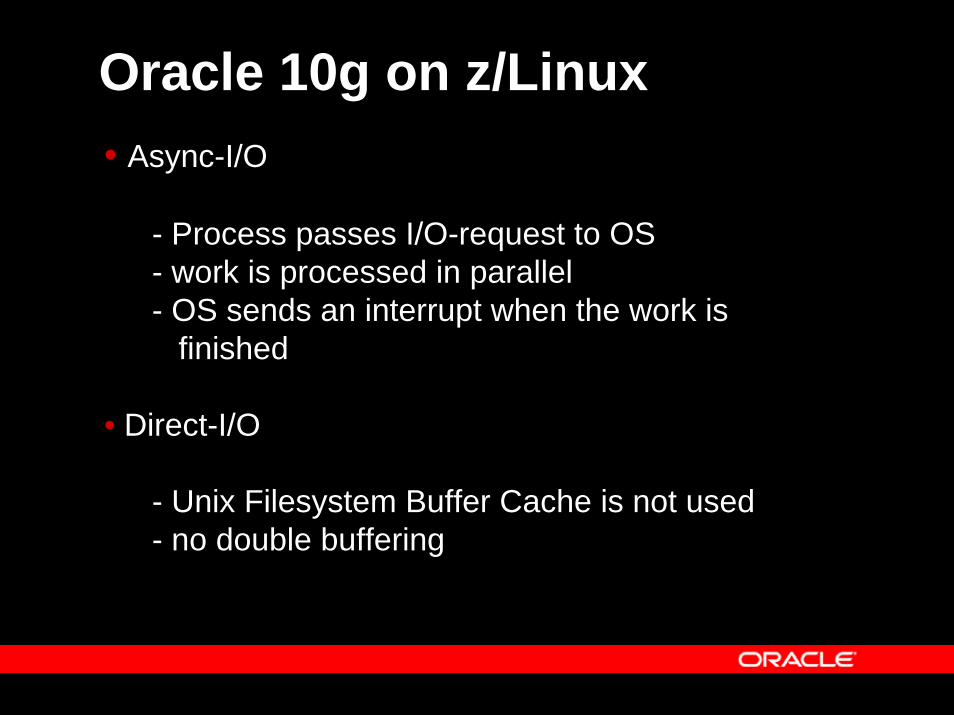
Oracle 10g on z/Linux• Async-I/O
- Process passes I/O-request to OS- work is processed in parallel- OS sends an interrupt when the work is
finished
• Direct-I/O
- Unix Filesystem Buffer Cache is not used- no double buffering
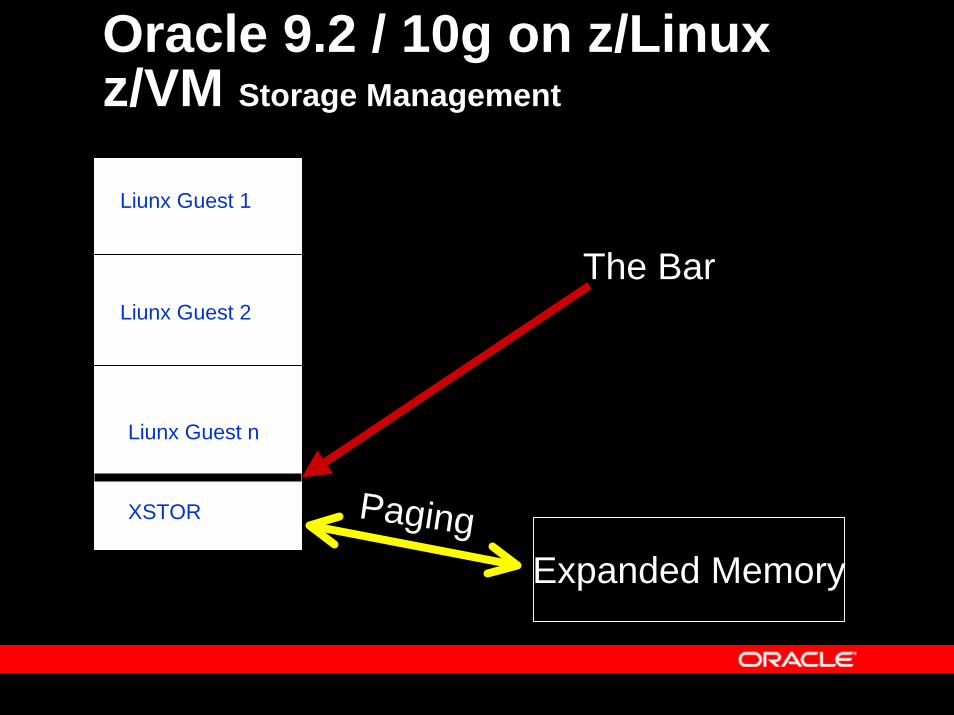
Oracle 9.2 / 10g on z/Linuxz/VM Storage Management
L
Liunx Guest 1
Liunx Guest 2
Liunx Guest n
XSTOR
The Bar
Expanded Memory
Paging
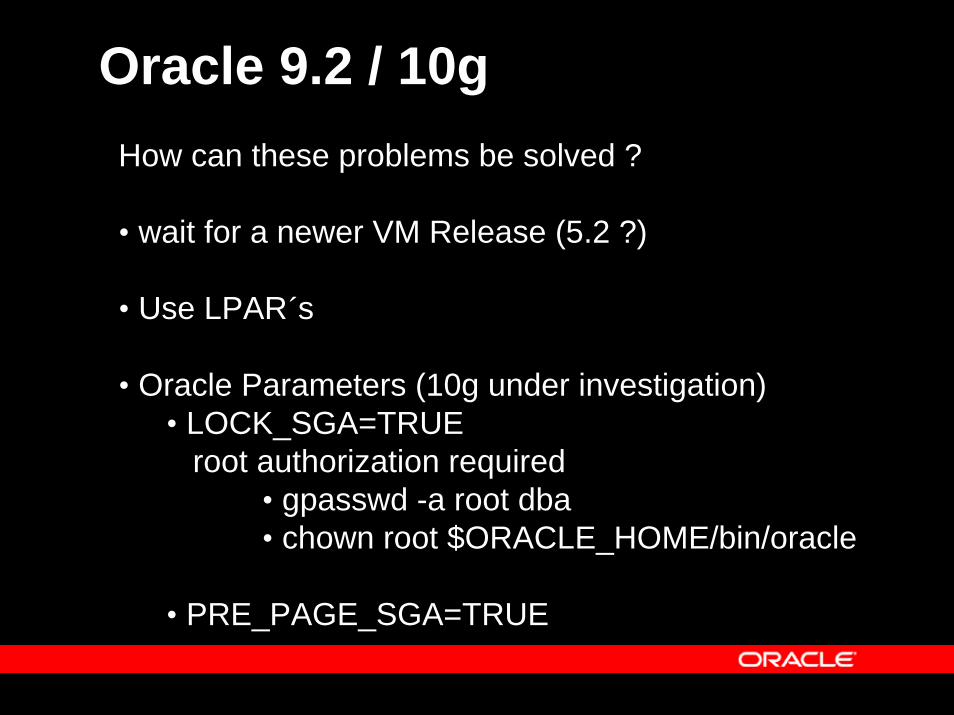
Oracle 9.2 / 10gHow can these problems be solved ?
• wait for a newer VM Release (5.2 ?)
• Use LPAR´s
• Oracle Parameters (10g under investigation)• LOCK_SGA=TRUE
root authorization required• gpasswd -a root dba• chown root $ORACLE_HOME/bin/oracle
• PRE_PAGE_SGA=TRUE

Some generic stuff
Automatic Statistics Gathering
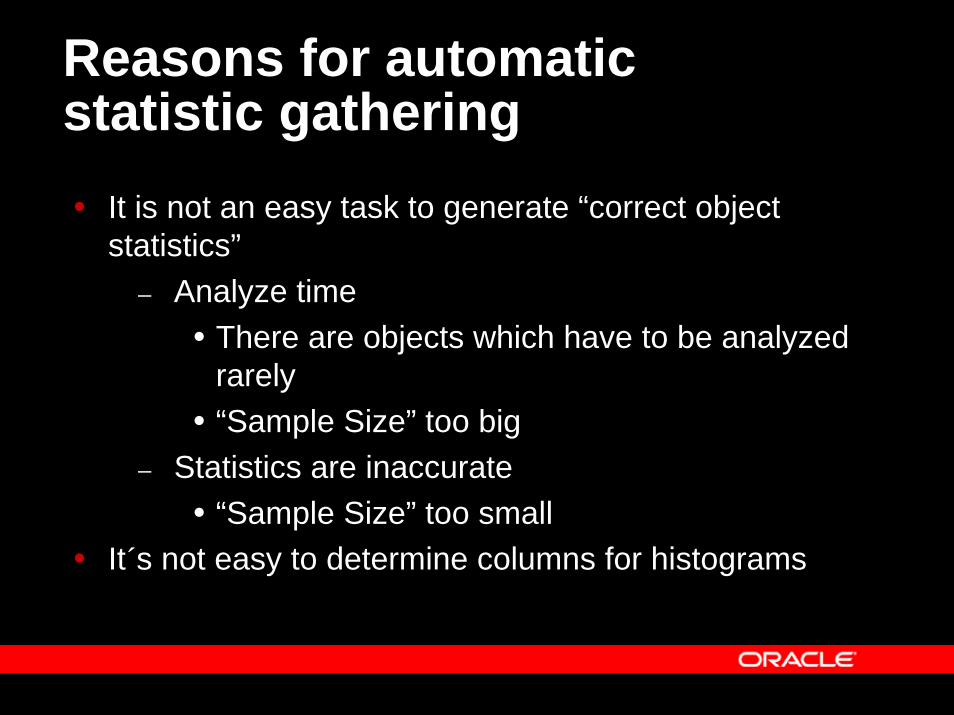
Reasons for automatic statistic gathering
It is not an easy task to generate “correct object statistics”
– Analyze timeThere are objects which have to be analyzed rarely“Sample Size” too big
– Statistics are inaccurate“Sample Size” too small
It´s not easy to determine columns for histograms
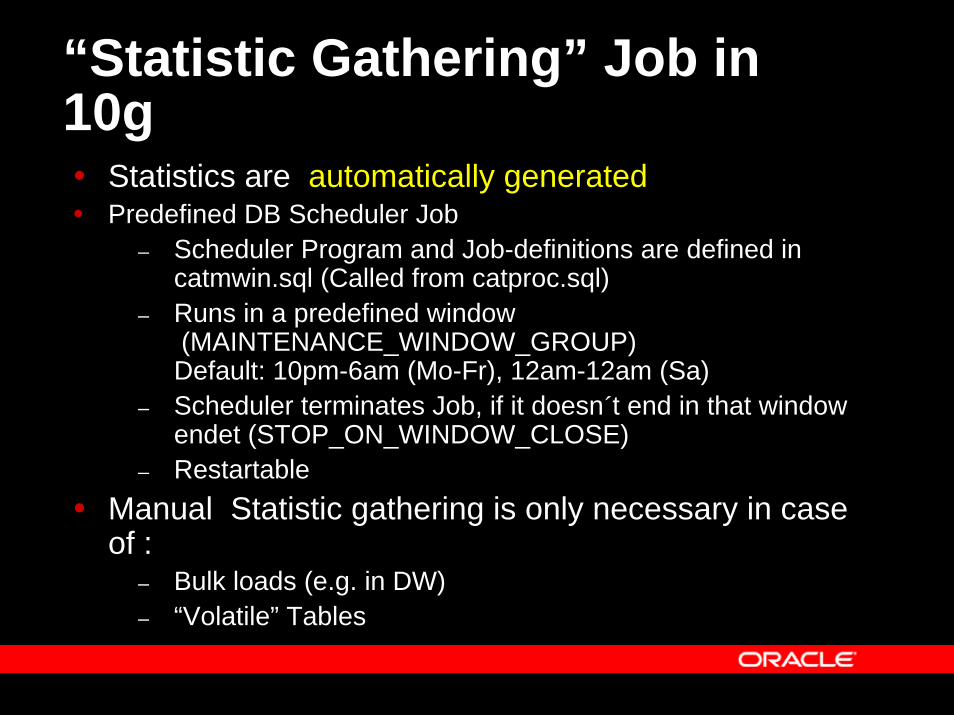
“Statistic Gathering” Job in 10g
Statistics are automatically generatedPredefined DB Scheduler Job
– Scheduler Program and Job-definitions are defined in catmwin.sql (Called from catproc.sql)
– Runs in a predefined window(MAINTENANCE_WINDOW_GROUP)Default: 10pm-6am (Mo-Fr), 12am-12am (Sa)
– Scheduler terminates Job, if it doesn´t end in that window endet (STOP_ON_WINDOW_CLOSE)
– RestartableManual Statistic gathering is only necessary in case of :
– Bulk loads (e.g. in DW)– “Volatile” Tables
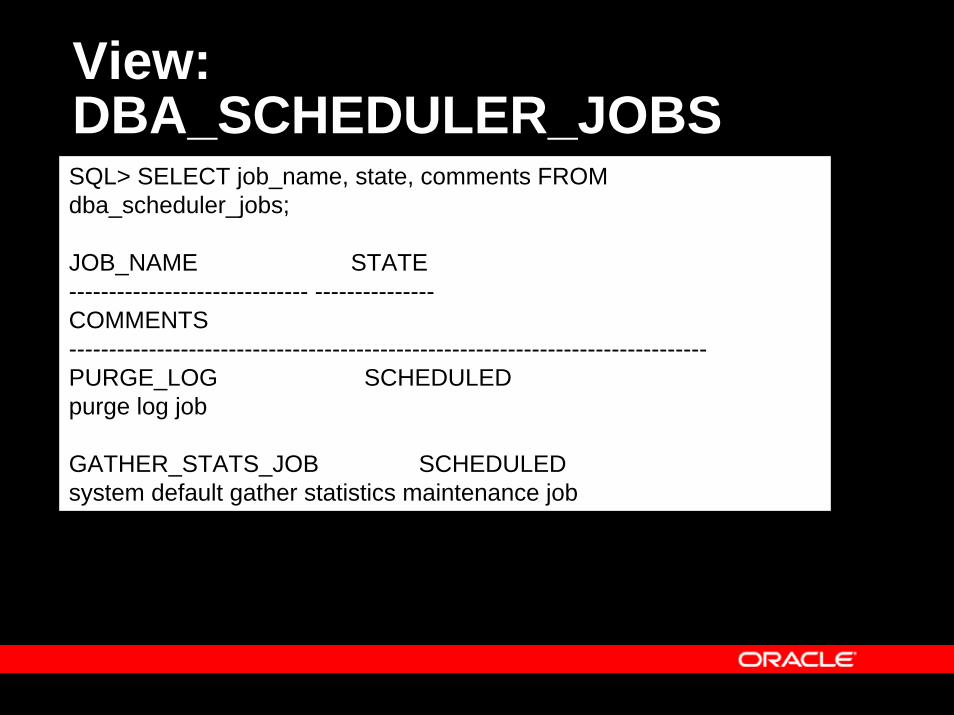
View: DBA_SCHEDULER_JOBSSQL> SELECT job_name, state, comments FROM dba_scheduler_jobs;
JOB_NAME STATE------------------------------ ---------------COMMENTS--------------------------------------------------------------------------------PURGE_LOG SCHEDULEDpurge log job
GATHER_STATS_JOB SCHEDULEDsystem default gather statistics maintenance job
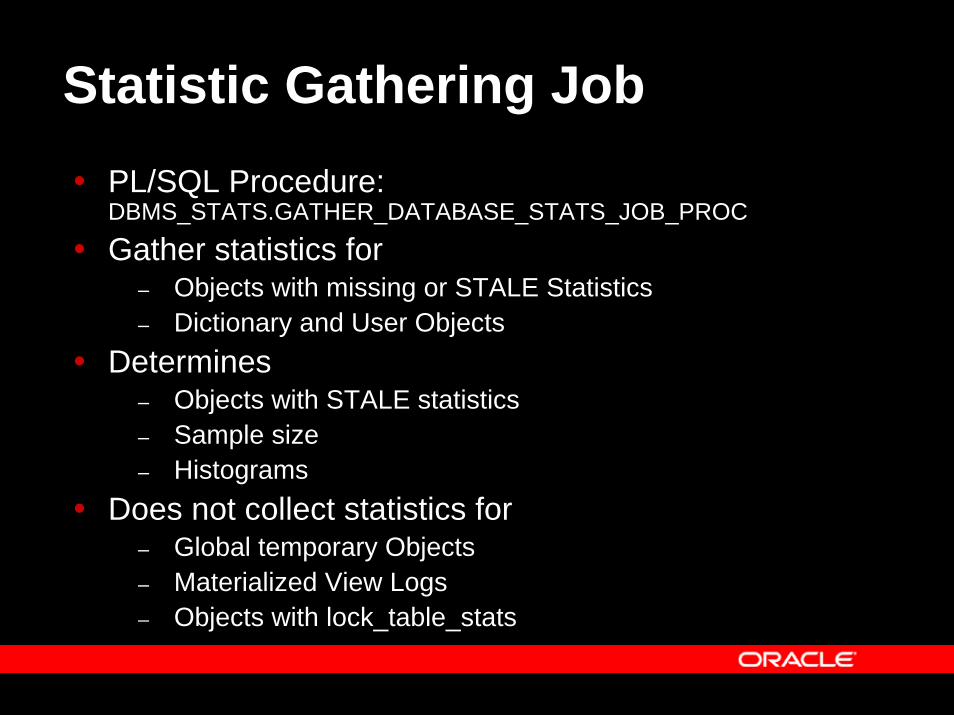
Statistic Gathering JobPL/SQL Procedure: DBMS_STATS.GATHER_DATABASE_STATS_JOB_PROC
Gather statistics for– Objects with missing or STALE Statistics– Dictionary and User Objects
Determines – Objects with STALE statistics– Sample size– Histograms
Does not collect statistics for– Global temporary Objects– Materialized View Logs– Objects with lock_table_stats
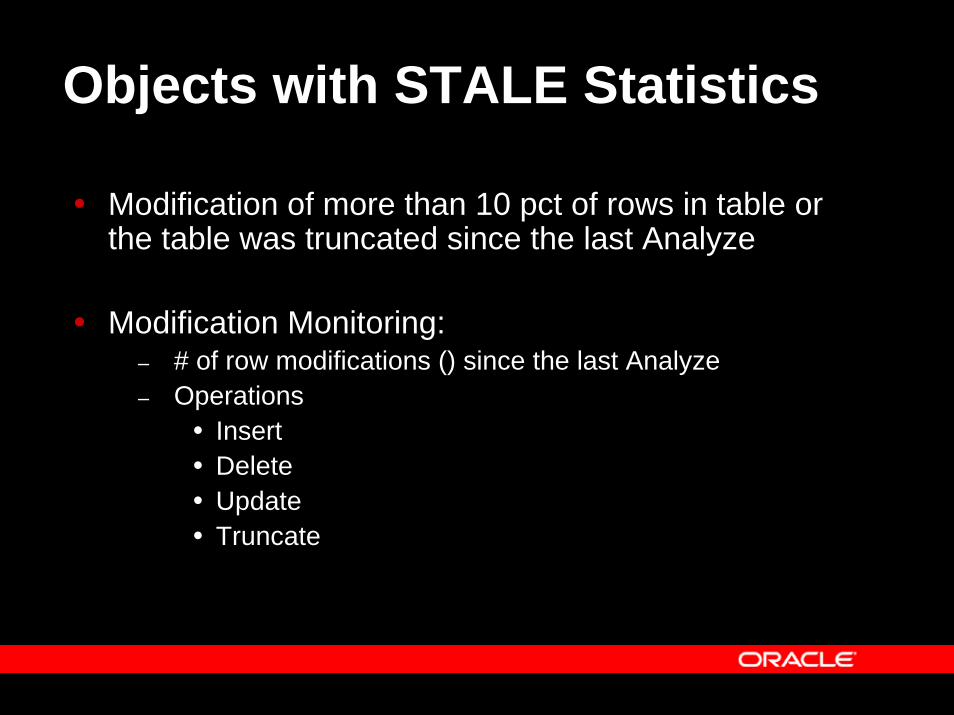
Objects with STALE Statistics
Modification of more than 10 pct of rows in table or the table was truncated since the last Analyze
Modification Monitoring:– # of row modifications () since the last Analyze – Operations
InsertDeleteUpdateTruncate
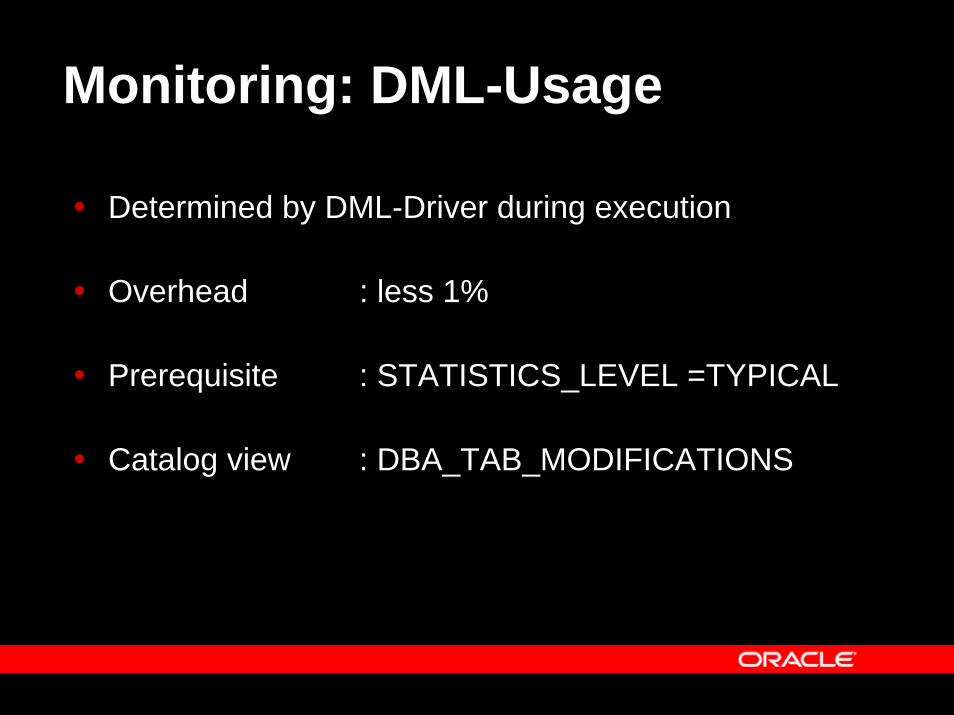
Monitoring: DML-Usage
Determined by DML-Driver during execution
Overhead : less 1%
Prerequisite : STATISTICS_LEVEL =TYPICAL
Catalog view : DBA_TAB_MODIFICATIONS

Monitoring DML Usage
SQL> SELECT * FROM user_tab_modifications;
TABLE_NAME PARTITION_NAME----------------------------------------- ------------------------------SUBPARTITION_NAME INSERTS UPDATES DELETES--------------------------------- ------------- --------------- -------------TIMESTAM TRU DROP_SEGMENTS---------------- ------ ---------------------------PLSQL_PROFILER_RUNS
2 4 0 04.11.04 NO 0
PLSQL_PROFILER_UNITS8 119 0
04.11.04 NO 0
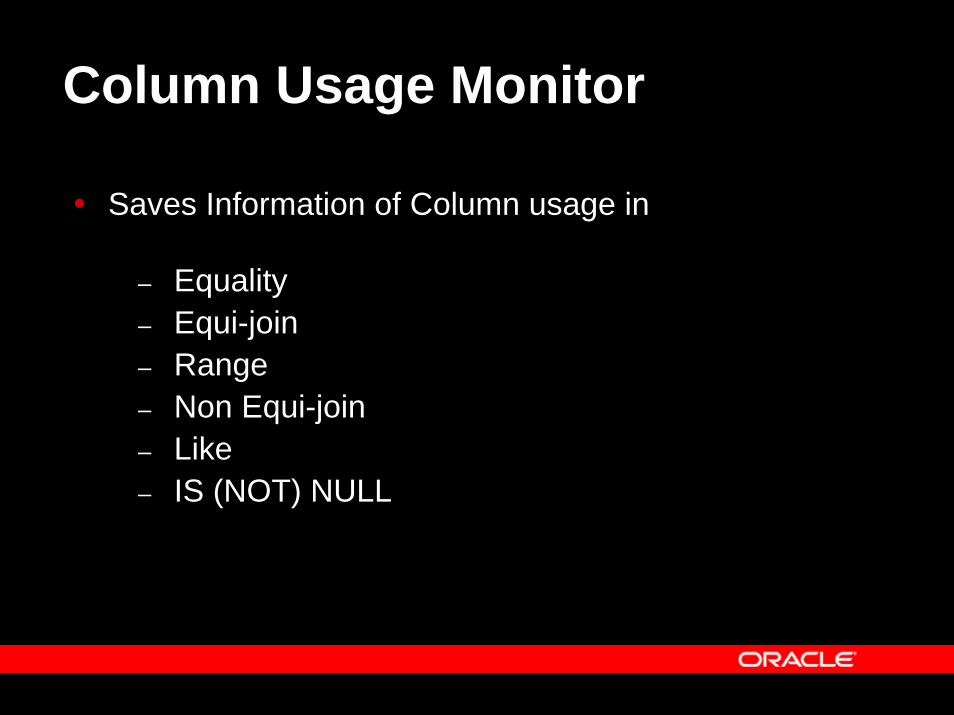
Column Usage Monitor
Saves Information of Column usage in
– Equality– Equi-join– Range– Non Equi-join– Like– IS (NOT) NULL
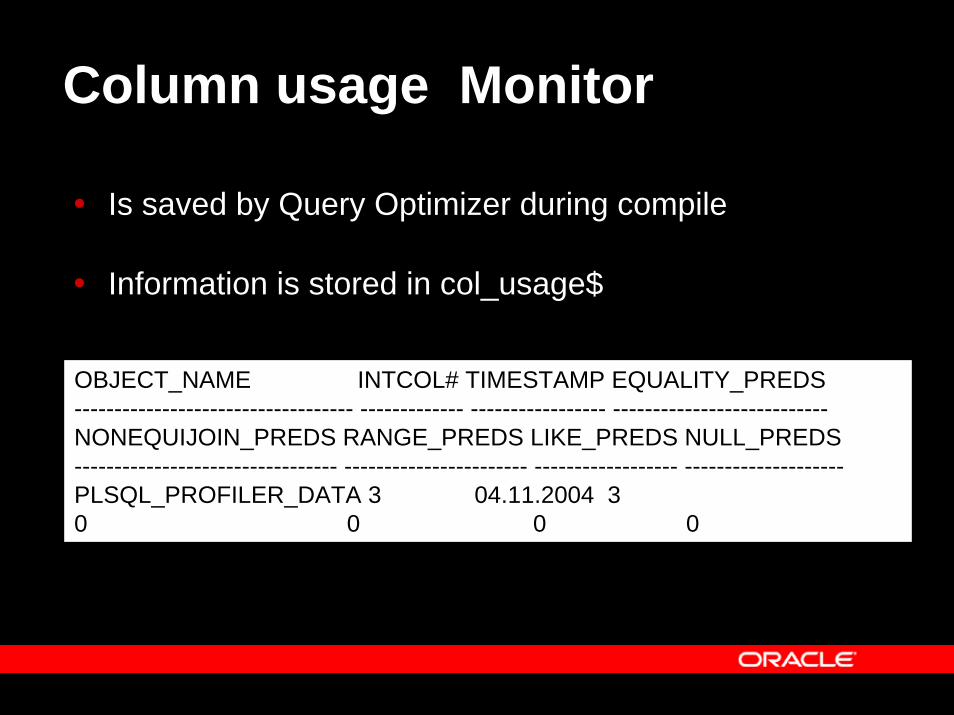
Column usage Monitor
Is saved by Query Optimizer during compile
Information is stored in col_usage$
OBJECT_NAME INTCOL# TIMESTAMP EQUALITY_PREDS----------------------------------- ------------- ----------------- ---------------------------NONEQUIJOIN_PREDS RANGE_PREDS LIKE_PREDS NULL_PREDS--------------------------------- ----------------------- ------------------ --------------------PLSQL_PROFILER_DATA 3 04.11.2004 3 0 0 0 0
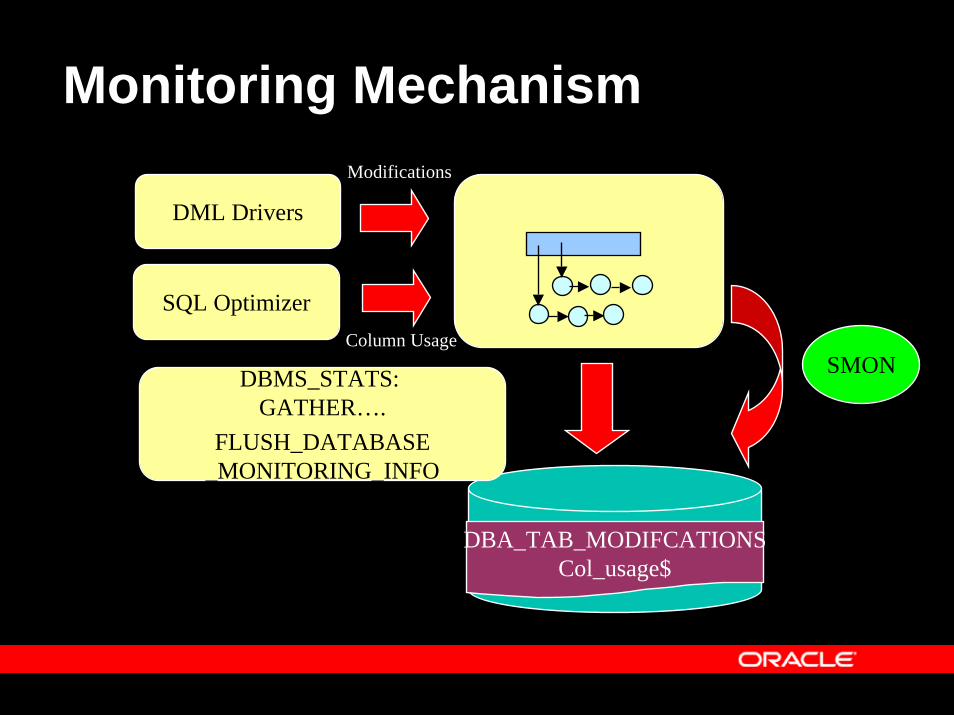
Monitoring Mechanism
DML Drivers
DBA_TAB_MODIFCATIONSCol_usage$
SMONDBMS_STATS: GATHER….
FLUSH_DATABASE_MONITORING_INFO
SQL Optimizer
Modifications
Column Usage
Tuning in Oracle 10g
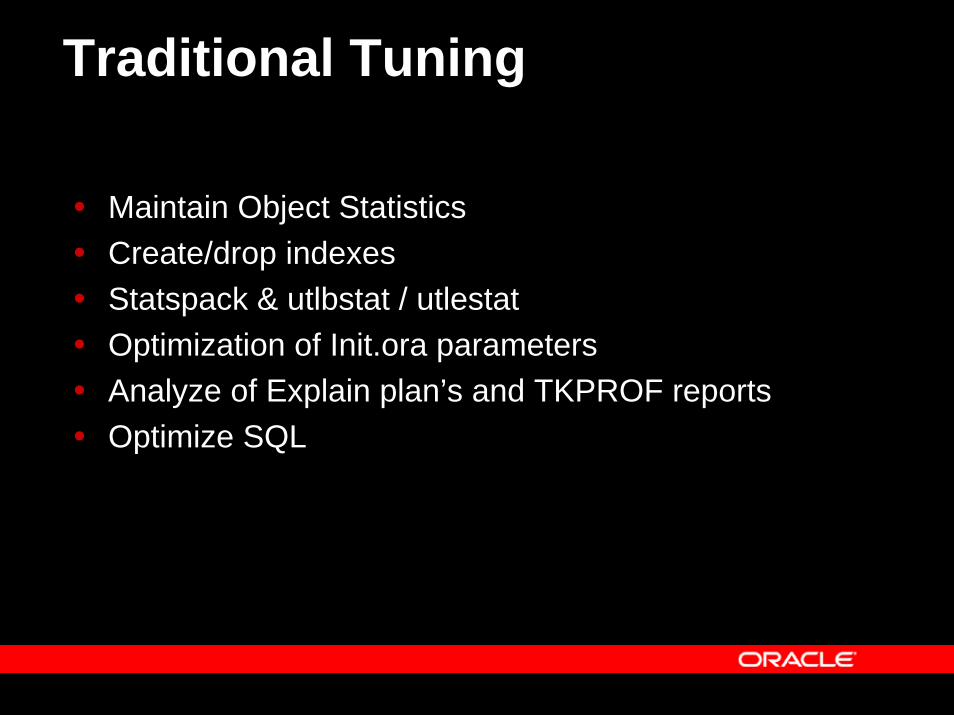
Traditional Tuning
Maintain Object StatisticsCreate/drop indexesStatspack & utlbstat / utlestat Optimization of Init.ora parametersAnalyze of Explain plan’s and TKPROF reportsOptimize SQL
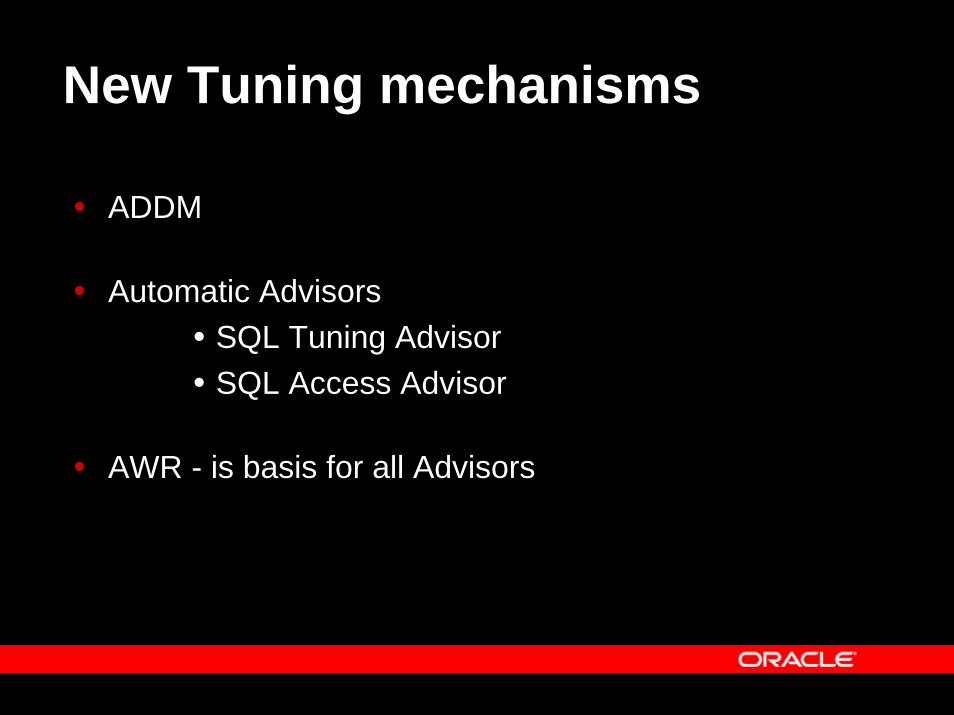
New Tuning mechanisms
ADDM
Automatic AdvisorsSQL Tuning Advisor SQL Access Advisor
AWR - is basis for all Advisors
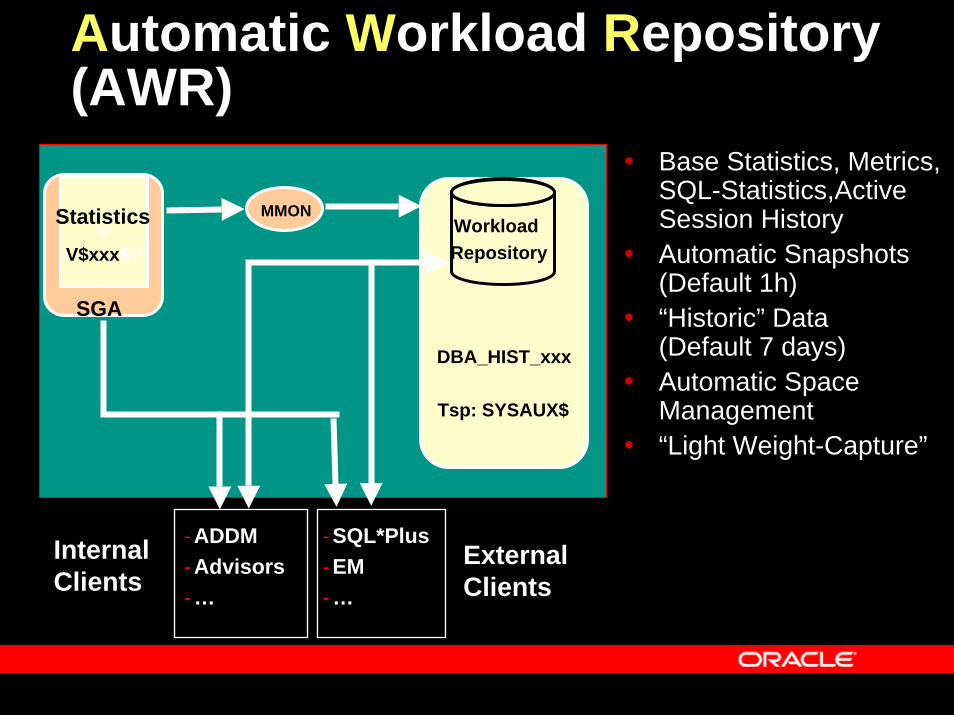
DBA_HIST_xxx
Workload Repository
VV$xxx$V
Statistics
SGA
Base Statistics, Metrics, SQL-Statistics,Active Session HistoryAutomatic Snapshots (Default 1h)“Historic” Data (Default 7 days)Automatic Space Management “Light Weight-Capture”
MMON
Internal Clients
External Clients
-SQL*Plus-EM-…
-ADDM-Advisors-…
Automatic Workload Repository (AWR)
Tsp: SYSAUX$
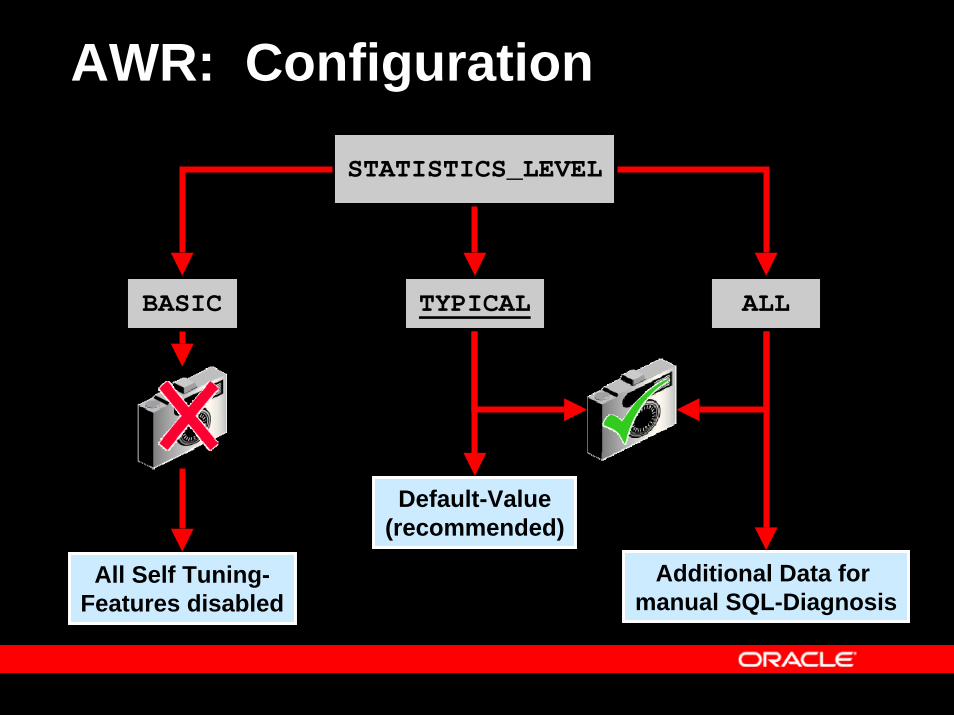
STATISTICS_LEVEL
BASIC TYPICAL ALL
Default-Value(recommended)
Additional Data for manual SQL-Diagnosis
All Self Tuning-Features disabled
AWR: Configuration
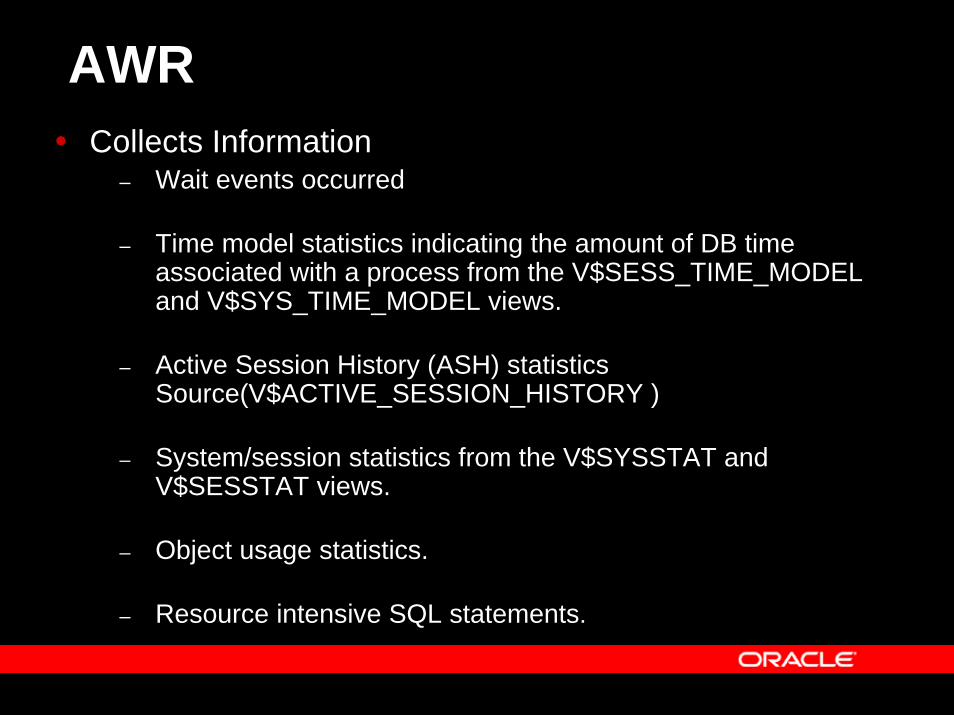
AWRCollects Information
– Wait events occurred
– Time model statistics indicating the amount of DB time associated with a process from the V$SESS_TIME_MODEL and V$SYS_TIME_MODEL views.
– Active Session History (ASH) statistics Source(V$ACTIVE_SESSION_HISTORY )
– System/session statistics from the V$SYSSTAT and V$SESSTAT views.
– Object usage statistics.
– Resource intensive SQL statements.
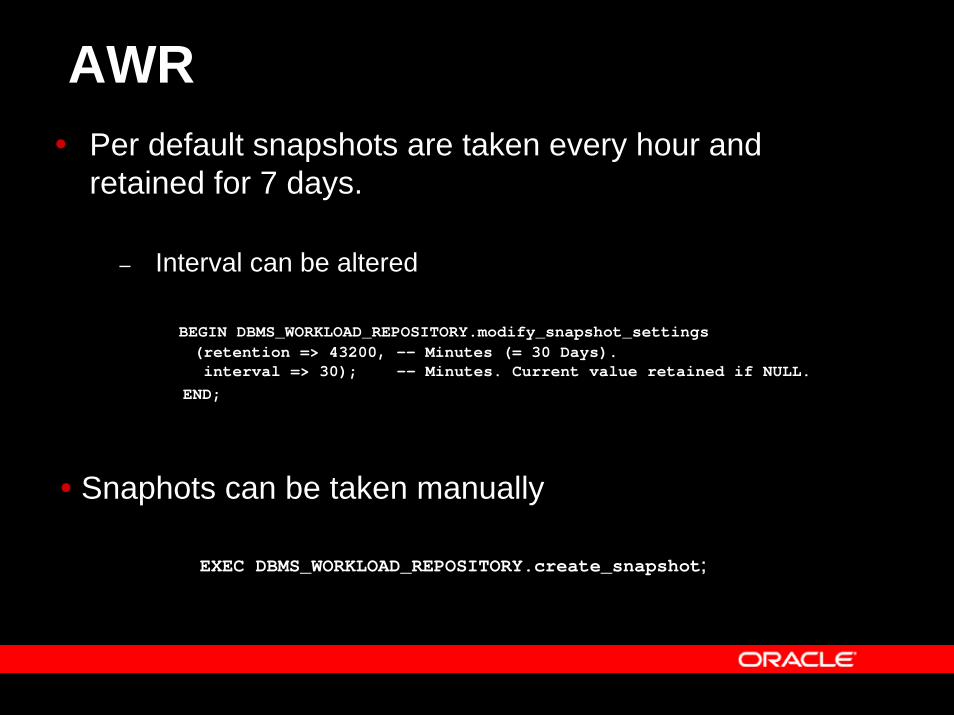
AWRPer default snapshots are taken every hour and retained for 7 days.
– Interval can be altered
BEGIN DBMS_WORKLOAD_REPOSITORY.modify_snapshot_settings(retention => 43200, -- Minutes (= 30 Days). interval => 30); -- Minutes. Current value retained if NULL.
END;
• Snaphots can be taken manually
EXEC DBMS_WORKLOAD_REPOSITORY.create_snapshot;
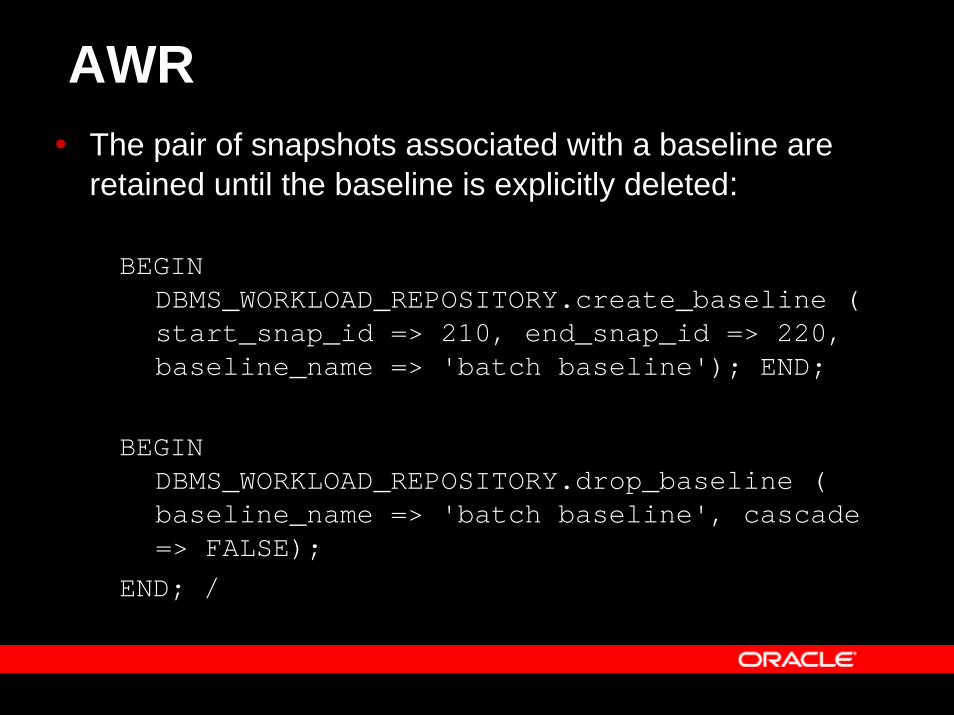
AWRThe pair of snapshots associated with a baseline are retained until the baseline is explicitly deleted:
BEGIN DBMS_WORKLOAD_REPOSITORY.create_baseline ( start_snap_id => 210, end_snap_id => 220, baseline_name => 'batch baseline'); END;
BEGIN DBMS_WORKLOAD_REPOSITORY.drop_baseline ( baseline_name => 'batch baseline', cascade => FALSE);
END; /
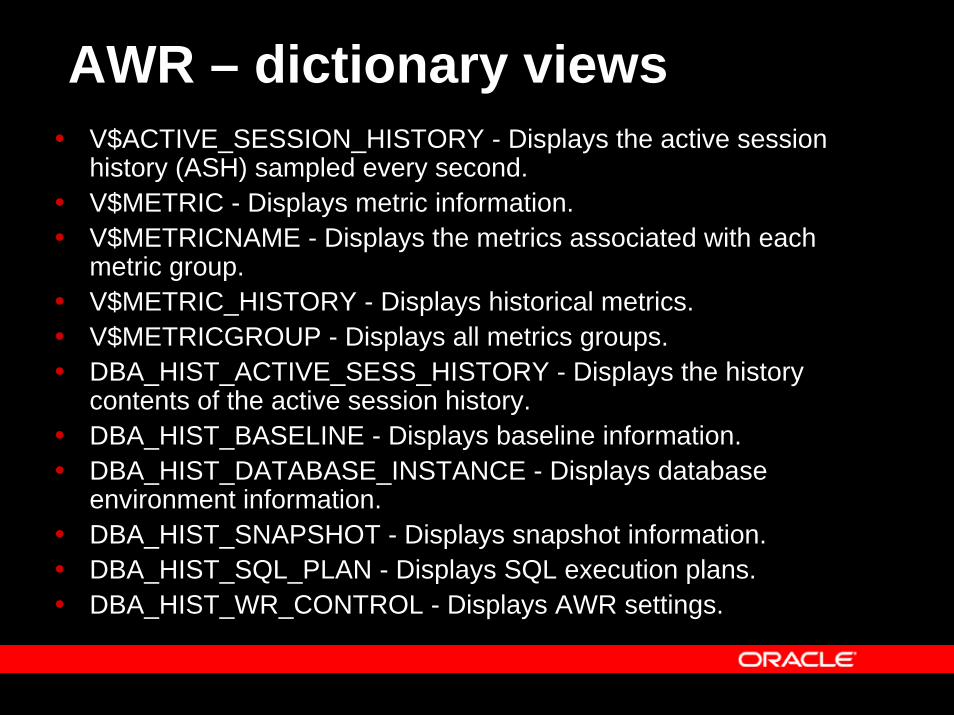
AWR – dictionary viewsV$ACTIVE_SESSION_HISTORY - Displays the active session history (ASH) sampled every second. V$METRIC - Displays metric information. V$METRICNAME - Displays the metrics associated with each metric group. V$METRIC_HISTORY - Displays historical metrics. V$METRICGROUP - Displays all metrics groups. DBA_HIST_ACTIVE_SESS_HISTORY - Displays the history contents of the active session history. DBA_HIST_BASELINE - Displays baseline information. DBA_HIST_DATABASE_INSTANCE - Displays database environment information. DBA_HIST_SNAPSHOT - Displays snapshot information. DBA_HIST_SQL_PLAN - Displays SQL execution plans. DBA_HIST_WR_CONTROL - Displays AWR settings.
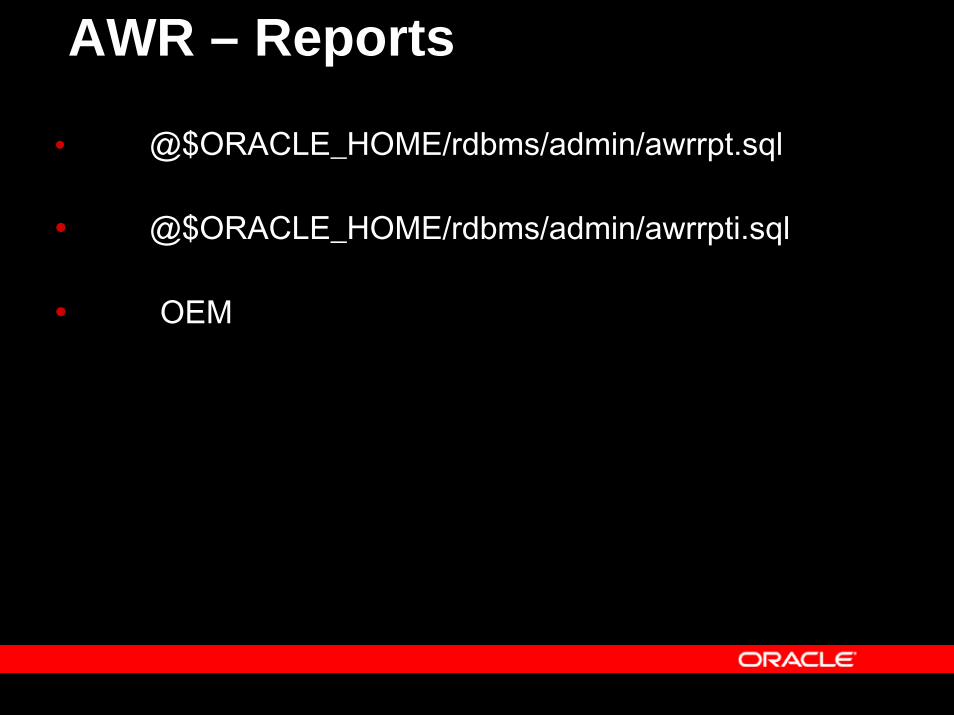
AWR – Reports
@$ORACLE_HOME/rdbms/admin/awrrpt.sql
@$ORACLE_HOME/rdbms/admin/awrrpti.sql
OEM
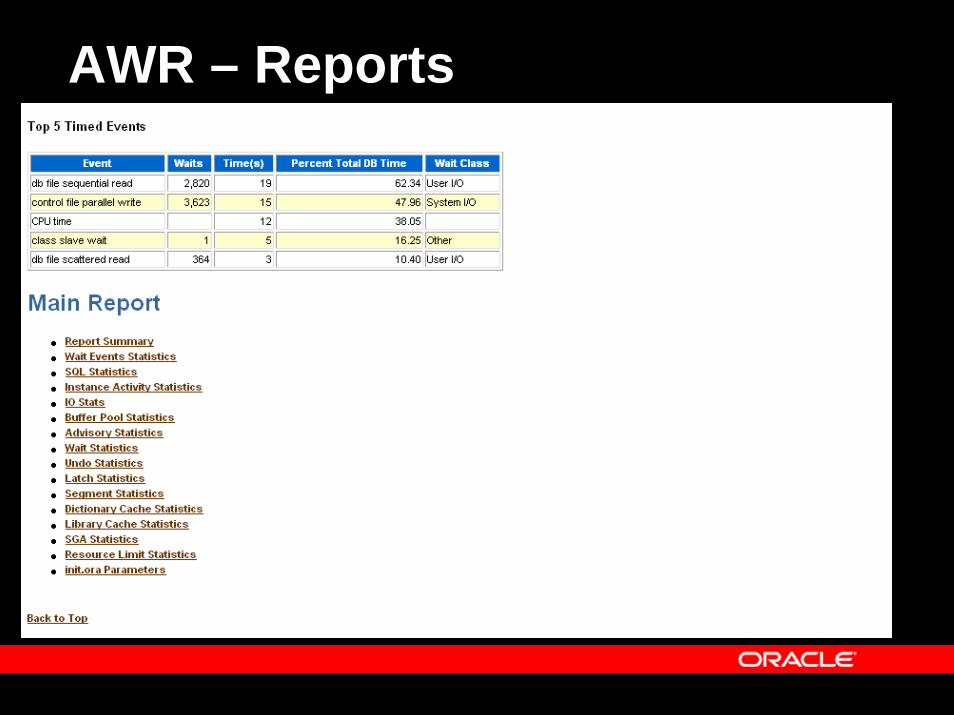
AWR – Reports
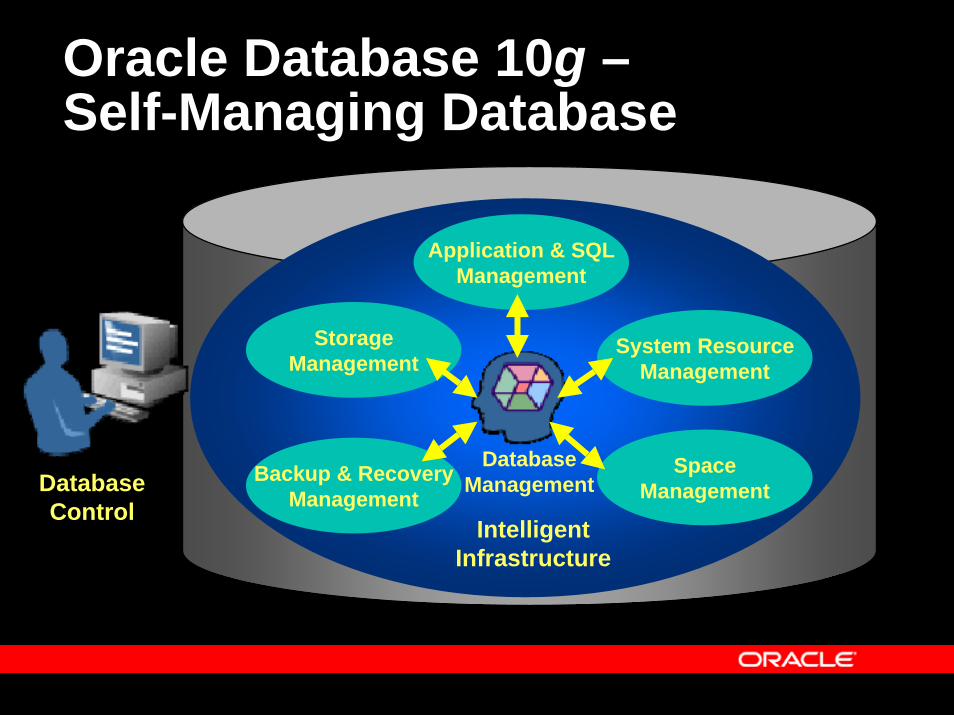
Intelligent Infrastructure
Application & SQLManagement
System ResourceManagement
SpaceManagement
Backup & RecoveryManagement
StorageManagement
Database Control
Database Management
Oracle Database 10g –Self-Managing Database
More Informationen
Note 276103.1: PERFORMANCE TUNING USING 10g ADVISORS AND MANAGEABILITY FEATURESNote 271196.1: Automatic SQL Tuning - SQL ProfilesNote 262687.1: How to use the SQL Tuning AdvisorOracle® Database Performance Tuning Guide