OR ROTEMAP TO NET ERO CARBON B 2030 1
30
Transcript of OR ROTEMAP TO NET ERO CARBON B 2030 1

OUR ROUTEMAP TO NET ZERO CARBON BY 2030 1

OUR ROUTEMAP TO NET ZERO CARBON BY 2030 2
Bristol Water supplies 1.2 million customers who depend on us every day to provide clean drinking water. This essential service utilises our most important natural resource. We collect water, store it, treat it to industry leading standards and deliver it to our customers’ taps. We’ve been doing this successfully for 175 years.
Foreword
Mel Karam, CEO of Bristol Water
We recognise that our role in society goes well beyond the business transaction of supplying water. It is impossible to disconnect what we do from caring for the environment and protecting it for our future. It’s a daily focus for us and is deeply embedded into how we run our business. Whether our focus is on protecting local water catchments, increasing biodiversity or on reducing our carbon impact, its always at the forefront of the decisions which we make.
In 2018 we made history by being the first water company to formalise our view of our role within society through our social purpose and our industry leading social contract. Our purpose is to have a positive impact on our customers, communities, employees and the environment. Our social contract provides a means of prioritising our actions and reporting on performance, allowing our stakeholders to hold us to account.
So now I am delighted to bring to you our plans to decarbonise our operations as the next important step in our history.
We have close connections with our local communities, and we have worked with local stakeholders to align our plans. Bristol City was the first city in the UK to declare a climate emergency, and other cities, towns and villages in our supply area have followed suit.
Through testing a range of options and scenarios, we think we can achieve carbon neutrality by 2030. As ever there are trade-offs and as a next step, we will seek feedback from our customers and stakeholders test the balance which we have struck.

OUR ROUTEMAP TO NET ZERO CARBON BY 2030 3
The four pathways to reduce our carbon footprint
Our proposed carbon routemap
Our proposed carbon routemap provides the best overall balance of cost versus benefit and is lower risk in the long-term.
We will continue our efficiency and renewable energy programmes and build on our plans in the period to 2025, with a view to significant investment in the period 2025 to 2030.
Our carbon footprint
We have identified a range of ways that we can meet the challenge of hitting Net Zero carbon by 2030. Almost half of our carbon footprint comes from the electricity used to treat water and pump it around our network. The gas generator at our largest water treatment works also contributes a significant amount to our footprint..
Main causes of GHG emissions
Fuel for generators and heating Other emissions Electricity from the grid
Contractor vehicle fuel Vehicle fuel
46% 46%
3% 5%
1%
Progress to date
Carbon emissions (CO2e) Population served
Carb
on e
mis
sion
s (th
ousa
nds
of to
nnes
of C
O2e
)
Popu
latio
n se
rved
(mill
ions
)
60
50
40
30
20
10
0
1.2
1.0
0.8
0.6
0.4
0.2
02011 2012 2013 2014 2015 2016 2017 2018 2019 2020 2021
MORE EFFICIENT USE OF WATERContinue to reduce leakage from our pipes and encourage our customers to use less water. We will need to offset the increase from a growing population in our area.
MORE EFFICIENT OPERATIONS
Design and operate our system to further reduce the amount of energy used to supply our
customers.
SWITCH TO LOW OR ZERO CARBON SOURCES OF ENERGYSwitching to renewable sources of energy.
REMOVE CARBON FROM THE ATMOSPHERE
Carbon offsets and sequestration. There is uncertainty around the real
benefit of offsets so we will take a cautious approach on their use.
RELATIVE COST lll CARBON SAVING lll LOCAL BENEFITS lll
RELATIVE COST lll CARBON SAVING lll LOCAL BENEFITS lll
RELATIVE COST lll CARBON SAVING lll LOCAL BENEFITS lll
RELATIVE COST lll CARBON SAVING lll LOCAL BENEFITS lll
Aim: NET
ZERO
Executive Summary
More efficient use
of water
More efficient
operations
Switch to low or zero sources of energyRemove carbon
from the atmosphere
Reduce water
demand
Energyefficiency
Vehicles Generate renewable electricity
Buy renewable
gas
Buy renewable electricity
Buy offsets
-5% -3% -5% -36% -42% -8% -1%
Our carbon baseline
20k tonnes CO2e per annum
OUR ROUTEMAP TO NET ZERO CARBON BY 2030 4
Background ..................................................................................... 5About us ............................................................................................. 7What do we mean by “Net Zero”? ........................................... 8
Our carbon footprint ................................................................... 9Progress to date ............................................................................ 10Gas fired generation .................................................................... 10Main causes of GHG emissions ............................................... 10
What can we do to reduce our carbon footprint? ...... 12
Our proposed carbon routemap .......................................... 18Our carbon routemap scenarios ............................................. 19Our proposed carbon routemap ............................................. 23
Integration with local strategies and plans .................. 25 Our local community ambition for carbon reduction ...... 28
Next steps ....................................................................................... 29
Contents
10
8
25
OUR ROUTEMAP TO NET ZERO CARBON BY 2030 5
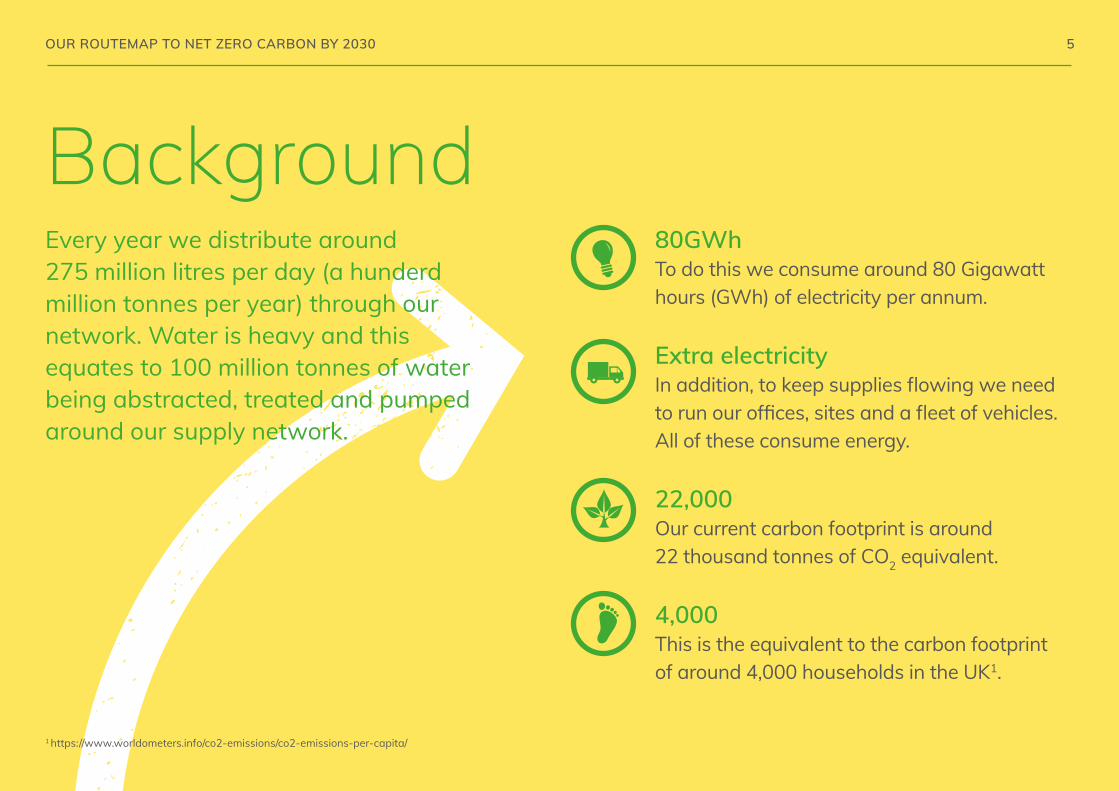
BackgroundEvery year we distribute around 275 million litres per day (a hunderd million tonnes per year) through our network. Water is heavy and this equates to 100 million tonnes of water being abstracted, treated and pumped around our supply network.
1 https://www.worldometers.info/co2-emissions/co2-emissions-per-capita/
80GWhTo do this we consume around 80 Gigawatt hours (GWh) of electricity per annum.
Extra electricityIn addition, to keep supplies flowing we need to run our offices, sites and a fleet of vehicles. All of these consume energy.
22,000Our current carbon footprint is around 22 thousand tonnes of CO2 equivalent.
4,000This is the equivalent to the carbon footprint of around 4,000 households in the UK1.

OUR ROUTEMAP TO NET ZERO CARBON BY 2030 6
Scientists have been debating the occurrence of man-induced climate change since the late 19th century. 100 years later in the 1990s, improved computer modelling combined with fieldwork studies formed a consensus position that greenhouse gas induced climate change was real and dangerous.
1995UN Conference of Parties (COP) members have been meeting every year since 1995 to discuss ways to stabilise greenhouse gas emissions. COP21 was held in December 2015 and resulted in the Paris Agreement, which governed climate change reduction measures from 2020.
2018In November 2018, Bristol was the first city in the UK to declare a climate emergency and to commit to net zero by 2030.
2019In 2019, the UK was the first major economy to make a legally binding commitment to reach net zero by 2050. In the same year, the water industry as a whole published a ‘Public Interest Commitment’, which set out five ambitious goals for the sector, including a pledge to reach net zero on operational emissions by 20302.
2020In 2020, Bristol City published its climate strategy and was joined by Greta Thunberg who addressed some 15,000 people at the Bristol Youth Strike for Climate event3.
In November 2020, Water UK published the Net Zero 2030 Routemap on behalf of the water industry4.
2021Now we look towards the long awaited COP26 in Glasgow in November 2021, where world leaders will discuss climate change and agree actions plans.
Background
2 https://www.water.org.uk/wp-content/uploads/2019/04/Public-Interest-Commitment.pdf3 https://www.bristolonecity.com/wp-content/uploads/2020/02/placeholder-climate-strategy.pdf4 https://www.water.org.uk/routemap2030/
OUR ROUTEMAP TO NET ZERO CARBON BY 2030 7
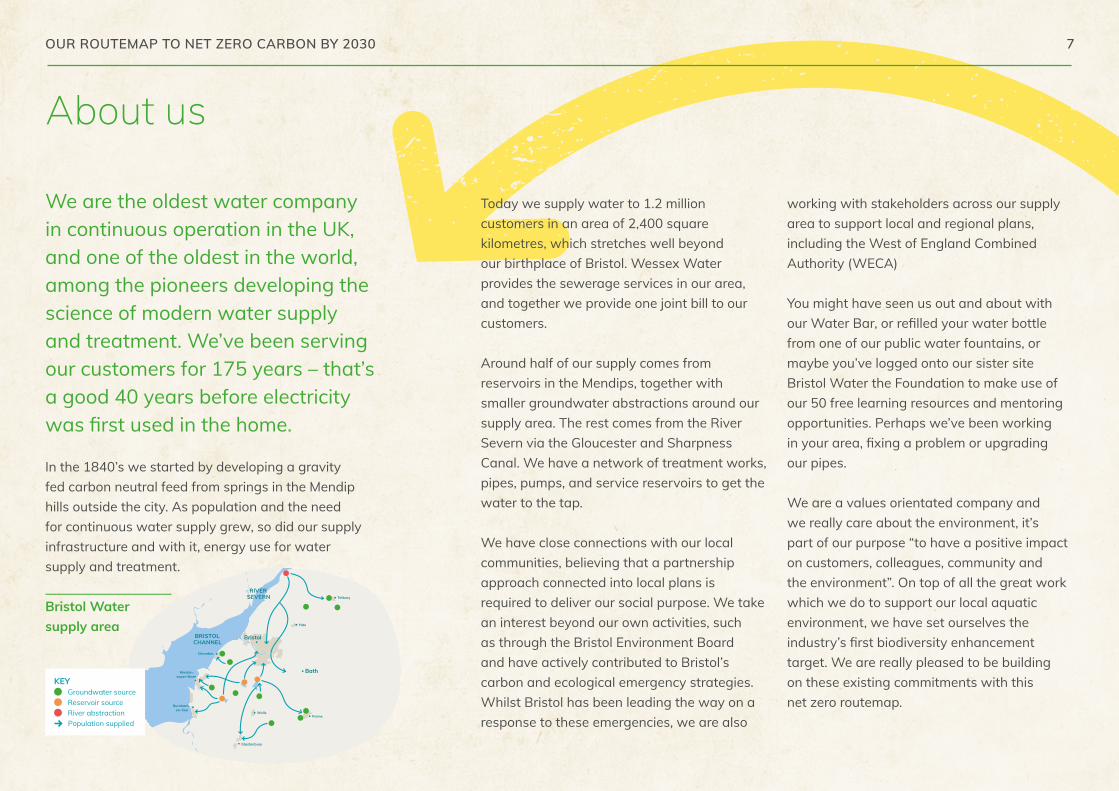
We are the oldest water company in continuous operation in the UK, and one of the oldest in the world, among the pioneers developing the science of modern water supply and treatment. We’ve been serving our customers for 175 years – that’s a good 40 years before electricity was first used in the home.
In the 1840’s we started by developing a gravity fed carbon neutral feed from springs in the Mendip hills outside the city. As population and the need for continuous water supply grew, so did our supply infrastructure and with it, energy use for water supply and treatment.
Today we supply water to 1.2 million customers in an area of 2,400 square kilometres, which stretches well beyond our birthplace of Bristol. Wessex Water provides the sewerage services in our area, and together we provide one joint bill to our customers.
Around half of our supply comes from reservoirs in the Mendips, together with smaller groundwater abstractions around our supply area. The rest comes from the River Severn via the Gloucester and Sharpness Canal. We have a network of treatment works, pipes, pumps, and service reservoirs to get the water to the tap.
We have close connections with our local communities, believing that a partnership approach connected into local plans is required to deliver our social purpose. We take an interest beyond our own activities, such as through the Bristol Environment Board and have actively contributed to Bristol’s carbon and ecological emergency strategies. Whilst Bristol has been leading the way on a response to these emergencies, we are also
working with stakeholders across our supply area to support local and regional plans, including the West of England Combined Authority (WECA)
You might have seen us out and about with our Water Bar, or refilled your water bottle from one of our public water fountains, or maybe you’ve logged onto our sister site Bristol Water the Foundation to make use of our 50 free learning resources and mentoring opportunities. Perhaps we’ve been working in your area, fixing a problem or upgrading our pipes.
We are a values orientated company and we really care about the environment, it’s part of our purpose “to have a positive impact on customers, colleagues, community and the environment”. On top of all the great work which we do to support our local aquatic environment, we have set ourselves the industry’s first biodiversity enhancement target. We are really pleased to be building on these existing commitments with this net zero routemap.
About us
Bristol Water supply area
Clevedon
FromeWells
Tetbury
Yate
Glastonbury
Weston-super-Mare
Burnham-on-Sea
Bristol
Bath
RIVER SEVERN
BRISTOL CHANNEL

OUR ROUTEMAP TO NET ZERO CARBON BY 2030 8
The gases that contribute to climate change are collectively known as “Greenhouse Gases” — or GHG.
Our ambition is that by 2030 we will not cause any GHG emissions to Earth’s atmosphere through our activities to supply water to customers.
To produce zero emissions in some areas of our operation may not be directly achievable, but in these cases we can look to remove GHG from the atmosphere by other means (e.g. tree planting).
Our emissions to the atmosphere are our “gross” emissions. Once we take account of any GHGs we have helped remove from the atmosphere these are “net” emissions, and this is our target area for net zero.
Carbon dioxide is one of the largest contributors to climate change, so the impact of other gases emitted to the atmosphere is often simplified by describing these in terms of their “CO2 equivalent”: the term used for this CO2e.
We have followed the water industry standard approach to calculate our carbon baseline.
What do we mean by “Net Zero”?
OUR ROUTEMAP TO NET ZERO CARBON BY 2030 9
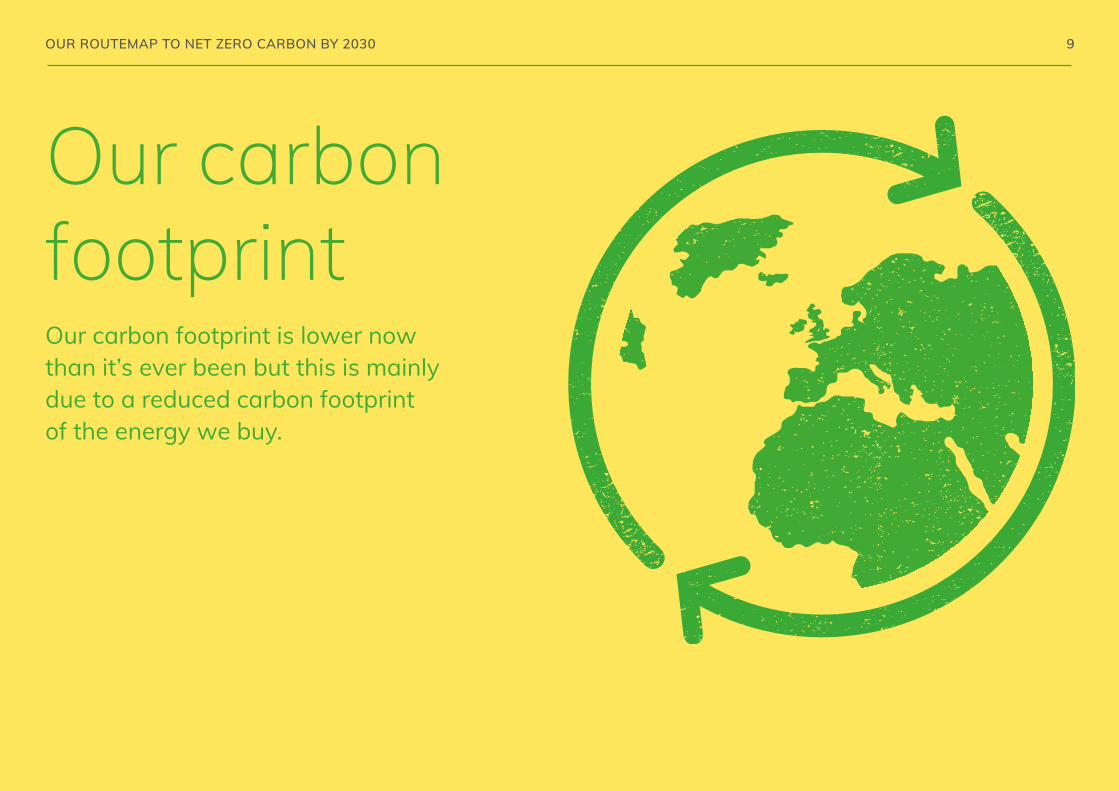
Our carbon footprintOur carbon footprint is lower now than it’s ever been but this is mainly due to a reduced carbon footprint of the energy we buy.
OUR ROUTEMAP TO NET ZERO CARBON BY 2030 10
Our carbon footprint
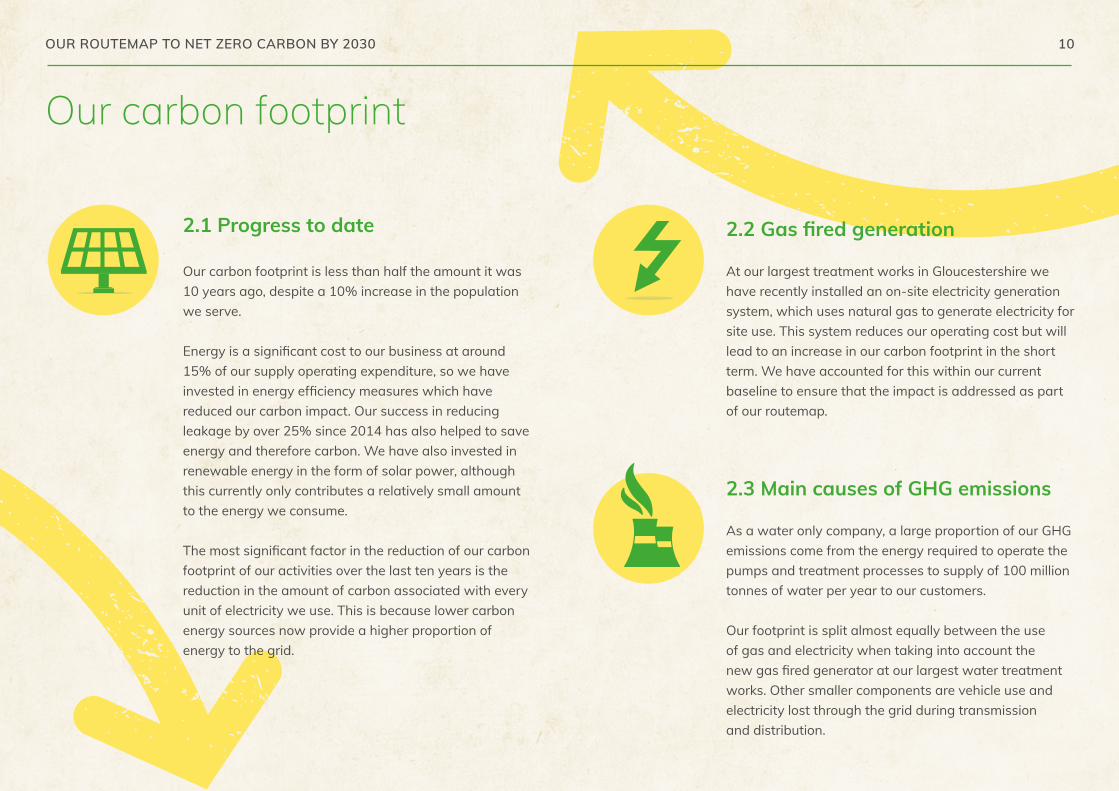
2.1 Progress to date
Our carbon footprint is less than half the amount it was 10 years ago, despite a 10% increase in the population we serve.
Energy is a significant cost to our business at around 15% of our supply operating expenditure, so we have invested in energy efficiency measures which have reduced our carbon impact. Our success in reducing leakage by over 25% since 2014 has also helped to save energy and therefore carbon. We have also invested in renewable energy in the form of solar power, although this currently only contributes a relatively small amount to the energy we consume.
The most significant factor in the reduction of our carbon footprint of our activities over the last ten years is the reduction in the amount of carbon associated with every unit of electricity we use. This is because lower carbon energy sources now provide a higher proportion of energy to the grid.
2.2 Gas fired generation
At our largest treatment works in Gloucestershire we have recently installed an on-site electricity generation system, which uses natural gas to generate electricity for site use. This system reduces our operating cost but will lead to an increase in our carbon footprint in the short term. We have accounted for this within our current baseline to ensure that the impact is addressed as part of our routemap.
2.3 Main causes of GHG emissions
As a water only company, a large proportion of our GHG emissions come from the energy required to operate the pumps and treatment processes to supply of 100 million tonnes of water per year to our customers.
Our footprint is split almost equally between the use of gas and electricity when taking into account the new gas fired generator at our largest water treatment works. Other smaller components are vehicle use and electricity lost through the grid during transmission and distribution.

OUR ROUTEMAP TO NET ZERO CARBON BY 2030 11
Main causes of GHG emissions
46% 46%
3% 5%
1%
Progress to date
Carbon emissions (CO2e) Population served
Carb
on e
mis
sion
s (th
ousa
nds
of to
nnes
of C
O2e
)
Popu
latio
n se
rved
(mill
ions
)
60
50
40
30
20
10
0
1.2
1.0
0.8
0. 6
0.4
0.2
02011 2012 2013 2014 2015 2016 2017 2018 2019 2020 2021
Our carbon footprint
Fuel for generators and heating Other emissions Electricity from the grid
Contractor vehicle fuel Vehicle fuel

OUR ROUTEMAP TO NET ZERO CARBON BY 2030 12
What can we do to reduce our carbon footprint?

OUR ROUTEMAP TO NET ZERO CARBON BY 2030 13
MORE EFFICIENT USE OF WATERContinue to reduce leakage from our pipes and encourage our customers to use less water. We will need to offset the increase from a growing population in our area.
MORE EFFICIENT OPERATIONS
Design and operate our system to further reduce the
amount of energy used to supply our customers.
SWITCH TO LOW OR ZERO CARBON SOURCES OF ENERGY Switching to renewable sources of energy.
REMOVE CARBON FROM THE
ATMOSPHERECarbon offsets and sequestration.
There is uncertainty around the real benefit of offsets so we will take a
cautious approach on their use.
RELATIVE COST lll CARBON SAVING lll LOCAL BENEFITS lll
RELATIVE COST lll CARBON SAVING lll LOCAL BENEFITS lll
RELATIVE COST lll CARBON SAVING lll LOCAL BENEFITS lll
RELATIVE COST lll CARBON SAVING lll LOCAL BENEFITS lll
Aim: NET
ZERO
What can we do to reduce our carbon footprint?There are four pathways which we can follow to help us to get to net zero:
OUR ROUTEMAP TO NET ZERO CARBON BY 2030 14
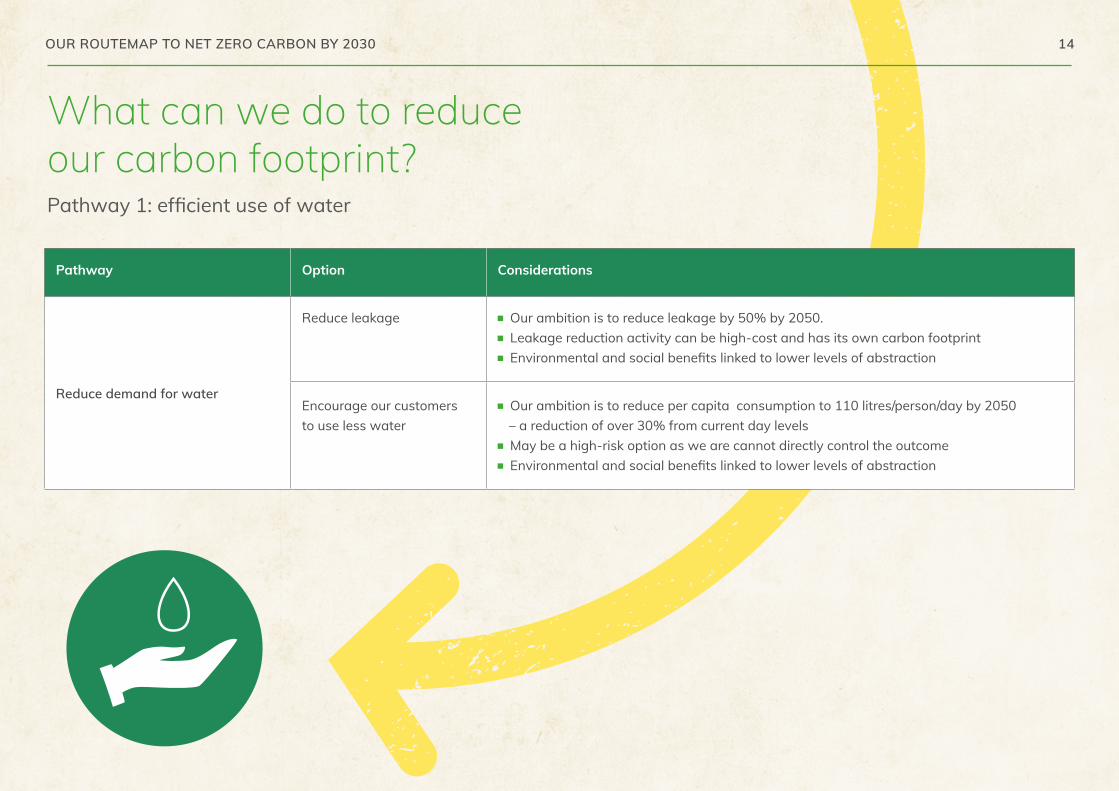
What can we do to reduce our carbon footprint?Pathway 1: efficient use of water
Pathway Option Considerations
Reduce demand for water
Reduce leakage Our ambition is to reduce leakage by 50% by 2050. Leakage reduction activity can be high-cost and has its own carbon footprint Environmental and social benefits linked to lower levels of abstraction
Encourage our customers to use less water
Our ambition is to reduce per capita consumption to 110 litres/person/day by 2050 – a reduction of over 30% from current day levels
May be a high-risk option as we are cannot directly control the outcome Environmental and social benefits linked to lower levels of abstraction
OUR ROUTEMAP TO NET ZERO CARBON BY 2030 15
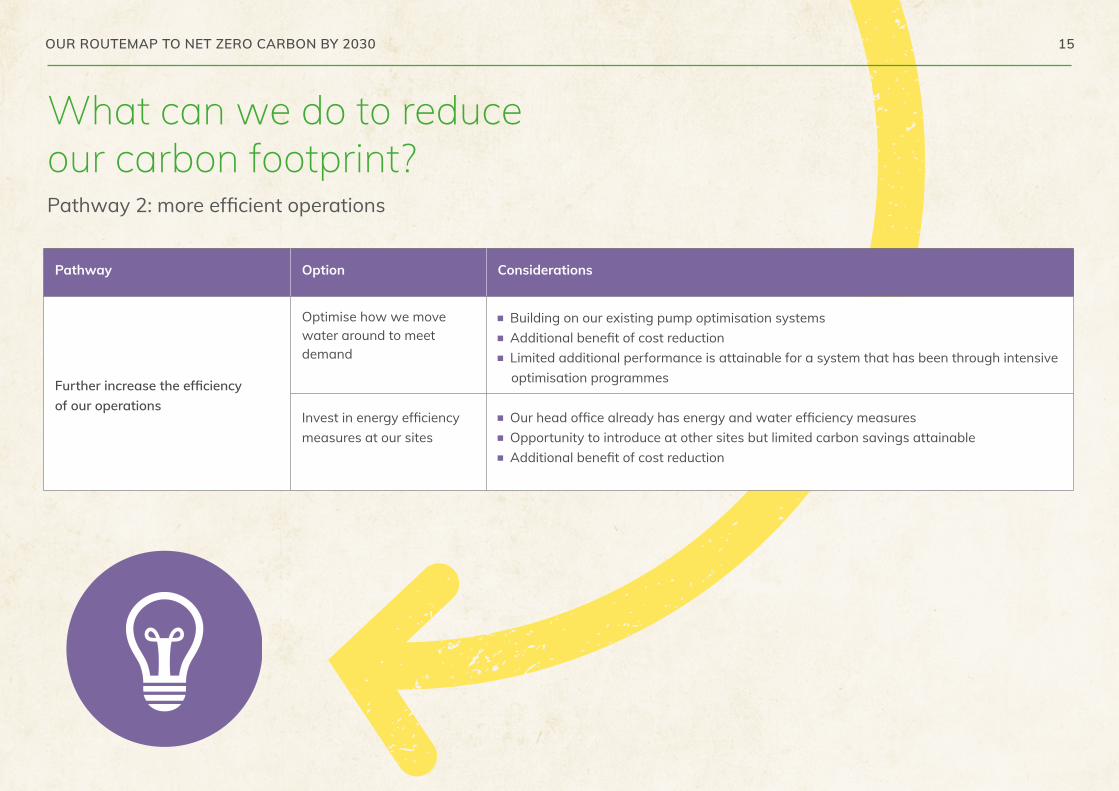
What can we do to reduce our carbon footprint?Pathway 2: more efficient operations
Pathway Option Considerations
Further increase the efficiency of our operations
Optimise how we move water around to meet demand
Building on our existing pump optimisation systems Additional benefit of cost reduction Limited additional performance is attainable for a system that has been through intensive
optimisation programmes
Invest in energy efficiency measures at our sites
Our head office already has energy and water efficiency measures Opportunity to introduce at other sites but limited carbon savings attainable Additional benefit of cost reduction

OUR ROUTEMAP TO NET ZERO CARBON BY 2030 16
What can we do to reduce our carbon footprint?Pathway 3: switch to low carbon or zero carbon sources of energy
Pathway Option Considerations
Switch to low or zero carbon energy sources
Invest in renewable energy generation at our sites (solar)
High certainty of carbon reduction Low net cost in long term but up front investment required Opportunity to link to community schemes Opportunity to meet between 5% and 50% of our energy needs
Switch to biofuels (for petrol generators, large vehicles)
Low risk technically but only a small proportion of our carbon footprint impacted Debate over whether biofuels are carbon neutral and they still release air pollutants
Replace our fleet with electric vehicles (EVs)
We currently have a fleet of 330 vans, company cars and lorries, with low use of electric vehicles Market and technology for electric vehicles is not fully mature – range uncertainty for larger vehicles and charging points are not always available
Switch to low carbon heating
Established technology such as heat pumps Limited impact as heating makes up 1% of our carbon footprint
Buy green electricity and gas, exploring innovation such as hydrogen-fired generation
Easy to achieve, low risk Would remove vast majority of our carbon footprint Expensive in short term with long-term cost uncertainty Does not have a net benefit to environment in the short term, but in theory helps to stimulate the market for green electricity and gas
OUR ROUTEMAP TO NET ZERO CARBON BY 2030 17
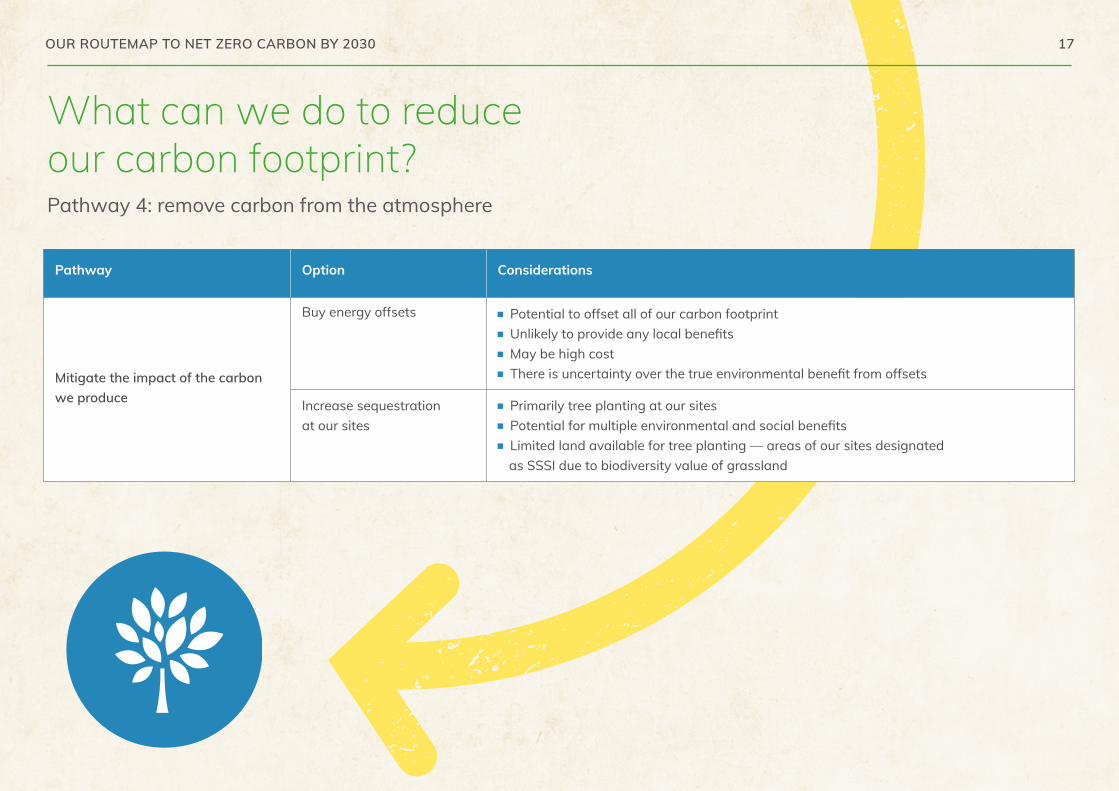
What can we do to reduce our carbon footprint?Pathway 4: remove carbon from the atmosphere
Pathway Option Considerations
Mitigate the impact of the carbon we produce
Buy energy offsets Potential to offset all of our carbon footprint Unlikely to provide any local benefits May be high cost There is uncertainty over the true environmental benefit from offsets
Increase sequestration at our sites
Primarily tree planting at our sites Potential for multiple environmental and social benefits Limited land available for tree planting — areas of our sites designated as SSSI due to biodiversity value of grassland
OUR ROUTEMAP TO NET ZERO CARBON BY 2030 18
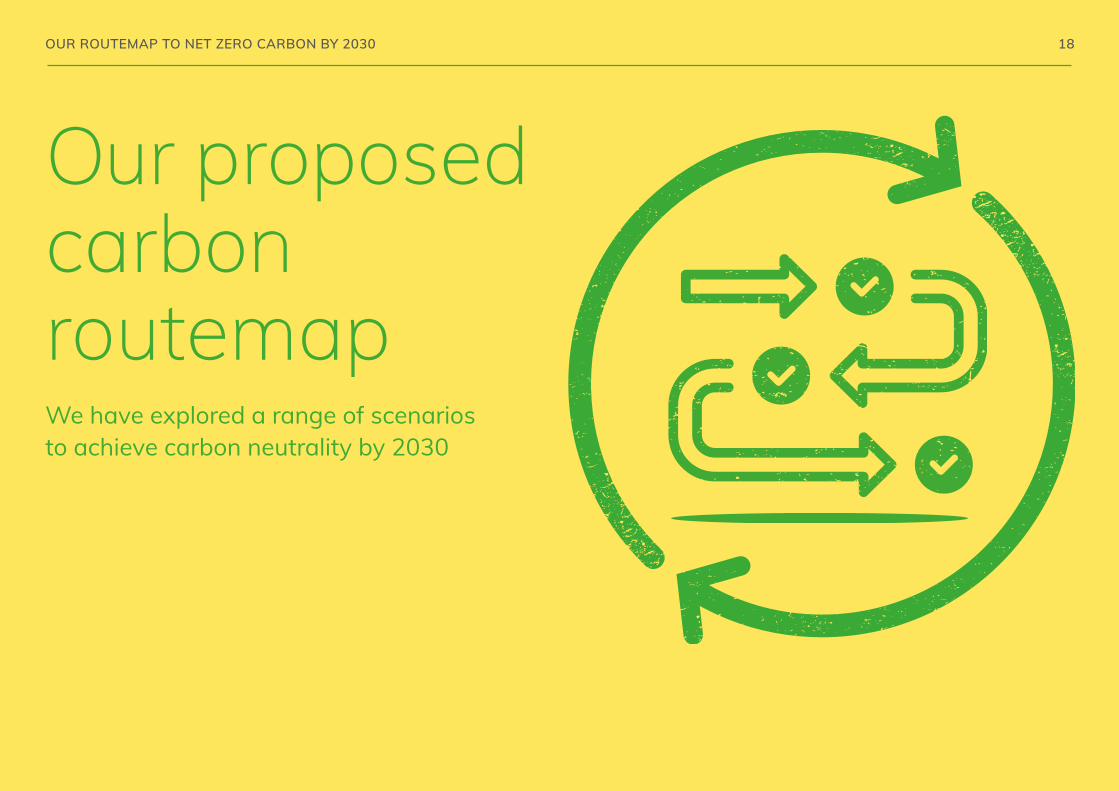
Our proposed carbon routemapWe have explored a range of scenarios to achieve carbon neutrality by 2030
OUR ROUTEMAP TO NET ZERO CARBON BY 2030 19
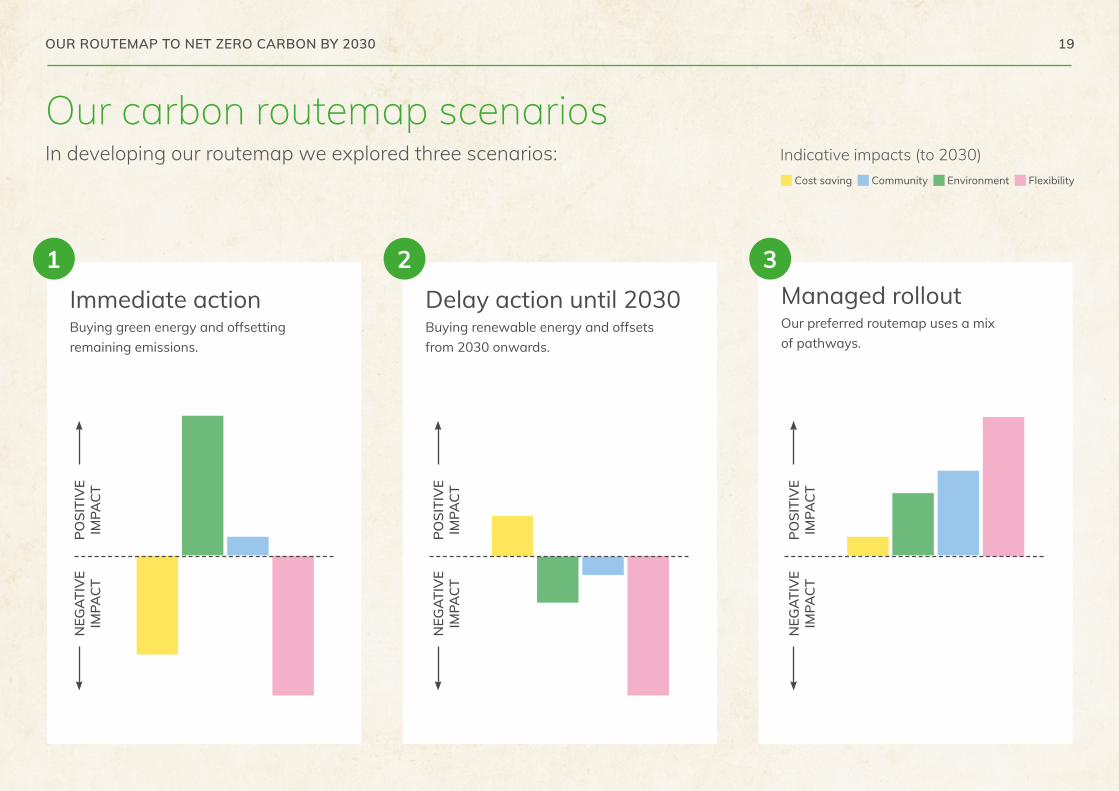
Our carbon routemap scenariosIn developing our routemap we explored three scenarios:
Managed rollout Our preferred routemap uses a mix of pathways.
Cost saving Community Environment Flexibility
Immediate actionBuying green energy and offsetting remaining emissions.
Delay action until 2030Buying renewable energy and offsets from 2030 onwards.
1 2 3
POSI
TIV
E IM
PACT
NEG
ATIV
E IM
PACT
POSI
TIV
E IM
PACT
NEG
ATIV
E IM
PACT
POSI
TIV
E IM
PACT
NEG
ATIV
E IM
PACT
Indicative impacts (to 2030)

OUR ROUTEMAP TO NET ZERO CARBON BY 2030 20
Routemap scenario 1Scenario 1 is based on offsetting carbon emissions immediately through green energy and carbon credit purchase:
Scenario Advantages Disadvantages Relative net cost
Immediate purchase of carbon offsets
It would be possible for any company to achieve next zero carbon emissions almost instantly by buying green energy and offsetting remaining emissions.
This would have the advantage of lower total emissions by 2030 – recognising the objective to minimise harmful emissions rather than just hit a 2030 target.
The logic behind offsets is that longer term investment in renewable energy or carbon removal is stimulated locally or worldwide through the sale of the offsets.
There would be no immediate environmental benefit as there would be the same amount of renewable energy available to the grid. The longer term environmental benefits are uncertain.
With no investment in reducing demand for energy or on site renewable generation, there is a high ongoing annual cost, with the added risk of future cost uncertainty.
No additional local economic, social and environmental benefits would be realised.
Short term£££
Longer term£££
OUR ROUTEMAP TO NET ZERO CARBON BY 2030 21
Scenario Advantages Disadvantages Relative net cost
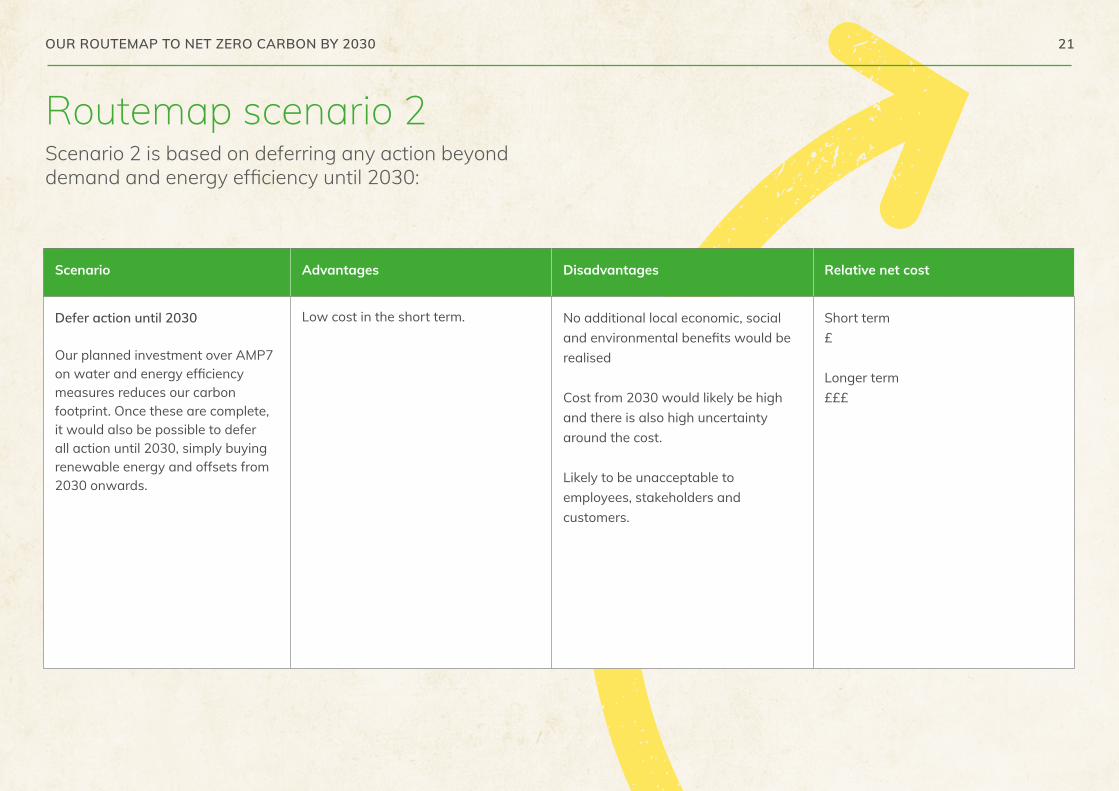
Defer action until 2030
Our planned investment over AMP7 on water and energy efficiency measures reduces our carbon footprint. Once these are complete, it would also be possible to defer all action until 2030, simply buying renewable energy and offsets from 2030 onwards.
Low cost in the short term. No additional local economic, social and environmental benefits would be realised
Cost from 2030 would likely be high and there is also high uncertainty around the cost.
Likely to be unacceptable to employees, stakeholders and customers.
Short term£
Longer term£££
Routemap scenario 2Scenario 2 is based on deferring any action beyond demand and energy efficiency until 2030:
OUR ROUTEMAP TO NET ZERO CARBON BY 2030 22
Scenario Advantages Disadvantages Relative net cost
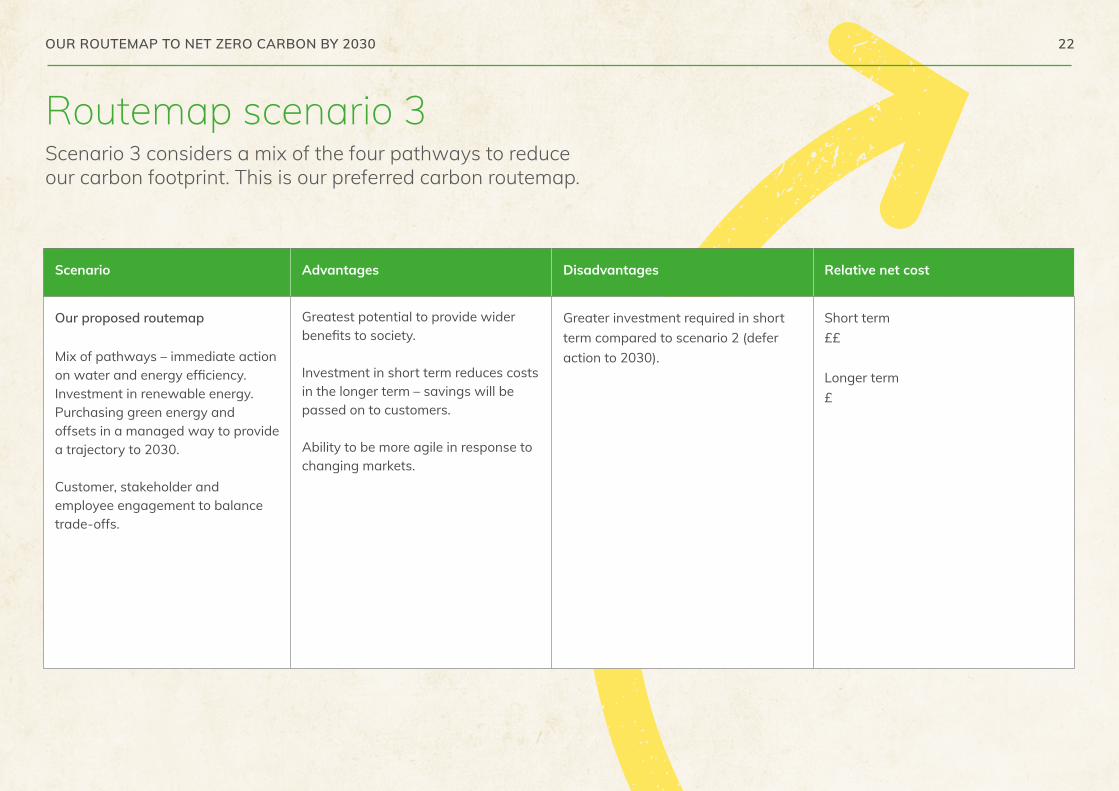
Our proposed routemap
Mix of pathways – immediate action on water and energy efficiency. Investment in renewable energy. Purchasing green energy and offsets in a managed way to provide a trajectory to 2030.
Customer, stakeholder and employee engagement to balance trade-offs.
Greatest potential to provide wider benefits to society.
Investment in short term reduces costs in the longer term – savings will be passed on to customers.
Ability to be more agile in response to changing markets.
Greater investment required in short term compared to scenario 2 (defer action to 2030).
Short term££
Longer term£
Routemap scenario 3Scenario 3 considers a mix of the four pathways to reduce our carbon footprint. This is our preferred carbon routemap.
OUR ROUTEMAP TO NET ZERO CARBON BY 2030 23
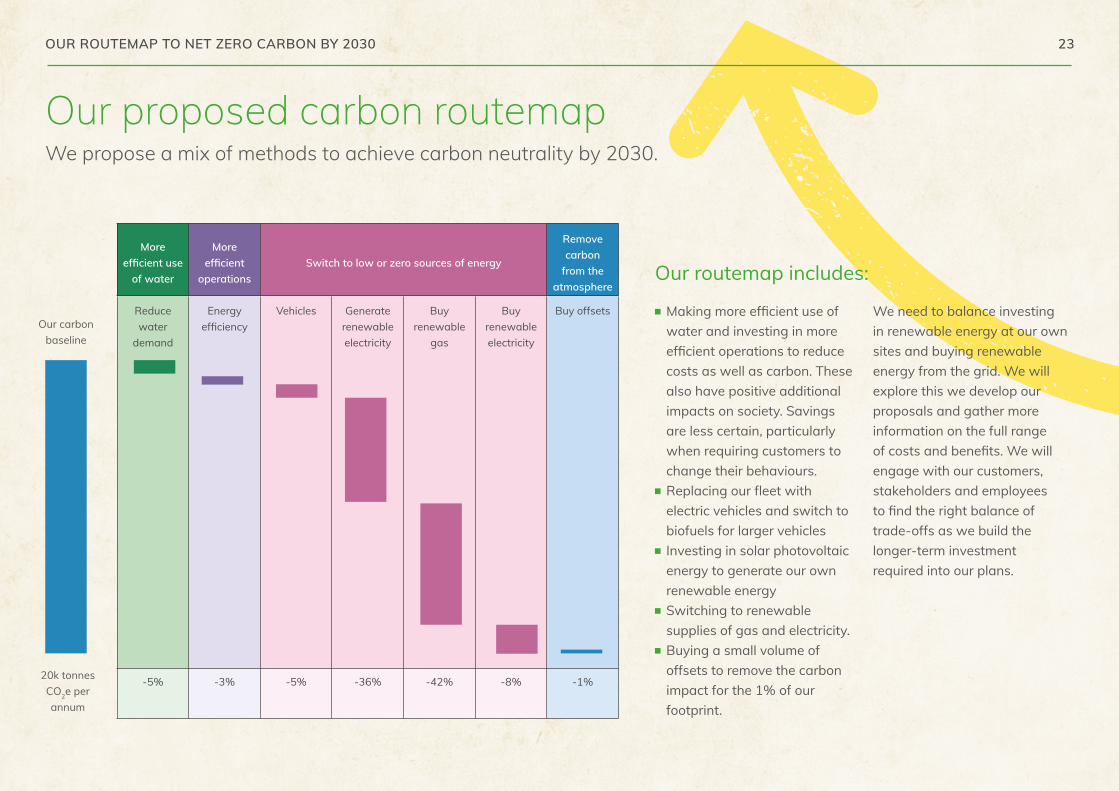
Our routemap includes:
Making more efficient use of water and investing in more efficient operations to reduce costs as well as carbon. These also have positive additional impacts on society. Savings are less certain, particularly when requiring customers to change their behaviours.
Replacing our fleet with electric vehicles and switch to biofuels for larger vehicles
Investing in solar photovoltaic energy to generate our own renewable energy
Switching to renewable supplies of gas and electricity.
Buying a small volume of offsets to remove the carbon impact for the 1% of our footprint.
We need to balance investing in renewable energy at our own sites and buying renewable energy from the grid. We will explore this we develop our proposals and gather more information on the full range of costs and benefits. We will engage with our customers, stakeholders and employees to find the right balance of trade-offs as we build the longer-term investment required into our plans.
More efficient use
of water
More efficient
operationsSwitch to low or zero sources of energy
Remove carbon
from the atmosphere
Reduce water
demand
Energyefficiency
Vehicles Generate renewable electricity
Buy renewable
gas
Buy renewable electricity
Buy offsets
-5% -3% -5% -36% -42% -8% -1%
Our carbon baseline
20k tonnes CO2e per annum
Our proposed carbon routemapWe propose a mix of methods to achieve carbon neutrality by 2030.
OUR ROUTEMAP TO NET ZERO CARBON BY 2030 24
2020-21 2021-22 2022-23 2023-24 2024-25 2025-26 2026-27 2027-28 2028-29 2029-30 2030-31
25
20
15
10
5
0
1. Immediate purchase of carbon offsets 2. Defer action until 2030 3. Our proposed routemap
Carb
on e
mis
sion
s kC
O2e
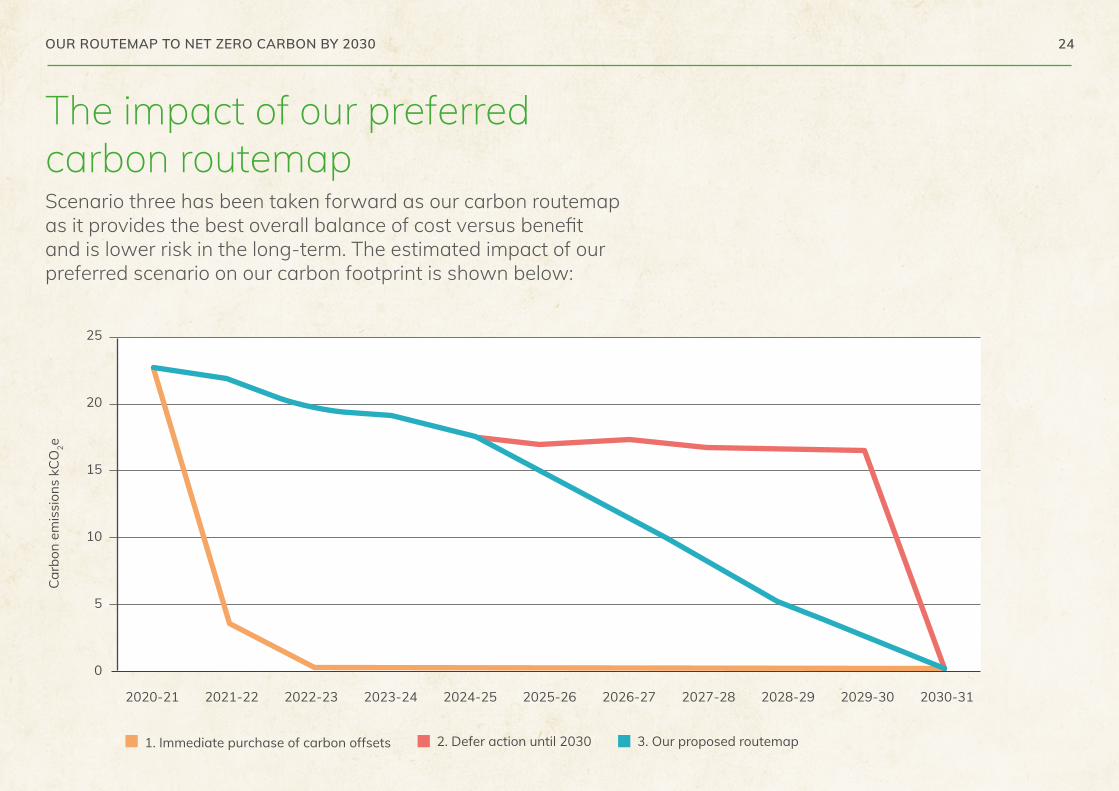
The impact of our preferred carbon routemapScenario three has been taken forward as our carbon routemap as it provides the best overall balance of cost versus benefit and is lower risk in the long-term. The estimated impact of our preferred scenario on our carbon footprint is shown below:
OUR ROUTEMAP TO NET ZERO CARBON BY 2030 25
Integrationwith local strategies and plansAddressing carbon emissions is a problem which we all share. Together we need joined up strategies to radically rethink how we live and work — we all have our part to play, as both employees and citizens.
OUR ROUTEMAP TO NET ZERO CARBON BY 2030 26
Integration with local strategies and plans
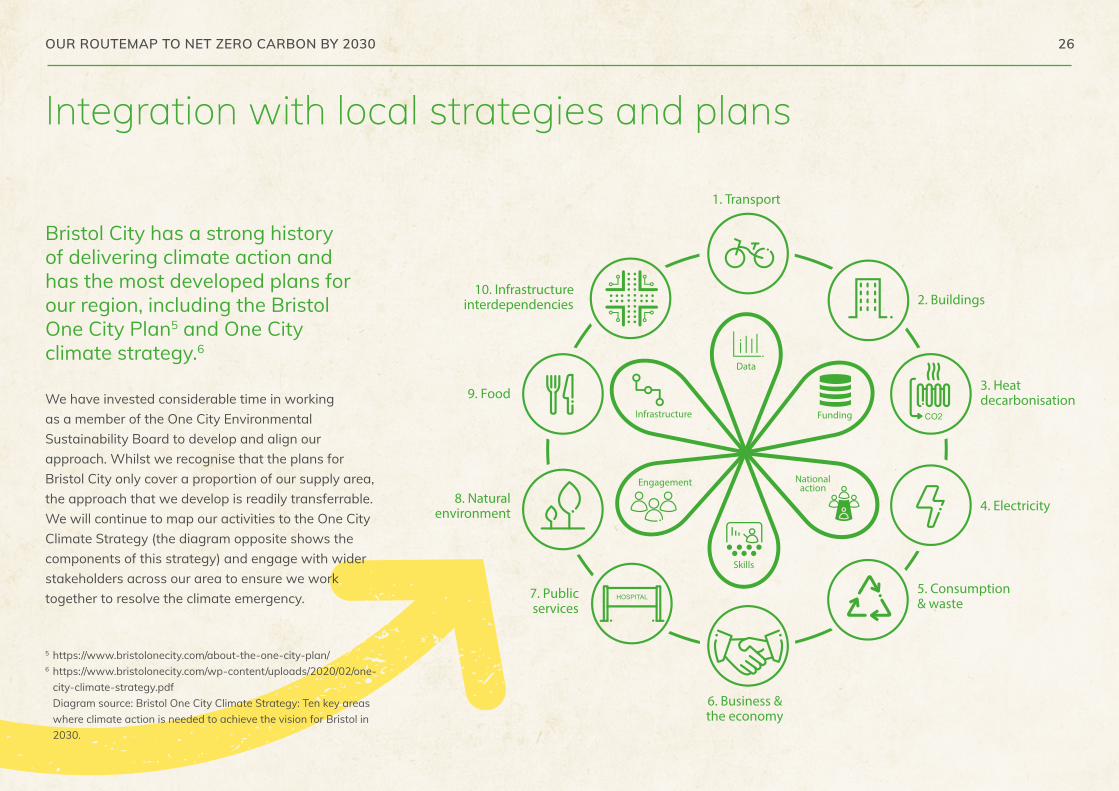
Bristol City has a strong history of delivering climate action and has the most developed plans for our region, including the Bristol One City Plan5 and One City climate strategy.6
We have invested considerable time in working as a member of the One City Environmental Sustainability Board to develop and align our approach. Whilst we recognise that the plans for Bristol City only cover a proportion of our supply area, the approach that we develop is readily transferrable. We will continue to map our activities to the One City Climate Strategy (the diagram opposite shows the components of this strategy) and engage with wider stakeholders across our area to ensure we work together to resolve the climate emergency.
5 https://www.bristolonecity.com/about-the-one-city-plan/6 https://www.bristolonecity.com/wp-content/uploads/2020/02/one-
city-climate-strategy.pdf Diagram source: Bristol One City Climate Strategy: Ten key areas
where climate action is needed to achieve the vision for Bristol in 2030.

OUR ROUTEMAP TO NET ZERO CARBON BY 2030 27
Resource West – our partnership with local utility companies, academic and Community Interest Companies aimed at achieving a transformational shift in consumption of resources whilst also supporting more vulnerable members of society
Bristol Water the Foundation – providing resources, knowledge and engagement opportunities to inspire young people on the value of water and the need to use it mindfully.
Our approach includes our social contract, which recognises our ability to use our skills and resources to contribute to wider community wellbeing through the way in which we work.
Our focus as a local community water company is to reflect the priorities of the area we serve, and to make a positive contribution beyond our core role as a water supplier
Our social contract has an annual programme of initiatives which are designed deliver wider social and environmental benefits, including education on the value of water and links to the local environment and to climate change. Our regional strategies approach is built around the Bristol One City Plan. This includes a series of targets to help achieve a fair and sustainable Bristol by 2030. This approach ensures that our social contract activities are linked to local needs and plans. Some examples are given here, together with some of the One City Plan targets.
Creating wider public value
Regional strategies
Resource West
Community engagement Conservation
Employees and citizens for the future
Resource West and One City
Strategy
Education on the
need for active
change
Enga
gem
ent o
n
the v
alue o
f
water
to so
ciety
Biodiversity net gain
and community led
nature based solution
projects
2021: Citywide activity launched to engage citizens on pathways to achieving Bristol’s 2030 climate and ecological goals
2021: Ensure community and business led nature-based solutions are delivering multiple benefits
2031: Bristol’s larger employers measure their carbon and ecological footprints and are net positive in their impacts
2024: With support, 50% of citizens and businesses have actively made changes and are working towards a carbon neutral and nature rich city by 2030
2026: Free drinking water is readily accessible at all city festivals to reduce the amount of single use plastic
2028: There has been a sustained increase in public engagement with biodiversity, with conservation volunteering and pro-environmental behaviours widespread
2032: The apprenticeship offer in the city has improved since 2020, and the percentage of apprentices in Bristol is above average
2030: Bristol is a Carbon Neutral and Climate Resilient City
We have a number of initiatives within our social contract which contribute to our net zero plans. Of particular note are:
Integration with local strategies and plans continued

OUR ROUTEMAP TO NET ZERO CARBON BY 2030 28
Because of the key position we hold in the local community, we believe we have an important role to play in helping reduce the carbon footprint of the wider community.
With this in mind, we have set ourselves an innovative reporting ambition, looking beyond the Net Zero scope of the UK water industry commitment and engaging more widely with the communities we serve. Because this reporting will be focused on the reductions in emissions that we believe we can help support, we have referred to these items as “Scope minus one” and “Scope minus two” as shown opposite.
Our local community ambition for carbon reduction
Defined by Scope
Bristol Water
-1 Reducing the carbon emissions of our customers through how they use their water, focusing on water heating.
-2 Supporting stakeholders in our catchment to sequester carbon through land management, but we will not be claiming the carbon reduction benefit.

OUR ROUTEMAP TO NET ZERO CARBON BY 2030 29
We recognise that our journey to net zero needs to be a collaborative one, with support and action from our employees, stakeholders, customers and delivery partners. There are a number of balances and trade-offs which need to be considered in the context of our future investment plans.
Next steps
Consult with customers, stakeholders and employees within the context of our wider plans.
Expedite our plans for developing options for renewable energy at our sites.
Ensure that our short and longer term decision making frameworks include carbon impacts.
Continue to measure and transparently report on our progress.
These are our key next steps:

Meanwhile we’d love to know what you think. Please contact us at: [email protected] information on our GHG emissions can be found in our Annual Performance Report 2020/21 at our website: https://www.bristolwater.co.uk/about-us/our-performance/ Further information on our latest social contract annual programme of initiatives, which are designed deliver wider social and environmental benefits, can be found at our website: https://www.bristolwater.co.uk/about-us/our-story/social-contract/
With thanks to the Centre for Sustainable Energy for their assistance in creating this routemap