or - ESA Microelectronics Section / Microelectronics...
90
NAME ddd, xddd - the data display debugger SYNOPSIS ddd [ --gdb ][ --dbx ][ --xdb ][ --jdb ][ --pydb ][ --perl ][ --debugger name ][ --[r]host [username@]hostname ] ] [ --help ][ --trace ][ --version ][ --configuration ][ options... ] [ program [ core | process-id ]] but usually just ddd program DESCRIPTION The purpose of a debugger such as DDD is to allow you to see what is going on “inside” another program while it executes—or what another program was doing at the moment it crashed. DDD can do four main kinds of things (plus other things in support of these) to help you catch bugs in the act: • Start your program, specifying anything that might affect its behavior. • Make your program stop on specified conditions. • Examine what has happened, when your program has stopped. • Change things in your program, so you can experiment with correcting the effects of one bug and go on to learn about another. “Classical” UNIX debuggers such as the GNU debugger (GDB) provide a command-line interface and a multitude of commands for these and other debugging purposes. DDD is a comfortable graphical user interface around an inferior GDB, DBX, XDB, JDB, Python debugger, or Perl debugger. INVOKING DDD You can run DDD with no arguments or options. However, the most usual way to start DDD is with one argument or two, specifying an executable program as the argument: ddd program You can also start with both an executable program and a core file specified: ddd program core You can, instead, specify a process ID as a second argument, if you want to debug a running process: ddd program 1234 would attach DDD to process 1234 (unless you also have a file named ‘ 1234 ’; DDD does check for a core file first). By default, DDD determines the inferior debugger automatically. Use DDD 3.1 1998-12-01 1
-
Upload
truongquynh -
Category
Documents
-
view
225 -
download
0
Transcript of or - ESA Microelectronics Section / Microelectronics...

( ) ( )
NAMEddd, xddd - the data display debugger
SYNOPSISddd [ −−gdb] [ −−dbx ] [ −−xdb ] [ −−jdb ] [ −−pydb ] [ −−perl ] [ −−debuggername] [ −−[r ]host
[username@]hostname] ] [ −−help] [ −−trace] [ −−version] [ −−configuration ] [ options...][ program[ core | process-id] ]
but usually just
ddd program
DESCRIPTIONThe purpose of a debugger such asDDD is to allow you to see what is going on “inside” another programwhile it executes—or what another program was doing at the moment it crashed.
DDD can do four main kinds of things (plus other things in support of these) to help you catch bugs in theact:
• Start your program, specifying anything that might affect its behavior.
• Make your program stop on specified conditions.
• Examine what has happened, when your program has stopped.
• Change things in your program, so you can experiment with correcting the effects of one bug and go onto learn about another.
“Classical” UNIX debuggers such as theGNU debugger (GDB) provide a command-line interface and amultitude of commands for these and other debugging purposes.DDD is a comfortablegraphical userinterfacearound an inferiorGDB, DBX, XDB, JDB, Python debugger, or Perl debugger.
INVOKING DDDYou can runDDD with no arguments or options. However, the most usual way to startDDD is with oneargument or two, specifying an executable program as the argument:
ddd program
You can also start with both an executable program and a core file specified:
ddd program core
You can, instead, specify a process ID as a second argument, if you want to debug a running process:
ddd program 1234
would attachDDD to process1234(unless you also have a file named ‘1234’; DDD does check for a corefile first).
By default,DDD determines the inferior debugger automatically. Use
DDD 3.1 1998−12−01 1

( ) ( )
ddd −−gdbprogram
or
ddd −−dbx program
or
ddd −−xdb program
or
ddd −−jdb class
or
ddd −−pydb module
or
ddd −−perl programfile
to runGDB, DBX, XDB, JDB, PYDB or Perl as inferior debugger.
To learn more aboutDDD options, run
ddd −−help
to get a list of frequently used options, or see the ‘OPTIONS’ section, below.
THE DDD WINDOWSThe DDD Main Windows
Machine Code Window
Data Window
Menu Bar
Source Window
Tool Bar
Debugger Console
Status Line
Panner
Command Tool
Scroll Bar
Resize Sash
Value Tip
Busy Indicator
The DDD Layout using Stacked Windows
DDD is composed of three main windows:
DDD 3.1 1998−12−01 2

( ) ( )
• TheData Windowshows the current data of the debugged program.
• TheSource Windowshows the current source code of the debugged program.
• TheDebugger Consoleaccepts debugger commands and shows debugger messages.
By default,DDD places these main windows stacked into one single top-level window, butDDD can also beconfigured to treat each one separately.
Source Window
Debugger Console
Data Window
Button Tip
The DDD Layout using Separate Windows
Besides these main windows, there are some other optional windows:
• TheCommand Tooloffers buttons for frequently used commands. It is usually placed on the source win-dow.
• The Machine Code Windowshows the current machine code. It is usually placed beneath the currentsource.
• TheExecution Windowshows the input and output of the debugged program.
DDD also has several temporarydialogsfor showing and entering additional information.
Using the Command ToolThe command tool is a small window containing frequently usedDDD commands. It can be moved aroundon top of theDDD windows, but it can also be placed besides them. Whenever you saveDDD state,DDDalso saves the distance between command tool and source window, such that you can select your own indi-vidual command tool placement. To move the command tool to its saved position, use ‘View→CommandTool’.
By default, the command toolsticksto theDDD source window: Whenever you move theDDD source win-dow, the command tool follows such that the distance between source window and command tool remainsthe same. By default, the command tool is alsoauto-raised, such that it stays on top of otherDDD win-dows.
The command tool can be configured to appear as a command tool bar above the source window; see‘Edit→Preferences→Source→Tool Buttons Location’ for details.
DDD 3.1 1998−12−01 3

( ) ( )
Start debugged program
Interrupt debugged program
Step program one line (step into calls)
Step program one line (step over calls)
Edit source file
Select stack frame that called this one
Continue program after breakpoint
Step one instruction (step into calls)
Step one instruction (step over calls)
Select stack frame called by this one
Kill execution of debugged program
Invoke the make program
Continue until frame returns
The Command Tool
Continue until program reaches next line
Undo previous action Redo next action
Using the Tool BarSomeDDD commands require anargument. This argument is specified in theargument field, labeled ‘():’.Basically, there are four ways to set arguments:
• You cankey inthe argument manually.
• You canpastethe current selection into the argument field (typically usingmouse button 2). To clear oldcontents beforehand, click on the ‘():’ label.
• You canselect an itemfrom the source and data windows. This will automatically copy the item to theargument field.
• You can select apreviously used argumentfrom the drop-down menu at the right of the argument field.
Using GDB and Perl, the argument field provides a completion mechanism. You can enter the first fewcharacters of an item an press theTAB key to complete it. PressingTAB again shows alternative comple-tions.
After having entered an argument, you can select one of the buttons on the right. Most of these buttons alsohave menus associated with them; this is indicated by a small arrow in the upper right corner. Pressing andholdingmouse button 1on such a button will pop up a menu with further operations.
Get Previous Arguments
Data CommandsLookup Commands Breakpoint Commands
Enter Argument
The Tool Bar
DDD 3.1 1998−12−01 4

( ) ( )
GETTING HELPDDD has an extensive on-line help system. Here’s how to get help while working withDDD.
Button TipsYou can get a short help text on mostDDD buttons by simply moving the mouse pointer on it and leave itthere. After a second, a small window (calledbutton tip) pops up, giving a hint on the button’s meaning.The button tip disappears as soon as you move the mouse pointer to another item.
The Status LineThe status line also displays information about the currently selected item. By clicking on the status line,you can redisplay the most recent messages.
Context-Sensitive HelpYou can get detailed help on any visibleDDD item. Just point on the item you want help and press the ‘F1’key. This pops up a detailed help text.
TheDDD dialogs all contain ‘Help’ buttons that give detailed information about the dialog.
Help on Debugger CommandsYou can get help on debugger commands by entering ‘help’ at the debugger prompt.
See ‘Entering Commands’, below, for details on entering commands.
Are You Stuck?If you are stuck, try ‘Help→What Now?’ (the ‘What Now’ item in the ‘Help’ menu) or pressCtrl+F1 .Depending on the current state,DDD will give you some hints on what you can do next.
Undoing CommandsAnd if, after all, you made a mistake, don’t worry. Almost everyDDD command can be undone, using‘Edit→Undo’ or the ‘Undo’ button on the command tool. Likewise, ‘Edit→Redo’ repeats the commandmost recently undone.
OPENING FILESIf you did not invokeDDD specifying a program to be debugged, you can use the ‘File’ menu to open pro-grams, core dumps and sources.
Opening a program to be debugged
Directory List
Program to be opened
Click here to open
File List
File Filter
To open a program to be debugged, select ‘File→Open Program’.
DDD 3.1 1998−12−01 5

( ) ( )
In JDB, select ‘File→Open Class’ instead. This gives you a list of available classes to choose from.
To re-open a recently debugged program or class, select ‘File→Open Recent’ and choose a program orclass from the list.
Note: With XDB and someDBX versions, the debugged program must be specified upon invocation andcannot be changed at run time.
To open a core dump for the program, select ‘File→Open Core Dump’. Before ‘Open Core Dump’, youshould first use ‘File→Open Program’ to specify the program that generated the core dump and to load itssymbol table.
To open a source file of the debugged program, select ‘File→Open Source’.
• UsingGDB, this gives you a list of the sources used for compiling your program.
• Using other inferior debuggers, this gives you a list of accessible source files, which may or may not berelated to your program.
LOOKING UP ITEMSAs soon as the source of the debugged program is available, thesource windowdisplays its current sourcetext. (If a source text cannot be found, use ‘Edit→GDB Settings’ to specify source text directories.)
In the source window, you can lookup and examine function and variable definitions as well as search forarbitrary occurrences in the source text.
Looking up DefinitionsIf you wish to lookup a specific function or variable definition whose name is visible in the source text,click with mouse button 1on the function or variable name. The name is copied to the argument field.Alter the name if desired and click on the ‘Lookup ()’ button to find its definition.
Show Item Value
The Source Popup Menu
Set and Delete Breakpoint at Item
Lookup Item’s Definition in Source Code
Show Item Type
Press Button 3 on Item
As a faster alternative, you can simply pressmouse button 3on the function name and select the ‘Lookup’item from the source popup menu.
As an even faster alternative, you can also double-click on a function call (an identifier followed by a ‘(’character) to lookup the function definition.
DDD 3.1 1998−12−01 6

( ) ( )
Textual SearchIf the item you wish to search is visible in the source text, click withmouse button 1on it. The identifier iscopied to the argument field. Click on the ‘Find>> ()’ button to find following occurrences and on the‘Find<< ()’ button to find previous occurrences.
As an alternative, you can enter the item in the argument field and click on one of the ‘Find’ buttons.
By default,DDD finds only complete words. To search for arbitrary substrings, change the value of the‘Source→Find Words Only’ option.
Looking up Previous LocationsAfter looking up a location, use ‘Edit→Undo’ (or the ‘Undo’ button on the command tool) to go back tothe original locations. ‘Edit→Redo’ brings you back again to the location you looked for.
The Source Window
Program Counter
Disabled Breakpoint
Execution Position
Enabled Breakpoint
Click here to lookup ‘tree_test’
Click here to find further occurrences of ‘tree_test’Argument for command buttons on the right
BREAKPOINTSYou can make the program stop at certainbreakpointsand trace its execution.
Setting Breakpoints by LocationIf the source line is visible, click withmouse button 1on the left of the source line and then on the ‘Breakat ()’ button.
As a faster alternative, you can simply pressmouse button 3on the left of the source line and select the ‘SetBreakpoint’ item from the line popup menu.
DDD 3.1 1998−12−01 7

( ) ( )
The Line Popup Menu
Set Breakpoint at LinePress Button 3 on Line
As an even faster alternative, you can simply double-click on the left of the source line to set a breakpoint.
As yet another alternative, you can select ‘Source→Edit Breakpoints’. Click on the ‘Break’ button andenter the location.
(If you find this number of alternatives confusing, be aware thatDDD users fall into three categories, whichmust all be supported.Novice usersexplore DDD and may prefer to use one single mouse button.Advanced usersknow how to use shortcuts and prefer popup menus.Experienced usersprefer the com-mand line interface.)
Breakpoints are indicated by a plain stop sign, or as ‘#n#’, wheren is the breakpoint number. A greyed outstop sign (or ‘_n_’) indicates a disabled breakpoint. A stop sign with a question mark (or ‘?n?’) indicates aconditional breakpoint or a breakpoint with an ignore count set.
If you set a breakpoint by mistake, use ‘Edit→Undo’ to delete it again.
Note: We hav e received reports that some Motif versions fail to display stop signs correctly. If this hap-pens, try writing in your ‘$HOME/.ddd/init ’ file:
Ddd*cacheGlyphImages: off
and restartDDD. See also the ‘cacheGlyphImages’ resource in the ‘RESOURCES’ section, below.
Setting Breakpoints by NameIf the function name is visible, click withmouse button 1on the function name. The function name iscopied to the argument field. Click on the ‘Break at ()’ button to set a breakpoint there.
As a shorter alternative, you can simply pressmouse button 3on the function name and select the ‘break’item from the popup menu.
As yet another alternative, you can click on ‘New’ from the Breakpoint editor (invoked through‘Source→Edit Breakpoints’) and enter the function name.
Setting Regexp BreakpointsUsing GDB, you can also set a breakpoint on all functions that match a given string. ‘Break at ()→SetBreakpoints at Regexp ()’ sets a breakpoint on all functions whose name matches theregular expressiongiven in ‘()’. Here are some examples:
• To set a breakpoint on every function that starts with ‘Xm’, set ‘()’ to ‘ ˆXm’.
• To set a breakpoint on every member of class ‘Date’, set ‘()’ to ‘ ˆDate::’.
• To set a breakpoint on every function whose name contains ‘_fun’, set ‘()’ to ‘ _fun’.
• To set a breakpoint on every function that ends in ‘_test’, set ‘()’ to ‘ _test$’.
Once these multiple breakpoints are set, they are treated just like the breakpoints set with the ‘Break at ()’button. You can delete them, disable them, or make them conditional the same way as any other
DDD 3.1 1998−12−01 8

( ) ( )
breakpoint. Use ‘Source→Edit Breakpoints’ to view and edit the list of breakpoints.
Disabling BreakpointsTo temporarily disable a breakpoint, pressmouse button 3on the breakpoint symbol and select the ‘DisableBreakpoint’ item from the breakpoint popup menu. To enable it again, select ‘Enable Breakpoint’.
The Breakpoint Popup Menu
Disable Breakpoint
Edit Properties
Press Button 3 on Breakpoint
As an alternative, you can select the breakpoint and click on ‘Disable’ or ‘ Enable’ in the Breakpoint editor(invoked through ‘Source→Edit Breakpoints’.
Disabled breakpoints are indicated by a grey stop sign, or ‘_n_’, wheren is the breakpoint number.
The ‘Disable Breakpoint’ item is also accessible via the ‘Clear at ()’ button. Just press and holdmousebutton 1on the button to get a popup menu.
Note:JDB does not support breakpoint disabling.
Temporary BreakpointsA temporary breakpointis immediately deleted as soon as it is reached. To set a temporary breakpoint,pressmouse button 3on the left of the source line and select the ‘Set Temporary Breakpoint’ item fromthe popup menu.
As a faster alternative, you can simply double-click on the left of the source line while holdingCtrl .
Temporary breakpoints are convenient to make the program continue up to a specific location: just set thetemporary breakpoint at this location and continue execution.
The ‘Continue Until Here’ item from the popup menu sets a temporary breakpoint on the left of the sourceline and immediately continues execution. Execution stops when the temporary breakpoint is reached.
The ‘Set Temporary Breakpoint’ and ‘Continue Until Here’ items are also accessible via the ‘Break at()’ button. Just press and holdmouse button 1on the button to get a popup menu.
Note:JDB does not support temporary breakpoints.
Deleting BreakpointsIf the breakpoint is visible, click withmouse button 1on the breakpoint. The breakpoint location is copiedto the argument field. Click on the ‘Clear at ()’ button to delete all breakpoints there.
If the function name is visible, click withmouse button 1on the function name. The function name iscopied to the argument field. Click on the ‘Clear at ()’ button to set a breakpoint there.
As a faster alternative, you can simply pressmouse button 3on the breakpoint and select the ‘DeleteBreakpoint’ item from the popup menu.
As yet another alternative, you can select the breakpoint and click on ‘Delete’ in the Breakpoint editor(invoked through ‘Source→Edit Breakpoints’).
As an even faster alternative, you can simply double-click on the breakpoint while holdingCtrl .
DDD 3.1 1998−12−01 9

( ) ( )
Editing Breakpoint PropertiesYou can change all properties of a breakpoint by pressingmouse button 3on the breakpoint symbol andselect ‘Properties’ from the breakpoint popup menu. This will pop up a dialog showing the current proper-ties of the selected breakpoint.
As an even faster alternative, you can simply double-click on the breakpoint.
Breakpoint Properties
Edit Breakpoint Condition
Edit Ignore Count
Disable Breakpoint
• Click on ‘Lookup’ to move the cursor to the breakpoint’s location.
• Click on ‘Enable’ to enable the breakpoint.
• Click on ‘Disable’ to disable the breakpoint.
• Click on ‘Temp’ to make the breakpoint temporary. Note:GDB has no way to make a temporary break-point non-temporary again.
• Click on ‘Delete’ to delete the breakpoint.
Breakpoint ConditionsIn the field ‘Condition’ of the ‘Breakpoint Properties’ panel, you can specify abreakpoint condition. If abreakpoint condition is set, the breakpoint stops the program only if the associated condition is met—thatis, if the condition expression evaluates to a non-zero value.
Note:JDB does not support breakpoint conditions.
Breakpoint Ignore CountsIn the field ‘Ignore Count’ of the ‘Breakpoint Properties’ panel, you can specify abreakpoint ignorecount. If the ignore count is set to some valueN, the nextN crossings of the breakpoint will be ignored:Each crossing of the breakpoint decrements the ignore count; the program stops only if the ignore count iszero.
Note:JDB, Perl and someDBX variants do not support breakpoint ignore counts.
Breakpoint CommandsNote: Breakpoint commands are currently available onGDB only.
Using the ‘Commands’ buttons of the ‘Breakpoint Properties’ panel, you can record and edit commandsto be executed when the breakpoint is hit.
DDD 3.1 1998−12−01 10

( ) ( )
To record a command sequence, follow these steps:
• Click on ‘Record’ to begin the recording of the breakpoint commands.
• Now interact withDDD. While recording,DDD does not execute commands, but simply records them tobe executed when the breakpoint is hit. The recorded debugger commands are shown in the debuggerconsole.
• To stop the recording, click on ‘End’ or enter ‘end’ at the GDB prompt. Tocancelthe recording, clickon ‘Interrupt ’ or pressESC.
• Click on ‘Edit >>’ to edit the recorded commands. When done with editing, click on ‘Edit <<’ to closethe commands editor.
Moving and Copying BreakpointsTo move a breakpoint to a different location, pressmouse button 1on the stop sign and drag it to the desiredlocation. This is equivalent to deleting the breakpoint at the old location and setting a breakpoint at the newlocation. The new breakpoint inherits all properties of the old breakpoint, except the breakpoint number.
To copy a breakpoint to a new location, press theShift key while dragging.
Note: Dragging breakpoints is not possible when glyphs are disabled. Delete and set breakpoints instead.
Looking up BreakpointsIf you wish to lookup a specific breakpoint, select ‘Source→Edit Breakpoints→Lookup’. After selectinga breakpoint from the list and clicking the ‘Lookup’ button, the breakpoint location is displayed.
As an alternative, you can enter ‘#n’ in the argument field, wheren is the breakpoint number and click onthe ‘Lookup ()’ button to find its definition.
Editing all BreakpointsTo view and edit all breakpoints at once, select ‘Source→Edit Breakpoints’. This will popup theBreak-point Editorwhich displays the state of all breakpoints.
Condition
Ignore CountCommands
Edit Properties
The Breakpoint Editor
In the breakpoint editor, you can select individual breakpoints by clicking on them. PressingCtrl whileclicking toggles the selection. To edit the properties of all selected breakpoints, click on ‘Props’.
More Breakpoint FeaturesUsingGDB, a few more commands related to breakpoints can be invoked through the debugger console:
DDD 3.1 1998−12−01 11

( ) ( )
hbreak positionSets a hardware-assisted breakpoint atposition. This command requires hardware support andsome target hardware may not have this support. The main purpose of this is EPROM/ROMcode debugging, so you can set a breakpoint at an instruction without changing the instruction.
thbreak posSet a temporary hardware-assisted breakpoint atpos.
See theGDB documentation for details on these commands.
WA TCHPOINTSYou can make the program stop as soon as some variable value changes, or when some variable is read orwritten. This is called ‘setting awatchpointon a variable’.
Watchpoints have much in common with breakpoints: in particular, you can enable and disable them. Youcan also set conditions, ignore counts, and commands to be executed when a watched variable changes itsvalue.
Please note: on architectures without special watchpoint support, watchpoints currently make the programexecute two orders of magnitude more slowly. This is so because the inferior debugger must interrupt theprogram after each machine instruction in order to examine whether the watched value has changed. How-ev er, this delay can be well worth it to catch errors when you have no clue what part of your program is theculprit.
Note: Watchpoints are available inGDB and someDBX variants only. InXDB, a similar feature is availablevia XDB assertions; see theXDB documentation for details.
Setting WatchpointsIf the variable name is visible, click withmouse button 1on the variable name. The variable name iscopied to the argument field. Otherwise, enter the variable name in the argument field. Click on the‘Watch ()’ button to set a watchpoint there.
Using GDB, you can set different types of watchpoints. Click and holdmouse button 1on the ‘Watch ()’button to get a menu.
Editing Watchpoint PropertiesTo change the properties of a watchpoint, enter the name of the watched variable in the argument field.Click and holdmouse button 1on the ‘Watch ()’ button and select ‘Watchpoint Properties’.
The Watchpoint Properties panel has the same functionality as theBreakpoint Properties panel; see‘Editing Breakpoint Properties’, above, for details. As an additional feature, you can click on ‘Print () ’to see the current value of a watched variable.
Editing all WatchpointsTo view and edit all watchpoints at once, select ‘Data→Edit Watchpoints’. This will popup theWatch-point Editorwhich displays the state of all watchpoints.
TheWatchpoint Editorhas the same functionality as theBreakpoint Editor; see ‘Editing All Breakpoints ’,above, for details. As an additional feature, you can click on ‘Print () ’ to see the current value of awatched variable.
Deleting WatchpointsTo delete a watchpoint, enter the name of the watched variable in the argument field and click the‘Unwatch ()’ button.
RUNNING THE PROGRAMStarting Program Execution
To start execution of the debugged program, select ‘Program→Run’. You will then be prompted for thearguments to pass to your program. You can either select from a list of previously used arguments or enterown arguments in the text field. Afterwards, press the ‘Run’ button to start execution with the selectedarguments.
To run your program again, with the same arguments, select ‘Program→Run Again’ or press the ‘Run’
DDD 3.1 1998−12−01 12

( ) ( )
button on the command tool. You may also enter ‘run ’, followed by arguments at the debugger promptinstead.
Click here to select
Empty Argument ListOther Arguments
Program Arguments
Click here to run
Starting a Program with Arguments
Using the Execution WindowBy default, input and output of your program go to the debugger console. As an alternative,DDD can alsoinvoke anexecution window, where the program terminal input and output is shown. To activate the execu-tion window, select ‘Program→Run in Execution Window’.
While the execution window is active,DDD invokes your program such that its standard input, output, anderror streams are redirected to the execution window. Note that the device ‘/dev/tty’ still refers to thedebugger console,not the execution window.
You can override theDDD stream redirection by giving alternate redirection operations as arguments. Forinstance, to have your program read from a file, but to write to the execution window, inv oke your programwith ‘< file’ as argument. Likewise, to redirect the standard error output to the debugger console, use ‘2>/dev/tty’ (assuming the inferior debugger and/or yourUNIX shell support standard error redirection).
The execution window is not available inJDB andPerl.
Attaching to a Running ProcessIf the debugged program is already running in some process, you canattachto this process (instead of start-ing a new one with ‘Run’). Select ‘File→Attach to Process’ to choose from a list of processes. After-wards, press the ‘Attach’ button to attach to the specified process.
The first thingDDD does after arranging to debug the specified process is to stop it. You can examine andmodify an attached process with all theDDD commands that are ordinarily available when you start pro-cesses with ‘Run’. You can insert breakpoints; you can step and continue; you can modify storage. If youwould rather the process continue running, you may use ‘Continue’ after attachingDDD to the process.
When using ‘Attach to Process’, you should first use ‘Open Program’ to specify the program running inthe process and load its symbol table.
When you have finished debugging the attached process, you can use the ‘File→Detach Process’ to releaseit from DDD control. Detaching the process continues its execution. After ‘Detach Process’, that processandDDD become completely independent once more, and you are ready to attach another process or startone with ‘Run’.
DDD 3.1 1998−12−01 13
( ) ( )
Selecting a Process to Attach
Click to attach
Selected processps output
You can customize the list of processes shown by defining an alternate command to list processes. See‘Edit→Preferences→Helpers→List Processes’.
Note:JDB, PYDB, and Perl do not support attaching the debugger to running processes.
Stopping the ProgramThe program stops as soon as a breakpoint is reached. The current execution position is highlighted by anarrow.
You can interrupt a running program any time by clicking the ‘Interrupt ’ button or typingESC in a DDDwindow.
Resuming ExecutionTo resume execution, at the address where your program last stopped, click on the ‘Continue‘ button. Anybreakpoints set at that address are bypassed.
To execute just one source line, click on the ‘Step’ button. The program is executed until control reaches adifferent source line, which may be in a different function.
To continue to the next line in the current function, click on the ‘Next’ button. This is similar to ‘Step’, butany function calls appearing within the line of code are executed without stopping.
To continue until a greater line in the current function is reached, click on the ‘Until ’ button. This is usefulto avoid single stepping through a loop more than once.
To continue running until the current function returns, use the ‘Finish’ button. The returned value (if any)is printed.
To continue running until a line after the current source line is reached, use the ‘Continue Until Here’facility from the line popup menu. See the ‘Temporary Breakpoints’ section, above, for a discussion.
Altering the Execution PositionTo resume execution at a different location, pressmouse button 1on the arrow and drag it to a differentlocation. The most common occasion to use this feature is to back up—perhaps with more breakpoints set-over a portion of a program that has already executed, in order to examine its execution in more detail.
Moving the execution position does not change the current stack frame, or the stack pointer, or the contentsof any memory location or any register other than the program counter.
Some inferior debuggers (notablyGDB) allow you to set the new execution position into a different func-tion from the one currently executing. This may lead to bizarre results if the two functions expect differentpatterns of arguments or of local variables. For this reason, moving the execution position requests confir-mation if the specified line is not in the function currently executing.
DDD 3.1 1998−12−01 14

( ) ( )
After moving the execution position, click on the ‘Continue’ button to resume execution.
Click on arrow, ... ... hold mouse button and move ... ... to the final position.
Changing the Execution Position by Dragging the Execution Arrow
Note: Dragging the execution position is not possible when glyphs are disabled. Use ‘Set Execution Posi-tion’ from the breakpoint popup menu instead to set the execution position to the current location. Thisitem is also accessible by pressing and holding the ‘Break at ()/Clear at ()’ button.
Note:JDB does not support altering the execution position.
Examining the StackWhen your program has stopped, the first thing you need to know is where it stopped and how it got there.
DDD provides abacktrace windowshowing a summary of how your program got where it is. To enable thebacktrace window, select ‘Status→Backtrace’.
Selecting a Frame from the Backtrace Viewer
Called functions
Current frame in source window
Calling functions
The ‘Up’ button selects the function that called the current one.
The ‘Down’ button selects the function that was called by the current one.
You can also directly type the ‘up’ and ‘down’ commands at the debugger prompt. TypingCtrl+Up andCtrl+Down , respectively, will also move you through the stack.
DDD 3.1 1998−12−01 15

( ) ( )
‘Up’ and ‘Down’ actions can be undone via ‘Edit→Undo’.
“Undoing” Program ExecutionIf you take a look at the ‘Edit→Undo’ menu item after an execution command, you’ll find thatDDD offersyou to undo execution commands just as other commands. Does this mean thatDDD allows you to gobackwards in time, undoing program execution as well as undoing any side-effects of your program?
Sorry—we must disappoint you.DDD cannot undo what your program did. (After a little bit of thought,you’ll find that this would be impossible in general.) However, DDD can do something different: it canshowpreviously recorded statesof your program.
After “undoing” an execution command (via ‘Edit→Undo’, or the ‘Undo’ button), the execution positionmoves back to the earlier position and displayed variables take their earlier values. Your program state is infact unchanged, but DDD gives you aviewon the earlier state as recorded by DDD.
In this so-calledhistoric mode, most normalDDD commands that would query further information from theprogram are disabled, since the debugger cannot be queried for the earlier state. However, you can examinethe current execution position, or the displayed variables. Using ‘Undo’ and ‘Redo’, you can move backand forward in time to examine how your program got into the present state.
To let you know that you are operating in historic mode, the execution arrow gets a dashed-line appearance(indicating a past position); variable displays also come with dashed lines. Furthermore, the status lineinforms you that you are seeing an earlier program state.
Here’s how historic mode works: each time your program stops,DDD collects the current execution posi-tion and the values of displayed variables. Backtrace, thread, and register information is also collected ifthe corresponding dialogs are open. When “undoing” an execution command,DDD updates its view fromthis collected state instead of querying the program.
If you want to collect this information without interrupting your program—within a loop, for instance—youcan place a breakpoint with an associated ‘cont’ command; see ‘Breakpoint Commands’, above, fordetails. When the breakpoint is hit,DDD will stop, collect the data, and execute the ‘cont’ command,resuming execution. Using a later ‘Undo’, you can step back and look at every single loop iteration.
To leave historic mode, you can use ‘Redo’ until you are back in the current program state. However, anyDDD command that refers to program state will also leave historic mode immediately by applying to thecurrent program state instead. For instance, ‘Up’ leaves historic mode immediately and selects an alternateframe in the restored current program state.
If you want to see the history of a specific variable, as recorded during program stops, you can enter theDDD command
graph history name
This returns a list of all previously recorded values of the variablename, using array syntax. Note thatnamemust have been displayed at earlier program stops in order to record values.
Examining ThreadsNote: Thread support is available withGDB andJDB only.
In some operating systems, a single program may have more than onethread of execution. The precisesemantics of threads differ from one operating system to another, but in general the threads of a single pro-gram are akin to multiple processes—except that they share one address space (that is, they can all examineand modify the same variables). On the other hand, each thread has its own registers and execution stack,and perhaps private memory.
For debugging purposes,DDD lets you display the list of threads currently active in your program and letsyou select thecurrent thread—the thread which is the focus of debugging.DDD shows all program infor-mation from the perspective of the current thread.
DDD 3.1 1998−12−01 16

( ) ( )
Current thread
Change thread properties
Click on group to toggle view
Selecting Threads
To view all currently active threads in your program, select ‘Status→Threads’. The current thread is high-lighted. Select any thread to make it the current thread.
UsingJDB, additional functionality is available:
• Select athread groupto switch between viewing all threads and the threads of the selected thread group;
• Click on ‘Suspend’ to suspend execution of the selected threads;
• Click on ‘Resume’ to resume execution of the selected threads.
For more information on threads, see theJDB andGDB documentation.
Handling SignalsNote: Signal support is available withGDB only.
A signal is an asynchronous event that can happen in a program. The operating system defines the possiblekinds of signals, and gives each kind a name and a number. For example, in UnixSIGINT is the signal aprogram gets when you type an interrupt;SIGSEGV is the signal a program gets from referencing a placein memory far away from all the areas in use;SIGALRM occurs when the alarm clock timer goes off(which happens only if your program has requested an alarm).
Some signals, includingSIGALRM , are a normal part of the functioning of your program. Others, such asSIGSEGV, indicate errors; these signals arefatal (kill your program immediately) if the program has notspecified in advance some other way to handle the signal.SIGINT does not indicate an error in your pro-gram, but it is normally fatal so it can carry out the purpose of the interrupt: to kill the program.
GDB has the ability to detect any occurrence of a signal in your program. You can tellGDB in advancewhat to do for each kind of signal.
Normally, DDD is set up to ignore non-erroneous signals likeSIGALRM (so as not to interfere with theirrole in the functioning of your program) but to stop your program immediately whenever an error signalhappens. InDDD, you can change these settings via ‘Status→Signals’.
‘Status→Signals’ pops up a panel showing all the kinds of signals and howGDB has been told to handleeach one. The settings available for each signal are:
Stop If set, GDB should stop your program when this signal happens. This also implies ‘Print ’being set.If unset,GDB should not stop your program when this signal happens. It may still print a mes-sage telling you that the signal has come in.
DDD 3.1 1998−12−01 17

( ) ( )
Print If set,GDB should print a message when this signal happens.If unset,GDB should not mention the occurrence of the signal at all. This also implies ‘Stop’being unset.
Pass If set, GDB should allow your program to see this signal; your program can handle the signal,or else it may terminate if the signal is fatal and not handled.If unset,GDB should not allow your program to see this signal.
GDB Signal Handling Panel (Excerpt)
The entry ‘All Signals’ is special. Changing a setting here affectsall signals at once—except those usedby the debugger, typically SIGTRAP and SIGINT.
To undo any changes, use ‘Edit→Undo’. The ‘Reset’ button restores the saved settings.
When a signal stops your program, the signal is not visible until you continue. Your program sees the sig-nal then, if ‘Pass’ is in effect for the signal in questionat that time. In other words, afterGDB reports a sig-nal, you can change the ‘Pass’ setting in ‘Status→Signals’ to control whether your program sees that sig-nal when you continue.
You can also cause your program to see a signal it normally would not see, or to give it any signal at anytime. The ‘Send’ button will resume execution where your program stopped, but immediately give it thesignal shown.
On the other hand, you can also prevent your program from seeing a signal. For example, if your programstopped due to some sort of memory reference error, you might store correct values into the erroneous vari-ables and continue, hoping to see more execution; but your program would probably terminate immediatelyas a result of the fatal signal once it saw the signal. To prevent this, you can resume execution using ‘Com-mands→Continue Without Signal’.
‘Edit→Save Options’ does not save changed signal settings, since changed signal settings are normally
DDD 3.1 1998−12−01 18

( ) ( )
useful within specific projects only. Instead, signal settings are saved with the current session, using‘File→Save Session As’.
EXAMINING DAT ADDD provides several means to examine data.
Value HintsThe quickest way to examine variables is to move the pointer on an occurrence in the sourcetext. The value is displayed in the source line; after a second, a popup window shows the vari-able value. This is useful for quick examination of several simple variables.
Printing ValuesIf you want to reuse variable values at a later time, you can print the value in the debugger con-sole. This allows for displaying and examining larger data structures.
Displaying ValuesIf you want to examine complex data structures, you can display them graphically in the datadisplay. Displays remain effective until you delete them; they are updated each time the pro-gram stops. This is useful for large dynamic structures.
Plotting ValuesIf you want to examine arrays of numeric values, you can plot them graphically in a separateplot window. The plot is updated each time the program stops. This is useful for largenumeric arrays.
Memory DumpsThis feature, available usingGDB only, allows you to dump memory contents in any of sev eralformats, independently of your program’s data types. This is described under ‘MACHINE-LEVEL DEBUGGING ’, below.
Showing Simple Values using Value HintsTo display the value of a simple variable, move the mouse pointer on its name. After a second, a small win-dow (calledvalue tip) pops up showing the value of the variable pointed at. The window disappears assoon as you move the mouse pointer away from the variable. The value is also shown in the status line.
Displaying Simple Values using Value Tips
Move pointer on item
The value tip shows its value
Printing Simple Values in the Debugger ConsoleThe variable value can also be printed in the debugger console, making it available for further operations.To print a variable value, select the desired variable by clickingmouse button 1on its name. The variablename is copied to the argument field. By clicking the ‘Print () ’ button, the value is printed in the debugger
DDD 3.1 1998−12−01 19

( ) ( )
console. Note that the value is also shown in the status line.
As a shorter alternative, you can simply pressmouse button 3on the variable name and select the ‘Print ’item from the popup menu.
in the debugger consoleThe value is printed
Select ‘Print’ on item
Displaying Simple Values in the Debugger Console
Displaying Complex Values in the Data WindowTo explore complex data structures, you can use thegraphical data displayin thedata window. The datawindow holdsdisplaysshowing names and the values of variables. The display is updated each time theprogram stops.
To create a new display, select the desired variable by clickingmouse button 1on its name. The variablename is copied to the argument field. By clicking the ‘Display ()’ button, a new display is created in thedata window. The data window opens automatically as soon as you create a display.
Scroll the data display
Displaying Data
As a shorter alternative, you can simply pressmouse button 3on the variable name and select the ‘Display’item from the popup menu.
As an even faster alternative, you can also double-click on the variable name.
DDD 3.1 1998−12−01 20

( ) ( )
As another alternative, you may also enter the expression to be displayed in the argument field and press the‘Display ()’ button.
Finally, you may also enter
graph display expr[ clustered] [ at (x, y) ] [ dependent ondisplay] [ [ now or ] when in scope]
at the debugger prompt. The options have the following meaning:
• If the suffix ‘clustered’ is specified, the new data display is created in a cluster. See ‘Clustering Dis-plays’, below, for a discussion.
• If the suffix ‘at (x, y)’ is specified, the new data display is created at the position (x, y). Otherwise, adefault position is assigned.
• If the suffix ‘dependent ondisplay’ is giv en, an edge from the display numbered or nameddisplayto thenew display is created. Otherwise, no edge is created.
• If the suffix ‘when in scope’ is giv en, display creation isdeferreduntil execution reaches the givenscope(a function name, as in the backtrace output).
• If the suffix ‘now or when in scope’ is giv en,DDD attempts to create the display immediately. If displaycreation fails, it isdeferreduntil execution reaches the givenscope(a function name, as in the backtraceoutput).
• If no ‘when in’ suffix or ‘now or when in’ suffix is given, the display is created immediately.
If you created a display by mistake, use ‘Edit→Undo’ to undisplay it.
Selecting DisplaysEach display in the data window has atitle bar containing thedisplay numberand the displayed expression(thedisplay name). Below the title, thedisplay valueis shown.
You can select individual displays by clicking on them withmouse button 1. The resulting expression isshown in theargument field, below.
You canextendan existing selection by pressing theShift key while selecting. You can alsotoggle anexisting selection by pressing theShift key while selecting already selected displays.
Single displays may also be selected by using the arrow keys.
Selecting Multiple DisplaysMultiple displays are selected by pressing and holdingmouse button 1somewhere on the window back-ground. By moving the pointer while holding the button, a selection rectangle is shown; all displays fittingin the rectangle are selected when mouse button 1 is released.
If the Shift key is pressed while selecting, the existing selection isextended.
By double-clicking on a display title, the display itself and all connected displays are automaticallyselected.
DDD 3.1 1998−12−01 21

( ) ( )
Selecting Multiple Displays
Selection rectangle
Showing and Hiding ValuesAggregate values (i.e. records, structs, classes, and arrays) can be shownexpanded, that is, displaying alldetails, orhidden, that is, displayed as ‘{...}’.
To show details about an aggregate, select the aggregate by clickingmouse button 1on its name or valueand click on the ‘Show ()’ button. Details are shown for the aggregate itself as well as for all containedsub-aggregates.
To hide details about an aggregate, select the aggregate by clickingmouse button 1on its name or value andclick on the ‘Hide ()’ button.
Showing Display Detail
Detailed view Select and show detailHidden details
When pressing and holdingmouse button 1on the ‘Show ()/Hide ()’ button, a menu pops up with evenmore alternatives:
Show More ()Shows details of all aggregates currently hidden, but not of their sub-aggregates. You can invokethis item several times in a row to rev eal more and more details of the selected aggregate.
Show Just ()Shows details of the selected aggregate, but hides all sub-aggregates.
DDD 3.1 1998−12−01 22

( ) ( )
Show All ()Shows all details of the selected aggregate and of its sub-aggregates. This item is equivalent to the‘Show ()’ button.
Hide () Hide all details of the selected aggregate. This item is equivalent to the ‘Hide ()’ button.
As a faster alternative, you can also pressmouse button 3on the aggregate and select the appropriate menuitem.
As an even faster alternative, you can also double-clickmouse button 1on a value. If some part of thevalue is hidden, more details will be shown; if the entire value is shown, double-clicking willhide the valueinstead. This way, you can double-click on a value until you get the right amount of details.
If all details of a display are hidden, the display is calleddisabled; this is indicated by the string ‘(Dis-abled)’. Displays can also be disabled or enabled via theDDD commands
graph disable displaydisplays...
and
graph enable displaydisplays...
at the debugger prompt.displays...is either
• a space-separated list of display numbers to disable or enable, or
• a single display name. If you specify a display by name, all displays with this name will be affected.
Use ‘Edit→Undo’ to undo disabling or enabling displays.
Rotating ArraysArrays can be aligned horizontally or vertically. To change the alignment of an array, select it and thenclick on the ‘Rotate ()’ button.
As a faster alternative, you can also pressmouse button 3on the array and select the ‘Rotate’ menu item.
Select and Rotate
Rotating an Array
DDD 3.1 1998−12−01 23

( ) ( )
Displaying Dependent ValuesDependent displays are created from an existing display. The dependency is indicated by arrows leadingfrom the originating display to the dependent display.
To create a dependent display, select the originating display or display part and enter the dependent expres-sion in the ‘():’ argument field. Then click on the ‘Display’ button.
Using dependent displays, you can investigate the data structure of a “tree” for example and lay it outaccording to your intuitive image of the “tree” data structure.
By default,DDD does not recognize shared data structures (i.e. a data object referenced by multiple otherdata objects). See ‘Examining Shared Data Structures’, below, for details on how to examine such struc-tures.
Display ShortcutsDDD maintains ashortcut menuof frequently used display expressions. This menu is activated
• by pressing and holding the ‘Display’ button, or
• by pressingmouse button 3on some display and selecting ‘New Display’, or
• by pressingShift andmouse button 3on some display.
By default, the shortcut menu contains frequently used base conversions.
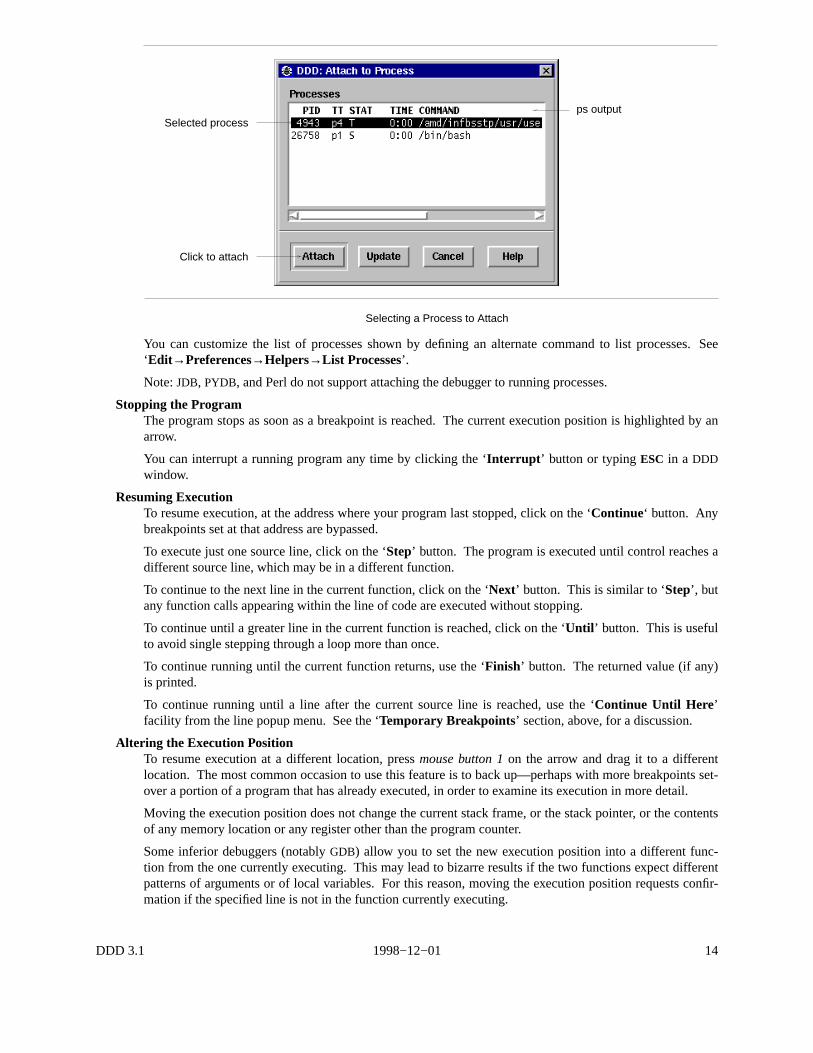
The ‘Other’ entry in the shortcut menu lets you create a new display thatextendsthe shortcut menu. As anexample, assume you have selected a display named ‘date_ptr’. Selecting ‘Display→Other’ pops up adialog that allows you to enter a new expression to be displayed -- for instance, you can cast the display‘date_ptr’ to a new display ‘(char *)date_ptr ’. If the ‘Include in ‘New Display’ Menu’ toggle was acti-vated, the shortcut menu will then contain a new entry ‘Display (char *)()’ that will castanyselected dis-play displayto ‘(char *)display’. Such shortcuts can save you a lot of time when examining complex datastructures.
Using Display Shortcuts
Modify expression here... ... to include it in the ‘New Display’ menu.
You can edit the contents of the ‘New Display’ menu by selecting its ‘Edit Menu ’ item. This pops up theShortcut Editorcontaining all shortcut expressions, which you can edit at leisure. Each line contains theexpression for exactly one menu item. Clicking on ‘Apply ’ re-creates the ‘New Display’ menu from thetext. If the text is empty, the ‘New Display’ menu will be empty, too.
DDD 3.1 1998−12−01 24
( ) ( )
Invoke shortcut editor
Editing Display Shortcuts
DDD also allows you to specify individual labels for user-defined buttons. You can write such a label afterthe expression, separated by ‘//’. This feature is used in the default contents of theGDB ‘New Display’menu, where each of the base conversions has a label:
/t () // Convert to Bin/d () // Convert to Dec/x () // Convert to Hex/o () // Convert to Oct
Feel free to add other conversions here.DDD supports up to 20 ‘New Display’ menu items.
Dereferencing PointersThere are special shortcuts for creating dependent displays showing the value of a dereferenced pointer.This allows for rapid examination of pointer-based data structures.
To dereference a pointer, select the originating pointer value or name and click on the ‘Display *()’ button.A new display showing the dereferenced pointer value is created.
As a faster alternative, you can also pressmouse button 3on the originating pointer value or name andselect the ‘Display *’ menu item.
As an even faster alternative, you can also double-clickmouse button 1on the originating pointer value orname. If you pressCtrl while double-clicking, the display will be dereferencedin place--that is, it will bereplaced by the dereferenced display.
The ‘Display *()’ function is also accessible by pressing and holding the ‘Display ()’ button.
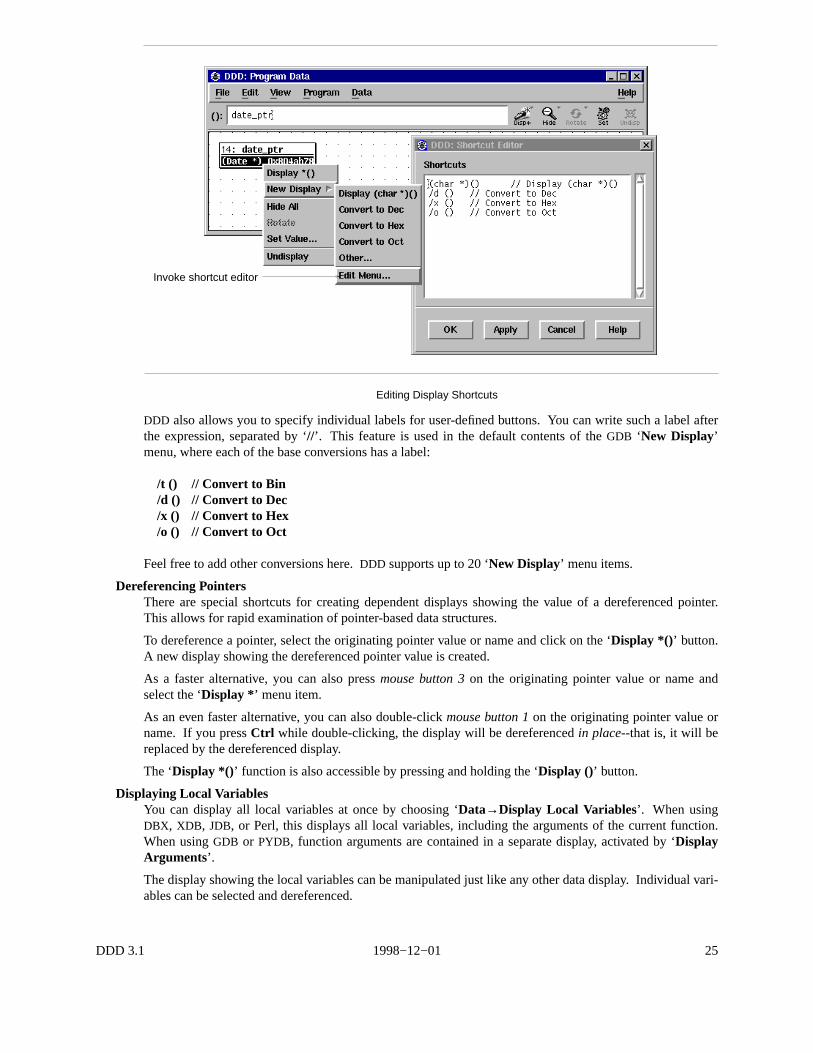
Displaying Local VariablesYou can display all local variables at once by choosing ‘Data→Display Local Variables’. When usingDBX, XDB, JDB, or Perl, this displays all local variables, including the arguments of the current function.When usingGDB or PYDB, function arguments are contained in a separate display, activated by ‘DisplayArguments’.
The display showing the local variables can be manipulated just like any other data display. Individual vari-ables can be selected and dereferenced.
DDD 3.1 1998−12−01 25
( ) ( )
Dereferencing a Local Variable
via popup menuDereference
Local arguments
Dereferenced pointer
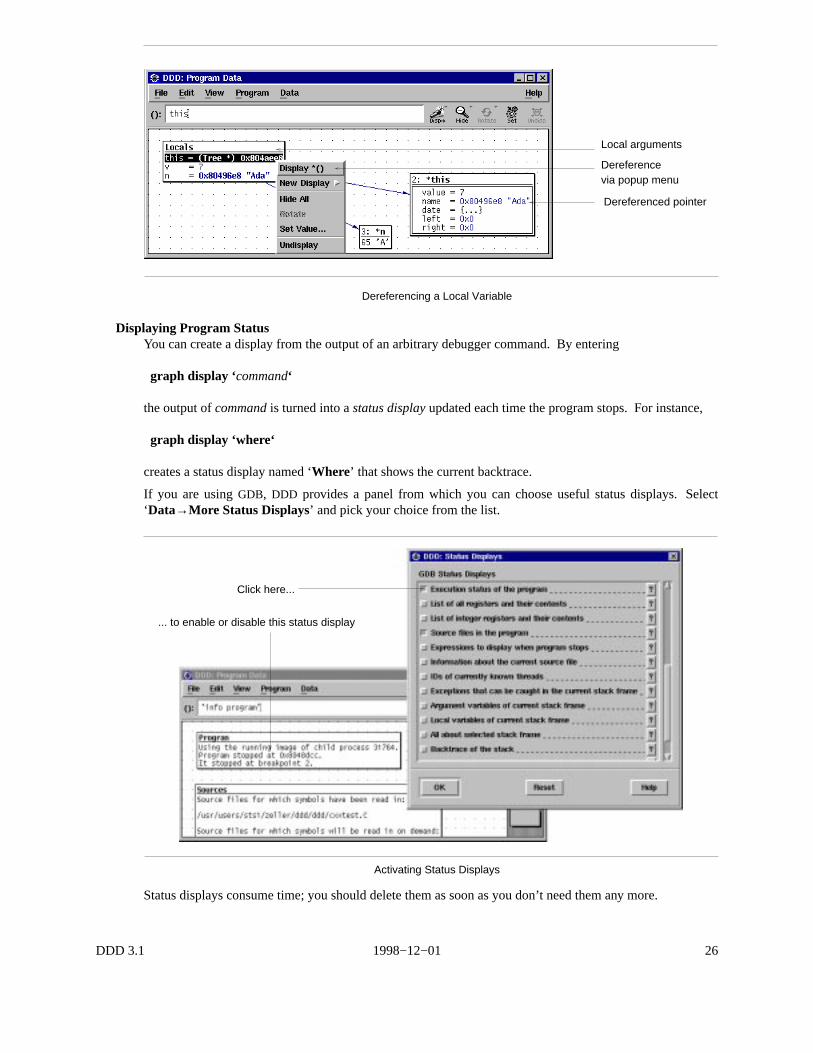
Displaying Program StatusYou can create a display from the output of an arbitrary debugger command. By entering
graph display ‘command‘
the output ofcommandis turned into astatus displayupdated each time the program stops. For instance,
graph display ‘where‘
creates a status display named ‘Where’ that shows the current backtrace.
If you are usingGDB, DDD provides a panel from which you can choose useful status displays. Select‘Data→More Status Displays’ and pick your choice from the list.
Click here...
... to enable or disable this status display
Activating Status Displays
Status displays consume time; you should delete them as soon as you don’t need them any more.
DDD 3.1 1998−12−01 26

( ) ( )
Displaying Multiple Array ValuesWhen debugging C or C++ programs, one often has to deal with pointers to arrays of dynamically deter-mined size. BothDDD andGDB provide special support for such dynamic arrays.
To display several successive objects of the same type (a section of an array, or an array of dynamicallydetermined size), use the notation[FROM..TO] in display expressions.FROMandTO denote the first andlast array position to display. Thus,
graph display argv[0..9]
creates ten new display nodes for ‘argv[0]’, ‘ argv[1]’, ..., ‘argv[9]’.
UsingGDB as inferior debugger, you can useartificial arrays. Typing
graph display argv[0] @ 10
creates a single array display node containing ‘argv[0]’ up to ‘argv[9]’. Generally, by using the ‘@’ opera-tor, you can specify the number of array elements to be displayed.
For more details on artificial arrays, see theGDB documentation.
Repeated Array ValuesUsing GDB, an array value that is repeated 10 or more times is displayed only once. The value is shownwith a ‘<N×>’ postfix added, whereN is the number of times the value is repeated. Thus, the display ‘0x0<30×>’ stands for 30 array elements, each with the value0x0. This saves a lot of display space, especiallywith homogeneous arrays.
Displaying Repeated Array Values
Repeated Value
The defaultGDB threshold for repeated array values is 10. You can change it via ‘Edit→GDB Set-tings→Threshold for repeated print elements’. Setting the threshold to0 will causeGDB (andDDD) todisplay each array element individually. Be sure to refresh the data window via ‘Data→Refresh Displays’after a change inGDB settings.
You can also configureDDD to display each array element individually, reg ardless ofGDB settings; see the‘expandRepeatedValues’ resource for details.
Altering Variable ValuesUsing the ‘Set ()’ button or the ‘Set Value’ menu item in the data popup menu, you can alter the value ofthe selected variable, to resume execution with the changed value. In a dialog, you can modify the variablevalue at will; clicking the ‘OK ’ or ‘ Apply ’ button commits your change.
DDD 3.1 1998−12−01 27

( ) ( )
Changing Variable Values
Select to set
Enter new value here
If you made a mistake, you can use ‘Edit→Undo’ to re-set the variable to its previous value.
Note: Altering variable values is not supported inJDB.
Refreshing the Data WindowThe data window refreshes itself automatically each time the program stops. Values that have changed arehighlighted.
However, there may be situations where you should refresh the data window explicitly. This is especiallythe case whenever you changed debugger settings that could affect the data format, and want the data win-dow to reflect these settings.
You can refresh the data window by selecting ‘Data→Refresh Displays’.
As an alternative, you can pressmouse button 3on the background of the data window and select the‘Refresh Display’ item.
Typing
graph refresh
at the debugger prompt has the same effect.
Deleting DisplaysTo delete a single display, select it and click on the ‘Delete ()’ button. As an alternative, you can also pressmouse button 3on the display and select the ‘Delete Display’ item.
When a display is deleted, its immediate ancestors and descendants are automatically selected, so that youcan easily delete entire graphs.
To delete several displays at once, select the ‘Delete’ item in the Display Editor (invoked via ‘Data→EditDisplays’). Select any number of display items in the usual way and delete them by pressing ‘Delete’.
As an alternative, you can also type
graph undisplay displays...
at the debugger prompt.displays...is either
• a space-separated list of display numbers to delete, or
• a single display name. If you specify a display by name, all displays with this name will be deleted.
If you are using stacked windows, deleting the last display from the data window also automatically closes
DDD 3.1 1998−12−01 28

( ) ( )
the data window. (You can change this via ‘Edit→Preferences→Data→Close data window when delet-ing last display’.)
If you deleted a display by mistake, use ‘Edit→Undo’ to re-create it.
Examining Shared Data StructuresBy default,DDD does not recognize shared data structures—that is, a data object referenced by multipleother data objects. For instance, if two pointersp1 andp2 point at the same data objectd, the data displaysd, *p1, and*p2 will be separate, although they denote the same object.
DDD provides a special mode which makes it detect these situations.DDD recognizes if two or more datadisplays are stored at the same physical address, and if this is so, merges all thesealiasesinto one singledata display, theoriginal data display. This mode is calledAlias Detection; it is enabled via the‘Data→Detect Aliases’.
When alias detection is enabled,DDD inquires the memory location (theaddress) of each data display aftereach program step. If two displays have the same address, they are merged into one. More specifically,only the one which has least recently changed remains (theoriginal data display); all other aliases aresup-pressed, i.e. completely hidden. The edges leading to the aliases are replaced by edges leading to the origi-nal data display.
An edge created by alias detection is somewhat special: rather than connecting two displays directly, it goesthrough anedge hint, describing an arc connecting the two displays and the edge hint.
Each edge hint is a placeholder for a suppressed alias; selecting an edge hint is equivalent to selecting thealias. This way, you can easily delete display aliases by simply selecting the edge hint and clicking on‘Undisplay ()’.
Examining Shared Data Structures
Original Display Edge Hint
To access suppressed display aliases, you can also use the Display Editor. Suppressed displays are listed inthe Display Editor asaliasesof the original data display. Via the Display Editor, you can select, change,and delete suppressed displays.
Suppressed displays become visible again as soon as
• alias detection is disabled,
• their address changes such that they are no more aliases, or
• the original data display is deleted, such that the least recently changed alias becomes the new originaldata display.
Please note the followingcaveatswith alias detection:
DDD 3.1 1998−12−01 29

( ) ( )
• Alias detection requires that the current programming language provides a means to determine theaddress of an arbitrary data object. Currently, only C and C++ are supported.
• Some inferior debuggers (for instance, SunOSDBX) produce incorrect output for address expressions.Given a pointerp, you may verify the correct function of your inferior debugger by comparing the valuesof p and & p (unlessp actually points to itself). You can also examine the data display addresses, asshown in the Display Editor.
• Alias detection slows downDDD slightly, which is why it is disabled by default. You may consider toenable it only at need—for instance, while examining some complex data structure—and disable it whileexamining control flow (i.e., stepping through your program).DDD will automatically restore edges anddata displays when switching modes.
Suppressed Display Alias
The Display Editor
Clustering DisplaysIf you examine several variables at once, having a separate display for each of them uses a lot of screenspace. This is whyDDD supportsclusters. A cluster merges several logical data displays into one physicaldisplay, saving screen space.
There are two ways to create clusters:
• You can create clustersmanually. This is done by selecting the displays to be clustered and choosing‘Undisp→Cluster ()’. This creates a new cluster from all selected displays. If an already existing clus-ter is selected, too, the selected displays will be clustered into the selected cluster.
• You can create a clusterautomaticallyfor all independent data displays, such that all new data displayswill automatically be clustered, too. This is achieved by enabling ‘Edit→Preferences→Data→ClusterData Displays’.
DDD 3.1 1998−12−01 30

( ) ( )
Displays
uni =
ii = 7bit1 = 1bit2 = 3u = {...}
guni = ii = 1{...}{...}
pi = 3.14159274sqrt2 = 1.4142135623730951
1: uni
ii = 7bit1 = 1bit2 = 3u = {...}
2: guni
ii = 1{...}{...} 4: sqrt2
1.4142135623730951
3: pi3.14159274
Clustered and Unclustered Displays
Displays in a cluster can be selected and manipulated like parts of an ordinary display; in particular, youcan show and hide details, or dereference pointers. However, edges leading to clustered displays can not beshown, and you must either select one or all clustered displays.
Disabling a cluster is calledunclustering, and again, there are two ways of doing it:
• You can uncluster displaysmanually, by selecting the cluster and choosing ‘Undisp→Uncluster ()’.
• You can uncluster all current and future displays by disabling ‘Edit→Preferences→Data→ClusterData Displays’.
Moving Displays AroundFrom time to time, you may wish to move displays at another place in the data window. You can move asingle display by pressing and holdingmouse button 1on the display title. Moving the pointer while hold-ing the button causes all selected displays to move along with the pointer.
If the data window becomes too small to hold all displays, scroll bars are created. If yourDDD is set up tousepannersinstead, a panner is created in the lower right edge. When the panner is moved around, thewindow view follows the position of the panner. See ‘CUSTOMIZING DDD ’, below, for details on howto set up scroll bars or panners.
For fine-grain movements, selected displays may also be moved using the arrow keys. PressingShift andan arrow key moves displays by single pixels. PressingCtrl and arrow keys moves displays by grid posi-tions.
Edge hints can be selected and moved around like other displays. If an arc goes through the edge hint, youcan change the shape of the arc by moving the edge hint around.
Aligning DisplaysYou can align all displays on the nearest grid position by selecting ‘Data→Align on Grid ’. This is usefulfor keeping edges horizontal or vertical.
You can enforce alignment by selecting ‘Edit→Preferences→Data→Auto-align displays on nearest gridpoint’. If this feature is enabled, displays can be moved on grid positions only.
Layouting the Display GraphYou can layout the entire graph as a tree by selecting ‘Data→Layout Graph ’.
Layouting the graph may introduceedge hints; that is, edges are no more straight lines, but lead to an edgehint and from there to their destination. Edge hints can be moved around like arbitrary displays.
To enable a more compact layout, you can set the ‘Edit→Preferences→Data→Compact layout’ option.This realizes an alternate layout algorithm, where successors are placed next to their parents. This algo-rithm is suitable for homogeneous data structures only.
You can enforce layout by setting ‘Edit→Preferences→Data→ Automatic Layout ’. If automatic layoutis enabled, the graph is layouted after each change.
DDD 3.1 1998−12−01 31

( ) ( )
A Layouted Graph (with Compact Layout)
Rotating the Display GraphYou can rotate the entire graph clockwise by 90 degrees by selecting ‘Data→Rotate Graph’.
If the graph was previously layouted, you may need to layout it again. Subsequent layouts will respect thedirection of the last rotation.
Printing the Display GraphDDD allows for printing the graph picture on PostScript printers or into files. This is useful for document-ing program states.
Printing displays
Enter print command
Select paper size
Click to print
To print the graph on a PostScript printer, select ‘File→Print Graph ’. Enter the printing command in the‘Print Command’ field. Click on the ‘OK ’ or the ‘Apply ’ button to start printing.
As an alternative, you may also print the graph in a file. Click on the ‘File’ button and enter the file name
DDD 3.1 1998−12−01 32

( ) ( )
in the ‘File Name’ field. Click on the ‘Print ’ button to create the file.
When the graph is printed in a file, two formats are available:
• PostScript—suitable for enclosing the graph in another document;
• FIG—suitable for post-processing, using theXFIG graphic editor, or for conversion into other formats(among othersIBMGL, LATEX, PIC), using theTRANSFIGor FIG2DEV package.
*() next next
next
self self self
5: list(List *) 0x804af30
value = 86self = 0x804af40next = 0x804af50
value = 87self = 0x804af50next = 0x804af30
value = 85self = 0x804af30next = 0x804af40
Output of the ‘Print Graph’ Command
Please note the followingcaveatsrelated to printing graphs:
• If any displays were selected when invoking the ‘Print ’ dialog, the option ‘Selected Only’ is set. ThismakesDDD print only the selected displays.
• The ‘Color’, ‘ Orientation ’, and ‘Paper Size’ options are meaningful for PostScript only.
PLOTTING DAT AIf you have huge amounts of numerical data to examine, a picture often says more than a thousand num-bers. Therefore,DDD allows you to draw numerical values in nice 2-D and 3-D plots.
Plotting ArraysBasically,DDD can plot two types of numerical values:
• One-dimensional arrays. These are drawn in a 2-DX/Y space, whereX denotes the array index, andY theelement value.
• Two-dimensional arrays. These are drawn in a 3-DX/Y/Z space, whereX andY denote the array indexes,andZ the element value.
To plot an array, select it by clickingmouse button 1on an occurrence. The array name is copied to theargument field. By clicking the ‘Plot’ button, a new display is created in the data window, followed by anew top-level window containing the value plot.
Each time the value changes during program execution, the plot is updated to reflect the current values.The plot window remains active until you close it (via ‘File→Close’) or until the associated display isdeleted.
Changing the Plot AppearanceThe actual drawing is not done byDDD itself. Instead,DDD relies on an external Gnuplot program to cre-ate the drawing.DDD adds a menu bar to the Gnuplot plot window that lets you influence the appearanceof the plot:
• The ‘View’ menu toggles optional parts of the plot, such as border lines or a background grid.
• The ‘Plot’ menu changes the plotting style. The ‘3-D Lines’ option is useful for plotting two-dimensional arrays.
• The ‘Scale’ menu allows you to enable logarithmic scaling and to enable or disable the scale tics.
• The ‘Contour’ menu adds contour lines to 3-D plots.
You can also resize the plot window as desired.
DDD 3.1 1998−12−01 33

( ) ( )
In a 3-D plot, you can use the scroll bars to change your view position. The horizontal scroll bar rotates theplot around theZ axis, that is, to the left and right. The vertical scroll bar rotates the plot around theY axis,that is, up and down.
Plotting 1-D and 2-D Arrays
Rotate View
Change Style
A 2-D Array
A 1-D Array
Plotting Scalars and CompositesBesides plotting arrays,DDD also allows you to plot scalars (simple numerical values). This works just likeplotting arrays—you select the numerical variable, click on ‘Plot’, and here comes the plot. However, plot-ting a scalar is not very exciting. A plot that contains nothing but a scalar simply draws the scalar’s valueas aY constant—that is, a horizontal line.
So why care about scalars at all?DDD allows you to combine multiple values into one plot. The basic ideais: if you want to plot something that is neither an array nor a scalar,DDD takes all numerical sub-values itcan find and plots them all together in one window. For instance, you can plot all local variables by select-ing ‘Data→Display Local Variables’, followed by ‘Plot’. This will create a plot containing all numericalvalues as found in the current local variables. Likewise, you can plot all numeric members contained in astructure by selecting it, followed by ‘Plot’.
If you want more control about what to include in a plot and what not, you can use display clusters. (See‘Clustering Displays’, above, for details on clusters.) A common scenario is to plot a one-dimensionalarray together with the current index position. This is done in three steps:
• Display the array and the index, using ‘Display ()’.
• Cluster both displays: select them and choose ‘Undisp→Cluster ()’.
• Plot the cluster by pressing ‘Plot’.
Scalars that are displayed together with arrays can be displayed either as vertical lines or horizontal lines.By default, scalars are plotted as horizontal lines. However, if a scalar is a valid index for an array that waspreviously plotted, it is shown as a vertical line. You can change this initial alignment by selecting thescalar display, followed by ‘Rotate ()’.
Plotting Display HistoriesAt each program stop,DDD records the values of all displayed variables. Thesedisplay historiescan beplotted, too. The menu item ‘Plot→Plot history of ()’ creates a plot that shows all previously recorded val-ues of the selected display.
DDD 3.1 1998−12−01 34
( ) ( )
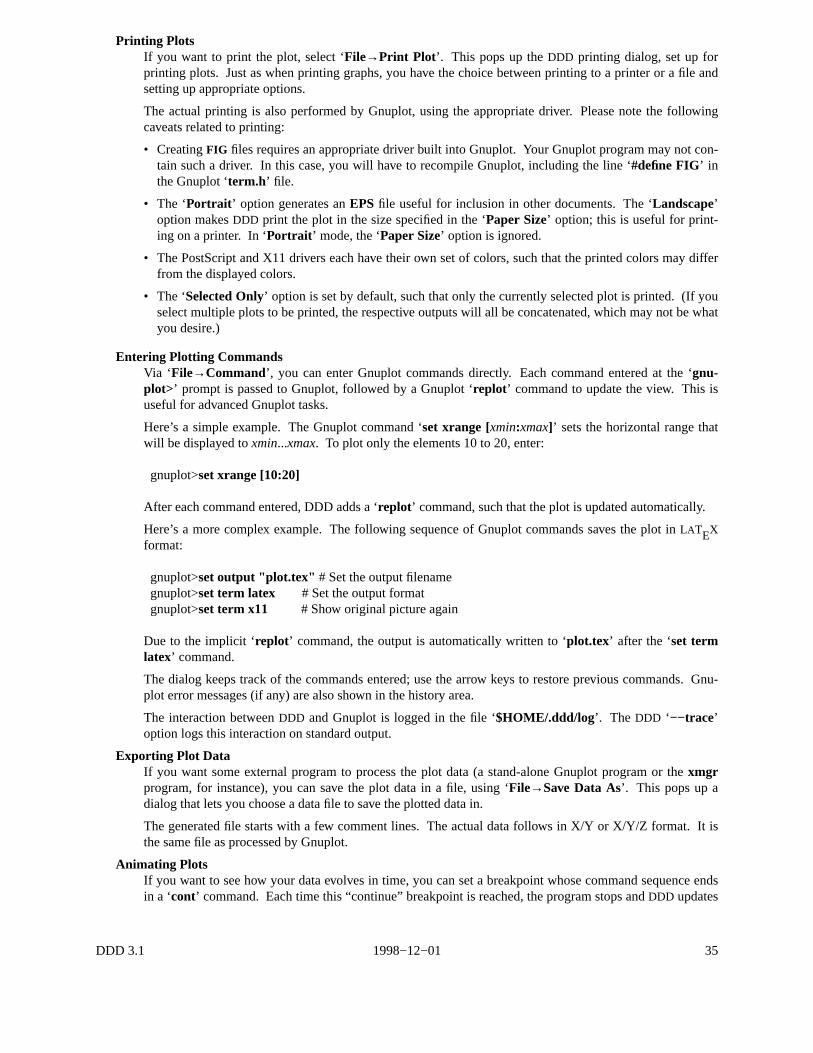
Printing PlotsIf you want to print the plot, select ‘File→Print Plot ’. This pops up theDDD printing dialog, set up forprinting plots. Just as when printing graphs, you have the choice between printing to a printer or a file andsetting up appropriate options.
The actual printing is also performed by Gnuplot, using the appropriate driver. Please note the followingcaveats related to printing:
• CreatingFIG files requires an appropriate driver built into Gnuplot. Your Gnuplot program may not con-tain such a driver. In this case, you will have to recompile Gnuplot, including the line ‘#define FIG’ inthe Gnuplot ‘term.h’ file.
• The ‘Portrait ’ option generates anEPS file useful for inclusion in other documents. The ‘Landscape’option makesDDD print the plot in the size specified in the ‘Paper Size’ option; this is useful for print-ing on a printer. In ‘Portrait ’ mode, the ‘Paper Size’ option is ignored.
• The PostScript and X11 drivers each have their own set of colors, such that the printed colors may differfrom the displayed colors.
• The ‘Selected Only’ option is set by default, such that only the currently selected plot is printed. (If youselect multiple plots to be printed, the respective outputs will all be concatenated, which may not be whatyou desire.)
Entering Plotting CommandsVia ‘File→Command’, you can enter Gnuplot commands directly. Each command entered at the ‘gnu-plot>’ prompt is passed to Gnuplot, followed by a Gnuplot ‘replot’ command to update the view. This isuseful for advanced Gnuplot tasks.
Here’s a simple example. The Gnuplot command ‘set xrange [xmin:xmax]’ sets the horizontal range thatwill be displayed toxmin...xmax. To plot only the elements 10 to 20, enter:
gnuplot>set xrange [10:20]
After each command entered, DDD adds a ‘replot’ command, such that the plot is updated automatically.
Here’s a more complex example. The following sequence of Gnuplot commands saves the plot inLATEXformat:
gnuplot>set output "plot.tex" # Set the output filenamegnuplot>set term latex # Set the output formatgnuplot>set term x11 # Show original picture again
Due to the implicit ‘replot’ command, the output is automatically written to ‘plot.tex’ after the ‘set termlatex’ command.
The dialog keeps track of the commands entered; use the arrow keys to restore previous commands. Gnu-plot error messages (if any) are also shown in the history area.
The interaction betweenDDD and Gnuplot is logged in the file ‘$HOME/.ddd/log’. The DDD ‘−−trace’option logs this interaction on standard output.
Exporting Plot DataIf you want some external program to process the plot data (a stand-alone Gnuplot program or thexmgrprogram, for instance), you can save the plot data in a file, using ‘File→Save Data As’. This pops up adialog that lets you choose a data file to save the plotted data in.
The generated file starts with a few comment lines. The actual data follows in X/Y or X/Y/Z format. It isthe same file as processed by Gnuplot.
Animating PlotsIf you want to see how your data evolves in time, you can set a breakpoint whose command sequence endsin a ‘cont’ command. Each time this “continue” breakpoint is reached, the program stops andDDD updates
DDD 3.1 1998−12−01 35

( ) ( )
the displayed values, including the plots. Then,DDD executes the breakpoint command sequence, resum-ing execution.
This way, you can set a “continue” breakpoint at some decisive point within an array-processing algorithmand haveDDD display the progress graphically. When your program has topped for good, you can use‘Undo’ and ‘Redo’ to redisplay and examine previous program states.
MACHINE-LEVEL DEBUGGINGNote: Machine-level support is available withGDB only.
Sometimes, it is desirable to examine a program not only at the source level, but also at the machine level.DDD provides special machine code and register windows for this task.
Examining Machine CodeTo enable machine-level support, select ‘Source→Display Machine Code’. With machine code enabled,an additionalmachine code windowshows up, displaying the machine code of the current function. Bymoving the sash at the right of the separating line between source and machine code, you can resize thesource and machine code windows.
Showing Machine Code
Assembler instructions
Step one instruction
The machine code window works very much like the source window. You can set, clear, and change break-points by selecting the address and pressing a ‘Break at ()’ or ‘ Clear at ()’ button; the usual popup menusare also available. Breakpoints and the current execution position are displayed simultaneously in bothsource and machine code.
The ‘Lookup ()’ button can be used to look up the machine code for a specific function—or the functionfor a specific address. Just click on the location in one window and press ‘Lookup ()’ to see the corre-sponding code in the other window.
The ‘maxDisassemble’ resource controls how much is to be disassembled. If ‘maxDisassemble’ is set to256 (default) and the current function is larger than 256 bytes,DDD only disassembles the first 256 bytesbelow the current location. You can set the ‘maxDisassemble’ resource to a larger value if you prefer tohave a larger machine code view.
If source code is not available, only the machine code window is updated.
ExecutionAll execution facilities available in the source code window are available in the machine code window aswell. Two special facilities are convenient for machine-level debugging:
DDD 3.1 1998−12−01 36

( ) ( )
To execute just one machine instruction, click on the ‘Stepi’ button.
To continue to the next instruction in the current function, click on the ‘Nexti’ button. This is similar to‘Stepi’, but any subroutine calls are executed without stopping.
RegistersDDD provides aregister windowshowing the machine register values after each program stop. To enablethe register window, select ‘Status→Registers’.
By selecting one of the registers, its name is copied to the argument field. You can use it as value for ‘Dis-play ()’, for instance, to have its value displayed in the data window.
Displaying Register Values
Select register
is copied to ()
The register name
Examining MemoryUsing GDB or DBX, you can examine memory in any of sev eral formats, independently of your program’sdata types. The item ‘Data→Examine Memory’ pops up a panel where you can choose the format to beshown.
You can enter
• a repeat count, a decimal integer that specifies how much memory (counting by units) to display
• adisplay format—one of
octal Print as integer in octal
hex Regard the bits of the value as an integer, and print the integer in hexadecimal.
decimal Print as integer in signed decimal.
unsigned Print as integer in unsigned decimal.
binary Print as integer in binary.
float Regard the bits of the value as a floating point number and print using typical floating pointsyntax.
address Print as an address, both absolute in hexadecimal and as an offset from the nearest precedingsymbol.
DDD 3.1 1998−12−01 37

( ) ( )
instructionPrint as machine instructions. Theunit sizeis ignored for this display format.
char Regard as an integer and print it as a character constant.
string Print as null-terminated string. Theunit sizeis ignored for this display format.
• aunit size—one of
bytes Bytes.
halfwords Halfwords (two bytes).
words Words (four bytes).
giants Giant words (eight bytes).
• anaddress—the starting display address. The expression need not have a pointer value (though it may);it is always interpreted as an integer address of a byte of memory.
There are two ways to examine the values:
• You can dump the memory in the debugger console (using ‘Print ’). If you repeat the resulting ‘x’ com-mand by pressingRETURN, the following area of memory is shown.
• You can also display the memory dump in the data window (using ‘Display’). If you choose to displaythe values, the values will be updated automatically each time the program stop.
Examining Memory
Click here to print...
... in the GDB console
Enter address here
Memory Dumpas Status Display
EDITING SOURCE CODEIn DDD itself, you cannot change the source file currently displayed. Instead,DDD allows you to invoke atext editor. To inv oke a text editor for the current source file, select the ‘Edit ’ button or ‘Source→EditSource’.
By default,DDD tries a number of common editors. You can customizeDDD to use your favourite editorvia ‘Edit→Preferences→Helpers→Edit Sources’.
DDD 3.1 1998−12−01 38

( ) ( )
After the editor has exited, the source code shown is automatically updated.
If you haveDDD and an editor running in parallel, you can also update the source code manually via‘Source→Reload Source’. This reloads the source code shown from the source file. SinceDDD automati-cally reloads the source code if the debugged program has been recompiled, this should seldom be neces-sary.
ENTERING COMMANDSIn thedebugger console, you can interact with the command interface of the inferior debugger. Enter com-mands at thedebugger prompt—that is, ‘(gdb)’ for GDB, ‘(dbx)’ for DBX, ‘>’ for XDB, ‘>’ and‘ thread[depth]’ for JDB, or ‘(Pydb)’ for PYDB, or ‘DB<>’ for Perl. You can use arbitrary debugger com-mands; use theRETURN key to enter them.
The Debugger Console
Prompt
Your Command
You canrepeatprevious and next commands by pressing the ‘Up’ and ‘Down’ arrow keys, respectively. Ifyou enter an empty line, the last command is repeated as well. ‘Commands→Command History’ showsthe command history.
Command Apply Selected CommandSearch String
Position in History
Searching with Ctrl+B in the Command History
You cansearchfor previous commands by pressingCtrl+B . This invokesincremental search mode,whereyou can enter a string to be searched in previous commands. PressCtrl+B again to repeat the search, orCtrl+F to search in the reverse direction. To return to normal mode, pressESC, or use any cursor
DDD 3.1 1998−12−01 39

( ) ( )
command.
Using GDB and Perl, you can alsocompletecommands and arguments by pressing theTAB key; pressingtheTAB key multiple times shows one possible expansion after the other.
CUSTOMIZING DDDYou can set up your personalDDD preferences by using the ‘Edit→Preferences’ menu from the menu bar.These preferences affect your runningDDD process only, unless you save these preferences for a laterDDDinvocation. Frequently used preferences can also be found in the individual menus.
Frequently Used PreferencesIf you want to run your debugged process in a separate terminal emulator window, set ‘Program→Run inExecution Window’. This is useful for programs that have special terminal requirements not provided bythe debugger window, as raw keyboard processing or terminal control sequences.
By default,DDD finds only complete words. This is convenient for clicking on an identifier in the sourcetext and search for exactly this identifier. If you want to find all occurrences, including word parts, unset‘Source→Find Words Only’.
By default,DDD find is case-sensitive. This is convenient for case-sensitive programming languages. Ifyou want to find all occurrences, regardless of case, unset ‘Source→Find Case Sensitive’.
If you wish to display machine code of selected functions, set ‘Source→Display Machine Code’. ThismakesDDD run a little slower, so it is disabled by default.
Through ‘Edit→Preferences’, you can set up moreDDD preferences, which are discussed here.
General PreferencesBy default, when you move the pointer over a button,DDD gives a hint on the button’s meaning in a smallwindow. This feature is known asbutton tips(also known astool tipsor balloon help). Experienced usersmay find these hints disturbing; this is why you can disable them by unsetting the ‘Automatic display ofbutton hints as popup tips’ option.
General Preferences
The button hints are also displayed in the status line. Disabling hints in status line (by unsetting the ‘Auto-matic display of button hints in the status line’ option) and disabling button tips as well makesDDD runslightly faster.
By default, when you move the pointer over a variable in the source code,DDD displays the variable valuein a small window. Users may find thesevalue tipsdisturbing; this is why you can disable them by unset-ting the ‘Automatic display of variable values as popup tips’ option.
DDD 3.1 1998−12−01 40

( ) ( )
The variable values are also displayed in the status line. Disabling variable values in status line (by unset-ting the ‘Automatic display of variable values in the status line’ option) and disabling value tips as wellwill makeDDD run slightly faster.
If you want to useTAB key completion in all text windows, set the ‘TAB key completes in all windows’option. This is useful if you have pointer-driven keyboard focus (see below) and no special usage for theTAB key. Otherwise, theTAB key completes in the debugger console only.
If you frequently switch betweenDDD and other multi-window applications, you may like to set the‘ Iconify all windows at once’ option. This way, allDDD windows are iconified and deiconified as a group.
If you want to keepDDD off your desktop during a longer computation, you may like to set the ‘Uniconifywhen ready’ option. This way, you can iconifyDDD while it is busy on a command (e.g. running a pro-gram); DDD will automatically pop up again after becoming ready (e.g. after the debugged program hasstopped at a breakpoint).
If you are bothered by X warnings, you can suppress them by setting the ‘Suppress X warnings’ option.
If you want to be warned about multipleDDD invocations sharing the same preferences and history files,enable ‘Warn if Multiple DDD Instances are Running’.
When debugging a modal X application,DDD may interrupt it while it has grabbed the pointer, making fur-ther interaction impossible. If the ‘Continue automatically when mouse pointer is frozen’ option is set,DDD will check after each interaction whether the pointer is grabbed. If this is so,DDD will continue thedebugged program such that you can continue to use your display.
The Undo Bufferis the area whereDDD stores old program states and commands in order to undo opera-tions. When you are displaying lots of data, the undo buffer can quickly grow. In ‘Undo Buffer Size’, youcan limit the size of the undo buffer. Setting this limit to0 disables undo altogether. A negative valuemeans to place no limit.
The ‘Reset’ button restores the most recently saved preferences.
Source PreferencesIn the source text, the current execution position and breakpoints are indicated by symbols (“glyphs”). Asan alternative,DDD can also indicate these positions using text characters. If you wish to disable glyphs,set the ‘As Text Characters’ option. This also makesDDD run slightly faster, especially when scrolling.
Source Preferences
DDD can locate the tool buttons in the command tool (‘Command Tool’) or in a command tool barabovethe program source (‘Source Window’). Pick your choice.
DDD 3.1 1998−12−01 41

( ) ( )
SomeDBX and XDB variants do not properly handle paths in source file specifications. If you want theinferior debugger to refer to source locations by source base names only, unset the ‘Refer to sources byfull path name’ option.
By default,DDD finds only complete words. This is convenient for clicking on an identifier in the sourcetext and search for exactly this identifier. If you want to find all occurrences, including word parts, unset‘Find words only’.
By default,DDD find is case-sensitive. This is convenient for case-sensitive programming languages. Ifyou want to find all occurrences, regardless of case, unset ‘Find case sensitive’.
By default,DDD caches source files in memory. This is convenient for remote debugging, since remote fileaccess may be slow. If you want to reduce memory usage, unset the ‘Cache source files’ option.
By default,DDD caches machine code in memory. This is bad for memory usage, but convenient for speed,since disassembling a function each time it is reached may take time. If you want to reduce memory usage,unset the ‘Cache machine code’ option.
If your source code uses a tab width different from8 (the default), you can set an alternate width using the‘Tab width ’ slider.
You can instructDDD to indent the source code, leaving more room for breakpoints and execution glyphs.This is done using the ‘Source indentation’ slider. The default value is0 for no indentation at all. If thesource indentation is5 or higher,DDD will also show line numbers.
Finally, you can instructDDD to indent the machine code, leaving room for breakpoints and executionglyphs. This is done using the ‘Machine code indentation’ slider. The default value is4.
The ‘Reset’ button restores the most recently saved preferences.
Data PreferencesYou can control whether edge hints and edge annotations are displayed. Set or unset the ‘Show EdgeHints’ and ‘Show Edge Annotations’ option, respectively.
By default,DDD disables the title of a dependent display if the name can be deduced from edge annota-tions. If you want all dependent displays to have a title, set ‘Show Titles of Dependent Displays’.
Data Preferences
To enable a more compact layout, you can set the ‘Compact Layout’ option. This realizes an alternate lay-out algorithm, where successors are placed next to their parents. This algorithm is suitable for homoge-neous data structures only.
To enforce layout, you can set the ‘Re-layout graph automatically’ option. If automatic layout is enabled,
DDD 3.1 1998−12−01 42

( ) ( )
the graph is layouted after each change.
If you wantDDD to detect aliases, set the ‘Detect Aliases’ option. Note that alias detection makesDDD runslower. See ‘Examining Shared Data Structures’, above, for details on alias detection.
By default, DDD displays two-dimensional arrays as tables, aligning the array elements in rows andcolumns. If you prefer viewing two-dimensional arrays as nested one-dimensional arrays, you can disablethe ‘Display two-dimensional arrays as tables’ option.
To facilitate alignment of data displays, you can set the ‘Auto-align displays’ option. If auto-alignment isenabled, displays can be moved on grid positions only.
By default, the stacked data window is automatically closed when you delete the last data display. You cankeep the data window open by unsetting ‘Close data window when deleting last display’.
In the ‘Grid Size’ scale, you can change the spacing of grid points. A spacing of 0 disables the grid.Default is 16.
The ‘Reset’ button restores the most recently saved preferences.
Startup PreferencesIf you change one of the resources in this panel, the change will not take effect immediately. Instead, youcan
• sav e options (using ‘Edit→Save Options’) to make the change effective for futureDDD sessions,
• or restartDDD (using ‘File→Restart DDD’) to make it effective for the restartedDDD session.
After having made changes in the panel,DDD will automatically offer you to restart itself, such that youcan see the changes taking effect. Note that even after restarting, you still must save options to make thechanges permanent.
Startup Preferences
By default,DDD stacks commands, source, and data in one single top-level window. To hav e separate top-level windows for source, data, and debugger console, set the ‘Window Layout ’ option to ‘Separate Win-dows’. See also the ‘−−attach-windows’ and ‘−−separate-windows’ options, below.
TheCtrl+C key can be bound to different actions, each in accordance with a specific style guide.
Copy This setting bindsCtrl+C to the Copy operation, as specified by theKDE style guide. In this set-ting, useESC to interrupt the debuggee.
DDD 3.1 1998−12−01 43

( ) ( )
InterruptThis (default) setting bindsCtrl+C to the Interrupt operation, as used in severalUNIX command-line programs. In this setting, useCtrl+Ins to copy text to the clipboard.
TheCtrl+A key can be bound to different actions, too.
Select AllThis (default) setting bindsCtrl+A to the Select All operation, as specified by theKDE styleguide. In this setting, useHOME tp move the cursor to the beginning of a line.
Beginning of LineThis setting bindsCtrl+A to the Beginning of Line operation, as used in severalUNIX text-editingprograms. In this setting, useCtrl+Shift+A to select all text.
TheDDD tool bar buttons can appear in a variety of styles:
Images This lets each tool bar button show an image illustrating the action.
CaptionsThis shows the action name below the image.
The default is to have images as well as captions, but you can choose to have only images (saving space) oronly captions.
Tool Bar Appearance
No captions, no images
Captions only, non-flat
Images only, flat
Captions, images, flat, color
If you choose to have neither images nor captions, tool bar buttons are labeled like other buttons, as inDDD2.x. Note that this implies that in the stacked window configuration, the common tool bar cannot be dis-played; it is replaced by two separate tool bars, as inDDD 2.x.
If you enable ‘Flat’ buttons (default), the border of tool bar buttons will appear only if the mouse pointer isover them. This latest-and-greatestGUI invention can be disabled, such that the button border is alwaysshown.
If you enable ‘Color’ buttons, tool bar images will be colored when entered. IfDDD was built using Motif2.0 and later, you can also choose a third setting, where buttons appear in color all the time.
By default, theDDD tool bars are located on top of the window. If you prefer the tool bar being located atthe bottom, as inDDD 2.x and earlier, enable the ‘Bottom’ toggle. The bottom setting is only supported forseparate tool bars—that is, you must either choose separate windows or configure the tool bar to have nei-ther images nor captions.
By default,DDD directs keyboard input to the item your mouse pointer points at. If you prefer a click-to-
DDD 3.1 1998−12−01 44

( ) ( )
type keyboard focus (that is, click on an item to make it accept keyboard input), set the ‘Keyboard Focus’option on ‘Click to Type’.
By default,DDD uses Motif scroll bars to scroll the data window. Many people find this inconvenient, sinceyou can scroll in the horizontal or vertical direction only. As an alternative,DDD provides a panner (a kindof two-dimensional scroll bar). This is much more comfortable, but may be incompatible with your Motiftoolkit. To set upDDD such that it uses panners by default, set the ‘Data Scrolling’ option to ‘Panner’.See also the ‘−−panned-graph-editor’ and ‘−−scrolled-graph-editor’ options, below.
By default,DDD determines the inferior debugger automatically. To change this default, unset ‘DetermineAutomatically ’ and set the ‘Debugger Type’ option to a specific debugger. See also the ‘−−gdb’,‘−−dbx’, ‘ −−xdb’, ‘ −−jdb ’, ‘ −−pydb’, and ‘−−perl’ options, below.
If you want theDDD splash screen shown upon startup, enable ‘DDD Splash Screen’.
If you want theDDD tips of the day displayed upon startup, enable ‘Tip of the Day’.
The ‘Reset’ button restores the most recently saved preferences.
FontsYou can configure the basicDDD fonts at run-time. Each font is specified using two members:
• The font family is an X font specifications, where the initial specification after ‘Family’. Thus, a pair‘ family−weight’ usually suffices.
• Thefont sizeis given as (resolution-independent) 1⁄10 points.
The ‘Browse’ button opens a font selection program, where you can select fonts and attributes interactively.Clicking ‘quit ’ or ‘ select’ in the font selector causes all non-default values to be transferred to theDDDfont preferences panel.
Setting Font Preferences
The following fonts can be set using the preferences panel:
Default FontThe defaultDDD font to use for labels, menus, and buttons. Default is ‘helvetica-bold’.
Variable WidthThe variable widthDDD font to use for help texts and messages. Default is ‘helvetica-medium’.
Fixed WidthThe fixed widthDDD font to use for source code, the debugger console, text fields, data displays,and the execution window. Default is ‘lucidatypewriter-medium ’.
DDD 3.1 1998−12−01 45

( ) ( )
Just like startup preferences, changes in this panel will not take effect immediately. Instead, you can
• sav e options (using ‘Edit→Save Options’) to make the change effective for futureDDD sessions,
• or restartDDD (using ‘File→Restart DDD’) to make it effective for the restartedDDD session.
After having made changes in the panel,DDD will automatically offer you to restart itself, such that youcan see the changes taking effect. Note that even after restarting, you still must save options to make thechanges permanent.
The ‘Reset’ button restores the most recently saved preferences.
HelpersDDD relies on some external applications (calledhelpers) for specific tasks. Through the ‘Helpers’ panel,you can choose and customize these applications.
In ‘Edit Sources’, you can select an X editor to be invoked via theDDD ‘Edit ’ button. ‘@FILE@’ isreplaced by the current file name; ‘@LINE@’ is replaced by the current line. Typical values include ‘xedit@FILE@’ or ‘ gnuclient +@LINE@ @FILE@’. See also the ‘editCommand’ resource, below.
In ‘Get Core File’, you can enter a command to get a core file from a running process. ‘@FILE@’ isreplaced by the name of the target core file; ‘@PID@’ is replaced by the process ID. A typical value is‘gcore -o @FILE@ @PID@’. If you don’t hav e an appropriate command, leave this value empty:DDDwill then kill the debuggee in order to get a core file. See also the ‘getCoreCommand’ resource, below.
‘List Processes’ is a command to get a list of processes, like ‘ps’. The output of this command is shown inthe ‘File→Attach to Process’ dialog. See also the ‘psCommand’ resource, below.
Setting Helpers Preferences
In ‘Execution Window’, you can enter a command to start a terminal emulator. To this command,DDDappends Bourne shell commands to be executed within the execution window. A simple value is ‘xterm −e/bin/sh −c’. See also the ‘termCommand’ resource, below.
‘Uncompress’ is the uncompression command used byDDD to uncompress theDDD license and manualpages. The uncompression command should be invoked such that it reads from standard input and writes tostandard output. A typical value is ‘gunzip −c’. See also the ‘uncompressCommand’ resource, below.
‘Web Bro wser’ is the command to invoke aWWW browser for theDDD WWW page. ‘@URL@’ isreplaced by theURL (web page) to be shown. A simple value is ‘netscape @URL@’. See also the ‘www-Command’ resource, below.
‘Plot’ is the name of a Gnuplot program to invoke.DDD can run Gnuplot in two ways:
DDD 3.1 1998−12−01 46

( ) ( )
• DDD can use anExternal Plot Window, i.e. the plot window as supplied by Gnuplot.DDD “swallows”the Gnuplot output window into its own user interface. Unfortunately, some window managers, notablyMWM, hav e trouble with swallowing techniques.
• DDD can supply aBuiltin Plot Window instead. This works with all window managers, but plots areless customizable (Gnuplot resources are not understood).
Pick your choice from the menu. See also the ‘plotCommand’ and ‘plotTermType’ resources, below.
Saving OptionsYou can save the current option settings by selecting ‘Edit→Save Options’. Options are saved in a filenamed ‘.ddd/init ’ in your home directory. If a sessionsessionis active, options will be saved in‘$HOME/.ddd/sessions/session/init ’ instead.
Other CustomizationsOther personalDDD resources can also be set in your ‘.ddd/init ’ file. See the ‘RESOURCES’ section,below.
The inferior debugger can be customized via ‘Edit→Settings’. See the ‘DEBUGGER SETTINGS’ sec-tion, below.
DEBUGGER SETTINGSFor most inferior debuggers, you can change its settings using ‘Edit→Settings’. Using the settings editor,you can determine whether C++ names are to be demangled, how many array elements are to print, and soon.
GDB Settings Panel (Excerpt)
The capabilities of the settings editor depend on the capabilities of your inferior debugger. Clicking on ‘?’gives an an explanation on the specific item; theGDB documentation gives more details.
Use ‘Edit→Undo’ to undo changes. Clicking on ‘Reset’ restores the most recently saved settings.
Some debugger settings are insensitive and cannot be changed, because doing so would endangerDDDoperation. See the ‘gdbInitCommands’ and ‘dbxInitCommands’ resources for details.
All debugger settings (except source and object paths) are saved withDDD options.
USER-DEFINED ACTIONSDefining Buttons
To facilitate interaction, you can add own command buttons toDDD. These buttons can be added below thedebugger console (‘Console Buttons’), the source window (‘Source Buttons’), or the data window (‘Data
DDD 3.1 1998−12−01 47
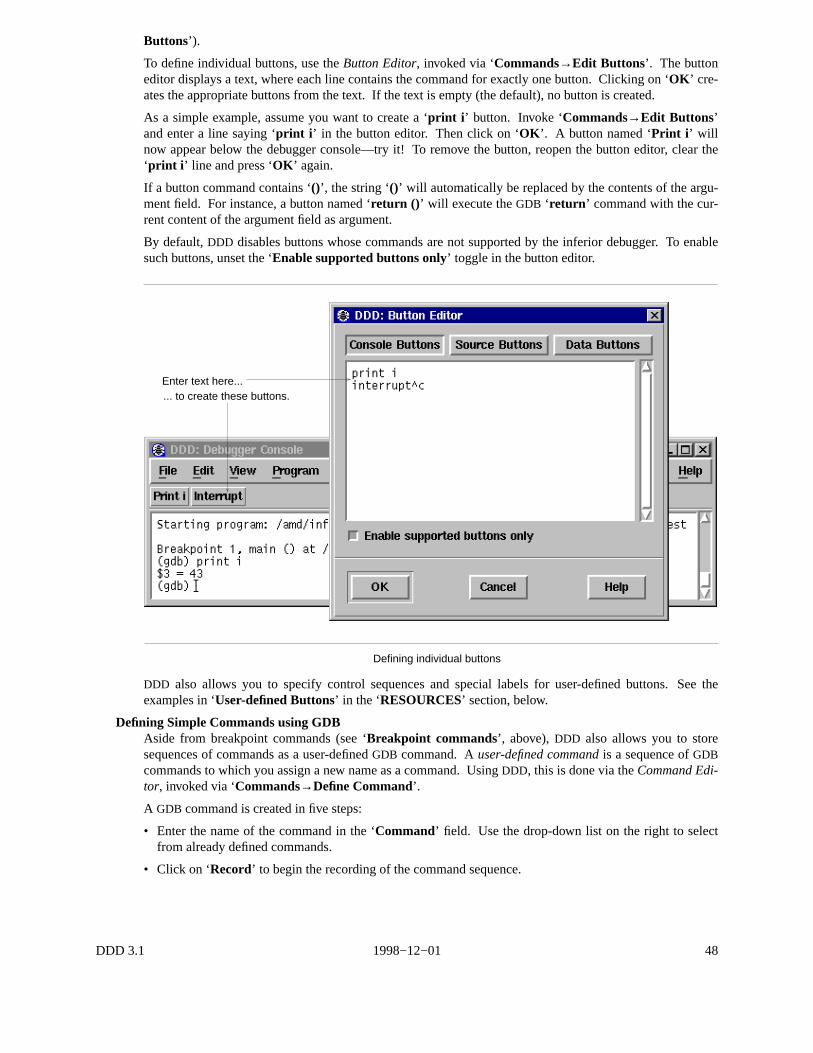
( ) ( )
Buttons’).
To define individual buttons, use theButton Editor, inv oked via ‘Commands→Edit Buttons’. The buttoneditor displays a text, where each line contains the command for exactly one button. Clicking on ‘OK ’ cre-ates the appropriate buttons from the text. If the text is empty (the default), no button is created.
As a simple example, assume you want to create a ‘print i ’ button. Invoke ‘Commands→Edit Buttons’and enter a line saying ‘print i ’ in the button editor. Then click on ‘OK ’. A button named ‘Print i ’ willnow appear below the debugger console—try it! To remove the button, reopen the button editor, clear the‘print i ’ line and press ‘OK ’ again.
If a button command contains ‘()’, the string ‘()’ will automatically be replaced by the contents of the argu-ment field. For instance, a button named ‘return () ’ will execute theGDB ‘ return ’ command with the cur-rent content of the argument field as argument.
By default,DDD disables buttons whose commands are not supported by the inferior debugger. To enablesuch buttons, unset the ‘Enable supported buttons only’ toggle in the button editor.
Defining individual buttons
... to create these buttons.Enter text here...
DDD also allows you to specify control sequences and special labels for user-defined buttons. See theexamples in ‘User-defined Buttons’ in the ‘RESOURCES’ section, below.
Defining Simple Commands using GDBAside from breakpoint commands (see ‘Breakpoint commands’, above),DDD also allows you to storesequences of commands as a user-definedGDB command. Auser-defined commandis a sequence ofGDBcommands to which you assign a new name as a command. UsingDDD, this is done via theCommand Edi-tor, inv oked via ‘Commands→Define Command’.
A GDB command is created in five steps:
• Enter the name of the command in the ‘Command’ field. Use the drop-down list on the right to selectfrom already defined commands.
• Click on ‘Record’ to begin the recording of the command sequence.
DDD 3.1 1998−12−01 48

( ) ( )
• Now interact withDDD. While recording,DDD does not execute commands, but simply records them tobe executed when the breakpoint is hit. The recorded debugger commands are shown in the debuggerconsole.
• To stop the recording, click on ‘End’ or enter ‘end’ at the GDB prompt. Tocancelthe recording, clickon ‘Interrupt ’ or pressESC.
• Click on ‘Edit >>’ to edit the recorded commands. When done with editing, click on ‘Edit <<’ to closethe commands editor.
After the command is defined, you can enter it at theGDB prompt. You may also click on ‘Apply ’ to applythe given user-defined command.
For convenience, you can assign a button to the defined command. Enabling one of the ‘Button’ locationswill add a button with the given command to the specified location. If you want to edit the button, select‘Commands→Edit Buttons’; see also ‘Defining Buttons’, above.
Command Name Command Definition
If enabled, use argument field symbolically
Defining GDB Commands
Start Recording Assign Button
When user-definedGDB commands are executed, the commands of the definition are not printed. An errorin any command stops execution of the user-defined command.
If used interactively, commands that would ask for confirmation proceed without asking when used inside auser-defined command. ManyGDB commands that normally print messages to say what they are doingomit the messages when used in a user-defined command.
To sav e all command definitions, use ‘Edit→Save Options’.
Defining Argument Commands using GDBIf you want to pass arguments to user-defined commands, you can enable the ‘()’ toggle button in the Com-mand Editor. Enabling ‘()’ has two effects:
• While recording commands, all references to the argument field are takensymbolicallyinstead of liter-ally. The argument field value is frozen to ‘$arg0’, which is howGDB denotes the argument of a user-defined command. WhenGDB executes the command, it will replace ‘$arg0’ by the current commandargument.
• When assigning a button to the command, the command will be suffixed by the current contents of theargument field.
DDD 3.1 1998−12−01 49

( ) ( )
While defining a command, you can toggle the ‘()’ button as you wish to switch between using the argu-ment field symbolically and literally.
As an example, let us define a command ‘contuntil ’ that will set a breakpoint in the given argument andcontinue execution.
• Enter ‘contuntil ’ in the ‘Definition’ field.
• Enable the ‘()’ toggle button.
• Now click on ‘Record’ to start recording. Note that the contents of the argument field change to‘$arg0’.
• Click on ‘Break at ()’ to create a breakpoint. Note that the recorded breakpoint command refers to‘$arg0’.
• Click on ‘Cont’ to continue execution.
• Click on ‘End’ to end recording. Note that the argument field is restored to its original value.
• Finally, click on one of the ‘Button’ locations. This creates a ‘Contuntil () ’ button where ‘()’ will bereplaced by the current contents of the argument field—and thus passed to the ‘contuntil ’ command.
• You can now either use the ‘Contuntil () ’ button or enter a ‘contuntil ’ command at theGDB prompt. (Ifyou plan to use the command frequently, you may wish to define a ‘cu’ command, which again calls‘contuntil ’ with its argument. This is a nice exercise.)
There is a little drawback with argument commands: a user-defined command inGDB has no means toaccess the argument list as a whole; only the first argument (up to whitespace) is processed. This maychange in futureGDB releases.
Defining Commands using Other DebuggersIf your inferior debugger allows you to define own command sequences, you can also use these user-defined commands withinDDD; just enter them at the debugger prompt.
However, you may encounter some problems:
• In contrast to the well-documented commands of the inferior debugger,DDD does not know what a user-defined command does. This may lead to inconsistencies betweenDDD and the inferior debugger. Forinstance, if your the user-defined command ‘bp’ sets a breakpoint,DDD may not display it immediately,becauseDDD does not know that ‘bp’ changes the breakpoint state.
• You cannot useDDD graph commands within user-defined commands. This is only natural, becauseuser-defined commands are interpreted by the inferior debugger, which does not know aboutDDD com-mands.
As a solution,DDD provides a simple facility calledauto-commands. If DDD receives any output from theinferior debugger in the form ‘prefix command’, it will interpret commandas if it had been entered at thedebugger prompt.prefix is a user-defined string, for example ‘ddd:
Suppose you want to define a command ‘gd’ that serves as abbreviation for ‘graph display’. All the com-mandgd has to do is to issue a string
ddd: graph display argument
whereargumentis the argument given to ‘gd’. Using GDB, this can be achieved using theechocommand.In your$HOME/.gdbinit file, insert the lines
define gdecho ddd: graph display $arg0\n
end
To complete the setting, you must also set the ‘autoCommandPrefix’ resource to the ‘ddd: ’ prefix yougave in your command. In ‘$HOME/.ddd/init ’, write:
DDD 3.1 1998−12−01 50

( ) ( )
Ddd*autoCommandPrefix: ddd:\
(Be sure to leave a space after the trailing backslash.)
Entering ‘gd foo’ will now hav e the same effect as entering ‘graph display foo’ at the debugger prompt.
Please note: In your commands, you should choose some other prefix than ‘ddd: ’. This is because auto-commands raise a security problem, since arbitrary commands can be executed. Just imagine some mali-cious program issuing a string like ‘prefix shell rm -fr $HOME ’ when being debugged! As a conse-quence, be sure to choose your ownprefix; it must be at least three characters long.
QUITTING DDDTo exit DDD, select ‘File→Exit ’. You may also type the ‘quit ’ command at the debugger prompt or pressCtrl+Q . GDB andXDB also accept the ‘q’ command or an end-of-file character (usuallyCtrl+D ). Closingthe lastDDD window will also exitDDD.
An interrupt (ESC or Interrupt ) does not exit fromDDD, but rather terminates the action of any debuggercommand that is in progress and returns to the debugger command level. It is safe to type the interruptcharacter at any time because the debugger does not allow it to take effect until a time when it is safe.
In case an ordinary interrupt does not succeed, you can also use an abort (Ctrl+\ or Abort ), which sends aQUIT signal to the inferior debugger. Use this in emergencies only; the inferior debugger may be leftinconsistent or even exit after aQUIT signal.
As a last resort—ifDDD hangs, for example—, you may also interruptDDD itself using an interrupt signal(SIGINT). This can be done by typing the interrupt character (usuallyCtrl+C ) in the shellDDD was startedfrom, or by using theUNIX ‘kill ’ command. An interrupt signal interrupts anyDDD action; the inferiordebugger is interrupted as well. Since this interrupt signal can result in internal inconsistencies, use this asa last resort in emergencies only; save your work as soon as possible and restartDDD.
PERSISTENT SESSIONSNote: Persistent sessions are supported withGDB running on the local machine only. Support for otherDBX, XDB, andJDB is partially implemented; your mileage may vary.
If you want to interrupt your currentDDD session, you can save its entireDDD state in a file and restore itlater.
Saving SessionsTo sav e a session, select ‘File→Save Session As’. You will be asked for
• a symbolic session namesessionand
• whether to include a core dump of the debugged program. Including a core dump is necessary for restor-ing memory contents and the current execution position.
After clicking on ‘Save’, the session is saved in ‘$HOME/.ddd/sessions/session’.
After saving the current state as a session, the session becomesactive. This means thatDDD state will besaved as session defaults:
• User options will be saved in ‘$HOME/.ddd/sessions/session/init ’ instead of ‘$HOME/.ddd/init ’; see‘Saving Options’, below, for details.
• The DDD command history will be saved in ‘$HOME/.ddd/sessions/session/history’ instead of‘$HOME/.ddd/history ’; see ‘Entering Commands’, above, for details.
To make the current session inactive, open thedefault sessionnamed ‘[None]’; see below for details onopening sessions.
If your program is running, or if you have opened a core file,DDD can include a core file in the sessionsuch that the debuggee data will be restored when re-opening it. To get a core file,DDD typically must killthe debuggee. This means that you cannot resume program execution after saving a session. Depending onyour architecture, other options for getting a core file may also be available.
DDD 3.1 1998−12−01 51

( ) ( )
Program DataSet to save
Saving a Session
Default session
Saved sessions
Click to save
If a core file isnot to be included in the session,DDD data displays are saved asdeferred; that is, they willbe restored as soon as program execution reaches the scope in which they were created.
Opening SessionsTo resume a previously saved session, select ‘File→Open Session’ and choose a session name from thelist. After clicking on ‘Open’, the entireDDD state will be restored from the given session.
The session named ‘[None]’ is the default sessionwhich is active when startingDDD. To sav e options fordefault sessions, open the default session and save options; see ‘Saving Options’ below for details.
Click to open
Saved sessions
Opening a Session
Default session
If a the restored session includes a core dump, the program being debugged will be in the same state at thetime the session was saved; in particular, you can examine the program data. However, you will not be ableto resume program execution since the environment (open files, resources, etc.) will be lost. However, youcan restart the program, re-using the restored breakpoints and data displays.
Opening sessions also restores command definitions, buttons, display shortcuts and the source tab width.This way, you can maintain a different set of definitions for each session.
DDD 3.1 1998−12−01 52

( ) ( )
Deleting SessionsTo delete sessions that are no longer needed, select ‘File→Open Session’ or ‘ File→Save Session’. Selectthe sessions you want to delete and click on ‘Delete’.
The default session cannot be deleted.
Starting DDD with a SessionTo start-upDDD with a given session namedsessioninstead of the default session, use
ddd −−sessionsession
There is also a shortcut that opens the sessionsessionand also invokes the inferior debugger on anexecutable namedsession(in casesessioncannot be opened):
ddd =session
There is no need to give further command-line options when restarting a session, as they will be overriddenby the options saved in the session.
INTEGRATING DDDYou can runDDD as an inferior debugger in other debugger front-ends, combining their special abilitieswith those ofDDD.
General InformationTo hav eDDD run as an inferior debugger in other front-ends, set up your debugger front-end such that ‘ddd−−tty ’ is inv oked instead of the inferior debugger. WhenDDD is invoked using the ‘−−tty ’ option, itenables itsTTYinterface, taking additional debugger commands from standard input and forwarding debug-ger output to standard output, just as if the inferior debugger had been invoked directly. All remainingDDDfunctionality stays unchanged.
In case your debugger front-end uses theGDB ‘−fullname’ option to haveGDB report source code posi-tions, the ‘−−tty ’ option is not required.DDD recognizes the ‘−fullname’ option, finds that it has beeninvoked from a debugger front-end and automatically enables theTTY interface.
You may also invoke ‘ddd −−tty’ directly, enteringDDD commands from yourTTY, or useDDD as the endof a pipe, controlled by a remote program. Be aware, however, that theTTY interface does not support lineediting and command completion and thatDDD exits as soon as it detects anEOF condition on its standardinput. Also, do not try to runDDD with DDD as inferior debugger.
UsingDDD in TTY mode automatically disables someDDD windows, because it is assumed that their facili-ties are provided by the remote program:
• If DDD is invoked with the ‘−−tty ’ option, the debugger console is initially disabled, as its facilities aresupposed to be provided by the integrating front-end.
• If DDD is invoked with the ‘−fullname’ option, the debugger console and the source window are initiallydisabled, as their facilities are supposed to be provided by the integrating front-end.
In case of need, you can use the ‘View’ menu to re-enable these windows.
Using DDD with GNU EmacsUse ‘M-x gdb’ or ‘ M-x dbx ’ to start a debugging session. At the prompt, enter ‘ddd −−tty’, followed by‘−−dbx’ or ‘ −−gdb’, if required, and the name of the program to be debugged. Proceed as usual.
Using DDD with XEmacsSet the variablegdb-command-nameto "ddd" , by inserting the following line in your$HOME/.emacsfile or evaluating it by pressingESC : (ESC ESCfor XEmacs 19.13 and earlier):
(setq gdb-command-name "ddd")
Use ‘M-x gdb’ or ‘ M-x gdbsrc’ to start a debugging session. Proceed as usual.
DDD 3.1 1998−12−01 53

( ) ( )
Using DDD with XXGDBInvokexxgdb as
xxgdb −db_name ddd −db_prompt ’(gdb) ’
USING DDD WITH LESSTIFDDD 2.1.1 and later include a number of hacks that makeDDD run withLessTif,a free Motif clone, withoutloss of functionality. Since aDDD binary may be dynamically bound and used with either an OSF/Motif orLessTif library, theselesstif hackscan be enabled and disabled at run time.
Whether thelesstif hacksare included at run-time depends on the setting of the ‘lessTifVersion’ resource.‘ lessTifVersion’ indicates the LessTif version against whichDDD is linked. For LessTif versionx.y, itsvalue isx multiplied by 1000 plusy—for instance, the value95 stands for LessTif 0.95 and the value1000stands for LessTif 1.0. To specify the version number of the LessTif library atDDD invocation, you canalso use the option ‘−−lesstif-versionversion’.
The default value of the ‘lessTifVersion’ resource is derived from the LessTif libraryDDD was compiledagainst (or1000when compiled against OSF/Motif). Hence, you normally don’t need to worry about thevalue of this resource. However, if you use a dynamically linkedDDD binary with a library other than theone DDD was compiled against, you must specify the version number of the library using this resource.(Unfortunately,DDD cannot detect this at run-time.)
Here are a few scenarios to illustrate this scheme:
• Your DDD binary was compiled against OSF/Motif, but you use a LessTif 0.85 dynamic library instead.InvokeDDD with ‘−−lesstif-version 85’.
• Your DDD binary was compiled against LessTif, but you use a OSF/Motif dynamic library instead.InvokeDDD with ‘−−lesstif-version 1000’.
• Your DDD binary was compiled against LessTif 0.85, and you have upgraded to LessTif 0.90. InvokeDDD with ‘−−lesstif-version 90’.
To find out the LessTif or OSF/Motif versionDDD was compiled against, invokeDDD with the ‘−−configu-ration ’ option.
In theDDD source, LessTif-specific hacks are controlled by the string ‘lesstif_version’.
REMOTE DEBUGGINGIt is possible to have the inferior debugger run on a remoteUNIX host. This is useful when the remote hosthas a slow network connection or whenDDD is available on the local host only.
Furthermore, the inferior debugger may support debugging a program on a remote host. This is usefulwhen the inferior debugger is not available on the remote host—for instance, because the remote systemdoes not have a general purpose operating system powerful enough to run a full-featured debugger.
Using DDD with a Remote DebuggerIn order to run the inferior debugger on a remote host, you need ‘remsh’ (called ‘rsh’ on BSD systems)access on the remote host.
To run the debugger on a remote hosthostname, inv okeDDD as
ddd −−hosthostname remote-program
If your remoteusernamediffers from the local username, use
ddd −−hosthostname−−login username remote-program
or
ddd −−hostusername@hostname remote-program
DDD 3.1 1998−12−01 54

( ) ( )
instead.
There are a fewcaveatsin remote mode:
• The remote debugger is started in your remote home directory. Hence, you must specify an absolute pathname forremote-program(or a path name relative to your remote home directory). Same applies toremote core files. Also, be sure to specify a remote process id when debugging a running program.
• The remote debugger is started non-interactively. SomeDBX versions have trouble with this. If youdon’t get a prompt from the remote debugger, use the ‘−−rhost’ option instead of ‘−−host’. This willinvoke the remote debugger via an interactive shell on the remote host, which may lead to better results.Note: using ‘−−rhost’, DDD invokes the inferior debugger as soon as a shell prompt appears. The firstoutput on the remote host ending in a space character or ‘>’ and not followed by a newline is assumed tobe a shell prompt. If necessary, adjust your shell prompt on the remote host.
• To run the remote program,DDD invokes an ‘xterm’ terminal emulator on the remote host, giving yourcurrent ‘DISPLAY ’ environment variable as address. If the remote host cannot invoke ‘xterm’, or doesnot have access to your X display, startDDD with the ‘−−no-exec-window’ option. The programinput/output will then go through theDDD debugger console.
• In remote mode, all sources are loaded from the remote host; file dialogs scan remote directories. Thismay result in somewhat slower operation than normal.
• To help you find problems due to remote execution, runDDD with the ‘−−trace’ option. This prints theshell commands issued byDDD on standard error.
• See also the ‘rshCommand’ resource, below.
Using DDD with a Remote ProgramThe GDB debugger allows you to run thedebugged pro gramon a remote machine (calledremote target),while GDB runs on the local machine.
The section ‘Remote debugging’ in the GDB documentation contains all the details. Basically, the follow-ing steps are required:
• Transfer the executable to the remote target.
• Start ‘gdbserver’ on the remote target.
• StartDDD usingGDB on the local machine, and load the same executable using the ’file’ command.
• Attach to the remote ‘gdbserver’ using the ’target remote’ command.
The local ‘.gdbinit ’ file is useful for setting up directory search paths, etc.
Of course, you can also combineDDD remote mode andGDB remote mode, runningDDD, GDB, and thedebugged program each on a different machine.
ROOT DEBUGGINGSometimes, you may require to debug programs with root privileges, but without actually logging in asroot. This is usually done by installing the debuggersetuid root, that is, having the debugger run with rootprivileges. For security reasons, you cannot installDDD as a setuid program;DDD invokes shell commandsand even shell scripts, such that all known problems of setuid shell scripts apply. Instead, you shouldinvokeDDD such that asetuidcopy of the inferior debugger is used.
Here is an example. Have asetuid rootcopy ofGDB installed as ‘rootgdb’. Then invoke
ddd −−debugger rootgdb
to debug programs with root privileges.
Since a program like ‘rootgdb’ grants root privileges to any inv oking user, you should give it very limitedaccess.
DDD 3.1 1998−12−01 55

( ) ( )
RESOURCESDDD understands all of the core X Toolkit resource names and classes. The following resources are spe-cific to DDD.
Setting DDD FontsDDD uses the following resources to set up its fonts:
defaultFont (class Font)The defaultDDD font to use for labels, menus, buttons, etc. The font is specified as an X fontspec, where the initial specification after ‘Family’. Default value is ‘helvetica-bold’.
To set the defaultDDD font to, say,helvetica medium, insert a line
Ddd*defaultFont: helvetica-medium
in your ‘$HOME/.ddd/init ’ file.
defaultFontSize (class FontSize)The size of the defaultDDD font, in 1⁄10 points. This resource overrides any font size specifica-tion in the ‘defaultFont’ resource (see above). The default value is120for a 12.0 point font.
variableWidthFont (class Font)The variable widthDDD font to use for help texts and messages. The font is specified as an X fontspec, where the initial specification after ‘Family’. Defaults to ‘helvetica-medium-r’.
To set the variable widthDDD font family to, say,times, insert a line
Ddd*fixedWidthFont: times-medium
in your ‘$HOME/.ddd/init ’ file.
variableWidthFontSize (class FontSize)The size of the variable widthDDD font, in 1⁄10 points. This resource overrides any font sizespecification in the ‘variableWidthFont ’ resource (see above). The default value is120 for a 12.0point font.
fixedWidthFont (class Font)The fixed widthDDD font to use for source code, the debugger console, text fields, data displays,and the execution window. The font is specified as an X font spec, where the initial specificationafter ‘Family’. Defaults to ‘lucidatypewriter-medium ’.
To set the fixed widthDDD font family to, say,courier, insert a line
Ddd*fixedWidthFont: courier-medium
in your ‘$HOME/.ddd/init ’ file.
fixedWidthFontSize (class FontSize)The size of the fixed widthDDD font, in 1⁄10 points. This resource overrides any font size specifi-cation in the ‘fixedWidthFont ’ resource (see above). The default value is120 for a 12.0 pointfont.
As all font size resources have the same class (and by default the same value), you can easily change thedefaultDDD font size to, say, 9.0 points by inserting a line
Ddd*FontSize: 90
in your ‘$HOME/.ddd/init ’ file.
To find out your favorite font size, try ‘−−fontsizeSIZE’. This also sets all font sizes toSIZE.
DDD 3.1 1998−12−01 56

( ) ( )
If you want to set the fonts of specific items, see the ‘Ddd’ application defaults file for instructions.
Setting DDD ColorsThese are the most important color resources used inDDD:
Ddd*foreground: black
Ddd*background: grey
Ddd*XmText.background: grey96
Ddd*XmTextField.background: grey96
Ddd*GraphEdit.background: grey96
Ddd*XmList.background: grey96
Ddd*graph_edit.nodeColor: black
Ddd*graph_edit.edgeColor: blue4
Ddd*graph_edit.selectColor: black
Ddd*graph_edit.gridColor: black
Ddd*graph_edit.frameColor: grey50
Ddd*graph_edit.outlineColor: grey50
You can copy and modify the appropriate resources to your ‘$HOME/.ddd/init ’ file. For colors within thedata display, things are slightly more complicated—see the ‘vslDefs’ resource, below.
General PreferencesThe following resources determineDDD general behavior.
buttonTips (classTips)Whether button tips are enabled (‘on’, default) or not (‘off’). Button tips are helpful for novices,but may be distracting for experienced users.
buttonDocs (classDocs)Whether the display of button hints in the status line is enabled (‘on’, default) or not (‘off’).
checkGrabs (classCheckGrabs)When debugging a modal X application,DDD may interrupt it while it has grabbed the pointer,making further interaction impossible. If this is ‘on’ (default), DDD will check after each interac-tion whether the pointer is grabbed. If this is so,DDD will automatically continue execution ofdebugged program.
checkGrabDelay (classCheckGrabDelay)The time to wait (in ms) after a debugger command before checking for a grabbed pointer. IfDDDsees some pointer event within this delay, the pointer cannot be grabbed and an explicit check for agrabbed pointer is unnecessary. Default is5000, or 5 seconds.
checkOptions (classCheckOptions)Every N seconds, whereN is the value of this resource,DDD checks whether the options file haschanged. Default is30, which means that every 30 seconds,DDD checks for the options file. Set-ting this resource to0 disables checking for changed option files.
cutCopyPasteBindings (classBindingStyle)Controls the key bindings for cut, copy, and paste operations.
• If this is ‘Motif ’ (default), Cut/Copy/Paste is onShift+Del/Ctrl+Ins /Shift+Ins. This is confor-mant to the Motif style guide.
• If this is ‘KDE ’, Cut/Copy/Paste is onCtrl+X /Ctrl+C /Ctrl+V . This is conformant to theKDEstyle guide. Note that this means thatCtrl+C no longer interrupts the debuggee; useESCinstead.
DDD 3.1 1998−12−01 57

( ) ( )
filterFiles (classFilterFiles)If this is ‘on’ (default),DDD filters files when opening execution files, core dumps, or source files,such that the selection shows only suitable files. This requires thatDDD opens each file, whichmay take time. If this is ‘off’, DDD always presents all available files.
globalTabCompletion (classGlobalTabCompletion)If this is ‘on’ (default), theTAB key completes arguments in all windows. If this is ‘off’, the TABkey completes arguments in the debugger console only.
grabAction (classgrabAction)The action to take after having detected a grabbed mouse pointer. This is a list of newline-separated commands. Default is ‘cont’, meaning to continue the debuggee. Other possiblechoices include ‘kill ’ (killing the debuggee) or ‘quit ’ (exiting DDD).
grabActionDelay (classgrabActionDelay)The time to wait (in ms) before taking an action due to having detected a grabbed pointer. Duringthis delay, a working dialog pops up telling the user about imminent execution of the grab action(see the ‘grabAction’ resource, above). If the pointer grab is released within this delay, the work-ing dialog pops down and no action is taken. This is done to exclude pointer grabs from sourcesother than the debugged program (includingDDD). Default is10000, or 10 seconds.
groupIconify (classGroupIconify)If this is ‘on’, (un)iconifying anyDDD window causes all otherDDD windows to (un)iconify aswell. Default is ‘off’, meaning that eachDDD window can be iconified on its own.
saveHistoryOnExit (classSaveHistoryOnExit)If ‘ on’ (default), the command history is automatically saved whenDDD exits.
selectAllBindings (classBindingStyle)Controls the key bindings for the select all operation.
• If this is ‘Motif ’, Select All onShift+Ctrl+A .
• If this is ‘KDE ’ (default), Select All is onCtrl+A . This is conformant to theKDE style guide.Note that this means thatCtrl+A no longer moves the cursor to the beginning of a line; use theHOME key instead.
splashScreen (classSplashScreen)If ‘ on’ (default), show aDDD splash screen upon start-up.
splashScreenColorKey (classColorKey)The color key to use for theDDD splash screen. Possible values include:
• ‘c’ (default) for a color visual,
• ‘g’ for a multi-level greyscale visual,
• ‘g4’ for a 4-level greyscale visual, and
• ‘m’ for a dithered monochrome visual.
• ‘best’ chooses the best visual available for your display.
Note: if DDD runs on a monochrome display, or ifDDD was compiled without theXPM library,only the monochrome version (‘m’) can be shown.
startupTips (classStartupTips)Whether a tip of the day is to be shown at startup (‘on’, default) or not (‘off’).
startupTipCount (classStartupTipCount)The numbern of the tip of the day to be shown at startup. See also the ‘tipn’ resources.
suppressWarnings (classSuppressWarnings)If ‘ on’, X warnings are suppressed. This is sometimes useful for executables that were built on amachine with a different X or Motif configuration. By default, this is ‘off’.
DDD 3.1 1998−12−01 58

( ) ( )
tipn (classTip)The tip of the day numberedn (a string).
maxUndoDepth (classMaxUndoDepth)The maximum number of entries in the undo buffer. This limits the number of actions that can beundone, and the number of states that can be shown in historic mode. Useful for limitingDDDmemory usage. A neg ative value (default) means to place no limit.
maxUndoSize (classMaxUndoSize)The maximum memory usage (in bytes) of the undo buffer. Useful for limitingDDD memoryusage. A negative value means to place no limit. Default is2000000.
uniconifyWhenReady (classUniconifyWhenReady)If this is ‘on’ (default), theDDD windows are uniconified automatically wheneverGDB becomesready. This way, you can iconifyDDD during some longer operation and have it uniconify itself assoon as the program stops. Setting this to ‘off’ leaves theDDD windows iconified.
valueTips (classTips)Whether value tips are enabled (‘on’, default) or not (‘off’). Value tips affectDDD performanceand may be distracting for some experienced users.
valueDocs (classDocs)Whether the display of variable values in the status line is enabled (‘on’, default) or not (‘off’).
warnIfLocked (classWarnIfLocked)Whether to warn if multipleDDD instances are running (‘on’) or not (‘off’, default).
Source WindowThe following resources determine theDDD source window.
cacheGlyphImages (classCacheMachineCode)Whether to cache (share) glyph images (‘on’) or not (‘off’). Caching glyph images requires less Xresources, but has been reported to fail with Motif 2.1 on XFree86 servers. Default is ‘off’ forMotif 2.1 or later on Linux machines, and ‘on’ otherwise.
cacheMachineCode (classCacheMachineCode)Whether to cache disassembled machine code (‘on’, default) or not (‘off’). Caching machine coderequires more memory, but makesDDD run faster.
cacheSourceFiles (classCacheSourceFiles)Whether to cache source files (‘on’, default) or not (‘off’). Caching source files requires morememory, but makesDDD run faster.
disassemble (classDisassemble)If this is ‘on’, the source code is automatically disassembled. The default is ‘off’. See also the‘−−disassemble’ and ‘−−no-disassemble’ options, below.
displayGlyphs (classDisplayGlyphs)If this is ‘on’, the current execution position and breakpoints are displayed as glyphs; otherwise,they are shown through characters in the text. The default is ‘on’. See also the ‘−−glyphs’ and‘−−no-glyphs’ options, below.
displayLineNumbers (classDisplayLineNumbers)If this is ‘on’, lines in the source text are prefixed with their respective line number. The default is‘off’.
findCaseSensitive (classFindCaseSensitive)If this is ‘on’ (default), the ‘Find’ commands are case-sensitive. Otherwise, occurrences are foundregardless of case.
findWordsOnly (classFindWordsOnly)If this is ‘on’ (default), the ‘Find’ commands find complete words only. Otherwise, arbitraryoccurrences are found.
DDD 3.1 1998−12−01 59

( ) ( )
glyphUpdateDelay (classGlyphUpdateDelay)A delay (in ms) that says how much time to wait before updating glyphs while scrolling the sourcetext. A small value results in glyphs being scrolled with the text, a large value disables glyphswhile scrolling and makes scrolling faster. Default:10.
indentCode (classIndent)The number of columns to indent the machine code, such that there is enough place to displaybreakpoint locations. Default:4.
indentSource (classIndent)The number of columns to indent the source code, such that there is enough place to displaybreakpoint locations. Default:0.
indentScript (classIndent)The minimum indentation for script languages, such as Perl and Python. Default:4.
lineNumberWidth (classLineNumberWidth)The number of columns to use for line numbers (if displaying line numbers is enabled). Linenumbers wider than this value extend into the breakpoint space. Default:4.
linesAboveCursor (classLinesAboveCursor)The minimum number of lines to show before the current location. Default is2.
linesBelowCursor (classLinesBelowCursor)The minimum number of lines to show after the current location. Default is3.
maxDisassemble (classMaxDisassemble)Maximum number of bytes to disassemble (default:256). If this is zero, the entire current func-tion is disassembled.
maxGlyphs (classMaxGlyphs)The maximum number of glyphs to be displayed (default:10). Raising this value causes moreglyphs to be allocated, possibly wasting resources that are never needed.
sourceEditing (classSourceEditing)If this is ‘on’, the displayed source code becomes editable. This is an experimental feature andmay become obsolete in futureDDD releases. Default if ‘off’.
tabWidth (classTabWidth)The tab width used in the source window (default:8)
useSourcePath (classUseSourcePath)If this is ‘off’ (default), the inferior debugger refers to source code locations only by their basenames. If this is ‘on’ (default),DDD uses the full source code paths.
Window Creation and LayoutThe following resources determineDDD window creation and layout as well as the interaction with the Xwindow manager.
autoRaiseTool (classAutoRaiseTool)If ‘ on’ (default), DDD will always keep the command tool on top of otherDDD windows. If thissetting interferes with your window manager, or if your window manager keeps the command toolon top anyway, set this resource to ‘off’.
autoRaiseMenu (classAutoRaiseMenu)If ‘ on’ (default), DDD will always keep the pull down menu on top of theDDD main window. Ifthis setting interferes with your window manager, or if your window manager does not auto-raisewindows, set this resource to ‘off’:
Ddd*autoRaiseMenu: off
DDD 3.1 1998−12−01 60
( ) ( )
colorWMIcons (classColorWMIcons)If ‘ on’ (default), DDD uses multi-color icons. If your window manager has trouble with multi-color icons, set this resource to ‘off’ and DDD will use black-and-white icons instead.
decorateTool (classDecorate)This resource controls the decoration of the command tool.
• If this is ‘off’, the command tool is created as atransient window. Sev eral window managerskeep transient windows automatically on top of their parents, which is appropriate for the com-mand tool. However, your window manager may be configured not to decorate transient win-dows, which means that you cannot easily move the command tool around.
• If this is ‘on’, DDD realizes the command tool as atop-level window. Such windows are alwaysdecorated by the window manager. Howev er, top-level windows are not automatically kept ontop of other windows, such that you may wish to set the ‘autoRaiseTool’ resource, too.
• If this is ‘auto’ (default), DDD checks whether the window manager decorates transients. Ifyes, the command tool is realized as a transient window (as in the ‘off’ setting); if no, the com-mand tool is realized as a top-level window (as in the ‘on’ setting). Hence, the command tool isalways decorated using the “best” method, but the extra check takes some time.
openDataWindow (classWindow)If ‘ off’ (default), the data window is closed upon start-up.
openDebuggerConsole (classWindow)If ‘ off’, the debugger console is closed upon start-up.
openSourceWindow (classWindow)If ‘ off’, the source window is closed upon start-up.
separateDataWindow (classSeparate)If ‘ on’, the data window and the debugger console are realized in different top-level windows. If‘off’ (default), the data window is attached to the debugger console. See also the ‘−−attach-windows’ and ‘−−attach-data-window’ options, below.
separateExecWindow (classSeparate)If ‘ on’, the debugged program is executed in a separate execution window. If ‘off’ (default), thedebugged program is executed in the console window. See also the ‘−−exec−window’ and‘−−no−exec−window’ options, below.
separateSourceWindow (classSeparate)If ‘ on’, the source window and the debugger console are realized in different top-level windows.If ‘ off’ (default), the source window is attached to the debugger console. See also the ‘−−attach-windows’ and ‘−−attach-source-window’ options, below.
statusAtBottom (classStatusAtBottom)If ‘ on’ (default), the status line is placed at the bottom of theDDD source window. If ‘off’, the sta-tus line is placed at the top of theDDD source window (as inDDD 1.x). See also the ‘−−status-at-bottom’ and ‘−−status-at-top’ options, below.
stickyTool (classStickyTool)If ‘ on’ (default), the command tool automatically follows every movement of the source window.Whenever the source window is moved, the command tool is moved by the same offset such thatits position relative to the source window remains unchanged. If ‘off’, the command tool does notfollow source window movements.
transientDialogs (classTransientDialogs)If ‘ on’ (default), all dialogs are created as transient windows—that is, they always stay on top ofthe mainDDD windows, and they iconify with it. If ‘off’, the important selection dialogs, such asthe breakpoint and display editors, are created as top-level windows on their own, and may beobscured by theDDD main windows.
DDD 3.1 1998−12−01 61

( ) ( )
Debugger SettingsThe following resources determine the inferior debugger.
autoCommands (classAutoCommands)If this is ‘on’ (default), each line output by the inferior debugger beginning with the value of the‘autoCommandPrefix’ resource (see below) will be interpreted asDDD command and executed.Useful for user-defined commands; see ‘USER-DEFINED COMMANDS ’, above.
autoCommandPrefix (classAutoCommandPrefix)The prefix for auto-commands. By default, an empty string, meaning to generate a new prefix foreachDDD session. If this is set to ‘ddd: ’, for example, eachGDB output in the form ‘ddd: com-mand’ will causeDDD to executecommand.
autoDebugger (classAutoDebugger)If this is ‘on’ (default), DDD will attempt to determine the debugger type from its arguments, pos-sibly overriding the ‘debugger’ resource (see below). If this is ‘off’, DDD will invoke the debug-ger specified by the ‘debugger’ resource regardless ofDDD arguments.
blockTTYInput ( classBlockTTYInput)WhetherDDD should block when reading data from the inferior debugger via the pseudo-tty inter-face. Some systemsrequire this, such as Linux with libc 5.4.33 and earlier; set it to ‘on’. Someother systemsprohibit this, such as Linux with GNU libc 6 and later; set it to ‘off’. The value‘auto’ (default) will always select the “best” choice (that is, the best choice known to theDDDdevelopers).
dbxInitCommands (classInitCommands)This string contains a list of newline-separated commands that are initially sent toDBX. Bydefault, it is empty.Do not use this resource to customizeDBX; instead, use a personal ‘$HOME/.dbxinit ’ or‘$HOME/.dbxrc ’ file. See yourDBX documentation for details.
dbxSettings (classSettings)This string contains a list of newline-separated commands that are also initially sent toDBX. Bydefault, it is empty.
debugger (classDebugger)The type of the inferior debugger to invoke (‘gdb’, ‘ dbx’, ‘ xdb’, ‘ jdb ’, ‘ pydb’, or ‘perl’). Thisresource is usually set through the ‘−−gdb’, ‘ −−dbx’, ‘ −−xdb’, ‘ −−jdb ’, ‘ −−pydb’, and ‘−−perl’,options; see below for details.
debuggerCommand (classDebuggerCommand)The name under which the inferior debugger is to be invoked. If this string is empty, the debuggertype (‘debugger’ resource) is used. This resource is usually set through the ‘−−debugger’ option;see below for details.
debuggerHost (classDebuggerHost)The host where the inferior debugger is to be executed; an empty string (default) means the localhost. See the ‘−−host’ option, below, and ‘REMOTE DEBUGGING ’, above.
debuggerHostLogin (classDebuggerHostLogin)The login user name on the remote host; an empty string (default) means using the local username. See the ‘−−login’ option, below, and ‘REMOTE DEBUGGING ’, above.
debuggerRHost (classDebuggerRHost)The host where the inferior debugger is to be executed; an empty string (default) means to use the‘debuggerHost’ resource. In contrast to ‘debuggerHost’, using this resource causesDDD to logininteractively to the remote host and invoke the inferior debugger from the remote shell. See alsothe ‘−−rhost’ option, below, and ‘REMOTE DEBUGGING ’, above.
fullNameMode (classTTYMode)If this is ‘on’, DDD reports the current source position on standard output inGDB ‘−fullname’ for-mat. As a side effect, the source window is disabled by default. See also the ‘−−fullname’
DDD 3.1 1998−12−01 62

( ) ( )
option, below.
gdbInitCommands (classInitCommands)This string contains a list of newline-separated commands that are initially sent toGDB. As a side-effect, all settings specified in this resource are considered fixed and cannot be changed throughthe GDB settings panel, unless preceded by white space. By default, the ‘gdbInitCommands’resource contains some settings vital toDDD:
Ddd*gdbInitCommands: \set height 0\n\set width 0\n\set verbose off\n\set prompt (gdb) \n
While the ‘set height’, ‘ set width’, and ‘set prompt’ settings are fixed, the ‘set verbose’ settingscan be changed through theGDB settings panel (although being reset upon each newDDD invoca-tion).Do not use this resource to customizeGDB; instead, use a personal ‘$HOME/.gdbinit ’ file. Seeyour GDB documentation for details.
gdbSettings (classSettings)This string contains a list of newline-separated commands that are also initially sent toGDB. Itsdefault value is
Ddd*gdbSettings: \set print asm-demangle on\n
This resource is used to save and restore the debugger settings.
jdbInitCommands (classInitCommands)This string contains a list of newline-separated commands that are initially sent toJDB. Thisresource may be used to customizeJDB. By default, it is empty.
jdbSettings (classSettings)This string contains a list of newline-separated commands that are also initially sent toJDB. Bydefault, it is empty.
This resource is used byDDD to save and restoreJDB settings.
openSelection (classOpenSelection)If this is ‘on’, DDD invoked without argument checks whether the current selection or clipboardcontains the file name orURL of an executable program. If this is so,DDD will automaticallyopen this program for debugging. If this resource is ‘off’ (default), DDD invoked without argu-ments will always start without a debugged program.
perlInitCommands (classInitCommands)This string contains a list of newline-separated commands that are initially sent to the Perl debug-ger. By default, it is empty.
This resource may be used to customize the Perl debugger.
pydbSettings (classSettings)This string contains a list of newline-separated commands that are also initially sent to the Perldebugger. By default, it is empty.
This resource is used byDDD to save and restore Perl debugger settings.
DDD 3.1 1998−12−01 63

( ) ( )
pydbInitCommands (classInitCommands)This string contains a list of newline-separated commands that are initially sent toPYDB. Bydefault, it is empty.This resource may be used to customizePYDB.
pydbSettings (classSettings)This string contains a list of newline-separated commands that are also initially sent toPYDB. Bydefault, it is empty.
This resource is used byDDD to save and restorePYDB settings.
questionTimeout (classQuestionTimeout)The time (in seconds) to wait for the inferior debugger to reply. Default is10.
rHostInitCommands (classRHostInitCommands)These commands are initially executed in a remote interactive session, using the ‘−−rhost’ option.By default, it sets up the remote terminal such that it suitsDDD:
Ddd*rHostInitCommands: stty −echo −onlcr
You may add other commands here—for instance, to set the executable path or to invoke a suitableshell.
sourceInitCommands (classSourceInitCommands)If ‘ on’ (default), DDD writes all GDB initialization commands into a temporary file and makesGDB read this file, rather than sending each initialization command separately. This results infaster startup (especially if you have sev eral user-defined commands). If ‘off’, DDD makesGDBprocess each command separately.
synchronousDebugger (classSynchronousDebugger)If ‘ on’, X events are not processed while the debugger is busy. This may result in slightly betterperformance on single-processor systems. See also the ‘−−sync-debugger’ option, below.
terminateOnEOF (classTerminateOnEOF)If ‘ on’, DDD terminates the inferior debugger whenDDD detects an EOF condition (that is, assoon as the inferior debugger closes its output channel). This was the default behavior inDDD 2.xand earlier. If ‘off’ (default),DDD takes no special action.
ttyMode (classTTYMode)If ‘ on’, enableTTY interface, taking additional debugger commands from standard input and for-warding debugger output on standard output. As a side effect, the debugger console is disabled bydefault. See also the ‘−−tty ’ and ‘−−fullname’ options, below.
useTTYCommand (classUseTTYCommand)If ‘ on’, use theGDB ‘ tty ’ command for redirecting input/output to the separate execution window.If ‘ off’, use explicit redirection through shell redirection operators ‘<’ and ‘>’. The default is ‘off’(explicit redirection), since on some systems, the ‘tty ’ command does not work properly on someGDB versions.
xdbInitCommands (classInitCommands)This string contains a list of newline-separated commands that are initially sent toXDB. Bydefault, it is empty.Do not use this resource to customizeDBX; instead, use a personal ‘$HOME/.xdbrc ’ file. Seeyour XDB documentation for details.
xdbSettings (classSettings)This string contains a list of newline-separated commands that are also initially sent toXDB. Bydefault, it is empty.
DDD 3.1 1998−12−01 64

( ) ( )
User-defined ButtonsThe following resources can be used to create and control tool bars and user-defined buttons.
activeButtonColorKey (classColorKey)TheXPM color key to use for the images of active buttons (entered or armed). ‘c’ means color, ‘g’(default) means grey, and ‘m’ means monochrome.
buttonCaptions (classButtonCaptions)Whether the tool bar buttons should be shown using captions (‘on’, default) or not (‘off’). If nei-ther captions nor images are enabled, tool bar buttons are shown using ordinary labels. See also‘buttonImages’, below.
buttonCaptionGeometry (classButtonCaptionGeometry)The geometry of the caption subimage within the button icons. Default is ‘29×7+0−0’.
buttonImages (classButtonImages)Whether the tool bar buttons should be shown using images (‘on’, default) or not (‘off’). If neithercaptions nor images are enabled, tool bar buttons are shown using ordinary labels. See also ‘but-tonCaptions’, above.
buttonImageGeometry (classButtonImageGeometry)The geometry of the image within the button icon. Default is ‘25×21+2+0’.
buttonColorKey (classColorKey)The XPM color key to use for the images of inactive buttons (non-entered or insensitive). ‘c’means color, ‘g’ (default) means grey, and ‘m’ means monochrome.
commandToolBar (classToolBar)Whether the tool buttons (see the ‘toolButtons’ resource, below) should be shown in a tool barabove the source window (‘on’) or within the command tool (‘off’, default). Enabling the com-mand tool bar disables the command tool and vice versa.
commonToolBar (classToolBar)Whether the tool bar buttons should be shown in one common tool bar at the top of the commonDDD window (‘on’, default), or whether they should be placed in two separate tool bars, one fordata, and one for source operations, as inDDD 2.x (‘off’).
consoleButtons (classButtons)A newline-separated list of buttons to be added under the debugger console. Each button issuesthe command given by its name.
The following characters have special meanings:
• Commands ending with ’...’ insert their name, followed by a space, in the debugger console.
• Commands ending with a control character (that is, ‘ˆ’ followed by a letter or ‘?’) insert thegiven control character.
• The string ‘()’ is replaced by the current contents of the argument field ‘()’.
• The string specified in the ‘labelDelimiter’ resource (usually ‘//’) separates the command namefrom the button label. If no button label is specified, the capitalized command will be used asbutton label.
The following button names are reserved:
Apply Send the given command to the debugger.
Back Lookup previously selected source position.
Clear Clear current command
Complete Complete current command.
DDD 3.1 1998−12−01 65

( ) ( )
Edit Edit current source file.
Forward Lookup next selected source position.
Make Invoke the ‘make’ program, using the most recently given arguments.
Next Show next command
No Answer current debugger prompt with ‘no’. This button is visible only if the debug-ger asks a yes/no question.
Prev Show previous command
Reload Reload source file.
Yes Answer current debugger prompt with ‘yes’. This button is visible only if the debug-ger asks a yes/no question.
The default resource value is empty—no console buttons are created.
Here are some examples to insert into your ‘$HOME/.ddd/init ’ file. These are the settings ofDDD 1.x:
Ddd*consoleButtons: Yes\nNo\nbreakˆC
This setting creates some more buttons:
Ddd*consoleButtons: \Yes\nNo\nrun\nClear\nPrev\nNext\nApply\nbreakˆC
See also the ‘dataButtons’, ‘ sourceButtons’ and ‘toolButtons’ resources, below.
dataButtons (classButtons)A newline-separated list of buttons to be added under the data display. Each button issues thecommand given by its name. See the ‘consoleButtons’ resource, above, for details on button syn-tax.
The default resource value is empty—no source buttons are created.
flatToolbarButtons (classFlatButtons)If ‘ on’ (default), all tool bar buttons with images or captions are given a ‘flat’ appearance—the3-D border only shows up when the pointer is over the icon. If ‘off’, the 3-D border is shown allthe time.
flatDialogButtons (classFlatButtons)If ‘ on’ (default), all dialog buttons with images or captions are given a ‘flat’ appearance—the 3-Dborder only shows up when the pointer is over the icon. If ‘off’, the 3-D border is shown all thetime.
labelDelimiter (classLabelDelimiter)The string used to separate labels from commands and shortcuts. Default is ‘//’.
sourceButtons (classButtons)A newline-separated list of buttons to be added under the debugger console. Each button issuesthe command given by its name. See the ‘consoleButtons’ resource, above, for details on buttonsyntax.
The default resource value is empty—no source buttons are created.
Here are some example to insert into your ‘$HOME/.ddd/init ’ file. These are the settings ofDDD1.x:
Ddd*sourceButtons: \
DDD 3.1 1998−12−01 66

( ) ( )
run\nstep\nnext\nstepi\nnexti\ncont\n\finish\nkill\nup\ndown\n\Back\nForward\nEdit\ninterruptˆC
This setting creates some buttons which are not found on the command tool:
Ddd*sourceButtons: \print *()\ngraph display *()\nprint /x ()\n\whatis ()\nptype ()\nwatch ()\nuntil\nshell
An even more professional setting uses customized button labels.
Ddd*sourceButtons: \print *(()) // Print *()\n\graph display *(()) // Display *()\n\print /x ()\n\whatis () // What is ()\n\ptype ()\n\watch ()\n\until\n\shell
See also the ‘consoleButtons’ and ‘dataButtons’ resources, above, and the ‘toolButtons’resource, below.
toolbarsAtBottom (classToolbarsAtBottom)Whether source and data tool bars should be placed above source and data, respectively (‘off’,default), or below, as inDDD 2.x (‘on’). See also the ‘−−toolbars-at-bottom’ and ‘−−toolbars-at-top’ options, below.
toolButtons (classButtons)A newline-separated list of buttons to be included in the command tool or the command tool bar(see the ‘commandToolBar’ resource, above). Each button issues the command given by itsname. See the ‘consoleButtons’ resource, above, for details on button syntax.
The default resource value is
Ddd*toolButtons: \run\nbreakˆC\nstep\nstepi\nnext\nnexti\n\until\nfinish\ncont\n\kill\n\up\ndown\nBack\nForward\nEdit\nMake
For each button, its location in the command tool must be specified usingXmForm constraintresources. See the ‘Ddd’ application defaults file for instructions.
If the ‘toolButtons’ resource value is empty, the command tool is not created.
toolRightOffset (classOffset)The distance between the right border of the command tool and the right border of the source text(in pixels). Default is 8 pixels.
toolTopOffset (classOffset)The distance between the upper border of the command tool and the upper border of the sourcetext (in pixels). Default is 8 pixels.
verifyButtons (classVerifyButtons)If ‘ on’ (default), verify for each button whether its command is actually supported by the inferiordebugger. If the command is unknown, the button is disabled. If this resource is ‘off’, no check-ing is done: all commands are accepted “as is”.
DDD 3.1 1998−12−01 67

( ) ( )
User-Defined New Display MenuThe following resources control the user-defined ‘New Display’ menu.
dbxDisplayShortcuts (classDisplayShortcuts)A newline-separated list of display expressions to be included in the ‘New Display’ menu forDBX. If a line contains a label delimiter (the string ‘//’; can be changed via the ‘labelDelimiter’resource), the string before the delimiter is used asexpression, and the string after the delimiter isused as label. Otherwise, the label is ‘Display expression’. Upon activation, the string ‘()’ inexpressionis replaced by the name of the currently selected display.
gdbDisplayShortcuts (classDisplayShortcuts)A newline-separated list of display expressions to be included in the ‘New Display’ menu forGDB. See the description of ‘dbxDisplayShortcuts’, above.
jdbDisplayShortcuts (classDisplayShortcuts)A newline-separated list of display expressions to be included in the ‘New Display’ menu forJDB.See the description of ‘dbxDisplayShortcuts’, above.
labelDelimiter (classLabelDelimiter)The string used to separate labels from commands and shortcuts. Default is ‘//’.
perlDisplayShortcuts (classDisplayShortcuts)A newline-separated list of display expressions to be included in the ‘New Display’ menu for Perl.See the description of ‘dbxDisplayShortcuts’, above.
pydbDisplayShortcuts (classDisplayShortcuts)A newline-separated list of display expressions to be included in the ‘New Display’ menu forPYDB. See the description of ‘dbxDisplayShortcuts’, above.
xdbDisplayShortcuts (classDisplayShortcuts)A newline-separated list of display expressions to be included in the ‘New Display’ menu forXDB. See the description of ‘dbxDisplayShortcuts’, above.
Data DisplayThe following resources control the data display.
align2dArrays (classAlign2dArrays)If ‘ on’ (default), DDD lays out two-dimensional arrays as tables, such that all array elements arealigned with each other. If ‘off’, DDD treats a two-dimensional array as an array of one-dimensional arrays, each aligned on its own.
autoCloseDataWindow (classAutoClose)If this is ‘on’ (default) andDDD is in stacked window mode, deleting the last display automaticallycloses the data window. If this is ‘off’, the data window stays open even after deleting the last dis-play.
bumpDisplays (classBumpDisplays)If some displayD changes size and this resource is ‘on’ (default), DDD assigns new positions todisplays below and on the right ofD such that the distance between displays remains constant. Ifthis is ‘off’, other displays are not rearranged.
clusterDisplays (classClusterDisplays)If ‘ on’, new independent data displays will automatically be clustered. Default is ‘off’, meaningto leave new displays unclustered.
deleteAliasDisplays (classDeleteAliasDisplays)If this is ‘on’ (default), the ‘Undisplay ()’ button also deletes all aliases of the selected displays.If this is ‘off’, only the selected displays are deleted; the aliases remain, and one of the aliases willbe unsuppressed.
detectAliases (classDetectAliases)If ‘ on’, DDD attempts to recognize shared data structures. See ‘Examining shared data struc-tures’, above, for a discussion. The default is ‘off’, meaning that shared data structures are not
DDD 3.1 1998−12−01 68

( ) ( )
recognized.
expandRepeatedValues (classExpandRepeatedValues)GDB can print repeated array elements as ‘VALUE <repeatedN times>’. If ‘ expandRepeated-Values’ is ‘ on’, DDD will display N instances ofVALUE instead. If ‘expandRepeatedValues’ is‘off’ (default),DDD will display VALUEwith ‘<N×>’ appended to indicate the repetition.
hideInactiveDisplays (class HideInactiveDisplays)If some display gets out of scope and this resource is ‘on’ (default),DDD removes it from the datadisplay. If this is ‘off’, it is simply disabled.
pannedGraphEditor (classPannedGraphEditor)The control to scroll the graph.
• If this is ‘on’, an Athena panner is used (a kind of two-directional scrollbar).
• If this is ‘off’ (default), two Motif scrollbars are used.
See also the ‘−−scrolled-graph-editor’ and ‘−−panned-graph-editor’ options, below.
paperSize (classPaperSize)The paper size used for printing, in formatwidth x height. The default is A4 format, or ‘210mm×297mm’.
showBaseDisplayTitles (classShowDisplayTitles)Whether to assign titles to base (independent) displays or not. Default is ‘on’.
showDependentDisplayTitles (classShowDisplayTitles)Whether to assign titles to dependent displays or not. Default is ‘off’.
typedAliases (classTypedAliases)If ‘ on’ (default), DDD requires structural equivalence in order to recognize shared data structures.If this is ‘off’, two displays at the same address are considered aliases, regardless of their structure.
vslBaseDefs (classVSLDefs)A string with additionalVSL definitions that are appended to the builtinVSL library. This resourceis prepended to the ‘vslDefs’ resource below and set in theDDD application defaults file; don’tchange it.
vslDefs (classVSLDefs)A string with additionalVSL definitions that are appended to the builtinVSL library. The defaultvalue is an empty string. This resource can be used to override specificVSL definitions that affectthe data display.
The general pattern to replace a function definitionfunctionwith a new definitionnew_defis:
#pragma replacefunctionfunction(args...) = new_def;
The followingVSL functions are frequently used:
color(box, foreground[ , background])Set theforegroundandbackgroundcolors ofbox.
display_color(box)The color used in data displays. Default:color(box, "black", "white")
title_color(box)The color used in the title bar. Default:color(box, "black")
disabled_color(box)The color used for disabled boxes. Default:color(box, "white", "grey50")
DDD 3.1 1998−12−01 69

( ) ( )
simple_color(box)The color used for simple values. Default:color(box, "black")
pointer_color(box)The color used for pointers. Default:color(box, "blue4")
struct_color(box)The color used for structures. Default:color(box, "black")
array_color(box)The color used for arrays. Default:color(box, "blue4")
reference_color(box)The color used for references. Default:color(box, "blue4")
changed_color(box)The color used for changed values. Default:color(box, "black", "#ffffcc")
stdfontfamily()The font family used. One offamily_times(), family_courier() , family_helvetica(),family_new_century(), or family_typewriter() (default).
stdfontsize()The font size used (in pixels).0 (default) means to usestdfontpoints() instead.
stdfontpoints()The font size used (in 1⁄10 points).0 means to usestdfontsize() instead. Defaultvalue:90.
stdfontweight()The font weight used. Eitherweight_medium()(default) orweight_bold().
To set the pointer color to "red4", use
Ddd*vslDefs: \#pragma replace pointer_color\n\pointer_color(box) = color(box, "red4");\n
To set the default font size to resolution-independent 10.0 points, use
Ddd*vslDefs: \#pragma replace stdfontsize\n\#pragma replace stdfontpoints\n\stdfontsize() = 0;\nstdfontpoints() = 100;\n
To set the default font to 12-pixel courier, use
Ddd*vslDefs: \#pragma replace stdfontsize\n\#pragma replace stdfontfamily\n\stdfontsize() = 12;\n\stdfontfamily() = family_courier();\n
See the file ‘ddd.vsl’ for further definitions to override using the ‘vslDefs’ resource.
vslLibrary ( classVSLLibrary)TheVSL library to use. ‘builtin ’ (default) means to use the built-in library, any other value is usedas file name.
DDD 3.1 1998−12−01 70

( ) ( )
vslPath (classVSLPath)A colon-separated list of directories to search forVSL include files. Default is ‘.’, the currentdirectory.
If your DDD source distribution is installed in ‘/opt/src’, you can use the following settings to readtheVSL library from ‘/home/joe/ddd.vsl’:
Ddd*vslLibrary: /home/joe/ddd.vslDdd*vslPath: \.:/opt/src/ddd/ddd:/opt/src/ddd/vsllib
VSL include files referenced by ‘/home/joe/ddd.vsl’ are searched first in the current directory ‘.’,then in ‘/opt/src/ddd/ddd/’, and then in ‘/opt/src/ddd/vsllib/’.
Instead of supplying anotherVSL library, it is often easier to specify some minor changes to thebuilt-in library. See the ‘vslDefs’ resource, above, for details.
Plot WindowThe following resources control the plot window.
plotTermType (classPlotTermType)The Gnuplot terminal type. Can have one of two values:
• If this is ‘x11’, DDD “swallows” the Gnuplot output window into its own user interface. Some windowmanagers, notablyMWM, hav e trouble with swallowing techniques.
• Setting this resource to ‘xlib ’ (default) makesDDD provide abuiltin plot windowinstead. In this mode,plots work well with any window manager, but are less customizable (Gnuplot resources are not under-stood).
plotCommand (classPlotCommand)The name of a Gnuplot executable. Default is ‘gnuplot’, followed by some options to set up colors andthe initial geometry.
plotWindowClass (classPlotWindowClass)The class of the Gnuplot output window. When invoking Gnuplot,DDD waits for a window with thisclass and incorporates it into its own user interface (unless ‘plotTermType’ is ‘ xlib ’; see above).Default is ‘Gnuplot’.
plotWindowDelay (classWindowDelay)The time (in ms) to wait for the creation of the Gnuplot window. Before this delay,DDD looks at eachnewly created window to see whether this is the plot window to swallow. This is cheap, but unfortu-nately, some window managers do not pass the creation event toDDD. If this delay has passed, andDDDhas not found the plot window,DDD searchesall existing windows, which is pretty expensive. Defaulttime is2000.
plotInitCommands (classPlotInitCommands)The initial Gnuplot commands issued byDDD. Default is:
set parametricset urange [0:1]set vrange [0:1]set trange [0:1]
The ‘parametric’ setting is required to make Gnuplot understand the data files as generatedDDD. Therange commands are used to plot scalars.
plot2dSettings (classPlotSettings)Additional initial settings for 2-D plots. Default is ‘set noborder’. Feel free to customize these settingsas desired.
DDD 3.1 1998−12−01 71

( ) ( )
plot3dSettings (classPlotSettings)Additional initial settings for 3-D plots. Default is ‘set border’. Feel free to customize these settings asdesired.
Debugger ConsoleThe following resources control the debugger console.
lineBufferedConsole (classLineBuffered)If this is ‘on’ (default), each line from the inferior is output on each own, such that the final line isplaced at the bottom of the debugger console. If this is ‘off’, all lines are output as a whole. Thisis faster, but results in a random position of the last line.
Value HistoriesThe following resources control the pop-down value histories associated with various text fields.
popdownHistorySize (classHistorySize)The maximum number of items to display in pop-down value histories. A value of0 (default)means an unlimited number of values.
sortPopdownHistory (classSortPopdownHistory)If ‘ on’ (default), items in the pop-down value histories are sorted alphabetically. If ‘off’, mostrecently used values will appear at the top.
Customizing HelpersThe following resources determine external programs invoked byDDD.
editCommand (classEditCommand)A command string to invoke an editor on the specific file. ‘@LINE@’ is replaced by the currentline number, ‘@FILE@’ by the file name. The default is to invoke$XEDITOR first, then$EDI-TOR, thenvi:
Ddd*editCommand: \${XEDITOR-false} +@LINE@ @FILE@ \|| xterm −e ${EDITOR-vi} +@LINE@ @FILE@
This ‘.ddd/init ’ setting invokes an editing session for anXEmacseditor runninggnuserv:
Ddd*editCommand: gnuclient +@LINE@ @FILE@
This ‘.ddd/init ’ setting invokes an editing session for anEmacseditor runningemacsserver:
Ddd*editCommand: emacsclient +@LINE@ @FILE@
fontSelectCommand (classFontSelectCommand)A command to select from a list of fonts. The string ‘@FONT@’ is replaced by the currentDDDdefault font; the string ‘@TYPE@’ is replaced by a symbolic name of theDDD font to edit. Theprogram must either place the name of the selected font in thePRIMARY selection or print theselected font on standard output. A typical value is:
Ddd*fontSelectCommand: xfontsel −print
getCoreCommand (classGetCoreCommand)A command to get a core dump of a running process (typically, ‘gcore’) ‘ @FILE@’ is replacedby the base name of the file to create; ‘@PID@’ is replaced by the process id. The output must bewritten to ‘@FILE@.@PID@’.Leave this entry empty if you have no ‘gcore’ or similar command.
DDD 3.1 1998−12−01 72

( ) ( )
lessTifVersion (classLessTifVersion)Indicates the LessTif versionDDD is running against. For LessTif versionx.y, the value isx multi-plied by 1000 plusy—for instance, the value79 stands for LessTif 0.79 and the value1005standsfor LessTif 1.5.If the value of this resource is less than 1000, indicating LessTif 0.99 or earlier,DDD enables ver-sion-specific hacks to makeDDD work around LessTif bugs and deficiencies.If DDD was compiled against LessTif, the default value is the value of the ‘LessTifVersion’ macroin <Xm/Xm.h>. If DDD was compiled against OSF/Motif, the default value is1000, disabling allLessTif-specific hacks.
listCoreCommand (classlistCoreCommand)The command to list all core files on the remote host. The string ‘@MASK@’ is replaced by afile filter. The default setting is:
Ddd*listCoreCommand: \file @MASK@ | grep ’.*:.*core.*’ \| cut −d: −f1
listDirCommand (classlistDirCommand)The command to list all directories on the remote host. The string ‘@MASK@’ is replaced by afile filter. The default setting is:
Ddd*listDirCommand: \file @MASK@ | grep ’.*:.*directory.*’ \| cut −d: −f1
listExecCommand (classlistExecCommand)The command to list all executable files on the remote host. The string ‘@MASK@’ is replacedby a file filter. The default setting is:
Ddd*listExecCommand: \file @MASK@ | grep ’.*:.*exec.*’ \| grep −v ’.*:.*script.*’ \| cut −d: −f1 | grep −v ’.*\.o$’
listSourceCommand (classlistSourceCommand)The command to list all source files on the remote host. The string ‘@MASK@’ is replaced by afile filter. The default setting is:
Ddd*listSourceCommand: \file @MASK@ | grep ’.*:.*text.*’ \| cut −d: −f1
printCommand (classPrintCommand)The command to print a postscript file. Usually ‘lp’ or ‘ lpr ’.
psCommand (classPsCommand)The command to get a list of processes. Usually ‘ps’. Depending on your system, useful alternatevalues include ‘ps -ef’ and ‘ps ux’. The first line of the output must either contain a ‘PID’ title, oreach line must begin with a process ID.Note that the output of this command is filtered byDDD; a process is only shown if it can beattached to. TheDDD process itself as well as the process of the inferior debugger are suppressed,too.
DDD 3.1 1998−12−01 73

( ) ( )
rshCommand (classRshCommand)The remote shell command to invokeTTY-based commands on remote hosts. Usually, ‘remsh’,‘ rsh’, ‘ ssh’, or ‘on’.
termCommand (classTermCommand)The command to invoke a separateTTY for showing the input/output of the debugged program. ABourne shell command to run in the separateTTY is appended to this string. The string‘@FONT@’ is replaced by the name of the fixed width font used byDDD. A simple value is
Ddd*termCommand: xterm −fn @FONT@ −e /bin/sh −c
termType (classTermType)The terminal type provided by the ‘termCommand’ resource—that is, the value of theTERMenvironment variable to be passed to the debugged program. Default: ‘xterm’.
uncompressCommand (classUncompressCommand)The command to uncompress the built-inDDD manual, theDDD license, and theDDD news.Takes a compressed text from standard input and writes the uncompressed text to standard output.The default value is ‘gzip -d -c’; typical values include ‘zcat’ and ‘gunzip -c’.
wwwCommand (classWWWCommand)The command to invoke aWWW browser. The string ‘@URL@’ is replaced by theURL to open.Default is to try a running Netscape first, then$WWWBROWSER, then to invoke a newNetscape process, then to let a running Emacs do the job, then to invoke Mosaic, then to invokeLynx in an xterm.
To specify ‘netscape-4.0’ as browser, use the setting:
Ddd*wwwCommand: \netscape-4.0 −remote ’openURL(@URL@)’ \
|| netscape-4.0 ’@URL@’
This command first tries to connect to a runningnetscape-4.0browser; if this fails, it starts a newnetscape-4.0process.
wwwPage (classWWWPage)TheDDD WWW page. Value:
Ddd*wwwPage: http://www.cs.tu-bs.de/softech/ddd/
Obtaining DiagnosticsThe following resources are used for debuggingDDD and to obtain specificDDD information.
appDefaultsVersion (classVersion)The version of theDDD app-defaults file. If this string does not match the version of the currentDDD executable,DDD issues a warning.
checkConfiguration (classCheckConfiguration)If ‘ on’, check theDDD environment (in particular, the X configuration), report any possible prob-lem causes and exit. See also the ‘−−check-configuration’ option, below.
dddinitVersion (classVersion)The version of theDDD executable that last wrote the ‘$HOME/.ddd/init ’ file. If this string doesnot match the version of the currentDDD executable,DDD issues a warning.
debugCoreDumps (classDebugCoreDumps)If ‘ on’, DDD invokes a debugger on itself when receiving a fatal signal.
dumpCore (classDumpCore)If ‘ on’ (default),DDD dumps core when receiving a fatal signal.
DDD 3.1 1998−12−01 74

( ) ( )
maintenance (classMaintenance)If ‘ on’, enables a top-level ‘Maintenance’ menu with additional options. See also the ‘−−mainte-nance’ option, below.
showConfiguration (classShowConfiguration)If ‘ on’, show theDDD configuration on standard output and exit. See also the ‘−−configuration’option, below.
showFonts (classShowFonts)If ‘ on’, show theDDD font definitions on standard output and exit. See also the ‘−−fonts’ option,below.
showInvocation (classShowInvocation)If ‘ on’, show theDDD invocation options on standard output and exit. See also the ‘−−help’option, below.
showLicense (classShowLicense)If ‘ on’, show theDDD license on standard output and exit. See also the ‘−−license’ option, below.
showManual (classShowManual)If ‘ on’, show thisDDD manual page on standard output and exit. If the standard output is a termi-nal, the manual page is shown in a pager ($PAGER, ‘ less’ or ‘ more’). See also the ‘−−manual’option, below.
showNews (classShowNews)If ‘ on’, show theDDD news on standard output and exit. See also the ‘−−news’ option, below.
showVersion (classShowVersion)If ‘ on’, show theDDD version on standard output and exit. See also the ‘−−version’ option,below.
trace (classTrace)If ‘ on’, show the dialog betweenDDD and the inferior debugger on standard output. Default is‘off’.
More ResourcesThe ‘Ddd’ application defaults file contains even more information about settingDDD resources. The‘Ddd’ file comes with theDDD distribution.
OPTIONSYou can use the following options when startingDDD. All options may be abbreviated, as long as they areunambiguous; single dashes may also be used.DDD also understands the usual X options such as ‘−dis-play’ or ‘ −geometry’; seeX(1) for details.
All other arguments and options are passed to the inferior debugger. To pass an option to the inferiordebugger that conflicts with an X option, or with aDDD option listed here, use the ‘−−debugger’ option,below.
−−attach-windowsAttach the source and data windows to the debugger console, creating one single bigDDD win-dow. This is the default setting.
−−attach-source-windowAttaches only the source window to the debugger console.
−−attach-data-windowAttaches only the source window to the debugger console.
−−automatic-debuggerDetermine the inferior debugger automatically.
−−button-tipsEnable button tips.
DDD 3.1 1998−12−01 75
( ) ( )
−−configurationShow theDDD configuration settings and exit.
−−check-configurationCheck theDDD environment (in particular, the X configuration), report any possible problemcauses and exit.
−−data-windowCreate the data window upon start-up.
−−dbx Run theDBX debugger as inferior debugger.
−−debuggernameInvoke the inferior debuggername. This is useful if you have sev eral debugger versions around, orif the inferior debugger cannot be invoked as ‘gdb’, ‘ dbx’, ‘ xdb’, ‘ jdb ’, ‘ pydb’, or ‘perl’ respec-tively.This option can also be used to pass options to the inferior debugger that would otherwise conflictwith DDD options. For instance, to pass the option ‘−d directory’ to XDB, use:
ddd −−debugger "xdb −ddirectory"
If you use the ‘−−debugger’ option, be sure that the type of inferior debugger is specified as well.That is, use one of the options ‘−−gdb’, ‘ −−dbx’, ‘ −−xdb’, ‘ −−jdb ’ ‘ −−pydb’, or ‘−−perl’(unless the default setting works fine).
−−debugger-consoleCreate the debugger console upon start-up.
−−disassembleDisassemble the source code. See also the ‘−−no-disassemble’ option, below.
−−exec-windowRun the debugged program in a specially created execution window. This is useful for programsthat have special terminal requirements not provided by the debugger window, as raw keyboardprocessing or terminal control sequences.
−−fontsShow the font definitions used byDDD on standard output.
−−fontsizesizeSet the default font size tosize1⁄10 points. To use 12-point fonts, say ‘−−fontsize 120’.
−−fullnameEnableTTY interface, taking additional debugger commands from standard input and forwardingdebugger output on standard output. Current positions are issued inGDB ‘−fullname’ format suit-able for debugger front-ends. By default, both the debugger console and source window are dis-abled.
−−gdb Run theGDB debugger as inferior debugger.
−−glyphsDisplay the current execution position and breakpoints as glyphs. See also the ‘−−no-glyphs’option, below.
−−help Give a list of frequently used options. Show options of the inferior debugger as well.
−−host [ username@] hostnameInvoke the inferior debugger directly on the remote hosthostname. If usernameis given and the‘−−login’ option is not used, useusernameas remote user name. See ‘REMOTE DEBUG-GING ’, above.
−−jdb RunJDB as inferior debugger.
DDD 3.1 1998−12−01 76

( ) ( )
−−lesstif-hacksEquivalent to ‘−−lesstif-version 999’. Deprecated.
−−lesstif-versionversionEnable some hacks to makeDDD run properly with LessTif. See the ‘lessTifVersion’ resourceand ‘USING DDD WITH LESSTIF ’, above, for a discussion.
−−licenseShow theDDD license and exit.
−−login usernameUseusernameas remote user name. See ‘REMOTE DEBUGGING ’, above.
−−maintenanceEnable the top-level ‘Maintenance’ menu with options for debuggingDDD.
−−manualShow this manual page and exit.
−−newsShow theDDD news and exit.
−−no-button-tipsDisable button tips.
−−no-data-windowDo not create the data window upon start-up.
−−no-debugger-consoleDo not create the debugger console upon start-up.
−−no-disassembleDo not disassemble the source code.
−−no-exec-windowDo not run the debugged program in a specially created execution window; use the debugger con-sole instead. Useful for programs that have little terminal input/output, or for remote debugging.
−−no-glyphsDisplay the current execution position and breakpoints as text characters. Do not use glyphs.
−−no-lesstif-hacksEquivalent to ‘−−lesstif-version 1000’. Deprecated.
−−no-source-windowDo not create the source window upon start-up.
−−no-value-tipsDisable value tips.
−−nw Do not use the X window interface. Start the inferior debugger on the local host.
−−perl Run Perl as inferior debugger.
−−pydbRunPYDB as inferior debugger.
−−panned-graph-editorUse an Athena panner to scroll the data window. Most people prefer panners on scroll bars, sincepanners allow two-dimensional scrolling. However, the panner is off by default, since some Motifimplementations do not work well with Athena widgets. See also−−scrolled-graph-editor,below.
−−play log-fileRecapitulate a previousDDD session. Invoke ‘ddd−−PLAY log-file’ as inferior debugger, simu-lating the inferior debugger given inlog-file (see below). This is useful for debuggingDDD.
DDD 3.1 1998−12−01 77

( ) ( )
−−PLAY log-fileSimulate an inferior debugger.log-file is a ‘$HOME/.ddd/log’ file as generated by some previousDDD session. When a command is entered, scan thelog-file for this command and re-issue thelogged reply; if the command is not found, do nothing. This is used by the ‘−−play’ option.
−−rhost [ username@] hostnameRun the inferior debugger interactively on the remote hosthostname. If usernameis given and the‘−−login’ option is not used, useusernameas remote user name. See ‘REMOTE DEBUG-GING ’, above.
−−separate-windowsSeparate the console, source and data windows. See also the ‘−−attach’ options, above.
−−scrolled-graph-editorUse Motif scroll bars to scroll the data window. This is the default in mostDDD configurations.See also−−panned-graph-editor, above.
−−source-windowCreate the source window upon start-up.
−−status-at-bottomPlace the status line at the bottom of the source window.
−−status-at-topPlace the status line at the top of the source window.
−−sync-debuggerDo not process X events while the debugger is busy. This may result in slightly better perfor-mance on single-processor systems.
−−toolbars-at-bottomPlace the toolbars the bottom of the window.
−−toolbars-at-topPlace the toolbars at the top of the window.
−−traceShow the interaction betweenDDD and the inferior debugger on standard error. This is useful fordebuggingDDD. If ‘ −−trace’ is not specified, this information is written into ‘$HOME/.ddd/log’,such that you can also do a post-mortem debugging.
−−tty EnableTTY interface, taking additional debugger commands from standard input and forwardingdebugger output on standard output. Current positions are issued in a format readable for humans.By default, the debugger console is disabled.
−−value-tipsEnable value tips.
−−versionShow theDDD version and exit.
−−vsl-library libraryLoad theVSL library library instead of using theDDD built-in library. This is useful for customiz-ing display shapes and fonts.
−−vsl-path pathSearchVSL libraries inpath(a colon-separated directory list).
−−vsl-helpShow a list of further options controlling theVSL interpreter. These options are intended fordebugging purposes and are subject to change without further notice.
−−xdb RunXDB as inferior debugger.
DDD 3.1 1998−12−01 78

( ) ( )
ACTIONSThe followingDDD actions may be used in translation tables.
General ActionsThese actions are used to assign the keyboard focus.
ddd-get-focus ()Assign focus to the element that just received input.
ddd-next-tab-group ()Assign focus to the next tab group.
ddd-prev-tab-group ()Assign focus to the previous tab group.
ddd-previous-tab-group ()Assign focus to the previous tab group.
Data Display ActionsThese actions are used in theDDD graph editor.
end () End the action initiated byselect. Bound to a button up event.
extend ()Extend the current selection. Bound to a button down event.
extend-or-move ()Extend the current selection. Bound to a button down event. If the pointer is dragged, move theselection.
follow ()Continue the action initiated byselect. Bound to a pointer motion event.
graph-select ()Equivalent toselect, but also updates the current argument.
graph-select-or-move ()Equivalent toselect-or-move, but also updates the current argument.
graph-extend ()Equivalent toextend, but also updates the current argument.
graph-extend-or-move ()Equivalent toextend-or-move, but also updates the current argument.
graph-toggle ()Equivalent totoggle, but also updates the current argument.
graph-toggle-or-move ()Equivalent totoggle-or-move, but also updates the current argument.
graph-popup-menu ([graph|node|shortcut])Pops up a menu.graph pops up a menu with global graph operations,nodepops up a menu withnode operations, andshortcut pops up a menu with display shortcuts. If no argument is given,pops up a menu depending on the context: when pointing on a node with theShift key pressed,behaves likeshortcut; when pointing on a without theShift key pressed, behaves likenode; other-wise, behaves as ifgraph was giv en.
graph-dereference ()Dereference the selected display.
graph-detail ()Show or hide detail of the selected display.
DDD 3.1 1998−12−01 79

( ) ( )
graph-rotate ()Rotate the selected display.
graph-dependent ()Pop up a dialog to create a dependent display.
hide-edges ([any|both|from |to])Hide some edges.any means to process all edges where either source or target node are selected.both means to process all edges where both nodes are selected.from means to process all edgeswhere at least the source node is selected.to means to process all edges where at least the targetnode is selected. Default isany.
layout ([regular|compact], [[+|−]degrees]] )Layout the graph.regular means to use the regular layout algorithm;compact uses an alternatelayout algorithm, where successors are placed next to their parents. Default isregular. degreesindicates in which direction the graph should be layouted. Default is the current graph direction.
move-selected (x-offset, y-offset)Move all selected nodes in the direction given byx-offsetand y-offset. x-offsetand y-offset iseither given as a numeric pixel value, or as ‘+grid ’, or ‘−grid ’, meaning the current grid size.
normalize ()Place all nodes on their positions and redraw the graph.
rotate ([[+|−]degrees])Rotate the graph arounddegreesdegrees.degreesmust be a multiple of 90. Default is+90.
select ()Select the node pointed at. Clear all other selections. Bound to a button down event.
select-all ()Select all nodes in the graph.
select-first ()Select the first node in the graph.
select-next ()Select the next node in the graph.
select-or-move ()Select the node pointed at. Clear all other selections. Bound to a button down event. If the pointeris dragged, move the selected node.
select-prev ()Select the previous node in the graph.
show-edges ([any|both|from |to])Show some edges.any means to process all edges where either source or target node are selected.both means to process all edges where both nodes are selected.from means to process all edgeswhere at least the source node is selected.to means to process all edges where at least the targetnode is selected. Default isany.
snap-to-grid ()Place all nodes on the nearest grid position.
toggle ()Toggle the current selection—if the node pointed at is selected, it will be unselected, and viceversa. Bound to a button down event.
toggle-or-move ()Toggle the current selection—if the node pointed at is selected, it will be unselected, and viceversa. Bound to a button down event. If the pointer is dragged, move the selection.
DDD 3.1 1998−12−01 80

( ) ( )
unselect-all ()Clear the selection.
Debugger Console ActionsThese actions are used in the debugger console and other text fields.
gdb-backward-character ()Move one character to the left. Bound toLeft .
gdb-beginning-of-line ()Move cursor to the beginning of the current line, after the prompt. Bound toHOME .
gdb-control (control-character)Send the givencontrol-characterto the inferior debugger. Thecontrol-charactermust be speci-fied in the form ‘̂X’, whereX is an upper-case letter or ‘?’.
gdb-command (command)Executecommandin the debugger console. The following replacements are performed oncom-mand:
• If commandhas the form ’name...’, insertname, followed by a space, in the debugger console.
• All occurrences of ‘()’ are replaced by the current contents of the argument field ‘()’.
gdb-complete-arg (command)Complete current argument as ifcommandwas prepended. Bound toCtrl+T .
gdb-complete-command ()Complete current command line in the debugger console. Bound toTAB .
gdb-complete-tab (command)If global TAB completion is enabled, complete current argument as ifcommandwas prepended.Otherwise, proceed as if theTAB key was hit. Bound toTAB .
gdb-delete-or-control (control-character)Like gdb-control, but effective only if the cursor is at the end of a line. Otherwise,control-characteris ignored and the character following the cursor is deleted. Bound toCtrl+D .
gdb-end-of-line ()Move cursor to the end of the current line. Bound toEnd.
gdb-forward-character ()Move one character to the right. Bound toRight.
gdb-insert-graph-arg ()Insert the contents of the data display argument field ‘()’.
gdb-insert-source-arg ()Insert the contents of the source argument field ‘()’.
gdb-interrupt ()If DDD is in incremental search mode, exit it; otherwise callgdb-control(ˆC).
gdb-isearch-prev ()Enter reverse incremental search mode. Bound toCtrl+B .
gdb-isearch-next ()Enter incremental search mode. Bound toCtrl+F .
gdb-isearch-exit ()Exit incremental search mode. Bound toESC.
gdb-next-history ()Recall next command from history. Bound toDown.
DDD 3.1 1998−12−01 81

( ) ( )
gdb-prev-history ()Recall previous command from history. Bound toUp.
gdb-previous-history ()Recall previous command from history. Bound toUp.
gdb-process ([action[ , args...] ])Process the given event in the debugger console. Bound to key events in the source and data win-dow. If this action is bound to the source window, and the source window is editable, performaction(args...) on the source window instead; ifaction is not given, perform ‘self-insert()’.
gdb-select-all ()If the ‘selectAllBindings’ resource is set toMotif , performbeginning-of-line. Otherwise, performselect-all. Bound toCtrl+A .
gdb-set-line (value)Set the current line tovalue. Bound toCtrl+U .
Source Window ActionsThese actions are used in the source and code windows.
source-delete-glyph ()Delete the breakpoint related to the glyph at cursor position.
source-double-click ([text-action[,line-action[,function-action]]] )The double-click action in the source window.
• If this action is taken on a breakpoint glyph, edit the breakpoint properties.
• If this action is taken in the breakpoint area, invoke ‘gdb-command(line-action)’. If line-actionis not given, it defaults to ‘break ()’.
• If this action is taken in the source text, and the next character following the current selection isa ‘(’, invoke ‘gdb-command(function-action)’. If function-actionis not given, it defaults to‘ list ()’.
• Otherwise, invoke ‘gdb-command(text-action)’. If text-action is not given, it defaults to‘graph display ()’.
source-drag-glyph ()Initiate a drag on the glyph at cursor position.
source-drop-glyph ([action])Drop the dragged glyph at cursor position.action is either ‘move’, meaning to move the draggedglyph, or ‘copy’, meaning to copy the dragged glyph. If noaction is given, ‘move’ is assumed.
source-end-select-word ()End selecting a word.
source-follow-glyph ()Continue a drag on the glyph at cursor position. Usually bound to some motion event.
source-popup-menu ()Pop up a menu, depending on the location.
source-set-arg ()Set the argument field to the current selection. Typically bound to some selection operation.
source-start-select-word ()Start selecting a word.
source-update-glyphs ()Update all visible glyphs. Usually invoked after a scrolling operation.
DDD 3.1 1998−12−01 82

( ) ( )
IMAGESDDD installs a number of images that may be used as pixmap resources, simply by giving a symbolic name.For button images, three variants are installed as well:
• The suffix ‘-hi’ indicates a highlighted variant (Button is entered).
• The suffix ‘-arm’ indicates an armed variant (Button is pushed).
• The suffix ‘-xx’ indicates a disabled (insensitive) variant.
break_at‘Break at ()’ button.
clear_at‘Clear at ()’ button.
dddDDD icon.
delete‘Delete ()’ button.
disable‘Disable’ button.
dispref‘Display * ()’ button.
display‘Display ()’ button.
drag_arrowThe execution pointer (being dragged).
drag_condA conditional breakpoint (being dragged).
drag_stopA breakpoint (being dragged).
drag_tempA temporary breakpoint (being dragged).
enable‘Enable’ button.
find_forward‘Find>> ()’ button.
find_backward‘Find<< ()’ button.
grey_arrowThe execution pointer (not in lowest frame).
grey_condA conditional breakpoint (disabled).
grey_stopA breakpoint (disabled).
grey_tempA temporary breakpoint (disabled).
hide‘Hide ()’ button.
DDD 3.1 1998−12−01 83

( ) ( )
lookup‘Lookup ()’ button.
maketemp‘Make Temporary’ button.
new_break‘New Breakpoint’ button.
new_display‘New Display’ button.
new_watch‘New Watchpoint’ button.
plain_arrowThe execution pointer.
plain_condA conditional breakpoint (enabled).
plain_stopA breakpoint (enabled).
plain_tempA temporary breakpoint (enabled).
print‘Print () ’ button.
properties‘Properties’ button.
rotate‘Rotate ()’ button.
set‘Set ()’ button.
show‘Show ()’ button.
signal_arrowThe execution pointer (stopped by signal).
undisplay‘Undisplay ()’ button.
unwatch‘Unwatch ()’ button.
watch‘Watch ()’ button.
ENVIRONMENTDDD is controlled by the following environment variables:
DDD_NO_SIGNAL_HANDLERSIf set,DDD does not catch fatal errors. This is sometimes useful when debuggingDDD.
DDD_STATE Root ofDDD state directory. Default is ‘$HOME/.ddd/ ’.
DDD_SESSION If set, indicates a session to start, overriding all options. This is used byDDDwhen restarting itself.
DDD 3.1 1998−12−01 84

( ) ( )
DDD_SESSIONS DDD session directory. Default is ‘$DDD_STATE/sessions/’.
EDITOR The text editor to invoke for editing source code. See the ‘editCommand’resource, above.
VSL_INCLUDE Where to search forVSL include files. Default is the current directory.
WWWBROWSER The WWW browser to invoke for viewing theDDD WWW page. See the ‘www-Command’ resource, above.
XEDITOR The X editor to invoke for editing source code. See the ‘editCommand’ resource,above.
The following environment variables are set byDDD:
DDD Set to a string indicating theDDD version. By testing whetherDDD is set, adebuggee (or inferior debugger) can determine whether it was invoked byDDD.
TERM Set to ‘dumb’, the DDD terminal type. This is set for the inferior debugger only.If the debuggee runs in a separate execution window, the debuggee’sTERM valueis set according to the ‘termType’ resource (see ‘RESOURCES’, above).
TERMCAP Set to ‘’ (none), theDDD terminal capabilities.
PA GER Set to ‘cat’, the preferredDDD pager.
FILES$HOME/.ddd/ DDD state directory.$HOME/.ddd/init Individual DDD resource file.DDD options are saved here.$HOME/.ddd/history DefaultDDD command history file.$HOME/.ddd/lock DDD lock file; indicates that aDDD is running.$HOME/.ddd/log Trace of the current interaction betweenDDD and the inferior debugger.$HOME/.ddd/sessions/
DDD session directory. One subdirectory per session.$HOME/.ddd/sessions/session/dddcore
DDD core file forsession.$HOME/.ddd/sessions/session/init
DDD resource file forsession.$HOME/.ddd/sessions/session/history
DDD command history forsession.$HOME/.ddd/sessions/.ddd/
TheDDD ‘restart’ session.$HOME/.ddd/tips DDD tips resource file. Contains the number of the next tip of the day.$HOME/.gdbinit GDB initialization file.$HOME/.dbxinit DBX initialization file.$HOME/.dbxrc AlternateDBX initialization file.$HOME/.xdbrc XDB initialization file.$HOME/.gnuplot Gnuplot initialization file.$HOME/.dddinit Old-styleDDD initialization file; used only if$HOME/.ddd/init does not exist.
SEE ALSOX(1), gdb(1), dbx(1), xdb(1), perldebug(1), remsh(1), rsh(1), gnuplot(1),
‘ gdb ’ entry in info.
UsingGDB: A Guide to theGNU Source-Level Debugger, by Richard M. Stallman and Roland H. Pesch.
jdb—The Java Debugger, at http://java.sun.com/ (and its mirrors) in /prod-ucts/jdk/1.1/docs/tooldocs/solaris/jdb.html
Java Language Debugging, athttp://java.sun.com/ (and its mirrors) in/products/jdk/1.1/debugging/
The Python Language, athttp://www.python.org/ and its mirrors.
DDD 3.1 1998−12−01 85

( ) ( )
DDD—A Free Graphical Front-End forUNIX Debuggers, by Andreas Zeller and Dorothea Lütkehaus, Com-puter Science Report 95-07, Technische Universität Braunschweig, 1995.
DDD – ein Debugger mit graphischer Datendarstellung, by Dorothea Lütkehaus, Diploma Thesis, Technis-che Universität Braunschweig, 1994.
TheDDD FTP site,
ftp://ftp.ips.cs.tu-bs.de/pub/local/softech/ddd/
TheDDD WWWpage,
http://www.cs.tu-bs.de/softech/ddd/
TheDDD Mailing List,
For more information on this list, send a mail to
LIMITATIONSGeneral Limitations
If command output is sent to the debugger console, it is impossible forDDD to distinguish between the out-put of the debugged program and the output of the inferior debugger. This problem can be avoided by run-ning the program in the separate execution window.
Output that confusesDDD includes:
• Primary debugger prompts (e.g. ‘(gdb) ’ or ‘ (dbx) ’)
• Secondary debugger prompts (e.g. ‘>’)
• Confirmation prompts (e.g. ‘(y or n) ’)
• Prompts for more output (e.g. ‘PressRETURN to continue’)
• Display output (e.g. ‘$pc = 0x1234’)
If your program outputs any of these strings, you should run it in the separate execution window.
If the inferior debugger changes the defaultTTY settings, for instance through a ‘stty’ command in its ini-tialization file,DDD will likely become confused. The same applies to debugged programs which changethe defaultTTY settings.
Limitations using GDBSomeGDB settings are essential forDDD to work correctly. These settings with their correct values are:
set height 0set width 0set verbose offset prompt (gdb)
DDD sets these values automatically when invokingGDB; if these values are changed, there may be somemalfunctions, especially in the data display.
When debugging at the machine level withGDB 4.12 and earlier as inferior debugger, use a ‘display /x$pc’ command to ensure the program counter value is updated correctly at each stop. You may also enterthe command in$HOME/.gdbinit or (better yet) upgrade to the most recentGDB version.
DDD 3.1 1998−12−01 86

( ) ( )
Limitations using DBXWhen used for debugging Pascal-like programs,DDD does not infer correct array subscripts and alwaysstarts to count with 1.
With someDBX versions (notably SolarisDBX), DDD strips C-style and C++-style comments from theDBX output in order to interpret it properly. This also affects the output of the debugged program whensent to the debugger console. Using the separate execution window avoids these problems.
In someDBX versions (notablyDEC DBX andAIX DBX ), there is no automatic data display. As an alterna-tive, DDD uses theDBX ‘print ’ command to access data values. This means that variable names are inter-preted according to the current frame; variables outside the current frame cannot be displayed.
Limitations using XDBThere is no automatic data display inXDB. As a workaround,DDD uses the ‘p’ command to access datavalues. This means that variable names are interpreted according to the current frame; variables outside thecurrent frame cannot be displayed.
Limitations using JDBThere is no automatic data display inJDB. As a workaround,DDD uses the ‘dump’ command to accessdata values. This means that variable names are interpreted according to the current frame; variables out-side the current frame cannot be displayed.
The JDB ‘dump’ and ‘print ’ commands do not support expression evaluation. Hence, you cannot displayarbitrary expressions.
Parsing ofJDB output is quite CPU-intensive, due to the recognition of asynchronous prompts (any threadmay output anything at any time, including prompts). Hence, a program producing much console output islikely to slow downDDD considerably. In such a case, have the program run with−debug in a separatewindow and attachJDB to it using the−passwdoption.
Limitations using PerlThere is no automatic data display in Perl. As a workaround,DDD uses the ‘x’ command to access datavalues. This means that variable names are interpreted according to the current frame; variables outside thecurrent frame cannot be displayed.
REPORTING BUGSIf you find a bug inDDD, please send us a bug report. We will either attempt to fix the bug—or include thebug description in theDDD ‘BUGS’ file, such that others can attempt to fix it. (Instead of sending bugreports, you may also sendfixes; DDD is an excellent tool for debugging itself :-)
Where to Send Bug ReportsWe recommend that you send bug reports forDDD via electronic mail to
As a last resort, send bug reports on paper to:
Technische Universität BraunschweigAbteilung SoftwaretechnologieDDD-BugsBültenweg 88D-38092 BraunschweigGERMANY
Is it a DDD Bug?Before sending in a bug report, try to find out whether the problem cause really lies withinDDD. A com-mon cause of problems are incomplete or missing X or Motif installations, for instance, or bugs in the Xserver or Motif itself. RunningDDD as
ddd −−check-configuration
DDD 3.1 1998−12−01 87

( ) ( )
checks for common problems and gives hints on how to repair them.
Another potential cause of problems is the inferior debugger; occasionally, they show bugs, too. To find outwhether a bug was caused by the inferior debugger, runDDD as
ddd −−trace
This shows the interaction betweenDDD and the inferior debugger on standard error whileDDD is running.(If ‘ −−trace’ is not given, this interaction is logged in the file ‘$HOME/.ddd/log’.) Compare the debuggeroutput to the output ofDDD and determine which one is wrong.
How to Report BugsHere are some guidelines for bug reports:
• The fundamental principle of reporting bugs usefully is this:report all the facts. If you are not surewhether to state a fact or leave it out, state it!
• Keep in mind that the purpose of a bug report is to enable someone to fix the bug if it is not known. It isnot very important what happens if the bug is already known. Therefore, always write your bug reportson the assumption that the bug is not known.
• Your bug report should be self-contained. Do not refer to information sent in previous mails; your previ-ous mail may have been forwarded to somebody else.
• Please report each bug in a separate message. This makes it easier for us to track which bugs have beenfixed and to forward your bugs reports to the appropriate maintainer.
• Please report bugs in English; this increases the chances of finding someone who can fix the bug. Do notassume one particular person will receive your bug report.
What to Include in a Bug ReportTo enable us to fix aDDD bug, youmustinclude the following information:
• Your DDD configuration. InvokeDDD as
ddd −−configuration
to get the configuration information. If this does not work, please include at least theDDD version, thetype of machine you are using, and its operating system name and version number.
• The debugger you are using and its version (e.g., ‘gdb-4.17’ or ‘ dbx as shipped with Solaris 2.6’).
• The compiler you used to compileDDD and its version (e.g., ‘gcc-2.8.1’).
• A description of what behavior you observe that you believe is incorrect. For example, “DDD gets a fatalsignal” or “DDD exits immediately after attempting to create the data window“.
• A log file showing the interaction betweenDDD and the inferior debugger. By default, this interaction islogged in the file ‘$HOME/.ddd/log’. Include all trace output from theDDD invocation up to the firstbug occurrence; insert own comments where necessary.
• If you wish to suggest changes to theDDD source, send us context diffs. If you even discuss somethingin theDDD source, refer to it by context,neverby line number.
Be sure to include this information ineverysingle bug report.
HISTORYThe history ofDDD is a story of code recycling. The oldest parts ofDDD were written in 1990, whenAndreas ZellerdesignedVSL, a box-based visual structure language for visualizing data and program struc-tures. TheVSL interpreter and theBOX library became part of Andreas’ Diploma Thesis, a graphical syn-tax editor based on the Programming System GeneratorPSG.
In 1992, theVSL andBOX libraries were recycled for theNORA project. ForNORA, an experimental infer-ence-based software development tool set, Andreas wrote a graph editor (based onVSL and theBOX
DDD 3.1 1998−12−01 88

( ) ( )
libraries) and facilities for inter-process knowledge exchange. Based on these tools,Dorothea Lütkehaus(nowDorothea Krabiell) realizedDDD as her Diploma Thesis, 1994.
The originalDDD had no source window; this was added by Dorothea during the winter of 1994–1995. Inthe first quarter of 1995, finally, Andreas completedDDD by adding command and execution windows,extensions forDBX and remote debugging as well as configuration support for several architectures. Sincethen, Andreas has further maintained and extendedDDD, based on the comments and suggestions of severalDDD users around the world. See the comments in theDDD source for details.
Major DDD ev ents:April, 1995 DDD 0.9: FirstDDD beta release.May, 1995 DDD 1.0: First publicDDD release.December, 1995 DDD 1.4: Machine-level debugging, glyphs,EMACS integration.October, 1996 DDD 2.0: Color displays,XDB support, genericDBX support, command tool.May, 1997 DDD 2.1: Alias detection, button tips, status displays.November, 1997 DDD 2.2: Persistent sessions, display shortcuts.June, 1998 DDD 3.0: Icon tool bar, Java support,JDB support.December, 1998 DDD 3.1: Data plotting, Perl support, Python support, Undo/Redo.
EXTENDING DDDIf you have any contributions to be incorporated intoDDD, please send them to ‘[email protected]’.For suggestions on what might be done, see the file ‘TODO’ in the DDD distribution.
DDD NEEDS YOUR SUPPORT!DDD needs your support! If you have any success stories related to DDD, please write them down on apicture postcard and send them to us:
Technische Universität BraunschweigAbteilung SoftwaretechnologieBültenweg 88D-38092 BraunschweigGERMANY
You may also leave a message in theDDD Guestbook. It is accessible via theDDD WWW page,
http://www.cs.tu-bs.de/softech/ddd/.
PRINTING THIS MANUALInvokeDDD with the ‘−−manual’ option to show this manual page on standard output. This text output issuitable for installation as formatted manual page (as ‘/usr/local/man/cat1/ddd.1’ or similar) onUNIX sys-tems.
A PostScript copy of this manual page, including severalDDD screen shots and diagrams, is included in theDDD source distribution and available separately as ‘ddd.man.ps.gz’ in
ftp://ftp.ips.cs.tu-bs.de/pub/local/softech/ddd/doc/
This directory also contains other documentation related toDDD.
A ROFF copy of this manual page, suitable for installation as manual page onUNIX systems (as‘ /usr/local/man/man1/ddd.1’ or similar), is included in theDDD source distribution.
COPYRIGHTDDD
DDD is Copyright © 1995, 1996, 1997, 1998 Technische Universität Braunschweig, Germany.
DDD is free software; you can redistribute it and/or modify it under the terms of the GNU General PublicLicense as published by the Free Software Foundation; either version 2 of the License, or (at your option)any later version.
DDD 3.1 1998−12−01 89

( ) ( )
DDD is distributed in the hope that it will be useful, butwithout any warranty; without even the impliedwarranty ofmerchantabilityor fitness for a particular purpose. See the License for more details.
You should have received a copy of the License along withDDD. If not, invokeDDD with the ‘−−license’option; this will print a copy on standard output. To read the License from withinDDD, use ‘Help→DDDLicense’.
DDD ManualThis DDD manual is Copyright © 1995, 1996, 1997, 1998 Technische Universität Braunschweig, Germany.
Permission is granted to make and distribute verbatim copies of this manual provided the copyright noticeand this permission notice are preserved on all copies.
Permission is granted to copy and distribute modified versions of this manual under the conditions for ver-batim copying, provided that the entire resulting derived work is distributed under the terms of a permissionnotice identical to this one.
Permission is granted to copy and distribute translations of this manual into another language, under theabove conditions for modified versions, except that this permission notice may be included in translationsapproved by the Free Software Foundation instead of in the original English.
DDD 3.1 1998−12−01 90