Stability classification for CFD simulations in complex terrain
©2005 ASHRAE. THIS PREPRINT MAY NOT BE DISTRIBUTED IN PAPER OR DIGITAL FORM IN WHOLE OR IN PART. IT IS FOR DISCUSSION PURPOSES ONLY AT THE2005 ASHRAE WINTER MEETING. The archival version of this paper along with comments and author responses will be published in ASHRAE Transactions, Volume 111, Part 1.ASHRAE must receive written questions or comments regarding this paper by February 16, 2005, if they are to be included in Transactions.
ABSTRACT
Accurately analyzing heat transfer in window frames andglazings is important for developing and characterizing theperformance of highly insulating window products. This paperuses computational fluid dynamics (CFD) modeling to assessthe accuracy of the simplified frame cavity conduction/convec-tion models presented in ISO 15099 and used in software forrating and labeling window products. Three representativecomplex cavity cross-section profiles with varying dimensionsand aspect ratios are examined. The results presented supportthe ISO 15099 rule that complex cavities with small throatsshould be subdivided; however, our data suggest that cavitieswith throats smaller than 7 mm should be subdivided, incontrast to the ISO 15099 rule, which places the break pointat 5 mm. The agreement between CFD modeling results and theresults of the simplified models is moderate for the heat trans-fer rates through the cavities. The differences may be a resultof the underlying ISO 15099 Nusselt number correlationsbeing based on studies where cavity height/length aspect ratioswere smaller than 0.5 and greater than 5 (with linear interpo-lation assumed in between). The results presented here are forhorizontal frame members because convection in verticaljambs involves very different aspect ratios that require three-dimensional CFD simulations.
INTRODUCTION
The frame is an important part of a fenestration product.In a window with a total area of 1.2 × 1.2 m2 and a frame witha width of 10 cm, the frame occupies 30% of the window’stotal area. If the total area of the window is increased to 2.0 ×2.0 m2 and the window still has a frame with a width of 10 cm,the frame occupies 19% of the total area. When rating a fenes-
tration product, engineers area-weight the thermal perfor-mance of the different parts of the product to determine asingle number that describes the entire product. Thus, to beable to accurately calculate a product’s thermal performance,engineers need models that accurately describe the thermalperformance of each part of the product or accurate measure-ments of actual thermal performance. Because measurementis expensive, use of accurate models is preferable.
A significant body of research has focused on heat-trans-fer effects in glazing cavities. The primary goal of that workhas been to develop accurate correlations for natural convec-tion effects inside multiple-pane windows (Batchelor 1954;Eckert and Carlson 1961; Hollands et al. 1976; Raithby et al.1977; Berkovsky and Polevikov 1977; Korpela et al. 1982;ElSherbiny et al. 1982; Shewen et al. 1996; Wright 1996; Zhao1998). Less research has been conducted on heat transfer inwindow frames that have internal cavities. This is an impor-tant issue for high-performance window frames because cavi-ties are a primary area where frame heat transfer can beminimized (the thermal conductivity of solid framing materi-als is another key area). In window frames with internal cavi-ties, the heat-transfer process involves a combination ofconduction, convection, and radiation. To fully describe heattransfer through these window frames, it would be necessaryto simulate fluid flow to determine the convection effects andto use either view factors or ray-tracing techniques to deter-mine the radiation effects inside the cavities. However, thesetypes of simulations and techniques are rarely undertakenbecause they require significant computational resources andmodeling efforts. Instead, air cavities in window frames aretreated as solid materials that have an effective conductivity(Standaert 1984; Jonsson 1985; Carpenter and McGowan
Two-Dimensional Conduction andCFD Simulations of Heat Transfer inHorizontal Window Frame Cavities
Arild Gustavsen, PhD Christian KohlerMember ASHRAE
Dariush Arasteh, PE Dragan Curcija, PhDMember ASHRAE Member ASHRAE
A. Gustavsen is associate professor in the Department of Civil and Transport Engineering, Norwegian University of Science and Technology.C. Kohler is computer systems engineer and D. Arasteh is staff scientist and deputy group leader, Windows and Daylighting Group, LawrenceBerkeley National Laboratory, Berkeley, California. D. Curcija is president of Carli, Inc., Amherst, Mass.
OR-05-4-3

2 OR-05-4-3
1989); that is, convection and radiation effects are combinedinto a single effective conductivity. With this single value,standard conduction simulation software can find the insula-tion value or thermal transmittance (U-factor) of the frameusing the same procedure as is used for window frames with-out internal cavities. The proposed standard ASHRAE 142Pand standards EN ISO 10077-2 and ISO 15099 (ASHRAE1996; CEN 2003; ISO 2003) prescribe methods of this type forfinding the thermal transmittance of window frames.
To represent the airflow in frame cavities, various sourcesprescribe rules for subdividing cavities at points where theirdimensions are smaller than a specified minimum. NFRC(Mitchell et al. 2003) and ISO 15099 (ISO 2003) indicate thatcavities are to be divided at points where their dimensions areless than 5 mm, and EN ISO 10077-2 (CEN 2003) specifiesthat cavities with one dimension not exceeding 2 mm or subar-eas of cavities with interconnection whose size does notexceed 2 mm should be divided into separate subcavities(here, the terms subarea and subcavity are used for parts of alarger cavity that can naturally be separated from the largercavity based on its geometric configuration). No researchbasis is given for the values used in these rules. The standardsalso differ in their rules for converting nonrectangular (orirregular) cavities into equivalent rectangular cavities whoseconvection and radiation correlations are assumed to be thesame as the correlations for the original irregular cavity. ISO15099 and EN ISO 10077-2 specify that irregular cavitiesshould be transformed into rectangular cavities so that theareas and aspect ratios of the original irregular cavity and thenew rectangular cavity are equal. The proposed ASHRAEStandard 142P specifies that irregular cavities should be trans-formed into rectangular cavities using a bounding rectangle.The aspect ratios and the total heights and widths of the orig-inal irregular cavity and the new rectangular cavity should beequal. (The total heights and widths will most likely not beequal under ISO 15099/EN ISO 10077-2 and ASHRAE 142P.)It is noted that the conversion of irregular cavities to rectan-gular cavities only is performed for finding the effectiveconductivity of the irregular cavity. The true geometry isretained for the numerical simulation.
In this paper, focus is put on convective heat transfer inframe cavities; problems related to dividing cavities and trans-forming irregular cavities into rectangular cavities areaddressed. (Radiant heat-transfer effects are not studied.) Theresults presented are for horizontal frame members becauseconvection in vertical jambs involves very different aspectratios that require three-dimensional computational fluiddynamics (CFD) simulations. CFD and conduction simula-tions were conducted for this study. In the conduction simu-lations, an effective conductivity (calculated according toprocedures described in ISO 15099, see below) was used toaccount for convection in frame cavities.
GEOMETRIES STUDIED
The air cavities studied are shown in Figure 1. The partic-ular cavities were chosen to represent air cavities that can befound in real window frames. The cavities are identified as H-cavity, L-cavity, and C-cavity (left to right in Figure 1). H-cavity is square with two solid fins protruding into it. Dimen-sions and temperature differences simulated for the cavitiesare shown in Tables 1 to 3. Because the cavities are simulatedin two dimensions, the results are valid for horizontal framemembers. CFD results that are valid for jamb sections requiresimulations in three dimensions.
NUMERICAL PROCEDURE
The simulations were performed with a CFD code (Fluent1998) and a building component thermal simulation programfor implementing ISO 15099 (Finlayson et al. 1998). Doubleprecision was used for both codes.
CFD Simulations
The CFD code uses a control-volume method to solve thecoupled heat and fluid flow equations. Only conduction andnatural convection are simulated; radiation effects are notaddressed. The maximum Rayleigh number found for thecavities studied is about 1×10⁵. This Rayleigh number isfound for the H-cavity when there is a temperature differenceof 25 K separating the two isothermal walls. Ostrach (1988)
Figure 1 Schematics of cavities studied. From left to right—H-cavity, L-cavity, and the C-cavity.
OR-05-4-3 3
Table 1. Cavity Dimensions and Temperatures for the H-Cavity
ID Lv [mm] Lh [mm] La [mm] Lf [mm] TH [°C] TC [°C]
H1 30 30 30 - 15 -10
H2 30 30 20 2 15 -10
H3 30 30 15 2 15 -10
H4 30 30 10 2 15 -10
H5 30 30 7 2 15 -10
H6 30 30 5 2 15 -10
H7 30 30 3 2 15 -10
H8 30 30 0 2 15 -10
H9 30 30 30 - 15 5
H10 30 30 20 2 15 5
H11 30 30 15 2 15 5
H12 30 30 10 2 15 5
H13 30 30 7 2 15 5
H14 30 30 5 2 15 5
H15 30 30 3 2 15 5
H16 30 30 0 2 15 5
Table 2. Cavity Dimensions and Temperatures for the L-Cavity
ID Lv [mm] Lh [mm] Lh1 [mm] La [mm] TH [°C] TC [°C]
L1 30 30 10 15 15 -10L2 30 30 10 10 15 -10L3 30 30 10 7 15 -10L4 30 30 10 5 15 -10L5 30 30 10 3 15 -10
L6 30 30 10 15 15 5L7 30 30 10 10 15 5L8 30 30 10 7 15 5L9 30 30 10 5 15 5L10 30 30 10 3 15 5
Table 3. Cavity Dimensions and Temperatures for the C-Cavity
ID Lv [mm] Lh [mm] Lh1 [mm] TH [°C] TC [°C]
C1 20 30 10 15 -10
C2 20 30 10 15 5
C3 10 30 10 15 -10
C4 10 30 10 15 5
4 OR-05-4-3
reports steady laminar flow for square cavities of this size.Although most of the cavities presented are not squares,incompressible and steady laminar flow are assumed. Further,viscous dissipation is not addressed, and all thermophysicalproperties are assumed to be constant except for the buoyancyterm of the y-momentum equation where the Boussinesqapproximation is used. The Semi-Implicit Methodf or Pres-sure-linked Equations Consistent (SIMPLEC) was used tomodel the interaction between pressure and velocity. Theenergy and momentum variables at cell faces were found byusing the Quadratic Upstream Interpolation for ConvectiveKinetics (QUICK) scheme. In addition, the CFD code usescentral differences to approximate diffusion terms and relieson the PREssure Staggering Option scheme (PRESTO) to findthe pressure values at the cell faces. PRESTO is similar to thestaggered grid approach described by Patankar (1980).Convergence is determined by checking the scaled residualsand ensuring that they are less than 10-5 for all variables,except for the energy equation, in which the residuals have tobe less than 10-6.
A quadrilateral grid was used for all cavities. Some gridsensitivity tests were performed for the H- and C-cavities. TheL-cavity was assumed to behave similarly to the H-cavity withrespect to grid density; therefore, the same grid density wasused for the L-cavity as for the H-cavity. For the H-cavity, thegrid size was varied between 0.5 mm and 0.06 mm, where thefirst size results in 3,600 nodes and the latter size results in249,999 nodes. For the C-cavity, grid sizes of 0.5 mm, 0.1 mm,and 0.05 mm were tested, resulting in 2,369, 28,919, and227,195 nodes, respectively. An interval size of 0.1 mm wasfound to be sufficient for all cavities. Reducing the grid sizesto 0.06 mm for the H-cavity and 0.05 mm for the C-cavityresulted in changes of heat fluxes of less than 0.5%.
Conduction Simulations
The conduction simulations were performed using aspecial version of the building component thermal simulationprogram in which the radiation calculation in frame cavitieswas disabled, which allowed a comparison of the convectioneffects with the CFD calculations. A finite-element approachwas used to solve the conductive heat transfer equation. Thequadrilateral mesh is automatically generated. Refinementwas performed in accordance with section 6.3.2b. of ISO15099 (ISO 2003). The energy error norm was less than 10%in all cases, which results in an error of less than 1% in the ther-mal transmittance of the cavities. The temperatures on theboundaries of the cavities were fixed using a very largecombined convective and radiative film coefficient (h =99,900 W m-2 K-1). The resulting cavity wall temperatureswere within 0.01°C of the desired temperatures. For moreinformation on the thermal simulation program algorithms,refer to Appendix C in Finlayson et al. (1998).
The procedures and the natural convection correlationsused to find the effective conductivities of the cavities accord-
ing to ISO 15099 are listed below. Note that only correlationsfor horizontal frame members are used in this study. The effec-tive conductivity is determined from
(1)
where λeff is the effective conductivity, hcv is the convectiveheat transfer coefficient, hr is the radiative heat transfer coef-ficient (set equal to zero in this study), and L is the thicknessor width of the air cavity in the direction of heat flow. Theconvective heat transfer coefficient, hcv, is calculated from theNusselt number (Nu) from
(2)
where λair is the conductivity of air. For horizontal heat flow, the Nusselt number will depend
on the height-to-length aspect ratio (Lv/Lh), where Lv and Lhare the cavity dimensions in the vertical and horizontal direc-tions, respectively. In a cavity with a height-to-length aspectratio less than 0.5, the Nusselt number is found from (Rosen-how et al. 1985),
(3)
where Ra is the Rayleigh number and is defined as
(4)
where ρair is the density of air, g is the acceleration due togravity, β is the thermal expansion coefficient, and cp,air is thespecific heat capacity at constant pressure for air. λair is thethermal conductivity and µair is the dynamic viscosity of air.TH – TC is the temperature difference between the warm andthe cold walls of the rectangular cavity. For a cavity with aheight-to-length aspect ratio (Lv/Lh) larger than 5, the Nusseltnumber is found from (Wright 1996),
(5)
where
(6)
(7)
(8)
For cavities with Lv/Lh between 0.5 and 5, the Nusselt numberis found using a linear interpolation between the endpoints ofEquations 3 and 5.
λeff hcv hr+( ) L× ,=
hcv Nuλair
L--------- ,=
Nu 1 2.756 10 6– Ra2 LvLh------
⎝ ⎠⎜ ⎟⎛ ⎞ 8
×0.386–
0.623Ra1 5⁄ LhLv------
⎝ ⎠⎜ ⎟⎛ ⎞ 2 5⁄ 0.386–
+⎩ ⎭⎨ ⎬⎧ ⎫ 2.59–
,+=
Raρair
2 Lh3gβcp ,air TH TC–( )
µairλair------------------------------------------------------------- ,=
Nu max Nu1,Nu2,Nu3( ) ,=
Nu1 1 0.104Ra0.293
1 6310Ra
------------⎝ ⎠⎛ ⎞ 1.36
+----------------------------------------
⎝ ⎠⎜ ⎟⎜ ⎟⎜ ⎟⎛ ⎞ 3
+
⎩ ⎭⎪ ⎪⎨ ⎬⎪ ⎪⎧ ⎫1 3⁄
=
Nu2 0.242 RaLhLv-----⎝ ⎠
⎛ ⎞0.273
=
Nu3 0.0605Ra1 3⁄=

OR-05-4-3 5
For heat flow upward, the situation is unstable. TheNusselt number here is also dependent on the height-to-lengthaspect ratio Lv/Lh of the air cavity. For Lh/Lv less than or equalto 1, the convection is restricted by wall friction and theNusselt number is equal to 1. For 1 < Lh/Lv ≤ 5, the Nusseltnumber is calculated according to (Rosenhow et al. 1985):
(9)
where
(10)
(11)
(12)
(13)
For Lh/Lv larger than 5, the Nusselt number is (Hollands et al.1976)
(14)
The Rayleigh number (Ra) in Equations 9 and 14 can be calcu-lated from Equation 4 but with Lh replaced by Lv.
For heat flow downward, the Nusselt number is equal to1.0.
For jamb frame sections, frame cavities are oriented verti-cally, and therefore the height of the cavity is in the directionnormal to the plane of the cross section. For these cavities, itis assumed that heat flow is always in horizontal direction withLv/Lh > 5, and so correlations in Equations 6 to 8 shall be used.
The temperatures of the cavity walls, TH and TC, are notknown in advance, so it is necessary to estimate them. Fromprevious experience it is recommended to apply TH = 10°Cand TC = 0°C. However, after the simulation is done, it isnecessary to update these temperatures from the results of theprevious run. This procedure shall be repeated until values ofTH and TC from two consecutive runs are within 1°C. Also, itis important to inspect the direction of heat flow after theinitial run because if the direction of the bulk of heat flow isdifferent than initially specified, it will need to be corrected forthe next run.
According to ISO 15099 (ISO 2003), unventilated andirregular (not rectangular) frame cavities are converted intoequivalent rectangular cavities. The transformation isconducted so that the areas and aspect ratios of the originalirregular cavity and the new rectangular cavity are equal.
Further, if the shortest distance between two opposite surfacesis smaller than 5 mm, then the frame cavity is split at this throatregion. The following rules are used to determine whichsurfaces belong to vertical and horizontal surfaces of theequivalent rectangular cavity (0° is east [right], 90° is north[up], 180° is west [left], and 270° is south [bottom]):
• any surface whose normal is between 315° and 45° is aleft vertical surface;
• any surface whose normal is between 45° and 135° is abottom horizontal surface;
• any surface whose normal is between 135° and 225° is aright vertical surface;
• any surface whose normal is between 225° and 315° is atop horizontal surface.
Temperatures of equivalent vertical and horizontal surfacesare calculated as the mean of the surface temperatures accord-ing to the classification above. The direction of heat flow isdetermined from the temperature difference between verticaland horizontal surfaces of the equivalent rectangular cavity.The following rules are used:
• Heat flow is horizontal if the absolute value of the tem-perature difference between vertical cavity surfaces islarger than between horizontal cavity surfaces.
• Heat flow is vertical and upward if the absolute temper-ature difference between horizontal cavity surfaces islarger than between vertical cavity surfaces and the tem-perature difference between the top horizontal cavitysurface and bottom horizontal cavity surface is negative.
• Heat flow is vertical and downward if the absolute tem-perature difference between horizontal cavity surfaces islarger than between vertical cavity surfaces and the tem-perature difference between the top horizontal cavitysurface and bottom horizontal cavity surface is positive.
Illustrations and more information can be found in ISO 15099.
Boundary Conditions and Material PropertiesThe air properties used in the CFD simulations are calcu-
lated at mean temperature, (TH+TC)/2, and atmospheric pres-sure, P = 101325 Pa, and are shown in Table 4. The standardacceleration of gravity of 9.8 m/s2 was used in all calculations.Constant temperature boundary conditions are specified at allvertical walls and at the sloped wall of the C-cavity (see Figure1). All horizontal walls are adiabatic. The conductivity of thefin in the H-cavity is set to 0.25 W m-1 K-1.
RESULTS
Heat Transfer Rates for the H-cavityand the L-cavity—CFD Results
Heat fluxes for different gap openings, La, are plotted forthe H-cavity and L-cavity. For the H-cavity, the heat flux isfound from
Nu 1 1RacrRa
-----------–⎝ ⎠⎛ ⎞
•k1 2 k2( )1 k2ln–+[ ]+=
Ra5830------------⎝ ⎠
⎛ ⎞ 1 3⁄1–
•1 e
0.95–RacrRa
----------⎝ ⎠⎛ ⎞
1 3⁄1–⎝ ⎠
⎛ ⎞•
–+
k1 1.40=
k2 Ra1 3⁄
450.5--------------=
X( )• X X+2
----------------=
Racr e0.721
LvLh-----⎝ ⎠
⎛ ⎞ 7.46+=
Nu 1 1.44 1 1708Ra
------------–⎝ ⎠⎛ ⎞ • Ra
5830------------⎝ ⎠
⎛ ⎞ 1 3⁄1–
• .+ +=

6 OR-05-4-3
q = Q / Lv , (15)
where Q is the heat flow through the warm side of the cavityand Lv is the height of the cavity (equal to 30 mm for all H-cavities). For the L-cavity, the heat fluxes are calculatedaccording to:
(16)
(17)
(18)
where QTH and QTm are the heat flows through the parts of thecavity having temperatures TH and Tm, respectively, and Laand LTm are the lengths of the respective parts of the cavity.LTm is equal to the height of the cavity (Lv) minus La.
Figure 2 and Figure 3 show the heat flux from the CFDcalculations through the warm wall of the H-cavity as a func-
tion of gap opening, La, for temperature differences betweenthe warm and cold walls of 10°C and 25°C, respectively. Thevertical axis shows the heat flux in W/m2, and the horizontalaxis shows the gap opening in millimeters.
Figure 4 and Figure 5 show the heat fluxes from the CFDsimulation through the cavity walls with temperatures TH andTm and the total fluxes for the L-cavity as function of gap open-ing for temperature differences between the warm and coldsurfaces of 10°C and 25°C, respectively. The vertical axisshows the heat flux in W/m2, and the horizontal axis shows thegap opening, La, in millimeters.
Stream Contours
Insight into the airflow in frame cavities may also begained by looking at the stream contours for the different cavi-ties. Figure 6 displays stream contours for the H-cavity. Thediagrams in the left column display results for the cases inwhich the temperature difference between the warm and cold
Table 4. Air Properties Used in the CFD Simulations
(TH+TC)/2[°C]
λ[W m-1 K-1]
cp[J kg-1 K-1]
µ[kg m-1 s-1]
ρ[kg m-3]
β[K-1]
2.5 0.024253 1005.2 1.7357 × 10⁻⁵ 1.2807 3,6278 × 10⁻³
10 0.024817 1005.5 1.7724 × 10⁻⁵ 1.2467 3,5317 × 10⁻³
Figure 2 Graph of heat flux from the CFD simulationthrough warm side of the H-cavity as function ofgap opening, La. The temperature differencebetween warm and cold surfaces is 10°C.
qTotal QTH QTm+( ) Lv⁄=
qTH QTH L⁄ a=
qTm QTm LTm⁄=
Figure 3 Graph of heat flux from the CFD simulationthrough warm side of the H-cavity as function ofgap opening, La. The temperature differencebetween warm and cold walls is 25°C.

OR-05-4-3 7
walls is 10°C, and the right diagrams show results where thetemperature difference is 25°C. Each row includes results fordifferent gap openings, La (see the geometry to the left inFigure 1). The magnitude of the stream contours is set auto-matically by the CFD program, and the contour lines aredistributed at even intervals between the maximum and mini-mum values for each case.
Figure 7 displays stream contours for the various versionsof the L-cavity. The left column diagrams show results for thecases where the temperature difference between the warm andcold walls is 10°C, and the right diagrams show results wherethe temperature difference is 25°C. Each row includes resultsfor different gap openings, La.
Figure 8 shows the stream contours for the versions of theC-cavity. The left and right columns display results where thetemperature differences are 10°C and 25°C, respectively.Each row corresponds to a fixed cavity height, Lv. The variousdiagrams show that there is little circulation close to thecorners with sharp angles. By making tangents to the outerstream contour line for each cavity (close to the sharp corners),we find the measures 6.6, 6.3, 8.8, and 7.5 mm for the lengthsof the tangents (from left to right, line by line).
Comparison of CFD andISO 15099 Convection Correlations
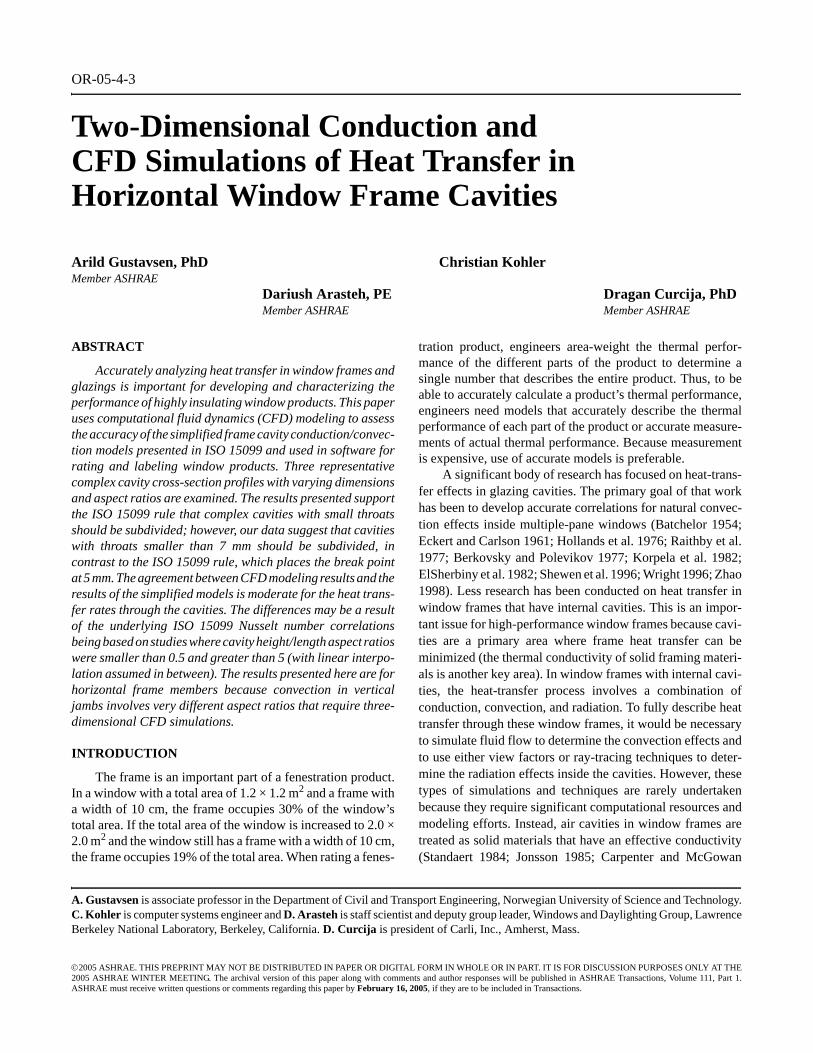
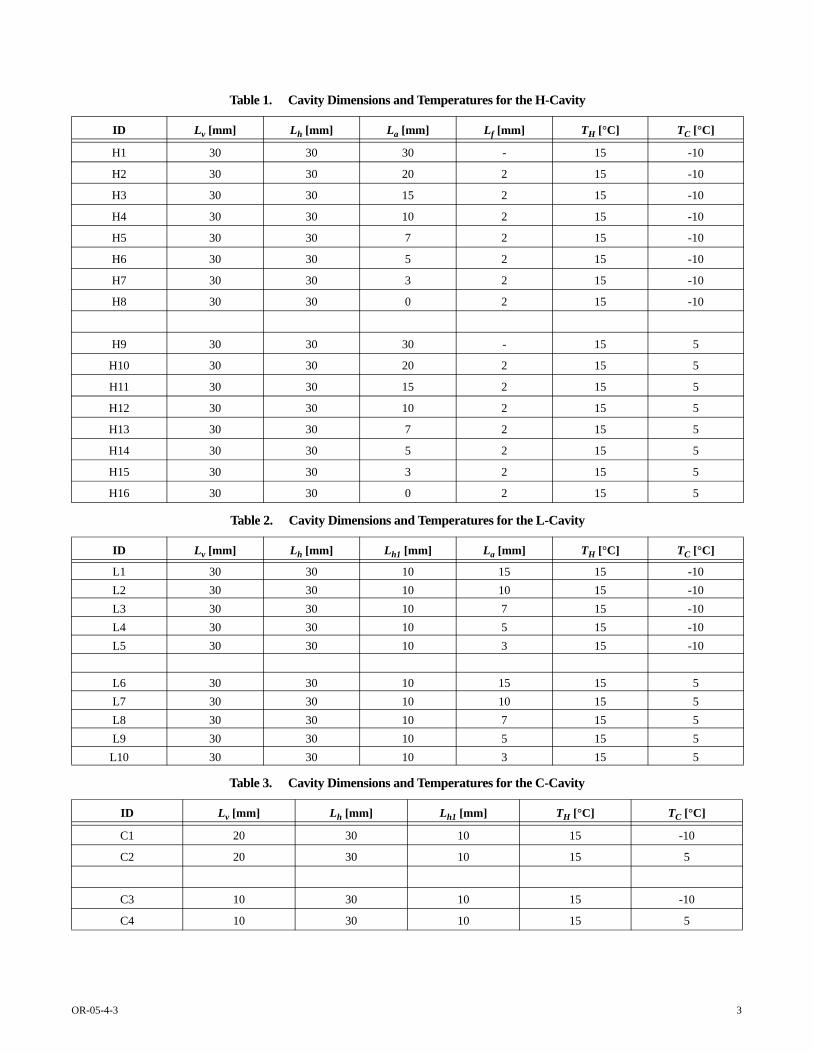
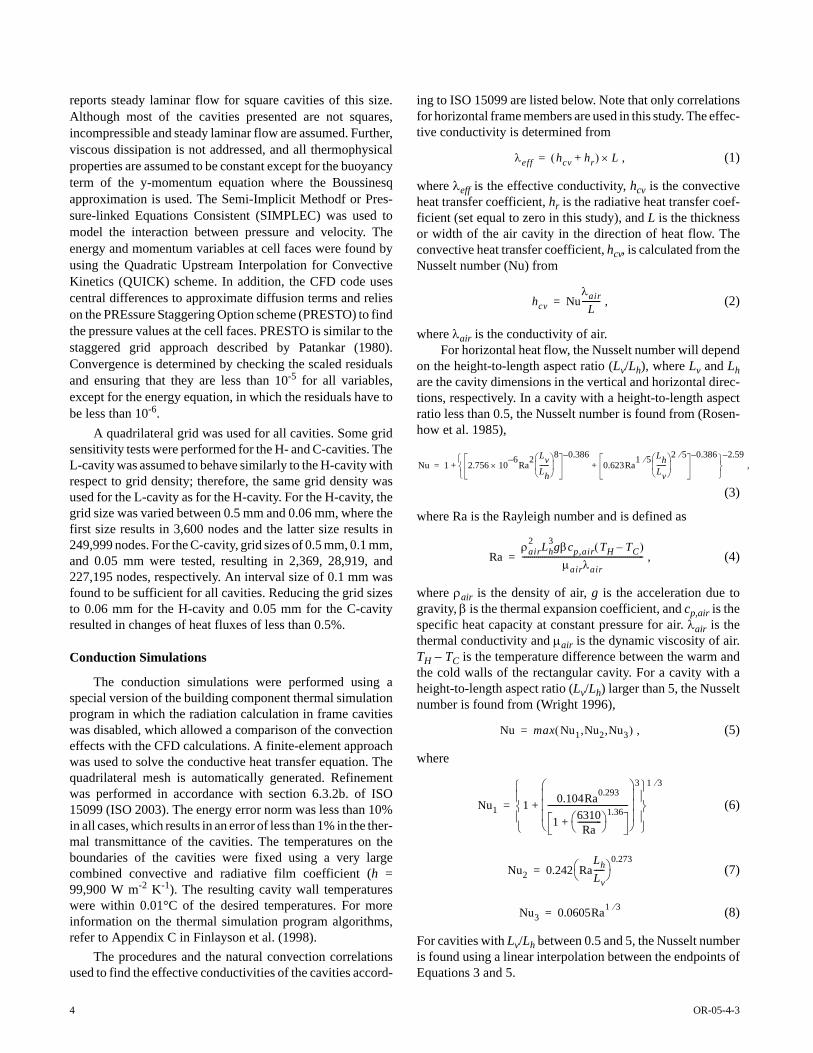
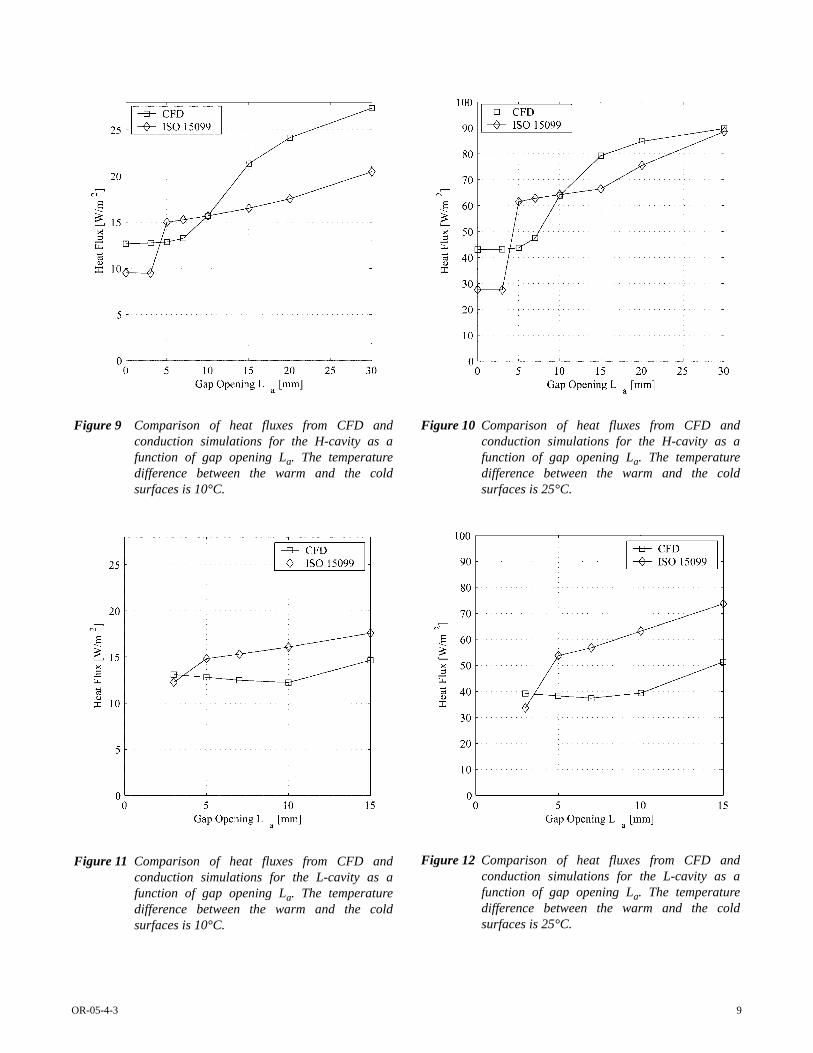
Although there are several correlations and proceduresfor finding effective conductivity, we focused on thosepresented in ISO 15099. To check the accuracy of these corre-lations and procedures, the CFD results are compared withconduction simulations based on ISO 15099. Results for theH-cavity are shown in Figures 9 and 10 for the cases where thetemperature differences between the warm and cold surfacesare 10°C and 25°C, respectively. Results for the L-cavity areshown in Figures 11 and 12 for the cases where the tempera-ture differences between the warm and cold surfaces are 10°Cand 25°C, respectively. The vertical axis shows the heat fluxin W/m2, and the horizontal axis shows the gap opening, La, inmillimeters. The graphs are labeled as follows:
• “CFD” signifies the results from the CFD simulation. • “ISO 15099” denotes the heat fluxes that were calcu-
lated in the building component thermal simulation pro-gram according to ISO 15099; for these examples, theair cavity was divided when the distance between twoopposite surfaces was smaller than 5 mm. Thus, for theH-cavity, the air cavity was divided when the intercon-nection formed by the fins was smaller than 5 mm,resulting in three separate air cavities. (If the distance
Figure 4 Graph of the heat fluxes from the CFD simulationthrough the cavity walls with temperatures THand Tm and the sum of the fluxes for the L-cavityas function of gap opening, La. The temperaturedifference between warm and cold surfaces is10°C.
Figure 5 Graph of the heat fluxes from the CFD simulationthrough the cavity walls with temperatures THand Tm and the sum of the same fluxes for the L-cavity as function of gap opening, La. Thetemperature difference between warm and coldsurfaces is 25°C.

8 OR-05-4-3
between the fins in the air cavity was equal to 5 mm ormore there was no division.)
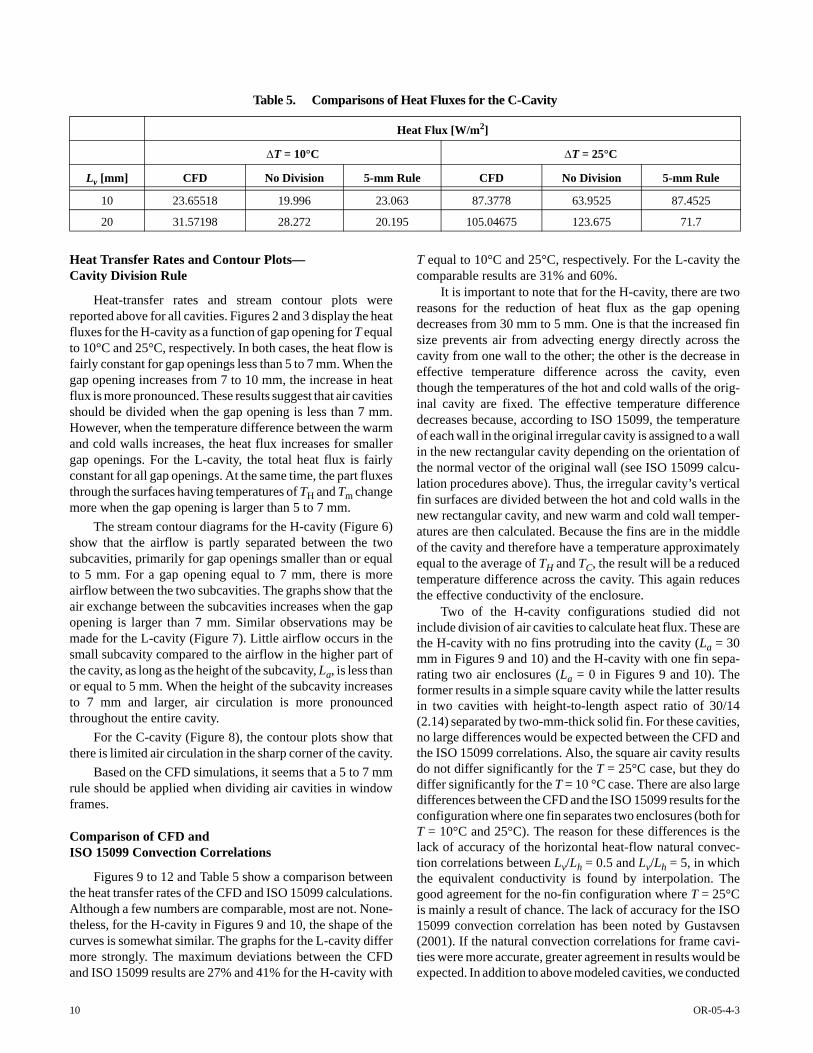
Table 5 shows heat fluxes for the C-cavity as a function oftemperature difference and air cavity height. The tableincludes, in addition to CFD results, results from conductionsimulations where an effective conductivity was used toaccount for convection. These were carried out both with a 5-mm vertical division of the air cavity in the sharp angle of thecavity (column labeled “5-mm Rule”) and no division of theair cavity (column labeled “No Division”). Results areincluded for temperature differences between the warm andcold walls equal to 10°C and 25°C.
DISCUSSION
As noted in the introduction to this paper, various rulesaddress the break point at which to divide air cavities inwindow frames. In this section, the results from the previoussection are analyzed in detail to determine the point at which
frame air cavities should be divided. A discussion of the agree-ment between the CFD results and the procedures in ISO15099 for calculating heat flow through air cavities of windowframes is also included.
Figure 6 Stream contours for the H-cavities. La is the sizeof the gap opening, and T is the differencebetween the hot and cold wall temperatures,reported in °C.
Figure 7 Stream contours for the L-cavities. La is the size ofthe gap opening, and T is the difference betweenthe hot and cold wall temperatures, reported in°C.
Figure 8 Stream contours for the C-cavities for differenttemperature differences, ∆T. Lv is the height of thecavity.
OR-05-4-3 9
Figure 9 Comparison of heat fluxes from CFD andconduction simulations for the H-cavity as afunction of gap opening La. The temperaturedifference between the warm and the coldsurfaces is 10°C.
Figure 11 Comparison of heat fluxes from CFD andconduction simulations for the L-cavity as afunction of gap opening La. The temperaturedifference between the warm and the coldsurfaces is 10°C.
Figure 10 Comparison of heat fluxes from CFD andconduction simulations for the H-cavity as afunction of gap opening La. The temperaturedifference between the warm and the coldsurfaces is 25°C.
Figure 12 Comparison of heat fluxes from CFD andconduction simulations for the L-cavity as afunction of gap opening La. The temperaturedifference between the warm and the coldsurfaces is 25°C.
10 OR-05-4-3
Heat Transfer Rates and Contour Plots—Cavity Division Rule
Heat-transfer rates and stream contour plots werereported above for all cavities. Figures 2 and 3 display the heatfluxes for the H-cavity as a function of gap opening for T equalto 10°C and 25°C, respectively. In both cases, the heat flow isfairly constant for gap openings less than 5 to 7 mm. When thegap opening increases from 7 to 10 mm, the increase in heatflux is more pronounced. These results suggest that air cavitiesshould be divided when the gap opening is less than 7 mm.However, when the temperature difference between the warmand cold walls increases, the heat flux increases for smallergap openings. For the L-cavity, the total heat flux is fairlyconstant for all gap openings. At the same time, the part fluxesthrough the surfaces having temperatures of TH and Tm changemore when the gap opening is larger than 5 to 7 mm.
The stream contour diagrams for the H-cavity (Figure 6)show that the airflow is partly separated between the twosubcavities, primarily for gap openings smaller than or equalto 5 mm. For a gap opening equal to 7 mm, there is moreairflow between the two subcavities. The graphs show that theair exchange between the subcavities increases when the gapopening is larger than 7 mm. Similar observations may bemade for the L-cavity (Figure 7). Little airflow occurs in thesmall subcavity compared to the airflow in the higher part ofthe cavity, as long as the height of the subcavity, La, is less thanor equal to 5 mm. When the height of the subcavity increasesto 7 mm and larger, air circulation is more pronouncedthroughout the entire cavity.
For the C-cavity (Figure 8), the contour plots show thatthere is limited air circulation in the sharp corner of the cavity.
Based on the CFD simulations, it seems that a 5 to 7 mmrule should be applied when dividing air cavities in windowframes.
Comparison of CFD andISO 15099 Convection Correlations
Figures 9 to 12 and Table 5 show a comparison betweenthe heat transfer rates of the CFD and ISO 15099 calculations.Although a few numbers are comparable, most are not. None-theless, for the H-cavity in Figures 9 and 10, the shape of thecurves is somewhat similar. The graphs for the L-cavity differmore strongly. The maximum deviations between the CFDand ISO 15099 results are 27% and 41% for the H-cavity with
T equal to 10°C and 25°C, respectively. For the L-cavity thecomparable results are 31% and 60%.
It is important to note that for the H-cavity, there are tworeasons for the reduction of heat flux as the gap openingdecreases from 30 mm to 5 mm. One is that the increased finsize prevents air from advecting energy directly across thecavity from one wall to the other; the other is the decrease ineffective temperature difference across the cavity, eventhough the temperatures of the hot and cold walls of the orig-inal cavity are fixed. The effective temperature differencedecreases because, according to ISO 15099, the temperatureof each wall in the original irregular cavity is assigned to a wallin the new rectangular cavity depending on the orientation ofthe normal vector of the original wall (see ISO 15099 calcu-lation procedures above). Thus, the irregular cavity’s verticalfin surfaces are divided between the hot and cold walls in thenew rectangular cavity, and new warm and cold wall temper-atures are then calculated. Because the fins are in the middleof the cavity and therefore have a temperature approximatelyequal to the average of TH and TC, the result will be a reducedtemperature difference across the cavity. This again reducesthe effective conductivity of the enclosure.
Two of the H-cavity configurations studied did notinclude division of air cavities to calculate heat flux. These arethe H-cavity with no fins protruding into the cavity (La = 30mm in Figures 9 and 10) and the H-cavity with one fin sepa-rating two air enclosures (La = 0 in Figures 9 and 10). Theformer results in a simple square cavity while the latter resultsin two cavities with height-to-length aspect ratio of 30/14(2.14) separated by two-mm-thick solid fin. For these cavities,no large differences would be expected between the CFD andthe ISO 15099 correlations. Also, the square air cavity resultsdo not differ significantly for the T = 25°C case, but they dodiffer significantly for the T = 10 °C case. There are also largedifferences between the CFD and the ISO 15099 results for theconfiguration where one fin separates two enclosures (both forT = 10°C and 25°C). The reason for these differences is thelack of accuracy of the horizontal heat-flow natural convec-tion correlations between Lv/Lh = 0.5 and Lv/Lh = 5, in whichthe equivalent conductivity is found by interpolation. Thegood agreement for the no-fin configuration where T = 25°Cis mainly a result of chance. The lack of accuracy for the ISO15099 convection correlation has been noted by Gustavsen(2001). If the natural convection correlations for frame cavi-ties were more accurate, greater agreement in results would beexpected. In addition to above modeled cavities, we conducted
Table 5. Comparisons of Heat Fluxes for the C-Cavity
Heat Flux [W/m2]
∆T = 10°C ∆T = 25°C
Lv [mm] CFD No Division 5-mm Rule CFD No Division 5-mm Rule
10 23.65518 19.996 23.063 87.3778 63.9525 87.4525
20 31.57198 28.272 20.195 105.04675 123.675 71.7

OR-05-4-3 11
an extra study to evaluate the accuracy of the convectioncorrelation in ISO 15099. A cavity 30 mm high and 14 mmwide containing only air were used. This cavity has the samedimensions as the two air cavities in the 30 by 30 mm cavitywith a two-mm-wide fin in the middle. Temperatures of –10°Cand 2.5°C were used. The CFD and ISO 15099 simulationsresulted in 41.36 and 27.94 W/m2, respectively. These figuresequal Nusselt numbers of 1.95 from the CFD simulation and1.32 from the ISO 15099 calculations.
The fluxes for the C-cavity are shown in Table 5. For thecavities that have heights (Lv) of 10 mm, the heat flux for thedivided cavity is greater than for the undivided cavity. Thisseems unexpected because dividing frame cavities usuallyreduces convection, so a division would be assumed toproduce a smaller heat flux. However, the increased heat fluxafter division of the air enclosure in this case may be explainedby the change in height-to-length aspect ratio of the cavitiesfrom before the division of cavity to after. For the originalcavity, the height-to-length aspect ratio is smaller (Lv/Lh =0.33) than for the largest cavity in the divided case (Lv/Lh =0.5). For smaller aspect ratios (for cavities with Lv/Lh less than1), natural convection is suppressed, so lower fluxes are foundfor the undivided cases. For these cases (Lv = 10 mm), goodagreement is also found between CFD and divided cavityresults (the ISO 15099 convection correlations for Lv/Lh < 0.5are assumed to be correct because they are based on analyticalconsiderations). For the C-cavities with a height of 20 mm,dividing the cavity reduces the heat flux, but this does notbring the results closer to the CFD results. Here all cavitieshave aspect ratios within the interpolation range of the ISO15099 correlation.
The influence of this difference for horizontal framecavity convective heat transfer (ranging from 27% to 60% asshown in Figures 9, 10, 11, and 12) on the total (horizontal andvertical) frame U-factor and on the overall window U-factorwill vary depending on the frame/window construction andoverall window size. A change in the horizontal frame cavityconvective heat transfer of a given percentage will result atmost in a same percentage change (see Equation 1) in the hori-zontal frame cavity effective conductivity. The maximumpercent change would occur when the cavity radiation effectscan be neglected, such as those for low-emittance (i.e., reflec-tive) frame cavity surfaces. Since almost all frame cavitysurfaces have much higher emittances, the cavity frame radi-ant heat transfer is of the same order as the frame cavityconvective heat transfer. Thus, the percent change in the cavityeffective conductivity will be less than the percent change inthe cavity convective heat transfer. A simple investigation wasperformed to estimate the effect that the lack of accuracy inhorizontal frame cavity convective heat transfer may have onthe total frame and overall window U-factor. This investiga-tion was performed for a vinyl frame with steel reinforcementand an aluminum frame that were used in 1.2 m by 1.2 mwindows. The glazing and spacer (edge-of-glass characteris-tics) configuration was assumed to be constant. An improve-ment in the accuracy of the horizontal frame cavity convection
correlation of 50% may lead to a change in the effectiveconductivity of the horizontal frame cavities of 25%. Thisresult is valid if the radiation and convection effects are of thesame magnitude and if the radiation effects are unchanged. Forthe particular frames studied, assuming that the horizontalframe lengths were the same as the vertical frame lengths, thechange of the total frame U-factors was 7.4% and 5% for thevinyl and aluminum frames, respectively. In the calculations,the horizontal air cavities were replaced by solid material withthe 25% change from the ISO 15099 predicted value and thevertical air cavities used the current ISO 15099 predictedvalues. This results in a change of the overall window U-factors of 2.4% for the vinyl-framed window and 1.8% for thealuminum-framed window. Using the ISO 15099 procedure,the overall U-factor for the vinyl window was calculated to be1.4 W/m2K. For the aluminum-framed window, the overall U-factor was calculated to be 1.7 W/m2K.
CONCLUSIONS
Based on our results and discussion, the authors concludethat irregularly shaped frame cavities should be divided atpoints where their dimensions are in the range of 5 to 10 mm;analyzing the heat transfer plots suggests that 7 mm is anappropriate break point. This rule should apply to anyconstrictions in cavity volume, even in triangular cavities. Theheat flux results from CFD and conduction simulations basedon ISO 15099 show good agreement in the case of certaincavity configurations. For other aspect ratios, the differencebetween the two calculation methods is quite significant evenfor simple rectangular cavities. This difference is a result ofthe limitation in the linear interpolation that is used in ISO15099 for frame cavities with an aspect ratio between 0.5 and5.
The effects of the changes in the horizontal frame cavityheat transfer on the overall U-factors for the windows aresmall (1.8% to 2.4%) enough to show that the current windowhorizontal frame cavity calculation procedures in ISO 15099are sufficiently accurate for different cavity shapes and orien-tations for obtaining accurate overall window U-factors. If theuncertainty of the overall U-factor—using window hot boxmethods as in ASTM Standard C1199 and ISO Standard12567 (ASTM 2000; ISO 2000)—attains levels of 2% to 3%from the current best values of 5% to 6% (Yuan 2002), theinclusion of improved horizontal and vertical frame cavityheat transfer correlations in ISO 15099 might be warranted.Also, if rating and comparison of individual window framesare wanted, the current results suggest that the horizontalframe cavity heat transfer procedures should be improved.
ACKNOWLEDGMENTS
This work was supported by Hydro Aluminum and theAssistant Secretary for Energy Efficiency and RenewableEnergy, Office of Building Technology, State and CommunityPrograms, Office of Building Systems of the U.S. Departmentof Energy under Contract No. DE-AC03-76SF00098. We
12 OR-05-4-3
would like to thank Nan Wishner, Lawrence BerkeleyNational Laboratory, for editorial assistance.
REFERENCESASHRAE. 1996. Draft BSR/ASHRAE Standard 142P, Stan-
dard method for determining and expressing the heattransfer and total optical properties of fenestration prod-ucts. Atlanta: American Society of Heating, Refrigerat-ing and Air-conditioning Engineers, Inc.
ASTM. 2000. C1199-00, Standard Test Method for Measur-ing the Steady-State Thermal Transmittance of Fenes-tration Systems Using Hot Box Methods. WestConshohocken, PA: ASTM International.
Batchelor, G.K. 1954. Heat transfer by free convectionacross a closed cavity between vertical boundaries atdifferent temperatures. Quarterly Applied Mathematics12:209-233.
Berkovsky, B.M., and V.K. Polevikov. 1977. Numericalstudy of problems on high-intensive free convection. InHeat Transfer and Turbulent Buoyant Convection (D.B.Spalding and N. Afgan, eds.), Vol. II, pp. 443-455.Washington: Hemisphere Publishing Corporation.
Carpenter, S.C., and A.G. McGowan. 1989. Frame andspacer effects on window U-value. ASHRAE Transac-tions 95(2):604-608.
CEN. 2003. EN ISO 10077-2:2003, Thermal performance ofwindows, doors and shutters—Calculation of thermaltransmittance, Part 2: Numerical method for frames.Brussels: European Committee for Standardization.
Eckert, E.R.G., and W.O. Carlson. 1961. Natural convectionin an air layer enclosed between two vertical plates withdifferent temperatures. International Journal of Heatand Mass Transfer 2:106-120.
ElSherbiny, S.M., G.D. Raithby, and K.G.T. Hollands. 1982.Heat transfer by natural convection across vertical andinclined air layers. Journal of Heat Transfer. Transac-tions of the ASME 104:96-102.
Finlayson, E., R. Mitchell, D. Arasteh, C. Huizenga, and D.Curcija. 1998. THERM 2.0: Program description. A PCprogram for analyzing the two-dimensional heat trans-fer through building products. Berkeley: University ofCalifornia. (Version 5.2.04 of the code was used in thenumerical simulations.)
Fluent 1998. FLUENT 5 User's Guide. Lebanon, NewHampshire: Fluent Incorporated.
Gustavsen, A. 2001. Heat transfer in window frames withinternal cavities. Ph.D. dissertation, Department ofBuilding and Construction Engineering, NorwegianUniversity of Science and Technology, Trondheim, Nor-way.
Hallé, S., M.A. Bernier, A. Patenaude, and R. Jutras. 1998.The combined effect of air leakage and conductive heattransfer in window frames and its impact on the Cana-dian energy rating procedure. ASHRAE Transactions104(1):176-184.
Hollands, K.G.T., T.E. Unny, G.D. Raithby, and L. Konicek.1976. Free convective heat transfer across inclined air
layers. Journal of Heat Transfer. Transactions of theASME 98:189-193.
ISO. 2000. ISO 12567-1:2000, Thermal performance of win-dows and doors. Determination of thermal transmit-tance by hot box method. Part 1: Complete windows anddoors. Geneva: International Organization for Standard-ization.
ISO. 2003. ISO 15099:2003(E), Thermal performance ofwindows, doors and shading devices—Detailed calcula-tions. Geneva: International Organization for Standard-ization.
Jonsson, B. 1985. Heat transfer through windows. Duringthe hours of darkness with the effect of infiltrationignored. Document D13:1985. Stockholm: SwedishCouncil for Building Research.
Jonsson, B. 1998. Intercalibration of thermal transmittancemeasurements of windows by hot box method. Borås,Sweden: SP Swedish National Testing and ResearchInstitute.
Korpela, S.A., Y. Lee, and J.E. Drummond 1982. Heat trans-fer through a double pane window. Journal of HeatTransfer. Transactions of the ASME 104:539-544.
Mitchell, R., C. Kohler, D. Arasteh, C. Huizenga, J. Car-mody, and D. Curcija. 2003. THERM 5/WINDOW 5NFRC simulation manual. Berkeley: Lawrence Berke-ley National Laboratory.
Ostrach, S. 1988. Natural convection in enclosures. Journalof Heat Transfer. Transactions of the ASME 110:1175-1190.
Patankar, S.V. 1980. Numerical Heat Transfer and FluidFlow. Washington: Hemisphere.
Raithby, G.D., K.G.T. Hollands, and T.E. Unny. 1977. Analy-sis of heat transfer by natural convection across verticalfluid layers. Journal of Heat Transfer. Transactions ofthe ASME 99:287-293.
Rosenhow, W.M., J.P. Hartnett, and E.N Ganic. 1985. Hand-book of Heat Transfer Fundamentals, 2d ed. McGrawHill.
Shewen, E., K.G.T. Hollands, and G.D. Raithby. 1996. Heattransfer by natural convection across a vertical air cavityof large aspect ratio. Journal of Heat Transfer. Transac-tions of the ASME 118:993-995.
Standaert, P. 1984. Thermal evaluation of window frames bythe finite difference method. In Proceedings, Windowsin Building Design and Maintenance. Stockholm:Swedish Council for Building Research.
Wright, J. 1996. A correlation to quantify convective heattransfer between vertical window glazings. ASHRAETransactions 102(1):940-946.
Yuan, S., G. A. Russell, and W. P.Goss. 2002. Uncertaintyanalysis of a calibrated hot box. In ASTM STP 1426,Insulation Materials: Testing and Applications, Vol. 4(A. P. Desjarlais and R. R. Zarr, eds.). West Consho-hocken, PA: ASTM International.
Zhao, Y. 1998. Investigation of heat transfer performance infenestration system based on finite element methods.Ph.D. dissertation, Department of Mechanical and

OR-05-4-3 13
Industrial Engineering, University of Massachusetts,Amherst.