OptORF: Optimal metabolic and regulatory perturbations for
19
Kim and Reed BMC Systems Biology 2010, 4:53 http://www.biomedcentral.com/1752-0509/4/53 Open Access RESEARCH ARTICLE BioMed Central © 2010 Kim and Reed; licensee BioMed Central Ltd. This is an Open Access article distributed under the terms of the Creative Commons Attribution License (http://creativecommons.org/licenses/by/2.0), which permits unrestricted use, distribution, and reproduction in any medium, provided the original work is properly cited. Research article OptORF: Optimal metabolic and regulatory perturbations for metabolic engineering of microbial strains Joonhoon Kim 1,2 and Jennifer L Reed* 1,2 Abstract Background: Computational modeling and analysis of metabolic networks has been successful in metabolic engineering of microbial strains for valuable biochemical production. Limitations of currently available computational methods for metabolic engineering are that they are often based on reaction deletions rather than gene deletions and do not consider the regulatory networks that control metabolism. Due to the presence of multi-functional enzymes and isozymes, computational designs based on reaction deletions can sometimes result in strategies that are genetically complicated or infeasible. Additionally, strains might not be able to grow initially due to regulatory restrictions. To overcome these limitations, we have developed a new approach (OptORF) for identifying metabolic engineering strategies based on gene deletion and overexpression. Results: Here we propose an effective method to systematically integrate transcriptional regulatory networks and metabolic networks. This allows for the formulation of linear optimization problems that search for metabolic and/or regulatory perturbations that couple biomass and biochemical production, thus proposing adaptive evolutionary strain designs. Using genome-scale models of Escherichia coli, we have implemented the OptORF algorithm (which considers gene deletions and transcriptional regulation) and compared its metabolic engineering strategies for ethanol production to those found using OptKnock (which considers reaction deletions). Our results found that the reaction-based strategies often require more gene deletions to remove the identified reactions (2 more genes than reactions), and result in lethal growth phenotypes when transcriptional regulation is considered (162 out of 200 cases). Finally, we present metabolic engineering strategies for producing ethanol and higher alcohols (e.g. isobutanol) in E. coli using our OptORF approach. We have found common genetic modifications such as deletion of pgi and overexpression of edd, as well as chemical specific strategies for producing different alcohols. Conclusions: By taking regulatory effects into account, OptORF can propose changes such as the overexpression of metabolic genes or deletion of transcriptional factors, in addition to the deletion of metabolic genes, that may lead to faster evolutionary trajectories. While biofuel production in E. coli is evaluated here, the developed OptORF approach is general and can be applied to optimize the production of different compounds in other biological systems. Background Metabolic engineering has emerged as an important field aimed to improve cellular production of valuable bio- chemicals and biofuels. Conventional approaches in met- abolic engineering for identifying targets for manipulation focus on metabolic branch points, where undesired reactions are eliminated from competing branches to enhance flux through desired reactions using genetic modifications. However, these metabolic network modifications will not only affect fluxes through local metabolic pathways, but also have system-level effects on metabolic behavior due to changes in carbon, energy, and electron flow. Correspondingly, such conventional approaches may fail to identify modifications in distant pathways that can potentially improve cellular produc- tion. Computational models of metabolism have been suc- cessful in predicting the consequences of gene deletions * Correspondence: [email protected] 1 Department of Chemical and Biological Engineering, University of Wisconsin- Madison, Madison, WI 53706, USA Full list of author information is available at the end of the article
Transcript of OptORF: Optimal metabolic and regulatory perturbations for
Kim and Reed BMC Systems Biology 2010, 4:53http://www.biomedcentral.com/1752-0509/4/53
Open AccessR E S E A R C H A R T I C L E
Research articleOptORF: Optimal metabolic and regulatory perturbations for metabolic engineering of microbial strainsJoonhoon Kim1,2 and Jennifer L Reed*1,2
AbstractBackground: Computational modeling and analysis of metabolic networks has been successful in metabolic engineering of microbial strains for valuable biochemical production. Limitations of currently available computational methods for metabolic engineering are that they are often based on reaction deletions rather than gene deletions and do not consider the regulatory networks that control metabolism. Due to the presence of multi-functional enzymes and isozymes, computational designs based on reaction deletions can sometimes result in strategies that are genetically complicated or infeasible. Additionally, strains might not be able to grow initially due to regulatory restrictions. To overcome these limitations, we have developed a new approach (OptORF) for identifying metabolic engineering strategies based on gene deletion and overexpression.
Results: Here we propose an effective method to systematically integrate transcriptional regulatory networks and metabolic networks. This allows for the formulation of linear optimization problems that search for metabolic and/or regulatory perturbations that couple biomass and biochemical production, thus proposing adaptive evolutionary strain designs. Using genome-scale models of Escherichia coli, we have implemented the OptORF algorithm (which considers gene deletions and transcriptional regulation) and compared its metabolic engineering strategies for ethanol production to those found using OptKnock (which considers reaction deletions). Our results found that the reaction-based strategies often require more gene deletions to remove the identified reactions (2 more genes than reactions), and result in lethal growth phenotypes when transcriptional regulation is considered (162 out of 200 cases). Finally, we present metabolic engineering strategies for producing ethanol and higher alcohols (e.g. isobutanol) in E. coli using our OptORF approach. We have found common genetic modifications such as deletion of pgi and overexpression of edd, as well as chemical specific strategies for producing different alcohols.
Conclusions: By taking regulatory effects into account, OptORF can propose changes such as the overexpression of metabolic genes or deletion of transcriptional factors, in addition to the deletion of metabolic genes, that may lead to faster evolutionary trajectories. While biofuel production in E. coli is evaluated here, the developed OptORF approach is general and can be applied to optimize the production of different compounds in other biological systems.
BackgroundMetabolic engineering has emerged as an important fieldaimed to improve cellular production of valuable bio-chemicals and biofuels. Conventional approaches in met-abolic engineering for identifying targets formanipulation focus on metabolic branch points, whereundesired reactions are eliminated from competing
branches to enhance flux through desired reactions usinggenetic modifications. However, these metabolic networkmodifications will not only affect fluxes through localmetabolic pathways, but also have system-level effects onmetabolic behavior due to changes in carbon, energy, andelectron flow. Correspondingly, such conventionalapproaches may fail to identify modifications in distantpathways that can potentially improve cellular produc-tion.
Computational models of metabolism have been suc-cessful in predicting the consequences of gene deletions
* Correspondence: [email protected] Department of Chemical and Biological Engineering, University of Wisconsin-Madison, Madison, WI 53706, USAFull list of author information is available at the end of the article
BioMed Central© 2010 Kim and Reed; licensee BioMed Central Ltd. This is an Open Access article distributed under the terms of the Creative CommonsAttribution License (http://creativecommons.org/licenses/by/2.0), which permits unrestricted use, distribution, and reproduction inany medium, provided the original work is properly cited.
Kim and Reed BMC Systems Biology 2010, 4:53http://www.biomedcentral.com/1752-0509/4/53
Page 2 of 19
at a systems level [1-4]. In Escherichia coli, genome-scalemodels of metabolic networks have been used to identifymetabolic engineering strategies such as gene deletionsor additions to maximize production of primary or sec-ondary metabolites [5-7]. Some computational methods,such as OptKnock [8], identify knockout strains thatwould have improved biochemical production capabili-ties after undergoing adaptive evolution. Knockoutmutants that force the coupling between biomass andbiochemical production allow one to use growth rate as aselective pressure and find adaptively evolved strains withimproved growth rates and production capabilities. Suchmethods have been used to generate lactate and succinateproducing strains [9,10]. A number of variations on Opt-Knock have appeared recently which use alternativesearch algorthims, add non-native pathways, and con-sider deviations from wildtype flux levels [5,11,12].
Computational strain design methods evaluate theeffects of gene or reaction deletions to search for themutants with improved production capabilities. A genedeletion is simulated by removing the reactions associ-ated with the target gene from the metabolic networks;however, most current methods are often based on reac-tion deletions, and not gene deletions. However, genesand reactions do not always have a one-to-one relation-ship due to the presence of multi-functional enzymes,enzyme subunits, orphan reactions, and isozymes. Thus,knockout mutants based on reaction deletions can some-times be genetically impossible or difficult to construct.Also, existing methods do not take into consideration thetranscriptional regulatory networks that control metabo-lism. As a result, predicted strains with high productioncapabilities may not be able to grow initially or evolve tothe desired final state due to regulatory restrictions.
In this study, we present a new optimization approach,OptORF, to identify metabolic engineering strategiesbased on a minimal number of metabolic and transcrip-tion factor gene deletions and metabolic gene overexpres-sion, which couple biomass and biochemical production.Here, gene to protein to reaction (GPR) associations aremodeled directly using a Boolean approach and reactionsare removed when the associated genes are deleted. Inter-actions between the regulatory and metabolic networksare also modeled using Boolean approaches by turning onor off metabolic gene expression in response to transcrip-tional factor (TF) status. These Boolean relationships canbe effectively formulated as linear constraints usingbinary variables and matrices, which are more systematicand/or computationally efficient than previously sug-gested formulations for modeling GPR associations andintegrating metabolic and regulatory models [13-17].
The integrated model of metabolism and regulation canpredict the steady-state metabolic flux distributions andregulatory states simultaneously. Consequently, the
OptORF framework allows for the identification of opti-mal metabolic gene knockouts as well as transcriptionfactor knockouts. In addition, overexpression of genesthat are unexpressed under a given condition can befound in order to improve the production of a target bio-chemical. Using genome-scale metabolic and regulatorymodels of E. coli [18,19], we have identified metabolicengineering strategies for ethanol production using Opt-Knock (which considers reaction deletions) and com-pared these strategies to those found using our newapproach OptORF (which considers gene deletions) withand without transcriptional regulatory constraints. Ouranalysis showed that the strategies based on reactiondeletions often require a larger number of gene deletions,and also many of them result in lethal growth phenotypeswhen transcriptional regulation is considered. In addi-tion, we have identified metabolic engineering strategiesfor overproduction of higher alcohols such as isobutanolvia non-fermentative pathways based on a recent study[20]. While ethanol and higher alcohol production in E.coli is evaluated here, the OptORF approach can be easilyapplied to other biochemicals and microorganisms.
MethodsOptORF is a bi-level optimization problem which identi-fies the optimal metabolic and regulatory gene deletionsas well as gene overexpressions that maximize biochemi-cal production at the maximum cellular growth undertranscriptional regulatory constraints (Table 1). Theinner problem of OptORF, which is a linear programming(LP) problem, maximizes growth under the given genedeletions and regulatory states that are determined by theconstraints of the outer problem. OptORF is formulatedas a single level mixed integer linear program (MILP) byreplacing the inner maximization problem with its opti-mality conditions as constraints. GPR associations andtranscriptional regulatory constraints are systematicallyformulated using three dimensional arrays, which differfrom recently reported approaches [13,15,17].
An example of an integrated metabolic and transcrip-tional regulatory network is shown in Figure 1. In thisnetwork, a substrate (S) can be utilized to produce bio-mass (B) via either intermediate metabolite I1 and/or I2.Reaction R2 converts I1 into by-product P1 and 0.08 B,whereas reaction R5 converts I2 into by-product P2 and0.12 B. Reaction R1 is carried out by enzyme E1 whichconsists of two subunits encoded by gene G1A and G1B.Reaction R5 can be carried out by either enzyme E5 orE6, which are encoded by genes G5 and G6 respectively.Transcription factor TF1 is active when S is present, andactivates expression of G3 and G5, and represses G1Aexpression (all other genes are considered to be expressedunder all conditions in the model).

Kim and Reed BMC Systems Biology 2010, 4:53http://www.biomedcentral.com/1752-0509/4/53
Page 3 of 19
Since the cellular objective is maximizing biomass pro-duction (B) from substrate (S), pathways involving R5(producing P2) would be normally preferred to onesinvolving R2 (producing P1). Given an engineering objec-tive of producting P1, close inspection of the reactionnetwork indicates that removal of reactions R3 and R4 orreaction R5 would couple maximum biomass productionto production of P1 instead of P2. OptORF will identifygenetic modification strategies involving gene deletionsthat are associated with these reactions (G3 and G4, orG5 and G6, respectively). However, G1A expression isinhibited by TF1, and TF1 is active in the presence of S,and thus reaction R1 cannot happen. Therefore, OptORFwill also identify the overexpression of G1A along withthe gene deletions mentioned above. An alternate strat-egy to the overexpression of G1A would be the deletion ofTF1 which inhibits expression of G1A. In fact, when TF1is deleted, the genes activated by TF1 (G3 and G5) wouldbe no longer expressed, which reduces the number ofgenes that are needed to be deleted. Therefore, OptORFwill first identify double knockout strategies including theTF1 deletion, and then find the alternate strategies withthe G1A overexpression (these strategies are shown inFigure 1, see Additional file 1 for the implementation).
GPR associationConstraints for GPR associations are systematically for-mulated using a three dimensional array (GPR(j, n, g)) andbinary variables for reaction (dj), enzyme (bn), and gene(yg) status, where j, n, and g specify a reaction, enzyme,and gene, respectively. Each reaction with a known GPRassociation (j JGPR) can be carried out by the associatedenzyme complex(es) (n N(j)), and each enzyme complexis associated to gene products (g G(n)), where JGPR, N(j),G(n) are defined as the following:
If any of the enzymes for reaction j are present (any bn(j)= 1), the reaction can have a non-zero flux (dj = 1) wheredj indicates whether a reaction can or cannot occur. If allthe enzymes are not present (all bn(j) = 0), then the reac-tion cannot occur (dj = 0). This reaction-enzyme logicalrelationship can be formulated as the following:
If all of the associated genes for enzyme n are expressed(all yg(n) = 1), then the enzyme is present (bn = 1). If any ofthe subunits are not expressed (any yg(n) = 0), then theenzyme is not present (bn = 0). This enzyme-gene logicalrelationship can be formulated as the following:
Reactions without known GPR associations are notconstrained by these GPR rules.
Transcriptional regulationTranscriptional regulation of metabolic genes are alsoformulated as linear constraints using a three dimen-sional array (TR(g, m, r)) and binary variables for geneexpression/transcription factor (TF) activity (yg), condi-
J j J n g GPR j n g jGPR = ={ ( , ) ( , , ) 1∈ ∃| s.t. ; reaction has known GPR asssociations
s.t. enzyme is a
}
( ) { ( , , ) 1N j n N g GPR j n g for j n= =∈ ∃| ; sssociated with reaction
s.t.
j
G n g G j GPR j n g for
}
( ) { ( , , ) 1= =∈ ∃| nn g n; gene is associated with enzyme }
d b j J n N jj n GPR≥ ∀ ∈ ∈, ( ) (1)
d b j Jj
n N j
n GPR≤ ∀ ∈∈∑
( )(2)
( 1) ( 1)( )
b y n Nn
g G n
g− ≥ − ∀ ∈∈∑ (3)
b y n N g G nn g≤ ∀ ∈ ∈, ( ) (4)
Table 1: OptORF formulation
maximize biochemical production
subject to
maximize cellular growth
subject to steady-state mass balance
enzyme capacity
thermodynamics
reaction deletions
GPR associations
transcriptional regulations
gene deletions and overexpressions
limited number of gene deletions
limited number of gene overexpressions

Kim and Reed BMC Systems Biology 2010, 4:53http://www.biomedcentral.com/1752-0509/4/53
Page 4 of 19
tion (am), and effector status (xr), where m specifies acondition for gene expression/TF activity and r affectsthese conditions (m). Effectors (r) can be TFs, flux values,and environmental conditions. The sets that are used inthe formulation are defined as follows:
Each metabolic gene, g GMET, is transcribed if the con-ditions for its expression, m(g), are satisfied. If any of theconditions for gene g expression is satisfied (any am(g) = 1),
the corresponding gene is expressed (yg = 1). If none ofthe conditions for expression are satisfied (all am(g) = 0),then the gene is not expressed (yg = 0). Similarly, eachtranscription factor, g GTF, is active (yg = 1) if any of theconditions for its activity is satisfied. If none of the condi-tions for activity are satisfied, then the transcription fac-tor is inactive (yg = 0). Then, the binary variables for TFactivity (yg) are used to constrain the binary variables forTF effectors (xg) which determine the conditions for met-abolic gene expressions or other TF activities.
G g G gMET = { ∈ | is a metabolic gene with known transcriptional regulatiion
is a transcription factor gene
s.t.
}
{ }
( ) {
G g G g
M g m M rTF =
=∈
∈ ∃|
| TTR g m r for g m g
R m r R gAct
( , , ) 1 ; }
( ) {
=
=
is a condition for gene
s.t.∈ ∃| TTR g m r for m r m
R m r RRep
( , , ) 1 ; }
( ) {
=
=
is an activator for condition
∈ | ∃∃ −g TR g m r for m r ms.t. is a repressor for condition( , , ) 1 ; }=
y a g G G m M gg m MET TF≥ ∀ ∈ ∪ ∈, ( ) (5)
Figure 1 Application of OptORF to an example metabolic and regulatory network. (A) In this example network, substrate S is utilized to produce biomass B and by-products P1 or P2. Here, the engineering objective is the production of P1 and the cellular objective is the production of B. Since reaction R5 produces more B than reaction R2, P2 is the preferred by-product and P1 production is uncoupled to biomass production (no P1 is pro-duced when biomass is maximized). (B) Reactions in the network and their GPR associations. (C) Transcriptional regulation of the metabolic genes and transcription factor in the network. (D) Metabolic engineering strategies for the production of P1 identified by OptORF, where P1 is now produced when biomass production is maximized in the altered networks. (E) A schematic view of the OptORF solutions. The metabolic flux distributions for wildtype and mutants are shown to describe how the optimal flux profiles (where production of biomass, B, is maximized) in the integrated network changes by the metabolic and/or regulatory perturbations presented in (D).
G4
R3
E4
E3
I2
R4G3
E1
G2
E2
G1A
P1
G1B
TF1
G5
G6
E6
E5
R5 P2
TF1
R2S R1 I1 B
Genes
Enzymes
Transcription Factors
Metabolites
Reactions
Activation
Inhibition
GPR Associations
Fluxes
b1
b2
b4
b3
Engineeringobjective
Cellularobjective
Undesiredby-product
Substrateuptake
Deleted Genes Overexpressed Genes B P1 P2
none none 1.2 0 10G4 TF1 none 0.8 10 0G6 TF1 none 0.8 10 0G3 G4 G1A 0.8 10 0G5 G6 G1A 0.8 10 0
A
B CReactions Enzymes Genes
R1 : S → I1 E1 (G1A and G1B)R2 : I1 → P1 + 0.08 B E2 G2R3 : S → I2 E3 G3R4 : I1 I2 E4 G4R5 : I2 → P2 + 0.12 B E5 or E6 G5 or G6
→
→
Target Regulatory rules
G1A not TF1G3 TF1G5 TF1TF1 S
D
I2
P1
P2
S I1 B
ΔG4 ΔTF1 or ΔG3 ΔG4 + G1ARegulated Reaction Network
10
0.8
0
1010
10
0I2
P1
P2
S I1 B
Wildtype Regulated Reaction Network 0
1.2
10
0
010
10
10I2
P1
S I1 B
ΔG6 ΔTF1 or ΔG5 ΔG6 + G1ARegulated Reaction Network
10
0.810
1010
0 0
E
Kim and Reed BMC Systems Biology 2010, 4:53http://www.biomedcentral.com/1752-0509/4/53
Page 5 of 19
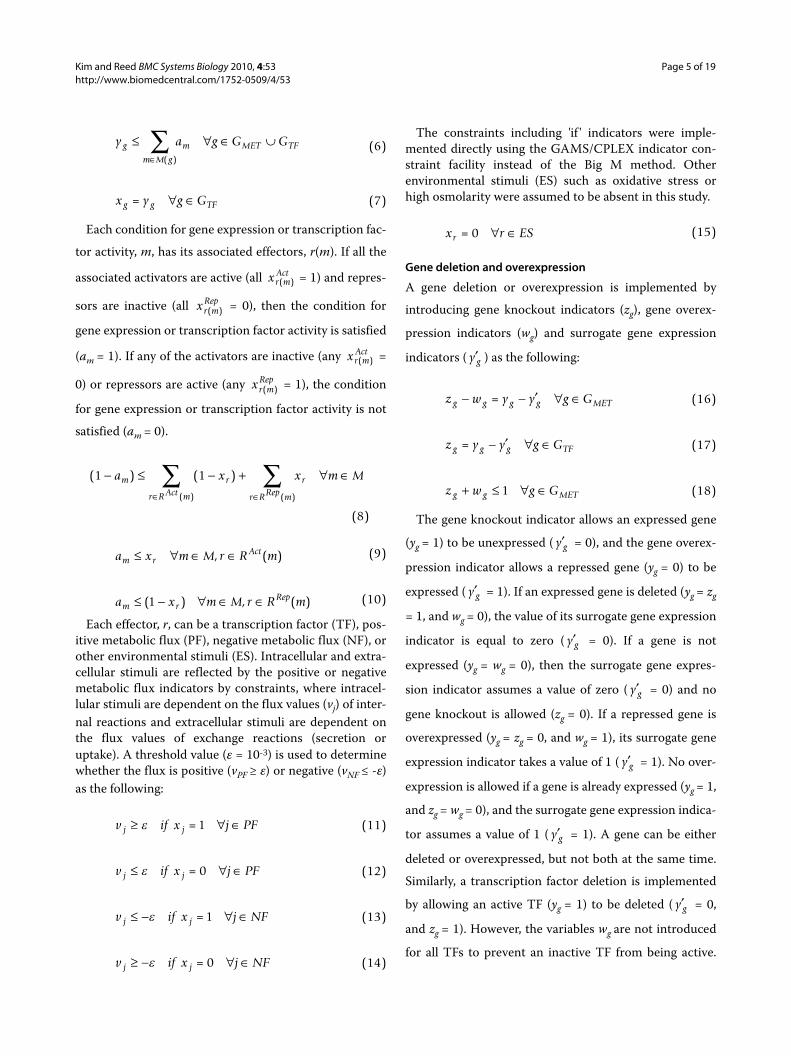
Each condition for gene expression or transcription fac-
tor activity, m, has its associated effectors, r(m). If all the
associated activators are active (all = 1) and repres-
sors are inactive (all = 0), then the condition for
gene expression or transcription factor activity is satisfied
(am = 1). If any of the activators are inactive (any =
0) or repressors are active (any = 1), the condition
for gene expression or transcription factor activity is not
satisfied (am = 0).
Each effector, r, can be a transcription factor (TF), pos-itive metabolic flux (PF), negative metabolic flux (NF), orother environmental stimuli (ES). Intracellular and extra-cellular stimuli are reflected by the positive or negativemetabolic flux indicators by constraints, where intracel-lular stimuli are dependent on the flux values (vj) of inter-nal reactions and extracellular stimuli are dependent onthe flux values of exchange reactions (secretion oruptake). A threshold value (ε = 10-3) is used to determinewhether the flux is positive (vPF ≥ ε) or negative (vNF ≤ -ε)as the following:
The constraints including 'if ' indicators were imple-mented directly using the GAMS/CPLEX indicator con-straint facility instead of the Big M method. Otherenvironmental stimuli (ES) such as oxidative stress orhigh osmolarity were assumed to be absent in this study.
Gene deletion and overexpression
A gene deletion or overexpression is implemented by
introducing gene knockout indicators (zg), gene overex-
pression indicators (wg) and surrogate gene expression
indicators ( ) as the following:
The gene knockout indicator allows an expressed gene
(yg = 1) to be unexpressed ( = 0), and the gene overex-
pression indicator allows a repressed gene (yg = 0) to be
expressed ( = 1). If an expressed gene is deleted (yg = zg
= 1, and wg = 0), the value of its surrogate gene expression
indicator is equal to zero ( = 0). If a gene is not
expressed (yg = wg = 0), then the surrogate gene expres-
sion indicator assumes a value of zero ( = 0) and no
gene knockout is allowed (zg = 0). If a repressed gene is
overexpressed (yg = zg = 0, and wg = 1), its surrogate gene
expression indicator takes a value of 1 ( = 1). No over-
expression is allowed if a gene is already expressed (yg = 1,
and zg = wg = 0), and the surrogate gene expression indica-
tor assumes a value of 1 ( = 1). A gene can be either
deleted or overexpressed, but not both at the same time.
Similarly, a transcription factor deletion is implemented
by allowing an active TF (yg = 1) to be deleted ( = 0,
and zg = 1). However, the variables wg are not introduced
for all TFs to prevent an inactive TF from being active.
y a g G Gg
m M g
m MET TF≤ ∀ ∈ ∪∈∑
( )(6)
x y g Gg g TF= ∀ ∈ (7)
xr mAct( )
xr mRep( )
xr mAct( )
xr mRep( )
(1 ) (1 )
( ) ( )
− ≤ − + ∀ ∈∈ ∈∑ ∑a x x m Mm
r RAct m
r
r RRep m
r
(8)
a x m M r R mm rAct≤ ∀ ∈ ∈, ( ) (9)
a x m M r R mm rRep≤ − ∀ ∈ ∈( )1 , ( ) (10)
v if x j PFj j≥ ∀ ∈e = 1 (11)
v if x j PFj j≤ ∀ ∈e = 0 (12)
v if x j NFj j≤ − ∀ ∈e = 1 (13)
v if x j NFj j≥ − ∀ ∈e = 0 (14)
x r ESr = 0 ∀ ∈ (15)
′y g
z w y y g Gg g g g MET− − ′ ∀ ∈= (16)
z y y g Gg g g TF= − ′ ∀ ∈ (17)
z w g Gg g MET+ ≤ ∀ ∈1 (18)
′y g
′y g
′y g
′y g
′y g
′y g
′y g

Kim and Reed BMC Systems Biology 2010, 4:53http://www.biomedcentral.com/1752-0509/4/53
Page 6 of 19
The total numbers of gene deletions and overexpressions
are limited to desired values, K1 and K2, respectively.
Then, instead of the gene expression/TF activity indica-tors, the surrogate gene expression/TF activity indicatorsare used to determine the enzyme/TF status and thusreaction states via GPR associations and transcriptionalregulation by equations (21)-(23) which replace equations(3),(4), and (7).
Optimality condition
The bi-level optimization problem can be formulated as
an MILP using the strong duality theorem in the similar
way as described in OptKnock [8]. Here, a general proce-
dure to construct the optimality conditions for the inner
LP problem is presented without using large bounds for
primal and dual variables. The objective function and
simulated conditions are specified using a linear combi-
nation of fluxes ( ) and lower bounds for each flux
( ), respectively. The primal LP (P) is formulated as fol-
lows:
The reversible reactions (j J\JLB) are only constrained
by the mass balance equation, and associated with these
constraints are unconstrained dual variables (ui). The
uptake, secretion, or irreversible reactions are addition-
ally constrained by the lower bounds ( ), and associ-
ated with these constraints are positive dual variables (λj).
The reactions removed by gene knockouts are con-
strained to zero by using binary variables (vj = 0 if dj = 0),
and associated with these constraints are unconstrained
dual variables (hj). The dual LP (D) is formulated as fol-
lows.
At optimality, the values of the objective functions in(P) and (D) are equal, and primal and dual variables sat-isfy the constraints of (P) and (D), respectively. The fol-lowing optimality conditions for the inner problem arealways satisfied as the values of all binary variables (dj) arefixed to 0 or 1. The inner problem can be written as:
In this study, we used the biomass formation as theobjective function of inner problem (pj = 1 for j = biomassformation). The constraints including 'if ' indicators areimplemented directly using the GAMS/CPLEX indicatorconstraint facility. We also constrained the dual variables
g
gz K∑ ≤ 1 (19)
g
gw K∑ ≤ 2 (20)
( 1) ( 1)( )
b y n Nn
g G n
g− ≥ ′ − ∀ ∈∈∑ (21)
b y m M g G nn g≤ ′ ∀ ∈ ∈, ( ) (22)
x y g Gg g TF= ′ ∀ ∈ (23)
j j jp v∑v jlb
P( ) ∑v j j
j jp vmax
s.t.j
ij j iS v i I u∑ ∀ ∈= 0 : ( ) (24)
v v if d j Jj jlb
j LB j≥ ∀ ∈= 1 : ( )l (25)
v if d j J hj j j= = ∀ ∈0 0 : ( ) (26)
v jlb
D( ) −∑ui j h j j
jlb
jv, ,
( )l
lmin
s.t.i
ji i j j LBS u p if d j J J∑ = = ∀ ∈1 \
(27)
i
ji i j j j LBS u p if d j J∑ − = = ∀ ∈l 1 (28)
i
ji i j j jS u h p if d j J∑ + = = ∀ ∈0 (29)
l j ≥ 0 (30)
j
j j
j
jlb
jp v v∑ ∑= −
−
( )
(24) (30)
l
Equations
(31)
Kim and Reed BMC Systems Biology 2010, 4:53http://www.biomedcentral.com/1752-0509/4/53
Page 7 of 19
for reaction removal (hj) to be within a small range (-1 to1) in order to reduce the solution time (J. Kim, J.L. Reed,and C.T. Maravelias, in preparation).
OptORF formulation
The objective function in the outer problem of OptORF
formulation is a linear combination of fluxes with penalty
terms for the total number of gene deletions or overex-
pressions ( ). The first term
defines biochemical production of interest, the second
term applies a weighted penalty (α) to an additional gene
deletion, and the third applies a penalty (β) to an addi-
tional overexpression. In other words, the biochemical
production rate should increase at least by α or β if an
additional gene is deleted or overexpressed, respectively.
These penalty terms can be very useful for eliminating
strains needing more genetic modifications if the
improvement in production is small. When α or β is a
very small value (≈ 10-6), it effectively eliminates unneces-
sary modifications from the solution without affecting
the optimal biochemical production. For example, if
deleting gene A results in the same product yield as delet-
ing gene A and B (i.e. deletion of gene B does not improve
the yield), then the gene B deletion would not appear in
the optimal solution.
If multiple solutions are desired, integer cuts constrain
successive optimal solutions with a parameter (δ), which
is the number of differences in genes among identified
strategies. A previously identified solution (k) is com-
prised of a set of gene deletions and overpressions that
are stored in parameters and , respectively. If δ is
set to 1, integer cuts prevent OptORF from finding the
same solution as the previous ones. One may set δ to a
higher value in order to obtain a more diverse set of met-
abolic engineering strategies. In this study, we used α =
10-6, β = 10-6, and δ = 1. The complete OptORF algorithm
is defined by the following equations:
Models and simulation conditionsIn this study, we have implemented an integrated modelof metabolism and regulation for E. coli, iMC1010 v2 [19],which consists of 906 metabolic genes and 104 TFs.There was one transcription factor, GlnL, that wasincluded in the original model but was missing regulatorytargets. GlnL should affect GlnG activity, but insteadGlnG activity is independent of GlnL (the correct rule forGlnG should be (GlnL AND Not (nh4(e)>2)). However,this missing regulatory interaction would not affect theresults of this study as GlnG is not active under theseconditions and was not identified as a strategy forimproving production of the alcohols examined here. Inthe OptKnock simulations, we excluded transport reac-tions for acetate, carbon dioxide, formate, phosphate, andwater from consideration as eliminating transport may bechallenging. In addition, ATP synthase deletion wasexcluded from consideration since the deletion resultedin a high variability in ethanol production at the pre-dicted optimal growth condition. Equivantly, the deletionof focA, focB, and atp operon were excluded from theOptORF simulations. The OptORF approach was appliedto identify metabolic engineering strategies for overpro-duction of ethanol or higher alcohols (i.e. cj = 1 for j =desired alcohol secretion) in glucose minimal media.Maximum glucose uptake rate (GUR) and oxygen uptakerate (OUR) are specified in order to simulate anaerobicgrowth conditions (GUR = 18.5 mmol/gDW/hr, OUR = 0mmol/gDW/hr) [21]. A minimal growth rate was set to0.1 hr-1 for all simulations. The optimization problemswere solved using CPLEX 11.2 accessed via the GeneralAlgebraic Modeling System (GAMS).
Results and DiscussionWe identified metabolic engineering strategies for etha-nol production in E. coli using the OptORF formulationwith an integrated model of metabolism and regulation,and compared the resulting strategies to ones using a pre-vious approach based on reaction deletions (OptKnock).First, a set of reaction deletion strategies was obtainedusing OptKnock, and then a corresponding set of genedeletions needed to remove the reactions in each Opt-Knock strategy was identified. These OptKnock genedeletion designs were then compared to the gene deletionstrategies found by OptORF without considering tran-scriptional regulation to examine the differences between
j j j g g g gc v z w∑ ∑ ∑− −a b
Zgk Wg
k
maxj
j j
g
g
g
gc v z w∑ ∑ ∑− −a b
s.t.
Equations g
gk
g gk
g
g
gk
gkZ z W w Z W k K∑ ∑+ + ≤ + ∀ ∈( ) ( )
(1),(2),(5)
d
,,(6),(8) (31)
, , , , , , {0,1}
−′ ∈d b w y y a xj n g g g m r
(32)
Kim and Reed BMC Systems Biology 2010, 4:53http://www.biomedcentral.com/1752-0509/4/53
Page 8 of 19
the reaction-based strategies and gene-based strategies.To investigate how transcriptional regulation affectsadaptive evolution of microbial strains, we analyzed avail-able data for adaptively evolved E. coli mutant strainsusing the integrated metabolic and regulatory model.OptKnock strategies were then re-analyzed using an inte-grated metabolic and regulatory model and compared tothe OptORF strategies identified when transcriptionalregulatory constraints were considered. Finally, we pres-ent metabolic engineering strategies for overproducingethanol or higher alcohols in E. coli that include bothmetabolic gene deletions and overexpressions, as well astranscription factor deletions, using our developedapproach.
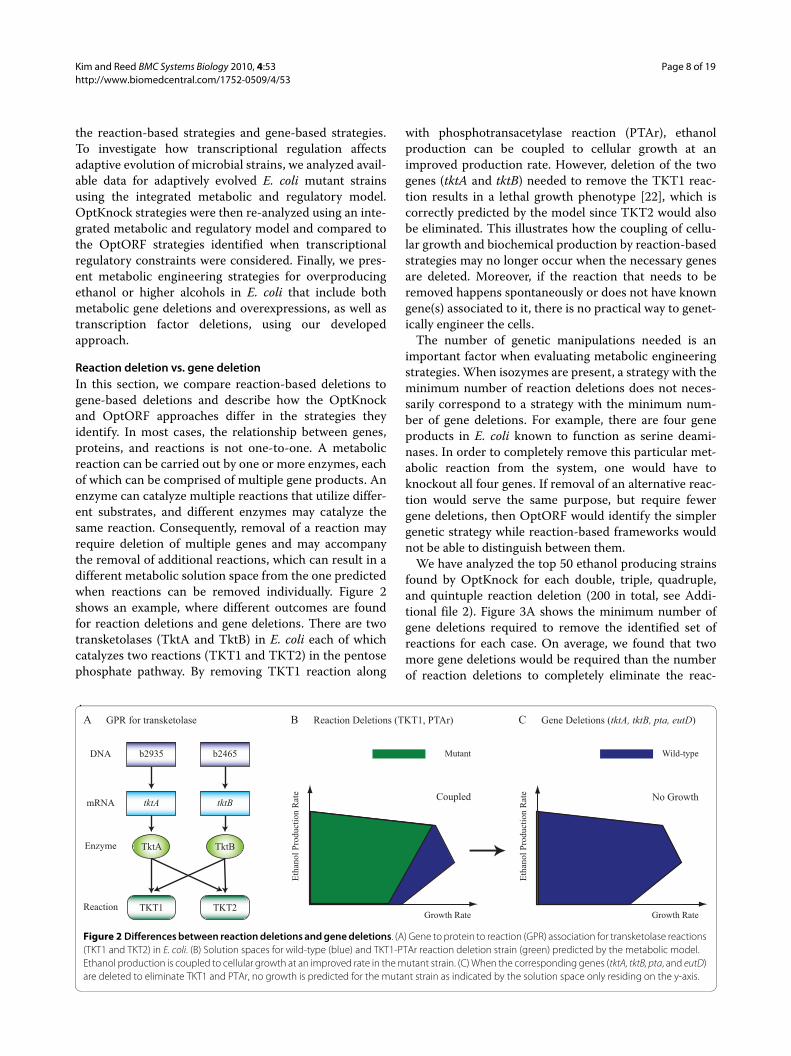
Reaction deletion vs. gene deletionIn this section, we compare reaction-based deletions togene-based deletions and describe how the OptKnockand OptORF approaches differ in the strategies theyidentify. In most cases, the relationship between genes,proteins, and reactions is not one-to-one. A metabolicreaction can be carried out by one or more enzymes, eachof which can be comprised of multiple gene products. Anenzyme can catalyze multiple reactions that utilize differ-ent substrates, and different enzymes may catalyze thesame reaction. Consequently, removal of a reaction mayrequire deletion of multiple genes and may accompanythe removal of additional reactions, which can result in adifferent metabolic solution space from the one predictedwhen reactions can be removed individually. Figure 2shows an example, where different outcomes are foundfor reaction deletions and gene deletions. There are twotransketolases (TktA and TktB) in E. coli each of whichcatalyzes two reactions (TKT1 and TKT2) in the pentosephosphate pathway. By removing TKT1 reaction along
with phosphotransacetylase reaction (PTAr), ethanolproduction can be coupled to cellular growth at animproved production rate. However, deletion of the twogenes (tktA and tktB) needed to remove the TKT1 reac-tion results in a lethal growth phenotype [22], which iscorrectly predicted by the model since TKT2 would alsobe eliminated. This illustrates how the coupling of cellu-lar growth and biochemical production by reaction-basedstrategies may no longer occur when the necessary genesare deleted. Moreover, if the reaction that needs to beremoved happens spontaneously or does not have knowngene(s) associated to it, there is no practical way to genet-ically engineer the cells.
The number of genetic manipulations needed is animportant factor when evaluating metabolic engineeringstrategies. When isozymes are present, a strategy with theminimum number of reaction deletions does not neces-sarily correspond to a strategy with the minimum num-ber of gene deletions. For example, there are four geneproducts in E. coli known to function as serine deami-nases. In order to completely remove this particular met-abolic reaction from the system, one would have toknockout all four genes. If removal of an alternative reac-tion would serve the same purpose, but require fewergene deletions, then OptORF would identify the simplergenetic strategy while reaction-based frameworks wouldnot be able to distinguish between them.
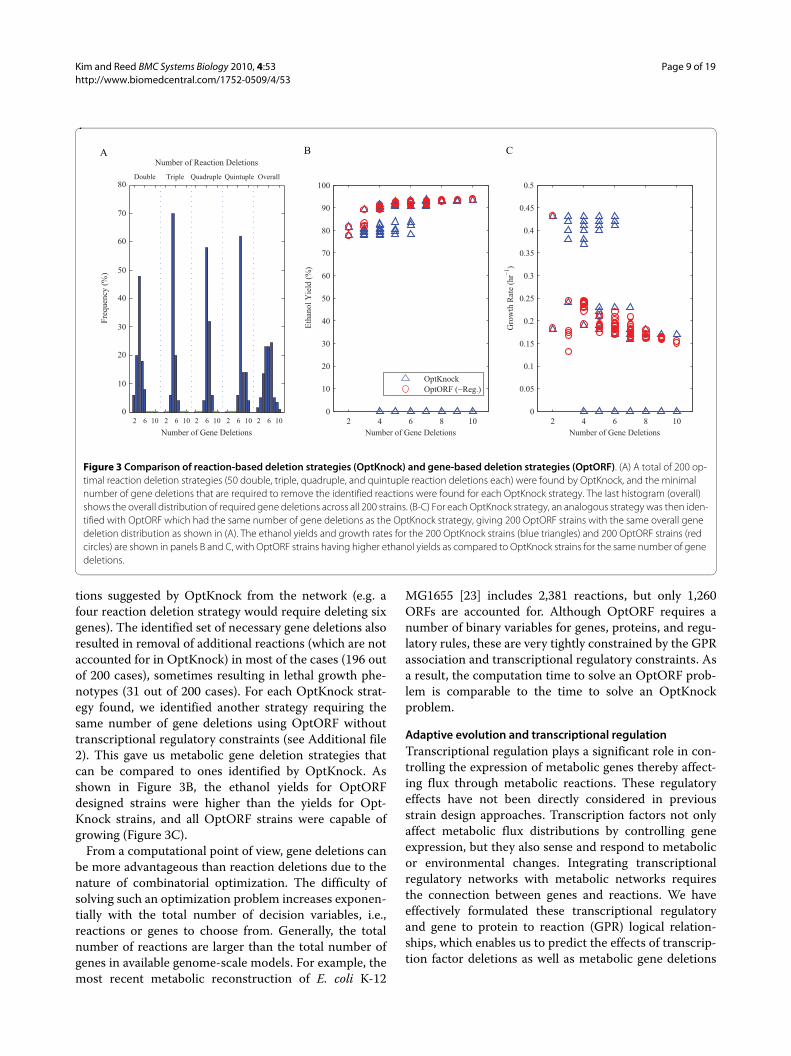
We have analyzed the top 50 ethanol producing strainsfound by OptKnock for each double, triple, quadruple,and quintuple reaction deletion (200 in total, see Addi-tional file 2). Figure 3A shows the minimum number ofgene deletions required to remove the identified set ofreactions for each case. On average, we found that twomore gene deletions would be required than the numberof reaction deletions to completely eliminate the reac-
Figure 2 Differences between reaction deletions and gene deletions. (A) Gene to protein to reaction (GPR) association for transketolase reactions (TKT1 and TKT2) in E. coli. (B) Solution spaces for wild-type (blue) and TKT1-PTAr reaction deletion strain (green) predicted by the metabolic model. Ethanol production is coupled to cellular growth at an improved rate in the mutant strain. (C) When the corresponding genes (tktA, tktB, pta, and eutD) are deleted to eliminate TKT1 and PTAr, no growth is predicted for the mutant strain as indicated by the solution space only residing on the y-axis.
TktA TktB
tktA tktB
b2935 b2465
TKT2TKT1
DNA
mRNA
Enzyme
Reaction
Coupled No Growth
Growth Rate
Etha
nol P
rodu
ctio
n R
ate
Growth Rate
Wild-typeMutant
Reaction Deletions (TKT1, PTAr) Gene Deletions (tktA, tktB, pta, eutD)
Etha
nol P
rodu
ctio
n R
ate
A B CGPR for transketolase
Kim and Reed BMC Systems Biology 2010, 4:53http://www.biomedcentral.com/1752-0509/4/53
Page 9 of 19
tions suggested by OptKnock from the network (e.g. afour reaction deletion strategy would require deleting sixgenes). The identified set of necessary gene deletions alsoresulted in removal of additional reactions (which are notaccounted for in OptKnock) in most of the cases (196 outof 200 cases), sometimes resulting in lethal growth phe-notypes (31 out of 200 cases). For each OptKnock strat-egy found, we identified another strategy requiring thesame number of gene deletions using OptORF withouttranscriptional regulatory constraints (see Additional file2). This gave us metabolic gene deletion strategies thatcan be compared to ones identified by OptKnock. Asshown in Figure 3B, the ethanol yields for OptORFdesigned strains were higher than the yields for Opt-Knock strains, and all OptORF strains were capable ofgrowing (Figure 3C).
From a computational point of view, gene deletions canbe more advantageous than reaction deletions due to thenature of combinatorial optimization. The difficulty ofsolving such an optimization problem increases exponen-tially with the total number of decision variables, i.e.,reactions or genes to choose from. Generally, the totalnumber of reactions are larger than the total number ofgenes in available genome-scale models. For example, themost recent metabolic reconstruction of E. coli K-12
MG1655 [23] includes 2,381 reactions, but only 1,260ORFs are accounted for. Although OptORF requires anumber of binary variables for genes, proteins, and regu-latory rules, these are very tightly constrained by the GPRassociation and transcriptional regulatory constraints. Asa result, the computation time to solve an OptORF prob-lem is comparable to the time to solve an OptKnockproblem.
Adaptive evolution and transcriptional regulationTranscriptional regulation plays a significant role in con-trolling the expression of metabolic genes thereby affect-ing flux through metabolic reactions. These regulatoryeffects have not been directly considered in previousstrain design approaches. Transcription factors not onlyaffect metabolic flux distributions by controlling geneexpression, but they also sense and respond to metabolicor environmental changes. Integrating transcriptionalregulatory networks with metabolic networks requiresthe connection between genes and reactions. We haveeffectively formulated these transcriptional regulatoryand gene to protein to reaction (GPR) logical relation-ships, which enables us to predict the effects of transcrip-tion factor deletions as well as metabolic gene deletions
Figure 3 Comparison of reaction-based deletion strategies (OptKnock) and gene-based deletion strategies (OptORF). (A) A total of 200 op-timal reaction deletion strategies (50 double, triple, quadruple, and quintuple reaction deletions each) were found by OptKnock, and the minimal number of gene deletions that are required to remove the identified reactions were found for each OptKnock strategy. The last histogram (overall) shows the overall distribution of required gene deletions across all 200 strains. (B-C) For each OptKnock strategy, an analogous strategy was then iden-tified with OptORF which had the same number of gene deletions as the OptKnock strategy, giving 200 OptORF strains with the same overall gene deletion distribution as shown in (A). The ethanol yields and growth rates for the 200 OptKnock strains (blue triangles) and 200 OptORF strains (red circles) are shown in panels B and C, with OptORF strains having higher ethanol yields as compared to OptKnock strains for the same number of gene deletions.
0
10
20
30
40
50
60
70
80
Number of Gene Deletions
Freq
uenc
y (%
)
2
Double
6
Triple
10
Quadruple Quintuple Overall
Number of Reaction Deletions
2 4 6 8 100
10
20
30
40
50
60
70
80
90
100
Number of Gene Deletions
Etha
nol Y
ield
(%)
OptKnockOptORF (−Reg.)
2 4 6 8 100
0.05
0.1
0.15
0.2
0.25
0.3
0.35
0.4
0.45
0.5
Number of Gene Deletions
Gro
wth
Rat
e (h
r−1)
2 6 10 2 6 10 2 6 10 2 6 10
A B C

Kim and Reed BMC Systems Biology 2010, 4:53http://www.biomedcentral.com/1752-0509/4/53
Page 10 of 19
on transcription regulation and metabolism, simultane-ously.
Metabolic engineering strategies described in this workare based on the assumption that microbial cells wouldevolve to have higher growth rates, and that biochemicalproduction would increase along with cellular growthrate, the latter being the selective pressure during adap-tive evolutionary experiments. An important questionthat one might ask is how malleable the transcriptionalregulatory network is during adaptive evolution. If cellscan easily rewire their transcriptional networks to gainhigher fitness, it is possible that knockout strains couldlose the coupling of biochemical production and growth,if expressing unexpressed genes leads to a higher growthrate without a higher biochemical production. To addressthis issue, we have analyzed available data for adaptivelyevolved strains of E. coli, and compared the data to pre-dictions using the integrated model of metabolism andregulation.
First, previously experimentally implemented E. colistrains designed for lactate production [9] were re-assessed using the integrated metabolic and regulatorymodels. Figure 4A and 4B show the possible lactate andbiomass yields for ΔptaΔadhE and ΔptaΔpfk strains pre-dicted by the metabolic model (blue) and integrated met-abolic and regulatory model (green). The experimentalobservations for lactate yields and biomass yields during60 days of adaptive evolution are also shown. All the dele-tions were simulated based on gene deletions and notreaction deletions, and yields were plotted to normalize
the fluxes to changes in glucose uptake rate whichoccured during adaptive evolution. The ΔptaΔadhEstrain is only predicted to produce more lactate withincreased growth by the integrated metabolic and regula-tory model, while no coupling between lactate produc-tion and growth is predicted by either model for theΔptaΔpfk strain. Experimentally observed trajectories forΔptaΔadhE strain move towards the optimal point pre-dicted only by the integrated metabolic and regulatorymodel (Figure 4A), while the ΔptaΔpfk strain does notexhibit improved lactate production in agreement withboth models (Figure 4B).
Metabolic gene deletion strains have also been evolvedon different carbon sources [1]. We have analyzed growthphenotypes for these strains using the metabolic modeland integrated metabolic and regulatory models, andfound that only the strains grown on malate showed a sig-nificant difference in predicted growth rates between theregulated and un-regulated models. Figure 4C shows theexperimentally observed growth rates relative to the pre-dictions for mutant strains grown on malate at the end ofadaptive evolution (day 40). Mutant strains seem toevolve and increase their growth rates to the optimal val-ues predicted by the integrated model, but do not reachthe values predicted by the metabolic model alone. Theonly strain that did exceed the integrated metabolic andregulatory model predictions, Δzwf, also had large exper-imental standard deviations in the observed growth rates.Based on these results, it is possible that cells undergoingadaptive evolution do not significantly rewire their tran-
Figure 4 Adaptive evolution of E. coli mutants. (A-B) Adaptive evolution of lactate producing E. coli strains for 60 days. The data from the lactate producing strains [9] were compared to integrated metabolic and regulatory model predictions. The production capabilities for each mutant was cal-culated without considering transcriptional regulation (blue) and considering transcriptional regulation (green). Experimentally observed trajectories are shown for every 10 days of adaptive evolution on the model predicted solution spaces. (C) Model predictions for adaptively evolved E. coli strains grown on malate. Previously reported data on the adaptive evolution of single gene knockout strains [1] was compared to simulations of the gene deletion mutants using the metabolic model (blue) and the integrated metabolic and regulatory model (green). The relative growth rates (experimen-tally observed/model predicted) were calculated for each strain at the last day of evolution using the two models. Error bars indicate one experimental standard deviation among two or three independently evolved strains.
0 0.05 0.1 0.150
0.5
1
1.5
2
2.5Δpta ΔadhE
YX/S (g DCW/g glucose)
Y P/S
(mol
lact
ate/
mol
glu
cose
)
Day 0
Day 60
0 0.05 0.1 0.150
0.5
1
1.5
2
2.5Δpta Δpfk
YX/S (g DCW/g glucose)
Y P/S
(mol
lact
ate/
mol
glu
cose
)
Met. onlyMet.+Reg.Exp.
Day 0
Day 60
Δack Δpck Δppc Δzwf0%
20%
40%
60%
80%
100%
Strains
Rela
tive
Gro
wth
Rat
e (E
xp./M
odel
)
Met. only Met.+Reg.
A B C

Kim and Reed BMC Systems Biology 2010, 4:53http://www.biomedcentral.com/1752-0509/4/53
Page 11 of 19
scriptional regulatory networks, and therefore regulationshould be considered in the design of production strains.
Another advantage of using an integrated model ofmetabolism and regulation emerges when it comes topredicting essential genes. An integrated model is betterat predicting essential genes under a given condition, andhence more likely prevents gene deletions which arelethal from being included in the strategies. It was previ-ously shown that an integrated model of E. coli correctlypredicts the growth phenotypes for 10,833 (78.8%) of thetotal 13,750 cases (mutant grown in a single environmen-tal condition), while a metabolic model alone predicts8,968 (65.2%) cases correctly [19]. An integrated model isalso capable of predicting essential transcription factors(e.g. cysB and metR) as well as metabolic genes in E. coli[19,24,25]. Accordingly, strains that are designed withregulatory considerations should grow better initially andmay achieve the desired phenotype faster.
Metabolic model vs. integrated modelThe ethanol producing strains identified in the first resultsection were re-analyzed using the integrated metabolicand regulatory model to demonstrate the differencesfrom using the metabolic model. When we re-calculatedthe production rates and growth rates for the 200 previ-
ously identified OptKnock strains after imposing regula-tory constraints, we found that ethanol production wassignificantly lower for most strains (Figure 5A, see Addi-tional file 2). This is attributed to the fact that some of theregulated enzymes are not being expressed according tothe transcriptional regulatory constraints. For each Opt-Knock strain we subsequently identified the minimumnumber of genes that need to be overexpressed to achievethe same ethanol yields when regulatory affects are notconsidered (Figure 5C, see Additional file 2). In otherwords, we found the sets of genes which are down-regu-lated by transcriptional regulation, but are necessary toachieve the same growth and ethanol production rates asshown in Figure 3. Without overexpression of thesegenes, the ethanol yields of OptKnock strains were muchlower than the yields of OptORF strains identified whenregulatory effects are considered in the strain design pro-cess (Figure 5A). Also, the number of lethal growth phe-notypes for OptKnock strains were much higher whenregulation is accounted for (162 out of 200 cases) imply-ing that these strains would not be able to grow, at leastinitially (Figure 5B), and would possibly be difficult toconstruct. Interestingly, OptORF strains exhibit a sharpincrease in growth and ethanol yields between 4 and 5gene deletion strategies. This is due to the expression of
Figure 5 Comparison of strategies by the metabolic model and the integrated metabolic and regulatory model. The OptKnock deletion strat-egies in Figure 3 were re-analyzed using the integrated metabolic and regulatory model, where their corresponding gene deletions were the same but the maximum growth rate and ethanol production were re-calculated with the integrated model. (A-B) The ethanol yields and growth rates for most of the OptKnock strains (blue triangles) were predicted to be significantly lower by the integrated model than the those predicted by the met-abolic model alone (Figure 3B and 3C) due to transcriptional regulatory constraints. Also shown are strain designed using OptORF (green circles) when transcriptional regulation is included (gene overexpression was not allowed such that K2 = 0). (C) For each OptKnock strategy, we identified the min-imal number of genes (whose expression is repressed by the transcriptional regulation) that were needed to be overexpressed to achieve the same ethanol yield as predicted by the unregulated metabolic model (Figure 3B and 3C).
2 4 6 8 100
10
20
30
40
50
60
70
80
90
100
Number of Gene Deletions
Etha
nol Y
ield
(%)
OptKnockOptORF (+Reg.)
2 4 6 8 100
0.05
0.1
0.15
0.2
0.25
0.3
0.35
0.4
0.45
0.5
Number of Gene Deletions
Gro
wth
Rat
e (h
r−1)
0
10
20
30
40
50
60
70
80
Number of Gene Overexpressions
Freq
uenc
y (%
)
0
Double
3 6
Triple Quadruple Quintuple Overall
Number of Reaction Deletions
0 3 60 3 6 0 3 6 0 3 6
A B C

Kim and Reed BMC Systems Biology 2010, 4:53http://www.biomedcentral.com/1752-0509/4/53
Page 12 of 19
genes involved in the Entner-Doudoroff pathway, and thispattern was not observed in Figure 3B and 3C when regu-latory interactions were not considered in the design ofOptORF strains.
Finally, the strain designs identified by OptKnock (200),OptORF without regulatory constraints (200), andOptORF with regulatory constraints (200) were com-pared to identify common genetic strategies. Figure 6Ashows the list of commonly found gene deletions for dif-ferent approaches and their frequency. Among the top200 strategies found by each approach (shown in Figures3 and 5), genes that appear in at least 15% of the total 600strategies are listed. Overall, deletion of pyruvate for-mate-lyase (PFL) was the most frequent for all of theapproaches. Deletion of phosphoenolpyruvate:sugarphosphotransferase system (PTS) was mainly found inapproaches without transcriptional regulation, while the
two transcription factor deletions (fnr and gntR) are iden-tified only by OptORF when transcriptional regulation isaccounted for. Deletion of pgi or tpiA was evenly distrib-uted across all methods, indicating that one of them istypically necessary to couple growth to ethanol produc-tion (see next section for further discussion).
For each of the three approaches, we generated a heatmap based on the correlation coefficients between thegenes that appear in at least 10% of their corresponding200 strategies (Figure 6B-D). If a pair of gene deletionsalways appears in strategies together, the correspondingcell in the heat map is colored in yellow. A cell is coloredin black when a pair of gene deletions are anti-correlated.For example, pta and eutD appear together since the dele-tion of both is required to eliminate the phosphate acetyl-transferase activity, while either fnr or arcA appears sincethe deletion of either transcription factor results in a sim-
Figure 6 Commonly found gene deletions for ethanol production and their correlations. (A) The histogram shows the frequency of the gene deletions that appear in at least 15% of all 600 strategies. (B-D) For each approach, a correlation heat map for the genes that appear in at least 10% of the 200 strategies is shown. If there is a strong positive (negative) correlation between a pair of genes, the corresponding cell is colored as yellow (black).
pflAB tdcE ptsH pgi pflCD tpiA gdhA pta eutD fnr gntR0
25
50
75
100
Freq
uenc
y (%
)
Common Genes
OptKnockOptORF (−Reg.)OptORF (+Reg.)
OptKnock
pflAB pflCD tdcE ptsH pgi gdhA tpiA purT ackA tdcD pta eutD
pflAB
pflCD
tdcE
ptsH
pgi
gdhA
tpiA
purT
ackA
tdcD
pta
eutD
OptORF (−Reg.)
ptsH pgi pflAB pflCD tdcE tpiA pta eutD gdhA gnd nuoN
ptsH
pgi
pflAB
pflCD
tdcE
tpiA
pta
eutD
gdhA
gnd
nuoN
OptORF (+Reg.)
fnr gntR tpiA gdhA pgi pflAB tdcE arcA purT ptsH pta eutD
fnr
gntR
tpiA
gdhA
pgi
pflAB
tdcE
arcA
purT
ptsH
pta
eutD
−1
−0.5
0
0.5
1
A B
DC

Kim and Reed BMC Systems Biology 2010, 4:53http://www.biomedcentral.com/1752-0509/4/53
Page 13 of 19
ilar phenotype. The pattern of correlation becomesclearer (strategies have less variation) as the structure ofthe model gets simpler from a gene-based deletion withtranscriptional regulation (Figure 6D) to reaction-baseddeletion without transcriptional regulation (Figure 6B).This indicates that as models account for the complexstructure and interactions of networks, more diversemetabolic engineering strategies can be identified.
Strain designs for ethanol production by OptORFWe have employed OptORF to identify metabolic engi-neering strategies for ethanol production in E. coli.Strains are designed to grow on glucose minimal media inanaerobic conditions. Notable differences from the previ-ously reported strain designs [12] are that these strategiesinclude the deletion of transcription factors (e.g. Fnr,ArcA, or GntR) and electron transport chain components(e.g. NDH-1) as well as overexpression of metabolic genes(e.g. edd or fbp). We have identified a set of strategiesconsisting of only gene deletions (Table 2), and anotherset of strategies that also include overexpression of genes(Table 3). It should be noted that the deletion of lactate
dehydrogenase (Ldh) is not required in the presentedstrategies because ethanol production is preferred overlactate production at the optimal growth condition, andso deletion of Ldh would not be required. Lactate couldbe produced initially when cells are growing sub-opti-mally (which is probably why other studies deleted Ldh[26,27]), but lactate production would be predicted todecrease as cells adaptively evolve to higher growth rates,which favor ethanol production due to differences inredox requirements (ethanol production consumes moreNADH).
Deletion of fnr or arcA is found in most strain designs,where some enzymes involved in aerobic metabolism(that are repressed by Fnr and/or ArcA) can be advanta-geous for ethanol production. Aerobic genes in centralmetabolism that are repressed by these anaerobic regula-tors include aceAB, aceEF, lpd, mdh, sucAB, andsdhABCD. The de-repression of malate dehydrogenase(mdh) was predicted to be especially important based oncomparisons between flux distributions with and withoutmdh. If necessary, such repressed genes may be overex-
Table 3: Gene deletion and overexpression strategies for ethanol production in E. coli.
Deleted Genes Overexpressed Genes
Growth Rate
(hr-1)
Ethanol Yield (%)
fnr pflB tdcE pgi edd 0.225 86.2
fnr pflB tdcE pgi ptsH edd fbp 0.182 90.4
fnr pflB tdcE tpiA edd 0.235 90.5
fnr pflB tdcE tpiA gdhA edd 0.214 91.4
arcA pta eutD tpiA ptsH edd 0.192 91.6
In addition to gene deletions, overexpressed genes are identified to further improve ethanol production. The maximum number of overexpressed genes was limited to two for all cases, and strategies including less than four gene deletions are not shown due to the negligible increase in ethanol yields by gene overexpression.
Table 2: Gene deletion strategies for ethanol production in E. coli
Deleted Genes Growth Rate
(hr-1)
Ethanol Yield (%)
none (wild-type) 0.467 39.3
arcA pgi 0.122 83.5
nuoN pgi 0.121 83.6
fnr gntR pflB tdcE pgi 0.225 86.2
arcA gntR pta eutD tpiA 0.244 89.3
fnr gntR pflB tdcE tpiA 0.235 90.5
The predicted ethanol yields and growth rates are listed for two-deletion strategies and five-deletion strategies. Three or four deletion strategies are not shown because the ethanol yield was not significantly improved over two deletion strategies. The variability in ethanol yield at the predicted maximum growth rate was zero or very small (< 0.01%) for all cases. The ethanol yield is reported as % of the maximum theoretical yield (100% is 0.51 g ethanol/g glucose or 2 mol ethanol/mol glucose). Maximum glucose uptake rate of 18.5 mmol/gDW/hr was used to simulate anaerobic growth conditions.

Kim and Reed BMC Systems Biology 2010, 4:53http://www.biomedcentral.com/1752-0509/4/53
Page 14 of 19
pressed, as an alternative to deleting fnr or arcA to ensurethat metabolic activity is high enough to achieve thedesired level of ethanol production.
Genes involved in the electron transfer chain were alsoidentified as needing to be deleted to limit the amount ofNADH oxidized by this pathway. NADH:ubiquinone oxi-doreductase (NDH) I and II catalyze the transfer of elec-trons from NADH to the quinone pool, and the electronsare passed to fumarate by fumarate reductase (FRD), anessential enzyme for anaerobic growth. OptORF identi-fied the deletion of NDH-1 (nuo), the predominant NDHunder anaerobic conditions, to block electron transferfrom NADH to fumarate. As a result, the model predictsa decrease in FRD flux and reduced succinate productionin NDH-1 deficient strains, while flux through fumaraseand malic enzyme is increased.
Deletion of pgi was also found in many of the straindesigns for ethanol production, suggesting re-direction offlux through glycolysis to the pentose phosphate (PP)pathway or Entner-Doudoroff (ED) pathway. Thisincreases generation of NADPH whose electrons arepassed to NAD via NADH transhydrogenase, and theadditional NADH is used to reduce acetyl-CoA to ethanolby alcohol dehydrogenase (AdhE). While increasing theamount of NADH available to produce ethanol, the pgideletion also lowers the net ATP production and thusdecreases growth rate as compared to the wild-typestrain. The ED pathway consists of two enzymes, Edd andEda, and the expression of edd is repressed by the tran-scription factor GntR. Deletion of gntR would de-repressthe expression of edd, which allows for the conversion ofglucose to pyruvate and glyceraldehyde-3-phosphate.Equivalently, overexpression of edd was identified as analternative to deletion of gntR. The activation of the EDpathway in a pgi mutant also leads to a significantincrease in growth rate, which would be favorable forindustrial-scale ethanol production.
There are three enzymes, PflAB, PflCD and TdcE,which possibly function as pyruvate formate-lyase (PFL).The regulatory model indicates that expression of pflDrequires either ArcA or Fnr as activators, and a previousstudy showed that PFL activity was still detected in pflAor pflB mutant [28]. Another study revealed that a fnrdeletion alone is sufficient to decrease PFL activity downto the level of ΔfnrΔarcA strain, while an arcA deletionalone did not decrease PFL activity [29]. Thus, deletion offnr, pflB, and tdcE would abolish PFL activity and requirecells to use pyruvate dehydrogenase (PDH) [26,30],whose expression is repressed by Fnr and ArcA in anaer-obic conditions. Deletion of fnr would lower PFL activityand attenuate the repression of PDH, the result being theproduction of NADH instead of formate when pyruvate isconverted to acetyl-CoA. In the absence of oxygen, some
of the acetyl-CoA would be reduced to ethanol consum-ing two NADH molecules to maintain a redox balance.
Deletion of pta and eutD (both catalyze the conversionof acetyl-CoA to acetylphosphate) would reduce acetateproduction, and hence increase formation of other by-products such as ethanol, lactate, or succinate. However,multiple studies have shown that the mutations in theack-pta pathway cause accumulation of pyruvate [31-33],and the integrated metabolic and regulatory model pre-dicts the secretion of pyruvate (64% mol pyruvate/molglucose) in a ΔptaΔeutD mutant. Pyruvate can be eithersecreted or reduced to form other fermentation by-prod-ucts, but there is not enough NADH available to fermentall the pyruvate generated by glycolysis. In order to con-vert pyruvate to ethanol, arcA and gntR deletions areneeded to derepress PDH and the ED pathway, along witha pgi or tpiA deletion to re-direct flux from glycolysis tothe ED pathway. A ΔtpiA mutant alone could cause meth-ylglyoxal accumulation and inhibit the anaerobic growth[34], but re-directing flux to the ED pathway should pre-vent methylglyoxal accumulation.
In the strategies that include both gene deletion andgene overexpression, we found that overexpression of eddreplaced the gntR deletion in most strains to activate theED pathway. In addition, overexpression of fructose-1,6-bisphosphatase (fbp) was predicted to increase theamount of fructose-6-phosphate, and reverse the direc-tion of the non-oxidative branch of the PP pathway in thestrains utilizing the ED pathway. The reversed PP path-way results in a decreased flux in the TCA cycle and anincreased flux in the ED pathway and PDH, leading toimproved ethanol production. The model predicts thatptsH deletion (in addition to other modifications)increases flux through the lower half of glycolysis anddecreases succinate production. Switching glucose trans-port from the phosphoenolpyruvate:sugar phosphotrans-ferase system (PTS) to proton symport has been shown toimprove overall performance and production yield forethanol as well as other compounds [35].
Glutamate can be synthesized via multiple pathwaysdepending on the availability of nitrogen sources. Whenammonia is abundant, an ATP-independent pathwayfunctions to save energy by converting α-ketoglutarate toglutamate using NADPH. This pathway is encoded byglutamate dehydrogenase (gdhA), the deletion of whichwould require cells to use the ATP-dependent pathwaythat normally operates when the concentration of ammo-nia is low [36]. This ATP-dependent pathway woulddecrease growth rate, but increase the flux through theED pathway and PDH, and improve the ethanol produc-tion.
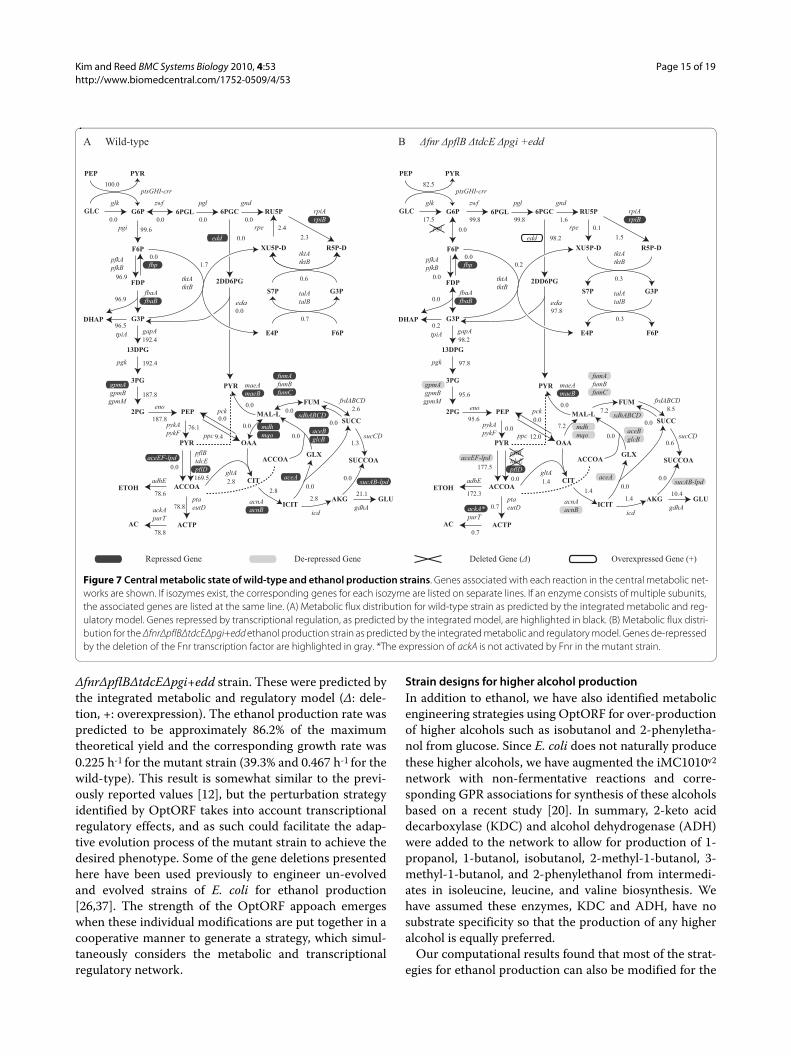
Predicted flux distributions corresponding to maxi-mum biomass production and gene expression states areshown in Figure 7 for both the wild-type and
Kim and Reed BMC Systems Biology 2010, 4:53http://www.biomedcentral.com/1752-0509/4/53
Page 15 of 19
ΔfnrΔpflBΔtdcEΔpgi+edd strain. These were predicted bythe integrated metabolic and regulatory model (Δ: dele-tion, +: overexpression). The ethanol production rate waspredicted to be approximately 86.2% of the maximumtheoretical yield and the corresponding growth rate was0.225 h-1 for the mutant strain (39.3% and 0.467 h-1 for thewild-type). This result is somewhat similar to the previ-ously reported values [12], but the perturbation strategyidentified by OptORF takes into account transcriptionalregulatory effects, and as such could facilitate the adap-tive evolution process of the mutant strain to achieve thedesired phenotype. Some of the gene deletions presentedhere have been used previously to engineer un-evolvedand evolved strains of E. coli for ethanol production[26,37]. The strength of the OptORF appoach emergeswhen these individual modifications are put together in acooperative manner to generate a strategy, which simul-taneously considers the metabolic and transcriptionalregulatory network.
Strain designs for higher alcohol productionIn addition to ethanol, we have also identified metabolicengineering strategies using OptORF for over-productionof higher alcohols such as isobutanol and 2-phenyletha-nol from glucose. Since E. coli does not naturally producethese higher alcohols, we have augmented the iMC1010v2
network with non-fermentative reactions and corre-sponding GPR associations for synthesis of these alcoholsbased on a recent study [20]. In summary, 2-keto aciddecarboxylase (KDC) and alcohol dehydrogenase (ADH)were added to the network to allow for production of 1-propanol, 1-butanol, isobutanol, 2-methyl-1-butanol, 3-methyl-1-butanol, and 2-phenylethanol from intermedi-ates in isoleucine, leucine, and valine biosynthesis. Wehave assumed these enzymes, KDC and ADH, have nosubstrate specificity so that the production of any higheralcohol is equally preferred.
Our computational results found that most of the strat-egies for ethanol production can also be modified for the
Figure 7 Central metabolic state of wild-type and ethanol production strains. Genes associated with each reaction in the central metabolic net-works are shown. If isozymes exist, the corresponding genes for each isozyme are listed on separate lines. If an enzyme consists of multiple subunits, the associated genes are listed at the same line. (A) Metabolic flux distribution for wild-type strain as predicted by the integrated metabolic and reg-ulatory model. Genes repressed by transcriptional regulation, as predicted by the integrated model, are highlighted in black. (B) Metabolic flux distri-bution for the ΔfnrΔpflBΔtdcEΔpgi+edd ethanol production strain as predicted by the integrated metabolic and regulatory model. Genes de-repressed by the deletion of the Fnr transcription factor are highlighted in gray. *The expression of ackA is not activated by Fnr in the mutant strain.
G6P
F6P
G3P
PEP
PYR
FDP
3PG
6PGC RU5P
XU5P-D R5P-D
G3PS7P
F6PE4P
GLX
ICITAKG
SUCCOA
SUCC
ACCOACIT
FUM
MAL-L
OAA
PYR
AC
DHAP
ACCOA
ETOH
6PGL
2DD6PG
ACTP
GLC
PEP PYR
13DPG
2PG
GLU
0.11.6
0.0
0.0
0.0
97.8
0.0
95.60.0
99.8
1.4
98.2
0.3
0.3
0.2
1.5
0.0
12.0
1.4
0.0
0.6
7.2
7.2
0.0
0.0
0.7
0.2
0.0
99.8
97.8
98.2
172.3
177.5
0.0
95.6
82.5
17.5
0.7
1.4 10.4
8.5
0.0
rpe
gnd
pgi
pfkApfkB
fbaAfbaB
gapA
fbp
eno
pykApykF
pgl
gltA
edd
talAtalB
tktAtktB
tktAtktB
rpiArpiB
pck
ppc
icd
sucAB-lpd
sucCD
sdhABCD
mdhmqo
fumAfumBfumC
aceA
maeAmaeB
ptaeutD
tpiA
aceBglcB
zwf
pgk
eda
adhE
aceEF-lpdpflBtdcEpflD
gpmAgpmBgpmM
ptsGHI-crr
glk
ackA*purT
acnAacnB gdhA
frdABCD
G6P
F6P
G3P
PEP
PYR
FDP
3PG
6PGC RU5P
XU5P-D R5P-D
G3PS7P
F6PE4P
GLX
ICITAKG
SUCCOA
SUCC
ACCOACIT
FUM
MAL-L
OAA
PYR
AC
DHAP
ACCOA
ETOH
6PGL
2DD6PG
ACTP
GLC
PEP PYR
13DPG
2PG
GLU
2.40.0
99.6
96.9
96.9
0.0
0.0
187.876.1
0.0
2.8
0.0
0.7
0.6
1.7
2.3
0.0
9.4
2.8
0.0
1.3
0.0
0.0
0.0
0.0
78.8
96.5
0.0
0.0
192.4
192.4
78.6
0.0
169.5
187.8
100.0
0.0
78.8
2.8 21.1
2.6
0.0
rpe
gnd
pgi
pfkApfkB
fbaAfbaB
gapA
fbp
eno
pykApykF
pgl
gltA
edd
talAtalB
tktAtktB
tktAtktB
rpiArpiB
pck
ppc
icd
sucAB-lpd
sucCD
sdhABCD
mdhmqo
fumAfumBfumC
aceA
maeAmaeB
ptaeutD
tpiA
aceBglcB
zwf
pgk
eda
adhE
aceEF-lpdpflBtdcEpflD
gpmAgpmBgpmM
ptsGHI-crr
glk
ackApurT
acnAacnB gdhA
frdABCD
Repressed Gene De-repressed Gene Deleted Gene (Δ) Overexpressed Gene (+)
A BWild-type Δfnr ΔpflB ΔtdcE Δpgi +edd
Kim and Reed BMC Systems Biology 2010, 4:53http://www.biomedcentral.com/1752-0509/4/53
Page 16 of 19
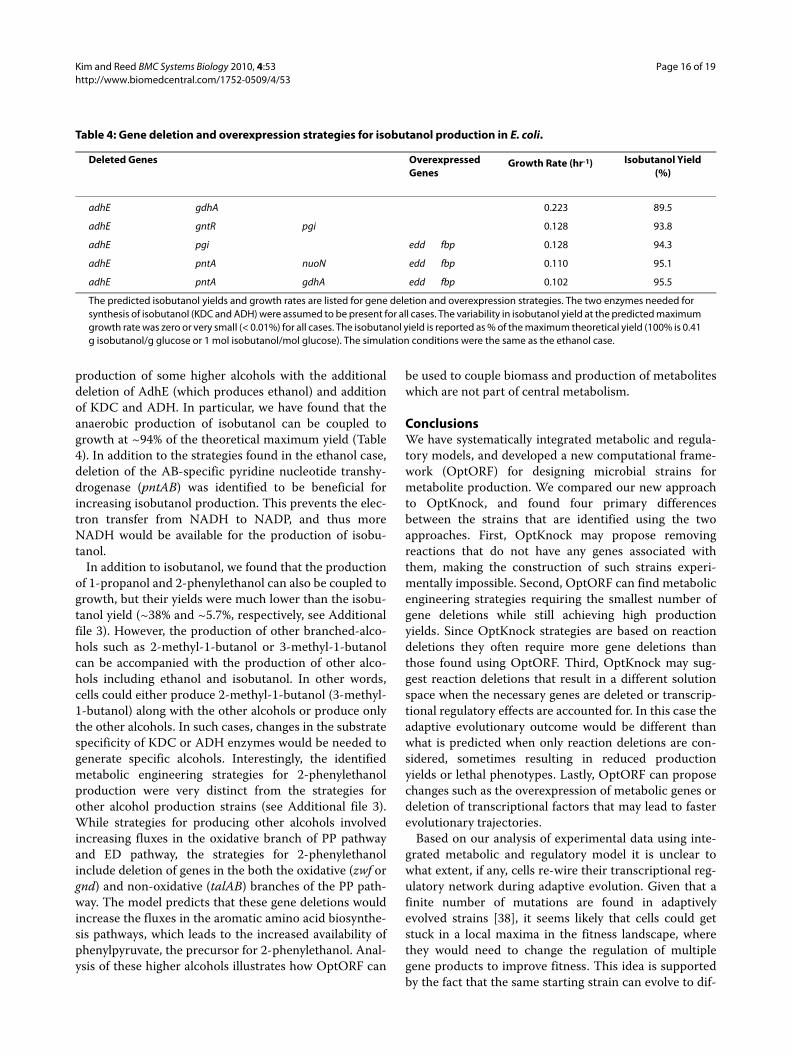
production of some higher alcohols with the additionaldeletion of AdhE (which produces ethanol) and additionof KDC and ADH. In particular, we have found that theanaerobic production of isobutanol can be coupled togrowth at ~94% of the theoretical maximum yield (Table4). In addition to the strategies found in the ethanol case,deletion of the AB-specific pyridine nucleotide transhy-drogenase (pntAB) was identified to be beneficial forincreasing isobutanol production. This prevents the elec-tron transfer from NADH to NADP, and thus moreNADH would be available for the production of isobu-tanol.
In addition to isobutanol, we found that the productionof 1-propanol and 2-phenylethanol can also be coupled togrowth, but their yields were much lower than the isobu-tanol yield (~38% and ~5.7%, respectively, see Additionalfile 3). However, the production of other branched-alco-hols such as 2-methyl-1-butanol or 3-methyl-1-butanolcan be accompanied with the production of other alco-hols including ethanol and isobutanol. In other words,cells could either produce 2-methyl-1-butanol (3-methyl-1-butanol) along with the other alcohols or produce onlythe other alcohols. In such cases, changes in the substratespecificity of KDC or ADH enzymes would be needed togenerate specific alcohols. Interestingly, the identifiedmetabolic engineering strategies for 2-phenylethanolproduction were very distinct from the strategies forother alcohol production strains (see Additional file 3).While strategies for producing other alcohols involvedincreasing fluxes in the oxidative branch of PP pathwayand ED pathway, the strategies for 2-phenylethanolinclude deletion of genes in the both the oxidative (zwf orgnd) and non-oxidative (talAB) branches of the PP path-way. The model predicts that these gene deletions wouldincrease the fluxes in the aromatic amino acid biosynthe-sis pathways, which leads to the increased availability ofphenylpyruvate, the precursor for 2-phenylethanol. Anal-ysis of these higher alcohols illustrates how OptORF can
be used to couple biomass and production of metaboliteswhich are not part of central metabolism.
ConclusionsWe have systematically integrated metabolic and regula-tory models, and developed a new computational frame-work (OptORF) for designing microbial strains formetabolite production. We compared our new approachto OptKnock, and found four primary differencesbetween the strains that are identified using the twoapproaches. First, OptKnock may propose removingreactions that do not have any genes associated withthem, making the construction of such strains experi-mentally impossible. Second, OptORF can find metabolicengineering strategies requiring the smallest number ofgene deletions while still achieving high productionyields. Since OptKnock strategies are based on reactiondeletions they often require more gene deletions thanthose found using OptORF. Third, OptKnock may sug-gest reaction deletions that result in a different solutionspace when the necessary genes are deleted or transcrip-tional regulatory effects are accounted for. In this case theadaptive evolutionary outcome would be different thanwhat is predicted when only reaction deletions are con-sidered, sometimes resulting in reduced productionyields or lethal phenotypes. Lastly, OptORF can proposechanges such as the overexpression of metabolic genes ordeletion of transcriptional factors that may lead to fasterevolutionary trajectories.
Based on our analysis of experimental data using inte-grated metabolic and regulatory model it is unclear towhat extent, if any, cells re-wire their transcriptional reg-ulatory network during adaptive evolution. Given that afinite number of mutations are found in adaptivelyevolved strains [38], it seems likely that cells could getstuck in a local maxima in the fitness landscape, wherethey would need to change the regulation of multiplegene products to improve fitness. This idea is supportedby the fact that the same starting strain can evolve to dif-
Table 4: Gene deletion and overexpression strategies for isobutanol production in E. coli.
Deleted Genes Overexpressed Genes
Growth Rate (hr-1) Isobutanol Yield (%)
adhE gdhA 0.223 89.5
adhE gntR pgi 0.128 93.8
adhE pgi edd fbp 0.128 94.3
adhE pntA nuoN edd fbp 0.110 95.1
adhE pntA gdhA edd fbp 0.102 95.5
The predicted isobutanol yields and growth rates are listed for gene deletion and overexpression strategies. The two enzymes needed for synthesis of isobutanol (KDC and ADH) were assumed to be present for all cases. The variability in isobutanol yield at the predicted maximum growth rate was zero or very small (< 0.01%) for all cases. The isobutanol yield is reported as % of the maximum theoretical yield (100% is 0.41 g isobutanol/g glucose or 1 mol isobutanol/mol glucose). The simulation conditions were the same as the ethanol case.

Kim and Reed BMC Systems Biology 2010, 4:53http://www.biomedcentral.com/1752-0509/4/53
Page 17 of 19
ferent end points, and in some cases achieve only sub-optimal behaviors [9,39,40]. By taking regulatory effectsinto account when designing strains it may be possible tostart with strains that are already expressing the neces-sary enzymes needed to achieve the desired productionand growth rates. Some evolved strains may stay withinthe solution space defined by metabolic and regulatoryconstraints, while others may alter their regulatory net-works if it results in a significant growth advantage, thusaltering the solution space in which they evolve. Thus, itwill be particularly important to conduct parallel evolu-tionary experiments to find evolved strains that lead tohigher production without violating regulatory con-straints.
In its current implementation, OptORF uses Booleanapproximations to describe how transcriptional regula-tion affects metabolic fluxes. Although the use of Booleanvariables do not exactly represent the dynamic nature ofmetabolism and regulation, it has been previously shownthat constraint-based models using these approximationssuccessfully predict the cellular behavior in continuousand batch culture [1,19,21,24]. The approach could beextended to include other types of regulatory modelswhich can account for varying levels of gene expressionor enzyme activity. A previous study has shown that thebehavior of a transcriptional regulatory network can bewell approximated by a system of linear equations near asteady-state, where gene expression does not substan-tially change [41]. The OptORF approach could beimproved by applying these linear approximations in theregulatory part of the model, in order to describe varyinggene expression levels, and using approaches to constrainmetabolic fluxes based on predicted gene expression lev-els [42-44].
The OptORF approach is currently applied to producemetabolites that can be coupled to biomass production. Arecent study has used a genetic algorithm to designstrains with un-coupled metabolite and biomass produc-tion, where a bi-level problem is used and the inner prob-lem uses an objective function to predict un-evolvedcellular phenotypes [45]. OptORF could also be extendedto find metabolic engineering strategies that do notrequire coupling of cellular growth and product forma-tion, and would evaluate gene deletions, gene overexpres-sion, and regulatory effects simultaneously to identifysuch strategies.
The novelty of the method developed here is that itaccounts for transcriptional regulatory networks in addi-tion to metabolism in the design of strains for metabolicengineering. However if desired, the approach can beused with and without transcriptional regulatory con-straints to consider the interdependence of reactionsthrough their GPR associations. It should be noted thatthe integrated model of metabolism and regulation allows
for simulating the effects of both gene overexpression(where un-expressed genes are expressed) and gene dele-tion. The OptORF approach can also suggest transcrip-tion factor deletion as an alternative to metabolic genedeletion or overexpression, which provides greater flexi-bility in metabolic engineering strategies. By furtherincorporating flux modulation approaches such as thoseproposed in OptReg [12], additional engineering strate-gies can be designed which consider adjustment of fluxvalues and not just the complete removal/addition ofreactions via gene deletion or gene overexpression.
The approach we have developed here is general andcan be used to engineer production of a variety of prod-ucts in different microorganisms, for which constraint-based models exist. The number of microbial transcrip-tional regulatory network models continues to grow,which has been enabled by high-throughput datasets andcomputational analysis [46-52]. Regulatory networksreconstructed from analysis of high-throughput datasetscan be integrated with metabolic networks using Booleanor other types of regulatory modeling formalisms, andour approach can applied to new integrated models ofmetabolism and regulation. As such, it will have impactson the biological production of a wide variety of prod-ucts, ranging from biofuels and other commodity chemi-cals to specialty chemicals [53-55].
Additional material
Authors' contributionsJK implemented the model and approach, performed the analysis, and draftedthe manuscript. JLR conceived of the study, participated in its design and coor-dination, and helped to analyze the data and draft the manuscript. All authorsread and approved the final manuscript.
AcknowledgementsThis work was funded by the DOE Great Lakes Bioenergy Research Center (DOE BER Office of Science DE-FC02-07ER64494). The authors also wish to acknowl-edge Bob Landick, Tricia Kiley, Brian Pfleger, and Christos Maravelias for useful discussions and Chris Tervo for help editing the manuscript.
Author Details1Department of Chemical and Biological Engineering, University of Wisconsin-Madison, Madison, WI 53706, USA and 2DOE Great Lakes Bioenergy Research Center, University of Wisconsin-Madison, Madison, WI 53706, USA
Additional file 1 Implementation of OptORF for the example net-work. The OptORF approach is implemented in the General Algebraic Modeling System (GAMS). A free demo version of GAMS can be down-loaded from http://www.gams.com. This file contains the example network described in Figure 1.Additional file 2 List of strain designs for ethanol production. This spreadsheet contains the list of strain designs described in Figures 3 and 5, and corresponding growth rates and ethanol production yields.
Additional file 3 List of strain designs for higher alcohol production. This spreadsheet contains the list of strain designs for 1-propanol, isobu-tanol, 2-methyl-1-butanol, 3-methyl-1-butanol, and 2-phenylethanol.
Received: 11 December 2009 Accepted: 28 April 2010 Published: 28 April 2010This article is available from: http://www.biomedcentral.com/1752-0509/4/53© 2010 Kim and Reed; licensee BioMed Central Ltd. This is an Open Access article distributed under the terms of the Creative Commons Attribution License (http://creativecommons.org/licenses/by/2.0), which permits unrestricted use, distribution, and reproduction in any medium, provided the original work is properly cited.BMC Systems Biology 2010, 4:53
Kim and Reed BMC Systems Biology 2010, 4:53http://www.biomedcentral.com/1752-0509/4/53
Page 18 of 19
References1. Fong SS, Palsson BØ: Metabolic gene-deletion strains of Escherichia coli
evolve to computationally predicted growth phenotypes. Nat Genet 2004, 36:1056-1058.
2. Segrè D, Vitkup D, Church GM: Analysis of optimality in natural and perturbed metabolic networks. Proc Natl Acad Sci USA 2002, 99:15112-15117.
3. Shlomi T, Berkman O, Ruppin E: Regulatory on/off minimization of metabolic flux changes after genetic perturbations. Proc Natl Acad Sci USA 2005, 102:7695-7700.
4. Schuetz R, Kuepfer L, Sauer U: Systematic evaluation of objective functions for predicting intracellular fluxes in Escherichia coli. Mol Syst Biol 2007, 3:119.
5. Pharkya P, Burgard AP, Maranas CD: OptStrain: A computational framework for redesign of microbial production systems. Genome Res 2004, 14:2367-2376.
6. Park JH, Lee KH, Kim TY, Lee SY: Metabolic engineering of Escherichia coli for the production of l-valine based on transcriptome analysis and in silico gene knockout simulation. Proc Natl Acad Sci USA 2007, 104:7797-7802.
7. Alper H, Miyaoku K, Stephanopoulos G: Construction of lycopene-overproducing E. coli strains by combining systematic and combinatorial gene knockout targets. Nat Biotechnol 2005, 23:612-616.
8. Burgard AP, Pharkya P, Maranas CD: Optknock: A bilevel programming framework for identifying gene knockout strategies for microbial strain optimization. Biotechnol Bioeng 2003, 84:647-657.
9. Fong SS, Burgard AP, Herring CD, Knight EM, Blattner FR, Maranas CD, Palsson BØ: In silico design and adaptive evolution of Escherichia coli for production of lactic acid. Biotechnol Bioeng 2005, 91:643-648.
10. Burgard AP, Van Dien SJ: Methods and organisms for the growth-coupled production of succinate. Patent 2007. WO/2007/030830
11. Patil K, Rocha I, Forster J, Nielsen J: Evolutionary programming as a platform for in silico metabolic engineering. BMC Bioinformatics 2005, 6:308.
12. Pharkya P, Maranas CD: An optimization framework for identifying reaction activation/inhibition or elimination candidates for overproduction in microbial systems. Metab Eng 2006, 8:1-13.
13. Lun DS, Rockwell G, Guido NJ, Baym M, Kelner JA, Berger B, Galagan JE, Church GM: Large-scale identification of genetic design strategies using local search. Mol Syst Biol 2009, 5:296.
14. Covert MW, Palsson BØ: Transcriptional regulation in constraints-based metabolic models of Escherichia coli. J Biol Chem 2002, 277:28058-28064.
15. Shlomi T, Eisenberg Y, Sharan R, Ruppin E: A genome-scale computational study of the interplay between transcriptional regulation and metabolism. Mol Syst Biol 2007, 3:101.
16. Gianchandani EP, Joyce AR, Palsson BØ, Papin JA: Functional states of the genome-scale Escherichia Coli transcriptional regulatory system. PLoS Comput Biol 2009, 5:e1000403.
17. Suthers PF, Zomorrodi A, Maranas CD: Genome-scale gene/reaction essentiality and synthetic lethality analysis. Mol Syst Biol 2009, 5:301.
18. Reed JL, Vo TD, Schilling CH, Palsson BØ: An expanded genome-scale model of Escherichia coli K-12 (iJR904 GSM/GPR). Genome Biol 2003, 4:R54.
19. Covert MW, Knight EM, Reed JL, Herrgard MJ, Palsson BØ: Integrating high-throughput and computational data elucidates bacterial networks. Nature 2004, 429:92-96.
20. Atsumi S, Hanai T, Liao JC: Non-fermentative pathways for synthesis of branched-chain higher alcohols as biofuels. Nature 2008, 451:86-89.
21. Varma A, Palsson BØ: Stoichiometric flux balance models quantitatively predict growth and metabolic by-product secretion in wild-type Escherichia coli W3110. Appl Environ Microbiol 1994, 60:3724-3731.
22. Zhao G, Winkler ME: An Escherichia coli K-12 tktA tktB mutant deficient in transketolase activity requires pyridoxine (vitamin B6) as well as the aromatic amino acids and vitamins for growth. J Bacteriol 1994, 176:6134-6138.
23. Feist AM, Henry CS, Reed JL, Krummenacker M, Joyce AR, Karp PD, Broadbelt LJ, Hatzimanikatis V, Palsson BØ: A genome-scale metabolic reconstruction for Escherichia coli K-12 MG1655 that accounts for 1260 ORFs and thermodynamic information. Mol Syst Biol 2007, 3:121.
24. Joyce AR, Reed JL, White A, Edwards R, Osterman A, Baba T, Mori H, Lesely SA, Palsson BØ, Agarwalla S: Experimental and computational
assessment of conditionally essential genes in Escherichia coli. J Bacteriol 2006, 188:8259-8271.
25. Baba T, Ara T, Hasegawa M, Takai Y, Okumura Y, Baba M, Datsenko KA, Tomita M, Wanner BL, Mori H: Construction of Escherichia coli K-12 in-frame, single-gene knockout mutants: the Keio collection. Mol Syst Biol 2006, 2:. 2006.0008
26. Kim Y, Ingram LO, Shanmugam KT: Construction of an Escherichia coli K-12 mutant for homoethanologenic fermentation of glucose or xylose without foreign genes. Appl Environ Microbiol 2007, 73:1766-1771.
27. Hespell RB, Wyckoff H, Dien BS, Bothast RJ: Stabilization of pet operon plasmids and ethanol production in Escherichia coli strains lacking lactate dehydrogenase and pyruvate formate-lyase activities. Appl Environ Microbiol 1996, 62:4594-4597.
28. Zhu J, Shimizu K: The effect of pfl gene knockout on the metabolism for optically pure D-lactate production by Escherichia coli. Appl Microbiol Biotechnol 2004, 64:367-375.
29. Levanon SS, San K-Y, Bennett GN: Effect of oxygen on the Escherichia coli ArcA and FNR regulation systems and metabolic responses. Biotechnol Bioeng 2005, 89:556-564.
30. Kim Y, Ingram LO, Shanmugam KT: Dihydrolipoamide dehydrogenase mutation alters the NADH sensitivity of pyruvate dehydrogenase complex of Escherichia coli K-12. J Bacteriol 2008, 190:3851-3858.
31. Tomar A, Eiteman MA, Altman E: The effect of acetate pathway mutations on the production of pyruvate in Escherichia coli. Appl Microbiol Biotechnol 2003, 62:76-82.
32. Causey TB, Shanmugam KT, Yomano LP, Ingram LO: Engineering Escherichia coli for efficient conversion of glucose to pyruvate. Proc Natl Acad Sci USA 2004, 101:2235-2240.
33. Dittrich CR, Vadali RV, Bennett GN, San K-Y: Redistribution of metabolic fluxes in the central aerobic metabolic pathway of E. coli mutant strains with deletion of the ackA-pta and poxB pathways for the synthesis of isoamyl acetate. Biotechnol Progr 2005, 21:627-631.
34. Ferguson GP, Tötemeyer S, MacLean MJ, Booth IR: Methylglyoxal production in bacteria: suicide or survival? Arch Microbiol 1998, 170:209-218.
35. Gosset G: Improvement of Escherichia coli production strains by modification of the phosphoenolpyruvate:sugar phosphotransferase system. Microb Cell Fact 2005, 4:14.
36. Helling RB: Why does Escherichia coli have two primary pathways for synthesis of glutamate? J Bacteriol 1994, 176:4664-4668.
37. Trinh CT, Unrean P, Srienc F: Minimal Escherichia coli Cell for the Most Efficient Production of Ethanol from Hexoses and Pentoses. Appl Environ Microbiol 2008, 74:3634-3643.
38. Herring CD, Raghunathan A, Honisch C, Patel T, Applebee MK, Joyce AR, Albert TJ, Blattner FR, Boom D van den, Cantor CR, Palsson BO: Comparative genome sequencing of Escherichia coli allows observation of bacterial evolution on a laboratory timescale. Nat Genet 2006, 38:1406-1412.
39. Fong SS, Marciniak JY, Palsson BØ: Description and interpretation of adaptive evolution of Escherichia coli K-12 MG1655 by using a genome-scale in silico metabolic model. J Bacteriol 2003, 185:6400-6408.
40. Fong SS, Joyce AR, Palsson BØ: Parallel adaptive evolution cultures of Escherichia coli lead to convergent growth phenotypes with different gene expression states. Genome Res 2005, 15:1365-1372.
41. Gardner TS, di Bernardo D, Lorenz D, Collins JJ: Inferring genetic networks and identifying compound mode of action via expression profiling. Science 2003, 301:102-105.
42. Colijn C, Brandes A, Zucker J, Lun DS, Weiner B, Farhat MR, Cheng TY, Moody DB, Murray M, Galagan JE: Interpreting expression data with metabolic flux models: predicting Mycobacterium tuberculosis mycolic acid production. PLoS Comput Biol 2009, 5:e1000489.
43. Shlomi T, Cabili MN, Herrgard MJ, Palsson BO, Ruppin E: Network-based prediction of human tissue-specific metabolism. Nat Biotechnol 2008, 26:1003-1010.
44. Moxley JF, Jewett MC, Antoniewicz MR, Villas-Boas SG, Alper H, Wheeler RT, Tong L, Hinnebusch AG, Ideker T, Nielsen J, Stephanopoulos G: Linking high-resolution metabolic flux phenotypes and transcriptional regulation in yeast modulated by the global regulator Gcn4p. Proc Natl Acad Sci USA 2009, 106:6477-6482.
45. Asadollahi MA, Maury J, Patil KR, Schalk M, Clark A, Nielsen J: Enhancing sesquiterpene production in Saccharomyces cerevisiae through in silico driven metabolic engineering. Metab Eng 2009, 11:328-334.
http://www.ncbi.nlm.nih.gov/entrez/query.fcgi?cmd=Retrieve&db=PubMed&dopt=Abstract&list_uids=7986045
http://www.ncbi.nlm.nih.gov/entrez/query.fcgi?cmd=Retrieve&db=PubMed&dopt=Abstract&list_uids=7928977
http://www.ncbi.nlm.nih.gov/entrez/query.fcgi?cmd=Retrieve&db=PubMed&dopt=Abstract&list_uids=8953729
http://www.ncbi.nlm.nih.gov/entrez/query.fcgi?cmd=Retrieve&db=PubMed&dopt=Abstract&list_uids=9732434

Kim and Reed BMC Systems Biology 2010, 4:53http://www.biomedcentral.com/1752-0509/4/53
Page 19 of 19
46. Rodionov DA: Comparative genomic reconstruction of transcriptional regulatory networks in bacteria. Chem Rev 2007, 107:3467-3497.
47. Barrett CL, Palsson BO: Iterative reconstruction of transcriptional regulatory networks: an algorithmic approach. PLoS Comput Biol 2006, 2:e52.
48. Rodriguez-Penagos C, Salgado H, Martinez-Flores I, Collado-Vides J: Automatic reconstruction of a bacterial regulatory network using Natural Language Processing. BMC Bioinformatics 2007, 8:293.
49. Baumbach J, Rahmann S, Tauch A: Reliable transfer of transcriptional gene regulatory networks between taxonomically related organisms. BMC Syst Biol 2009, 3:8.
50. Faith JJ, Hayete B, Thaden JT, Mogno I, Wierzbowski J, Cottarel G, Kasif S, Collins JJ, Gardner TS: Large-scale mapping and validation of Escherichia coli transcriptional regulation from a compendium of expression profiles. PLoS Biol 2007, 5:e8.
51. Zhang S, Xu M, Li S, Su Z: Genome-wide de novo prediction of cis-regulatory binding sites in prokaryotes. Nucleic Acids Res 2009, 37:e72.
52. Wang T, Stormo GD: Identifying the conserved network of cis-regulatory sites of a eukaryotic genome. Proc Natl Acad Sci USA 2005, 102:17400-17405.
53. Khosla C, Keasling JD: Metabolic engineering for drug discovery and development. Nat Rev Drug Discov 2003, 2:1019-1025.
54. Feist AM, Palsson BØ: The growing scope of applications of genome-scale metabolic reconstructions using Escherichia coli. Nat Biotechnol 2008, 26:659-667.
55. Alper H, Stephanopoulos G: Engineering for biofuels: exploiting innate microbial capacity or importing biosynthetic potential? Nat Rev Microbiol 2009, 7:715-723.
doi: 10.1186/1752-0509-4-53Cite this article as: Kim and Reed, OptORF: Optimal metabolic and regula-tory perturbations for metabolic engineering of microbial strains BMC Sys-tems Biology 2010, 4:53