Optoelectrofluidic Sandwich Immunoassays for Detection...
8
Optoelectrofluidic Sandwich Immunoassays for Detection of Human Tumor Marker Using Surface-Enhanced Raman Scattering Hyundoo Hwang, † Hyangah Chon, ‡ Jaebum Choo,* ,‡ and Je-Kyun Park* ,†,§ Department of Bio and Brain Engineering, Korea Advanced Institute of Science and Technology (KAIST), 335 Gwahangno, Yuseong-gu, Daejeon 305-701, Republic of Korea, Department of Bionano Engineering, Hanyang University, 1271 Sa-1-dong, Sangnok-gu, Ansan, Kyeonggi-do 426-791, Republic of Korea, and KAIST Institute for the NanoCentury, 335 Gwahangno, Yuseong-gu, Daejeon 305-701, Republic of Korea A sandwich immunoassay is a powerful tool for identifying a specific substance in a biological sample. However, its heterogeneous strategy always requires repetitive liquid handlings and long processing time. Here an optoelec- trofluidic immunoassay platform for simple, fast, and automated detection of human tumor marker based on surface-enhanced Raman scattering (SERS) has been developed. By using a conventional optoelectrofluidic device and a liquid crystal display module, simple and quantitative detection of human tumor marker, alpha- fetoprotein, in a ∼500 nL sample droplet has been automatically conducted with lower detection limit of about 0.1 ng/mL within 5 min. This study depicts the first practical application, for protein detection, of the opto- electrofluidic manipulation technology. This image-driven immunoassay platform opens a new way for simple, fast, automated, and highly sensitive detection of antigens. Immunoassay, which is based on a specific interaction between an antigen and a complementary antibody, has become an important analytical tool for identifying and quantifying a specific substance in a liquid sample. In several fields such as clinical diagnosis, biochemical analysis, and environmental monitoring, many kinds of techniques, such as fluorescence, chemilumines- cence, electrochemical methods, surface plasmon resonance, and enzyme-linked immunosorbent assay (ELISA), have been utilized to measure the antigens binding to its complementary antibodies. Recently, surface-enhanced Raman scattering (SERS) has also been applied to the immunoassays. 1-3 Among several kinds of SERS-based immunoassay methods, a sandwich immunoassay using metal nanoparticles labeled by a Raman-active probe has been most widely used because of its remarkable SERS-enhance- ment ability and good biocompatibility. Here, a sandwich immu- nocomplex is formed by immunoreaction between an antigen captured by antibodies immobilized on a solid substrate and probe- labeled metal nanoparticles. Then the antigen concentration can be indirectly determined by measuring the Raman intensity of the probe-labeled metal nanoparticles, which constitute the im- munocomplexes in “sandwich” form. For all the measurement techniques for the immunoassay including the SERS-based methods, this heterogeneous strategy always requires repetitive washing steps for separating antibody- bound and free proteins. In addition, a long incubation time is required for antibody-antigen binding reactions, which is limited by diffusion transport of molecules or nanoparticles. As a consequence, the manually conducted processes of a typical heterogeneous immunoassay, which involves multiple cycles of incubation and washing steps, usually take several hours and are labor-intensive. To deal these problems of a traditional immu- noassay, many kinds of fully automated immunoassay analyzers, which can perform a various tests on a series of samples and process several batches simultaneously, have been commercial- ized. The automated systems usually take several tens of minutes for performing all steps, including sample dilution, dispensing, incubation, washing, and reading without manual handling of liquids except during the step for sample injection. However, the commercialized immunoassay instruments still have some limita- tions that they require massive and complicated constructions of robotic components and several hundreds of microliter sample volumes. Recently, microfluidic devices have also been applied for simple and rapid immunoassays in miniaturized system with small sample volumes. 4-6 Previous microfluidic immunoassay platforms, however, also require troublesome fluidic components, and yield large amount of dead volumes and many disposables. Optoelectrofluidics, which is based on the electrokinetic motion of particles or fluids under an electric field induced by light, has attracted a great interest from many researchers in various fields of science and engineering. There are three well-known methods to optically induce electrokinetic motions in a fluid: (1) electro- thermal vortex due to the thermal gradient induced by focusing * To whom correspondence should be addressed. Fax: +82-42-350-4310. E-mail: [email protected](J.-K.P.); [email protected]. (J.C.). † Korea Advanced Institute of Science and Technology (KAIST). ‡ Hanyang University. § KAIST Institute for the NanoCentury. (1) Porter, M. D.; Lipert, R. J.; Siperko, L. M.; Wang, G.; Narayanan, R. Chem. Soc. Rev. 2008, 37, 1001–1011. (2) Han, X.; Zhao, B.; Ozaki, Y. Anal. Bioanal. Chem. 2009, 6, 285–297. (3) Chon, H.; Lee, S.; Son, S. W.; Oh, C. H.; Choo, J. Anal. Chem. 2009, 81, 3029–3034. (4) Jiang, X.; Ng, J. M. K.; Stroock, A. D.; Dertinger, S. K. W.; Whitesides, G. M. J. Am. Chem. Soc. 2003, 125, 5294–5295. (5) Yager, P.; Edwards, T.; Fu, E.; Helton, K.; Nelson, K.; Tam, M. R.; Weigl, B. H. Nature 2006, 442, 412–418. (6) Fan, R.; Vermesh, O.; Srivastava, A.; Yen, B. K. H.; Qin, L.; Ahmad, H.; Kwong, G. A.; Liu, C. C.; Gould, J.; Hood, L. Nat. Biotechnol. 2008, 26, 1373–1378. Anal. Chem. 2010, 82, 7603–7610 10.1021/ac101325t 2010 American Chemical Society 7603 Analytical Chemistry, Vol. 82, No. 18, September 15, 2010 Published on Web 08/24/2010
-
Upload
truongtuong -
Category
Documents
-
view
220 -
download
0
Transcript of Optoelectrofluidic Sandwich Immunoassays for Detection...
Optoelectrofluidic Sandwich Immunoassays forDetection of Human Tumor Marker UsingSurface-Enhanced Raman Scattering
Hyundoo Hwang,† Hyangah Chon,‡ Jaebum Choo,*,‡ and Je-Kyun Park*,†,§
Department of Bio and Brain Engineering, Korea Advanced Institute of Science and Technology (KAIST),335 Gwahangno, Yuseong-gu, Daejeon 305-701, Republic of Korea, Department of Bionano Engineering, HanyangUniversity, 1271 Sa-1-dong, Sangnok-gu, Ansan, Kyeonggi-do 426-791, Republic of Korea, and KAIST Institute forthe NanoCentury, 335 Gwahangno, Yuseong-gu, Daejeon 305-701, Republic of Korea
A sandwich immunoassay is a powerful tool for identifyinga specific substance in a biological sample. However, itsheterogeneous strategy always requires repetitive liquidhandlings and long processing time. Here an optoelec-trofluidic immunoassay platform for simple, fast, andautomated detection of human tumor marker based onsurface-enhanced Raman scattering (SERS) has beendeveloped. By using a conventional optoelectrofluidicdevice and a liquid crystal display module, simple andquantitative detection of human tumor marker, alpha-fetoprotein, in a ∼500 nL sample droplet has beenautomatically conducted with lower detection limit ofabout 0.1 ng/mL within 5 min. This study depicts the firstpractical application, for protein detection, of the opto-electrofluidic manipulation technology. This image-drivenimmunoassay platform opens a new way for simple, fast,automated, and highly sensitive detection of antigens.
Immunoassay, which is based on a specific interaction betweenan antigen and a complementary antibody, has become animportant analytical tool for identifying and quantifying a specificsubstance in a liquid sample. In several fields such as clinicaldiagnosis, biochemical analysis, and environmental monitoring,many kinds of techniques, such as fluorescence, chemilumines-cence, electrochemical methods, surface plasmon resonance, andenzyme-linked immunosorbent assay (ELISA), have been utilizedto measure the antigens binding to its complementary antibodies.Recently, surface-enhanced Raman scattering (SERS) has alsobeen applied to the immunoassays.1-3 Among several kinds ofSERS-based immunoassay methods, a sandwich immunoassayusing metal nanoparticles labeled by a Raman-active probe hasbeen most widely used because of its remarkable SERS-enhance-ment ability and good biocompatibility. Here, a sandwich immu-nocomplex is formed by immunoreaction between an antigen
captured by antibodies immobilized on a solid substrate and probe-labeled metal nanoparticles. Then the antigen concentration canbe indirectly determined by measuring the Raman intensity ofthe probe-labeled metal nanoparticles, which constitute the im-munocomplexes in “sandwich” form.
For all the measurement techniques for the immunoassayincluding the SERS-based methods, this heterogeneous strategyalways requires repetitive washing steps for separating antibody-bound and free proteins. In addition, a long incubation time isrequired for antibody-antigen binding reactions, which is limitedby diffusion transport of molecules or nanoparticles. As aconsequence, the manually conducted processes of a typicalheterogeneous immunoassay, which involves multiple cycles ofincubation and washing steps, usually take several hours and arelabor-intensive. To deal these problems of a traditional immu-noassay, many kinds of fully automated immunoassay analyzers,which can perform a various tests on a series of samples andprocess several batches simultaneously, have been commercial-ized. The automated systems usually take several tens of minutesfor performing all steps, including sample dilution, dispensing,incubation, washing, and reading without manual handling ofliquids except during the step for sample injection. However, thecommercialized immunoassay instruments still have some limita-tions that they require massive and complicated constructions ofrobotic components and several hundreds of microliter samplevolumes. Recently, microfluidic devices have also been appliedfor simple and rapid immunoassays in miniaturized system withsmall sample volumes.4-6 Previous microfluidic immunoassayplatforms, however, also require troublesome fluidic components,and yield large amount of dead volumes and many disposables.
Optoelectrofluidics, which is based on the electrokinetic motionof particles or fluids under an electric field induced by light, hasattracted a great interest from many researchers in various fieldsof science and engineering. There are three well-known methodsto optically induce electrokinetic motions in a fluid: (1) electro-thermal vortex due to the thermal gradient induced by focusing* To whom correspondence should be addressed. Fax: +82-42-350-4310.
E-mail: [email protected](J.-K.P.); [email protected]. (J.C.).† Korea Advanced Institute of Science and Technology (KAIST).‡ Hanyang University.§ KAIST Institute for the NanoCentury.
(1) Porter, M. D.; Lipert, R. J.; Siperko, L. M.; Wang, G.; Narayanan, R. Chem.Soc. Rev. 2008, 37, 1001–1011.
(2) Han, X.; Zhao, B.; Ozaki, Y. Anal. Bioanal. Chem. 2009, 6, 285–297.(3) Chon, H.; Lee, S.; Son, S. W.; Oh, C. H.; Choo, J. Anal. Chem. 2009, 81,
3029–3034.
(4) Jiang, X.; Ng, J. M. K.; Stroock, A. D.; Dertinger, S. K. W.; Whitesides,G. M. J. Am. Chem. Soc. 2003, 125, 5294–5295.
(5) Yager, P.; Edwards, T.; Fu, E.; Helton, K.; Nelson, K.; Tam, M. R.; Weigl,B. H. Nature 2006, 442, 412–418.
(6) Fan, R.; Vermesh, O.; Srivastava, A.; Yen, B. K. H.; Qin, L.; Ahmad, H.;Kwong, G. A.; Liu, C. C.; Gould, J.; Hood, L. Nat. Biotechnol. 2008, 26,1373–1378.
Anal. Chem. 2010, 82, 7603–7610
10.1021/ac101325t 2010 American Chemical Society 7603Analytical Chemistry, Vol. 82, No. 18, September 15, 2010Published on Web 08/24/2010
a strong laser source;7 (2) electrophoresis due to the localincrement of current density by ultraviolet exposure of indiumtin oxide (ITO);8 and (3) optoelectronic tweezers (OET) basedon a photoconductive layer deposited on a metal electrode.9 TheOET technology allows us to induce an electric field gradient ina fluid using a weak white light source, and to spatially modulateit using a conventional display device such as a liquid crystaldisplay (LCD)10 in a simple and easy way. By using the OETdevice, the image-based manipulation of several biological materi-als, which include blood cells,10 oocytes,11 swimming bacteria,12
and biomolecules,13,14 has been demonstrated. In addition, pat-terning of nonbiological objects such as polymer microspheres,15
nanowires,16 and metallic nanoparticles,17 has been possible.Recently, a size-based separation of microspheres using theoptoelectrofluidic platform has also been reported.18
Here a new immunoassay platform is developed for simple,rapid, and automated detection of proteins using a light-activatedparticle manipulation technology. By applying a conventional OETdevice to control antibody-conjugated polystyrene (PS) micro-spheres and probe-labeled silver nanoparticles (AgNPs), a SERS-based sandwich immunoassay of human tumor marker, alpha-fetoprotein (AFP), could be automatically performed using aprogrammed image from a conventional LCD module. Thisoptoelectrofluidic immunoassay does not require any fluidiccomponents and manual handling of liquids for all steps exceptfor sample injection. Moreover, it requires only submicrolitersample droplet as a total specimen, and takes only several minutesto complete one assay cycle.
Theory. The electrokinetic mechanisms, which include di-electrophoresis (DEP) and ac electroosmosis (ACEO), are a maindriving force for particle manipulation using an optoelectrofluidicdevice. In addition, we could also observe the electrostaticinteractions due to the polarization of dielectric particles. DEP,one of the most widely applied principles for the optoelectrofluidicmanipulation,9-12,16,18,19 is the movement of dielectric objectsunder a nonuniform electric field driven by forces arising fromthe interaction between an induced electric dipole of the particleand the applied electric field.20 The DEP force acting on aspherical particle is given by
FDEP ) 2πr3εmRe[fCM]∇|E|2 (1)
where r is the radius of the particles; εm is the permittivity ofthe suspending medium; Re[fCM] is the real part of theClausius-Mossotti factor. The value of Re[fCM] depends on thefrequency of applied ac voltage and the conductivity of particlesand medium, varying between +1 and -0.5. In the optoelec-trofluidic device, the particles are repelled from the lightpattern, where the electric field is relatively higher than otherregion, if Re[fCM] is negative (negative DEP). If Re[fCM] ispositive, the particles move toward the light pattern (positiveDEP).
The optically induced ACEO, which is a fluidic motiongenerated by the motion of ions within the electric double layerdue to the tangential electric field, have also been applied for rapidconcentration of microspheres, nanoparticles and molecules usingan optoelectrofluidic device.13,15,17,18 The fluids around the partiallyilluminated area in the optoelectrofluidic device flow along thesurface of the photoconductive layer with a rectified slip velocitydefined as shown:
⟨vslip⟩t )12
λD
ηRe[σqEt*] (2)
where λD is the Debye length and η is the fluid viscosity. Thecharges contained in the Debye layer (σq) and the tangentialelectric field (Et) vary sinusoidally and can be evaluated as σq
) εm�/λD and Et ) -R∂�/∂y, respectively, where � is the zetapotential, which is the voltage drop across the Debye layer,and R is a geometry factor.21
In addition to these electrokinetic phenomena, electrostaticinteractions among the microspheres due to their induced dipoleare also observable. The electrostatic interaction force, Fdipole ∝r6εmRe[fCM]2E2, can make the particles form a structure like“perl chain” by attractive forces in the direction of an electricfield, and a crystalline structure with a regular distances amongthe particles by repulsive forces in the plane perpendicular tothe electric field.22
The electrokinetics mechanisms act on the microspheres inconcert depending on the frequency of the applied ac signal.18
For example, at the low-frequency range below 1 kHz, hydrody-namic drag force due to the strong ACEO flow becomes moredominant than other forces. The optically induced ACEO vorticesmake both micro- and nanosized particles move toward theilluminated area. While the nanoparticles tend to be alwaysconcentrated into the stagnation region, where the flows areconverged, the microparticles sometimes move along the ACEOvortices on the edge of the light pattern in a certain conditiondepending on the applied ac signal, the light pattern, and thegravity force. At the high-frequency range above 10 kHz, theACEO flow becomes much weaker; hence the DEP force becomesthe most dominant force. Since most polymer microspheres showthe negative DEP motion in low-conductivity media, they arerepelled from the image patterns in the optoelectrofluidic device.Here the electrostatic dipole forces can also affect the behaviorsof microparticles. On the other hand, the DEP force acting onthe nanosized particles is negligible because the magnitude of
(7) Mizuno, A.; Nishioka, M.; Ohno, Y.; Dascalescu, L. D. IEEE Trans. Ind.Appl. 1995, 31, 464–468.
(8) Hayward, R. C.; Saville, D. A.; Aksay, I. A. Nature 2000, 404, 56–59.(9) Chiou, P. Y.; Ohta, A. T.; Wu, M. C. Nature 2005, 436, 370–372.
(10) Hwang, H.; Choi, Y. J.; Choi, W.; Kim, S. H.; Jang, J.; Park, J.-K.Electrophoresis 2008, 29, 1203–1212.
(11) Hwang, H.; Lee, D.-H.; Choi, W.; Park, J.-K. Biomicrofluidics 2009, 3,014103.
(12) Choi, W.; Nam, S.-W.; Hwang, H.; Park, S.; Park, J.-K. Appl. Phys. Lett. 2008,93, 143901.
(13) Hwang, H.; Park, J.-K. Anal. Chem. 2009, 81, 5865–5870.(14) Hwang, H.; Park, J.-K. Anal. Chem. 2009, 81, 9163–9167.(15) Hwang, H.; Park, Y.-H.; Park, J.-K. Langmuir 2009, 25, 6010–6014.(16) Jamshidi, A.; Pauzauskie, P. J.; Schuck, P. J.; Ohta, A. T.; Chiou, P. Y.;
Chou, J.; Yang, P.; Wu, M. C. Nat. Photonics 2008, 2, 86–89.(17) Jamshidi, A.; Neale, S. L.; Yu, K.; Pauzauskie, P. J.; Schuck, P. J.; Valley,
J. K.; Hsu, H.-Y.; Ohta, A. T.; Wu, M. C. Nano Lett. 2009, 9, 2921–2925.(18) Hwang, H.; Park, J.-K. Lab Chip 2009, 9, 199–206.(19) Hwang, H.; Oh, Y.; Kim, J.-J.; Choi, W.; Park, J.-K.; Kim, S.-H.; Jang, J. Appl.
Phys. Lett. 2008, 92, 024108.(20) Jones, T. B. Electromechanics of Particles; Combridge University Press: New
York, 1995.
(21) Probstein, R. F. Physicochemical Hydrodynamics: An Introduction; Wiley andSons: New York, 1994.
(22) Hwang, H.; Kim, J.-J.; Park, J.-K. J. Phys. Chem. B 2008, 112, 9903–9908.
7604 Analytical Chemistry, Vol. 82, No. 18, September 15, 2010
the DEP force is proportional to the volume of particles. Therefore,the nanoparticles move along the weak ACEO flows under theconditions. As the frequency decreases, the ACEO effect becomesstronger. The positive DEP force can sometimes attract themetallic nanoparticles, which were collected by ACEO flows andpositioned near the surface, for immobilizing them onto theilluminated area.17 In this high-frequency range, vortices due tothe electrothermal effect are also observable with a strong lightsource. However, in our experimental condition, we could notobserve the particle behaviors due to the electrothermal vortices.
EXPERIMENTAL SECTIONSample Preparation for Fluorescence Immunoassay. Nor-
mal rabbit immunoglobulin G (rIgG)-biotin was obtained fromSanta Cruz Biotechnology, Inc. (Santa Cruz, CA). Carboxylatedfluorescent (Max. Ex/Em: 441/486) PS microspheres with diam-eter of 6 µm and neutravidin-coated fluorescent (Max. Ex/Em:580/605) PS nanoparticles with diameter of 40 nm were purchasedfrom PolySciences, Inc. (Warrington, PA) and Molecular Probes,Inc. (Eugene, OR), respectively.
After twice washing of PS microspheres with distilled ionized(DI) water, for the activation of other -COOH terminal groupson the PS microspheres, 10 µL of 10 mM N-hydroxysuccinimide(NHS) and 10 µL of 10 mM 1-ethyl-3-(3-dimethylaminopropyl)carbodiimide hydrochloride (EDC) were added to 470 µL of 108
particles/mL PS microspheres and allowed to react for 20 min.Then, 10 µL of 1.0 mg/mL monoclonal rIgG antibody (excessamount) was added to NHS-activated PS beads and reactedovernight at 4 °C. Here, unreacted antibodies were washed outby twice centrifuging, and the final PS microspheres withmonoclonal rIgG antibody were redispersed in DI water.
Sample Preparation for SERS Immunoassay. For targetingAFP antigens, PS microspheres and SERS-active AgNPs werefunctionalized with monoclonal and polyclonal AFP antibodies,respectively. Here, 10 µL of 1.0 mg/mL monoclonal AFP antibody(excess amount) was added to NHS-activated PS beads andreacted overnight at 4 °C. Lastly, unreacted antibodies werewashed out by twice centrifuging, and the final PS microsphereswith monoclonal AFP antibody were redispersed in DI water.
Silver colloids were prepared by the method reported byLeopold and Lendl.23 Here, silver nitrate was reduced by hydroxy-lamine hydrochloride. The detailed procedure for the preparationof AgNPs has been reported elsewhere.24 Briefly, 5 mL of 3.0 ×10⁻² M hydroxylamine hydrochloride was dissolved in 84 mLof triply distilled water and then 1 mL of 3.0 × 10⁻¹ M sodiumhydroxide was added to maintain an alkaline pH. Next, 10 mLof 2.0 × 10⁻² M silver nitrate solution was added dropwise tothe solution with continuous stirring. The solution was continu-ously stirred for an additional one day. UV/vis spectroscopyand transmission electron microscopy (TEM) were used tocharacterize the particle size of the produced colloids. Theaverage particle size was determined to be 40 ± 10 nm.
To use these AgNPs as SERS-active probes, malachite greenisothiocyanate (MGITC) was adsorbed onto the surface of theAgNPs. An amount of 1 µL of 5 × 10⁻⁵ M MGITC was added to
1 mL of AgNPs, and the mixture was reacted for 1 h understirring. Then, dihydrolipoic acid (DHLA) was used for theantibody conjugation. The two -SH terminal groups of DHLAwere chemically bonded to the silver surface. An amount of 2µL of 5.0 mM DHLA was added to 1 mL of dye-adsorbedAgNPs and allowed to react for 1 h. Excess nonspecific bindingmercaptoethanol in solution was removed by centrifuging thesolution, and the precipitate was washed twice with DI waterand resuspended.
For the activation of other -COOH terminal groups, 1 µL of1.0 mM EDC and 1 µL of 1.0 mM NHS were added and allowedto react for 20 min. Finally, 1 µL of 1.0 mg/mL polyclonal AFPantibody (excess amount) was added to NHS-activated silvernano-particles and reacted overnight at 4 °C. Unreacted NHS groupson the surface of the AgNPs were deactivated with 1 µL of 1.0mM ethanolamine for 2 h. Nonspecific binding chemicals andantibodies were removed by centrifuging, and the final nanoprobeswere washed twice with DI water.3
Device Configuration. A sample droplet, whose total volumeis 500 nL (volume ratio of AFP antigens: PS microspheres: AgNPs) 1: 1: 1), was placed in a 30 µm-height liquid chamber of theoptoelectrofluidic device, which consists of a bare ITO electrodeand a photoconductive electrode. The height of the liquid chamberwas fixed by photoresist gap spacers, which were fabricated onthe bare ITO electrode using conventional photolithography. Thephotoconductive electrode was fabricated by sequential depositionof three layers: (1) a 50 nm-thick heavily doped hydrogenatedamorphous silicon (a-Si:H); (2) an 1 µm-thick intrinsic a-Si:H, and(3) a 20 nm-thick silicon nitride on an ITO-coated glass substrate(Samsung-Corning Precision Glass, Korea) using a plasma en-hanced chemical vapor deposition. The device surfaces weretreated with 0.1% bovine serum albumin solution for about 30 minto reduce nonspecific adsorption of microspheres onto the devicesurface. Lastly, an ac voltage of 10 Vpp produced from a functiongenerator (AFG310; Tektronix, OR) was applied across the ITOelectrodes.
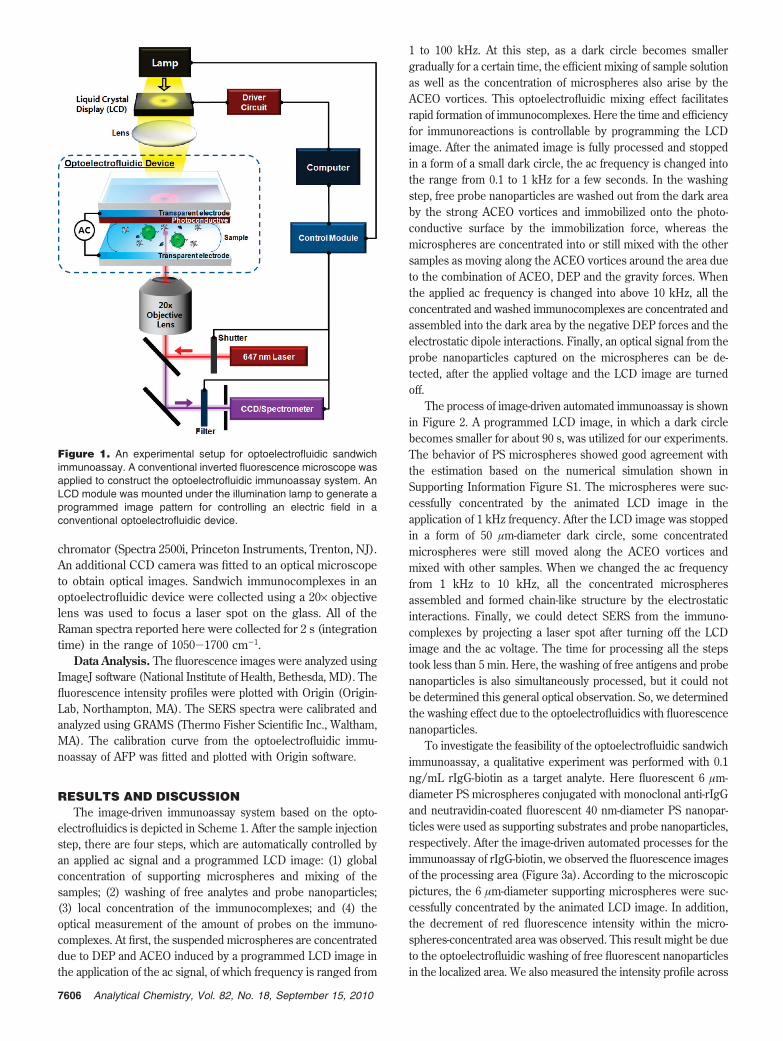
Experimental Setup for Optoelectrofluidic Immunoas-says. Experimental setup for the optoelectrofluidic immunoassaysis shown in Figure 1. A conventional inverted fluorescencemicroscope (IX71; Olympus Corp., Japan) was applied to constructthe optoelectrofluidic immunoassay system. A monochromaticLCD module in a conventional projector (CP-S225; Hitachi, Japan)was mounted under the illumination lamp to generate a pro-grammed image pattern for controlling an electric field. The LCDimage was projected onto the photoconductive layer of the devicethrough a condenser lens integrated into the microscope. Theoptoelectrofluidic device containing a sample droplet was put onthe microscope stage as the transparent ITO electrode faces tothe objective lens, since the photoconductive layer absorbs orblocks an incident laser beam and Raman scattering.
SERS Detection. SERS measurements were performed usinghomemade Raman microscope system. An inverted microscopeIX71 (Olympus Corp.) was modified for sensitive Raman scatteringdetection. An Ar-Kr laser (Innova70C Spectrum, Coherent Inc.,CA) operating at λ ) 647.4 nm was used as the excitation sourcewith a laser power of 5 mW. Raman scattering was collected usinga charge-coupled device (CCD) camera at a spectral resolutionof 2 cm-1. Spectral measurements were made with a mono-
(23) Leopold, N.; Lendl, B. J. Phys. Chem. B 2003, 107, 5723–5727.(24) Park, T.; Lee, S.; Seong, G. H.; Choo, J.; Lee, E. K.; Kim, Y. S.; Ji, W. H.;
Hwang, S. Y.; Gweon, D. G.; Lee, S. Lab Chip 2005, 5, 437–442.
7605Analytical Chemistry, Vol. 82, No. 18, September 15, 2010
chromator (Spectra 2500i, Princeton Instruments, Trenton, NJ).An additional CCD camera was fitted to an optical microscopeto obtain optical images. Sandwich immunocomplexes in anoptoelectrofluidic device were collected using a 20× objectivelens was used to focus a laser spot on the glass. All of theRaman spectra reported here were collected for 2 s (integrationtime) in the range of 1050-1700 cm-1.
Data Analysis. The fluorescence images were analyzed usingImageJ software (National Institute of Health, Bethesda, MD). Thefluorescence intensity profiles were plotted with Origin (Origin-Lab, Northampton, MA). The SERS spectra were calibrated andanalyzed using GRAMS (Thermo Fisher Scientific Inc., Waltham,MA). The calibration curve from the optoelectrofluidic immu-noassay of AFP was fitted and plotted with Origin software.
RESULTS AND DISCUSSIONThe image-driven immunoassay system based on the opto-
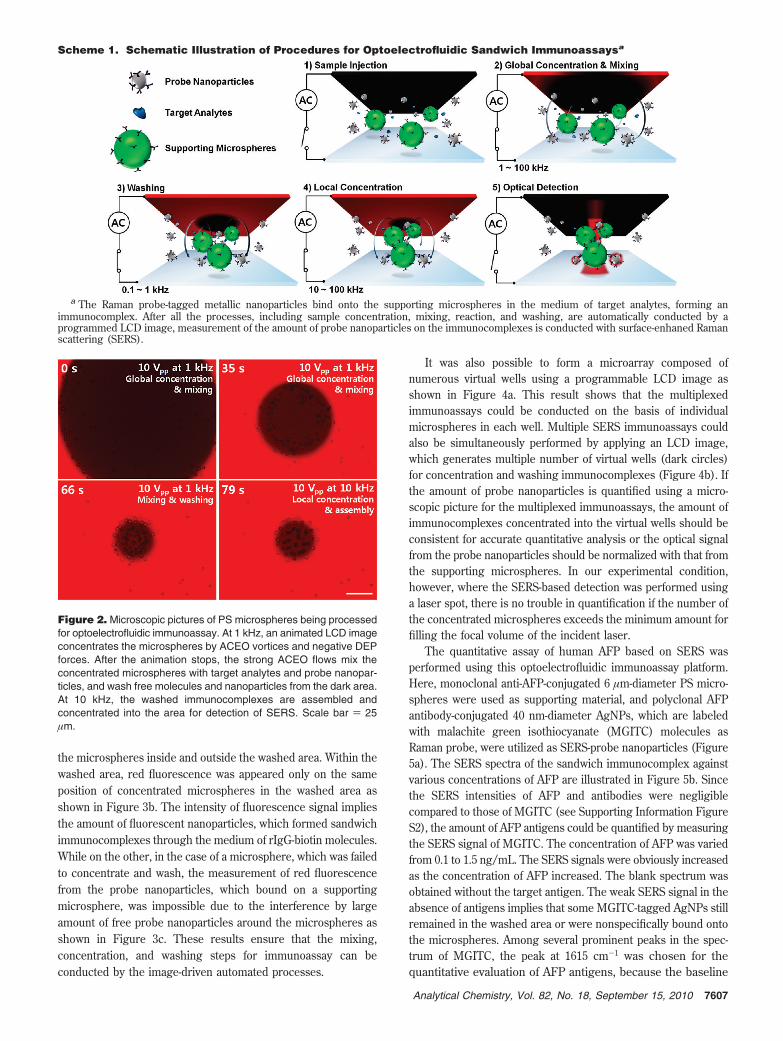
electrofluidics is depicted in Scheme 1. After the sample injectionstep, there are four steps, which are automatically controlled byan applied ac signal and a programmed LCD image: (1) globalconcentration of supporting microspheres and mixing of thesamples; (2) washing of free analytes and probe nanoparticles;(3) local concentration of the immunocomplexes; and (4) theoptical measurement of the amount of probes on the immuno-complexes. At first, the suspended microspheres are concentrateddue to DEP and ACEO induced by a programmed LCD image inthe application of the ac signal, of which frequency is ranged from
1 to 100 kHz. At this step, as a dark circle becomes smallergradually for a certain time, the efficient mixing of sample solutionas well as the concentration of microspheres also arise by theACEO vortices. This optoelectrofluidic mixing effect facilitatesrapid formation of immunocomplexes. Here the time and efficiencyfor immunoreactions is controllable by programming the LCDimage. After the animated image is fully processed and stoppedin a form of a small dark circle, the ac frequency is changed intothe range from 0.1 to 1 kHz for a few seconds. In the washingstep, free probe nanoparticles are washed out from the dark areaby the strong ACEO vortices and immobilized onto the photo-conductive surface by the immobilization force, whereas themicrospheres are concentrated into or still mixed with the othersamples as moving along the ACEO vortices around the area dueto the combination of ACEO, DEP and the gravity forces. Whenthe applied ac frequency is changed into above 10 kHz, all theconcentrated and washed immunocomplexes are concentrated andassembled into the dark area by the negative DEP forces and theelectrostatic dipole interactions. Finally, an optical signal from theprobe nanoparticles captured on the microspheres can be de-tected, after the applied voltage and the LCD image are turnedoff.
The process of image-driven automated immunoassay is shownin Figure 2. A programmed LCD image, in which a dark circlebecomes smaller for about 90 s, was utilized for our experiments.The behavior of PS microspheres showed good agreement withthe estimation based on the numerical simulation shown inSupporting Information Figure S1. The microspheres were suc-cessfully concentrated by the animated LCD image in theapplication of 1 kHz frequency. After the LCD image was stoppedin a form of 50 µm-diameter dark circle, some concentratedmicrospheres were still moved along the ACEO vortices andmixed with other samples. When we changed the ac frequencyfrom 1 kHz to 10 kHz, all the concentrated microspheresassembled and formed chain-like structure by the electrostaticinteractions. Finally, we could detect SERS from the immuno-complexes by projecting a laser spot after turning off the LCDimage and the ac voltage. The time for processing all the stepstook less than 5 min. Here, the washing of free antigens and probenanoparticles is also simultaneously processed, but it could notbe determined this general optical observation. So, we determinedthe washing effect due to the optoelectrofluidics with fluorescencenanoparticles.
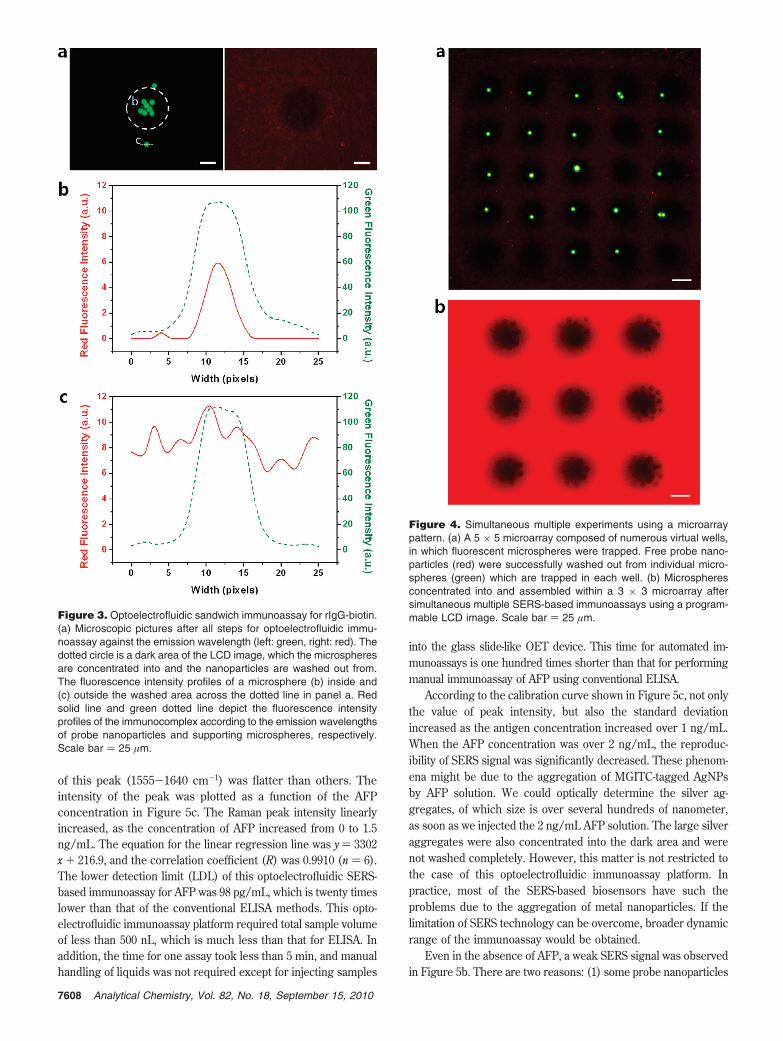
To investigate the feasibility of the optoelectrofluidic sandwichimmunoassay, a qualitative experiment was performed with 0.1ng/mL rIgG-biotin as a target analyte. Here fluorescent 6 µm-diameter PS microspheres conjugated with monoclonal anti-rIgGand neutravidin-coated fluorescent 40 nm-diameter PS nanopar-ticles were used as supporting substrates and probe nanoparticles,respectively. After the image-driven automated processes for theimmunoassay of rIgG-biotin, we observed the fluorescence imagesof the processing area (Figure 3a). According to the microscopicpictures, the 6 µm-diameter supporting microspheres were suc-cessfully concentrated by the animated LCD image. In addition,the decrement of red fluorescence intensity within the micro-spheres-concentrated area was observed. This result might be dueto the optoelectrofluidic washing of free fluorescent nanoparticlesin the localized area. We also measured the intensity profile across
Figure 1. An experimental setup for optoelectrofluidic sandwichimmunoassay. A conventional inverted fluorescence microscope wasapplied to construct the optoelectrofluidic immunoassay system. AnLCD module was mounted under the illumination lamp to generate aprogrammed image pattern for controlling an electric field in aconventional optoelectrofluidic device.
7606 Analytical Chemistry, Vol. 82, No. 18, September 15, 2010
the microspheres inside and outside the washed area. Within thewashed area, red fluorescence was appeared only on the sameposition of concentrated microspheres in the washed area asshown in Figure 3b. The intensity of fluorescence signal impliesthe amount of fluorescent nanoparticles, which formed sandwichimmunocomplexes through the medium of rIgG-biotin molecules.While on the other, in the case of a microsphere, which was failedto concentrate and wash, the measurement of red fluorescencefrom the probe nanoparticles, which bound on a supportingmicrosphere, was impossible due to the interference by largeamount of free probe nanoparticles around the microspheres asshown in Figure 3c. These results ensure that the mixing,concentration, and washing steps for immunoassay can beconducted by the image-driven automated processes.
It was also possible to form a microarray composed ofnumerous virtual wells using a programmable LCD image asshown in Figure 4a. This result shows that the multiplexedimmunoassays could be conducted on the basis of individualmicrospheres in each well. Multiple SERS immunoassays couldalso be simultaneously performed by applying an LCD image,which generates multiple number of virtual wells (dark circles)for concentration and washing immunocomplexes (Figure 4b). Ifthe amount of probe nanoparticles is quantified using a micro-scopic picture for the multiplexed immunoassays, the amount ofimmunocomplexes concentrated into the virtual wells should beconsistent for accurate quantitative analysis or the optical signalfrom the probe nanoparticles should be normalized with that fromthe supporting microspheres. In our experimental condition,however, where the SERS-based detection was performed usinga laser spot, there is no trouble in quantification if the number ofthe concentrated microspheres exceeds the minimum amount forfilling the focal volume of the incident laser.
The quantitative assay of human AFP based on SERS wasperformed using this optoelectrofluidic immunoassay platform.Here, monoclonal anti-AFP-conjugated 6 µm-diameter PS micro-spheres were used as supporting material, and polyclonal AFPantibody-conjugated 40 nm-diameter AgNPs, which are labeledwith malachite green isothiocyanate (MGITC) molecules asRaman probe, were utilized as SERS-probe nanoparticles (Figure5a). The SERS spectra of the sandwich immunocomplex againstvarious concentrations of AFP are illustrated in Figure 5b. Sincethe SERS intensities of AFP and antibodies were negligiblecompared to those of MGITC (see Supporting Information FigureS2), the amount of AFP antigens could be quantified by measuringthe SERS signal of MGITC. The concentration of AFP was variedfrom 0.1 to 1.5 ng/mL. The SERS signals were obviously increasedas the concentration of AFP increased. The blank spectrum wasobtained without the target antigen. The weak SERS signal in theabsence of antigens implies that some MGITC-tagged AgNPs stillremained in the washed area or were nonspecifically bound ontothe microspheres. Among several prominent peaks in the spec-trum of MGITC, the peak at 1615 cm-1 was chosen for thequantitative evaluation of AFP antigens, because the baseline
Scheme 1. Schematic Illustration of Procedures for Optoelectrofluidic Sandwich Immunoassaysa
a The Raman probe-tagged metallic nanoparticles bind onto the supporting microspheres in the medium of target analytes, forming animmunocomplex. After all the processes, including sample concentration, mixing, reaction, and washing, are automatically conducted by aprogrammed LCD image, measurement of the amount of probe nanoparticles on the immunocomplexes is conducted with surface-enhaned Ramanscattering (SERS).
Figure 2. Microscopic pictures of PS microspheres being processedfor optoelectrofluidic immunoassay. At 1 kHz, an animated LCD imageconcentrates the microspheres by ACEO vortices and negative DEPforces. After the animation stops, the strong ACEO flows mix theconcentrated microspheres with target analytes and probe nanopar-ticles, and wash free molecules and nanoparticles from the dark area.At 10 kHz, the washed immunocomplexes are assembled andconcentrated into the area for detection of SERS. Scale bar ) 25µm.
7607Analytical Chemistry, Vol. 82, No. 18, September 15, 2010
of this peak (1555-1640 cm-1) was flatter than others. Theintensity of the peak was plotted as a function of the AFPconcentration in Figure 5c. The Raman peak intensity linearlyincreased, as the concentration of AFP increased from 0 to 1.5ng/mL. The equation for the linear regression line was y ) 3302x + 216.9, and the correlation coefficient (R) was 0.9910 (n ) 6).The lower detection limit (LDL) of this optoelectrofluidic SERS-based immunoassay for AFP was 98 pg/mL, which is twenty timeslower than that of the conventional ELISA methods. This opto-electrofluidic immunoassay platform required total sample volumeof less than 500 nL, which is much less than that for ELISA. Inaddition, the time for one assay took less than 5 min, and manualhandling of liquids was not required except for injecting samples
into the glass slide-like OET device. This time for automated im-munoassays is one hundred times shorter than that for performingmanual immunoassay of AFP using conventional ELISA.
According to the calibration curve shown in Figure 5c, not onlythe value of peak intensity, but also the standard deviationincreased as the antigen concentration increased over 1 ng/mL.When the AFP concentration was over 2 ng/mL, the reproduc-ibility of SERS signal was significantly decreased. These phenom-ena might be due to the aggregation of MGITC-tagged AgNPsby AFP solution. We could optically determine the silver ag-gregates, of which size is over several hundreds of nanometer,as soon as we injected the 2 ng/mL AFP solution. The large silveraggregates were also concentrated into the dark area and werenot washed completely. However, this matter is not restricted tothe case of this optoelectrofluidic immunoassay platform. Inpractice, most of the SERS-based biosensors have such theproblems due to the aggregation of metal nanoparticles. If thelimitation of SERS technology can be overcome, broader dynamicrange of the immunoassay would be obtained.
Even in the absence of AFP, a weak SERS signal was observedin Figure 5b. There are two reasons: (1) some probe nanoparticles
Figure 3. Optoelectrofluidic sandwich immunoassay for rIgG-biotin.(a) Microscopic pictures after all steps for optoelectrofluidic immu-noassay against the emission wavelength (left: green, right: red). Thedotted circle is a dark area of the LCD image, which the microspheresare concentrated into and the nanoparticles are washed out from.The fluorescence intensity profiles of a microsphere (b) inside and(c) outside the washed area across the dotted line in panel a. Redsolid line and green dotted line depict the fluorescence intensityprofiles of the immunocomplex according to the emission wavelengthsof probe nanoparticles and supporting microspheres, respectively.Scale bar ) 25 µm.
Figure 4. Simultaneous multiple experiments using a microarraypattern. (a) A 5 × 5 microarray composed of numerous virtual wells,in which fluorescent microspheres were trapped. Free probe nano-particles (red) were successfully washed out from individual micro-spheres (green) which are trapped in each well. (b) Microspheresconcentrated into and assembled within a 3 × 3 microarray aftersimultaneous multiple SERS-based immunoassays using a program-mable LCD image. Scale bar ) 25 µm.
7608 Analytical Chemistry, Vol. 82, No. 18, September 15, 2010

still remained in the washed area; (2) nonspecific binding ofantigens or probe nanoparticles onto the microspheres. Theformer might be due to the behavior of nanoparticles by opto-electrofluidic flows and thermal motion. Most of the nanoparticleswere washed out from the dark image and immobilized into theilluminated area. According to the simulation depicted in Sup-porting Information Figure S1, however, there was still weak flowconverging into the dark area along the bare ITO surface. Theflow is originated from the main ACEO flow toward the illuminatedarea along the photoconductive surface. Although the strongelectrohydrodynamic flow washed out the free nanoparticles andmolecules, little influx of probe nanoparticles might be slowlyoccurred. The thermal motion of the washed nanoparticles afterturning off the voltage at the detection step can also affect thebackground signal. However, according to our experiments with
fluorescent nanoparticles and the previous literature,17 the disper-sion of washed or patterned nanoparticles due to their Brownianmotion was negligible. The latter, which is relative to thenonspecific absorption of antigens and nanoparticles, may becaused by electrostatic forces as well as by chemical bindingforces. In-depth consideration for the electrostatic particle-particleinteractions in this optoelectrofluidic immunoassay was discussedas follows.
At the ac frequencies ranged from 1 to 100 kHz, which includeour experimental conditions, the electrostatic particle-particleinteractions due to the induced-dipole of microspheres wereobserved. The attractive force, which aligns the microspheres inthe direction of electric field, became stronger at 10 kHz than at1 kHz, resulting in the “perl chains” of concentrated microspheres.This chain structure of immunocomplexes facilitated the highlysensitive detection of antigens by increasing the amount of probenanoparticles exposed to the focal volume of the incident laser. Ifthe microspheres are assembled in a monolayer, the SERS fromonly one immunocomplex will be detected. However, in thisexperimental condition, at least three to five 6 µm-diametermicrospheres form a chain, of which length is enough to coverthe focal volume (∼10-17 m3) of the incident laser, in thedirection of the beam. In addition, the contact points amongthe microspheres in a chain can serve as hot spots forenhancing SERS signal from the probe nanoparticles. However,this chain structure may interfere with the reproducible SERSdetection. The chain began to relax as soon as turning off theapplied voltage for SERS detection. As a consequence, theSERS signal gradually reduced with a large fluctuation fromabout 30 s after the ac signal was intercepted. Therefore, wecould obtain reproducible SERS intensity for only 30 s afterthe voltage is turned off.
The electrostatic interactions may also induce nonspecificbinding of probe nanoparticles onto the microspheres. However,according to our experiments with fluorescence, the electrostaticattraction between microspheres and nanoparticles was observableonly at extremely low-frequency range around 100 Hz (data notshown). Therefore, the electrostatic binding of nanoparticles ontomicrospheres would be negligible in our experimental conditionsranged from 1 to 10 kHz. However, it is difficult to conclude thatthere is no nonspecific binding of probe nanoparticles by elec-trostatic interactions yet, thus this matter should be investigatedand solved for lower detection limit.
CONCLUSIONSIn this article, an optoelectrofluidic immunoassay platform has
been developed for simple, automated, fast (∼5 min), and highlysensitive (LDL ) 98 pg/mL) detection of AFP in tiny samplevolume (∼500 nL) using SERS. This image-driven immunoassayusing a conventional OET device has five significant meanings inseveral perspectives. First, this paper demonstrated the firstapplication for detecting biological molecules using an optoelec-trofluidic device. Up to now, all the studies about optoelectroflu-idics have been focused only to the manipulation of some objects,except only one study about applying an OET device for themeasurement of molecular diffusion coefficient.14 In such acontext, the optoelectrofluidic immunoassay has a significantmeaning in respect that this is the first realization of the detectiontechnology based on optoelectrofluidics. Second, much less
Figure 5. The quantitative assay of human AFP based on opto-electrofluidic SERS. (a) Schematic illustration of the formation ofimmunocomplex for SERS-based assay. Human AFP and MGITC-tagged AgNPs were applied for target analytes and probe nanopar-ticles, respectively. (b) SERS spectra for various concentrations ofAFP antigen. (c) Intensity of the SERS signal at 1615 cm-1 againstthe concentration of AFP. A linear relationship is shown in theconcentration range from 0 to 1.5 ng/mL. The linear fitting line is y )3302x + 216.9, and R ) 0.9910 (n ) 6).
7609Analytical Chemistry, Vol. 82, No. 18, September 15, 2010
volume of samples was required for the assay than the conven-tional ELISA systems. Only a several hundreds of nanoliter sampledroplet, which contains supporting microspheres, target analytes,and probe nanoparticles, was dropped on the OET device for theimmunoassay in this system. Third, any complicated robotic orfluidic components were not required for the automated immu-noassays. Only an OET device, which is similar to a glass slide,and an LCD module for controlling fluids were required. Thissimple structure and cheap components make it easy to com-mercialize and apply this technology for clinical diagnosis andbiochemical analysis. Fourth, by using the optoelectrofluidicimmunoassay, it took much less time (∼5 min) to conduct all theprocesses for sandwich immunoassay than conventional methods.The incubation time shortened due to the enhanced mixing effectby the optically induced electrohydrodynamic vortices, as well asthe fully automated processes without pipetting liquid samplesallows us to save times. Finally, the image-driven manipulationplatform allows more flexible uses of this technology. For example,parallel multiple assays were possible based on an LCD imageprogrammed for generating multiple areas for concentration,reaction, washing, and detection. Based on this approach, a newmultiplexed immunoassay platform could be constructed usingan array of optically controlled virtual microwells.
Some challenges also remain. First, the performance of thisoptoelectrofluidic technology is basically dependent on the con-ductivity of media. For a salty media such as blood plasma or cellculture media, the photoconductivity should be much higher thanthe conventional OET device based on amorphous silicon. Thephototransistor-based OET device could be utilized for increasingthe photoconductivity of the device and applying this techniquefor high-conductivity physiological buffers.25 Second, the perfor-mance depends on the applied ac frequency as well. A processfor optimization of the ac frequency condition, therefore, is alwaysrequired before applying different probe nanoparticles. Forexample, the silver nanoparticles were washed well and im-mobilized onto the illuminated area at higher frequency above 1
kHz, whereas relatively low ac frequency from 100 Hz to 1 kHzwas optimized condition for the fluorescent polymer nanoparticles.Third, thick glass substrate and opaque photoconductive layercan interfere with the effective measurement of optical signals aswell as flexible modification of optical pathway. This limitationcould also be overcome by developing a new device or by applyingsensitive probes for more flexible and sensitive optical detection.Finally, the integration of microfluidic components for manipulat-ing multiple sample solutions would be very helpful for embodyingimmunoassays of multiple targets or conducting more complicatedprocesses. Such the research for integrating microfluidic channelsinto the optoelectrofluidic device has already been performed.26
Despite these challenges and limitations, the optoelectrofluidicsandwich immunoassays have fascinating meanings in the per-spectives that it provides a new way for simple, fast, automated,and highly sensitive detection of antigens, and it is the firstpractical application for protein detection based on the optoelec-trofluidic manipulation.
ACKNOWLEDGMENTThis research was supported by the National Research Labora-
tory (NRL) Program grant (R0A-2008-000-20109-0) and by theNano/Bio Science and Technology Program grant (2008-00771)through the National Research Foundation of Korea funded bythe Ministry of Education, Science and Technology (MEST). Wealso thank the TFT-LCD Research Center, Kyung Hee University,Korea. J.C. acknowledges the National Research Foundation ofKorea (R11-2010-044-1002-0) for financial support. H.H. and H.C.contributed equally to this work.
SUPPORTING INFORMATION AVAILABLESimulation study (Figure S1) and SERS spectra (Figure S2).
This material is available free of charge via the Internet athttp://pubs.acs.org.
Received for review May 20, 2010. Accepted August 13,2010.
AC101325T(25) Hsu, H.-y.; Ohta, A. T.; Chiou, P.-Y.; Jamshidi, A.; Neale, S. L.; Wu, M. C.
Lab Chip 2010, 10, 165–172. (26) Lee, D.-H.; Hwang, H.; Park, J.-K. Appl. Phys. Lett. 2009, 95, 164102.
7610 Analytical Chemistry, Vol. 82, No. 18, September 15, 2010