Optoelectronic Techniques for Surface Characterization of ...
28
11 Optoelectronic Techniques for Surface Characterization of Fabrics Michel Tourlonias 1 , Marie-Ange Bueno 1 and Laurent Bigué 2 University of Haute Alsace, Ecole Nationale Supérieure d’Ingénieurs Sud-Alsace, 1 Laboratoire de Physique et Mécanique Textiles (EAC 7189 CNRS/UHA), 2 Laboratoire Modélisation Intelligence Processus Systèmes (EA 2332), France 1. Introduction In the textile field, fabric surface properties influence the tactile feel, the visual aspect and some mechanical properties. They are strongly linked to manufacturing process, particularly to surface processes. Therefore the study of these fabric surface properties proves of importance. More precisely, the tactile feel is one of the most important garment selling points since one of the first consumer actions is to touch the fabric. Thanks to objective tactile parameters, the manufacturer can design and produce fabrics which please the consumers while respecting functionality of cloth. Moreover, for standard woven or knitted structures or low grammage nonwovens, the surface state can give some information about tensile properties or strain during tensile stress. In order to characterize surface contact devices, such as tribometers 1 , are often used. They provide some information about friction behaviour, roughness of the surface or some other criteria more or less complex. This type of devices is often designed and used for hard materials. Concerning textile surfaces, because of their softness, these methods can have an influence on measurements in so far as superficial hairiness and even intrinsic structure may be modified. Both of these structural characteristics, hairiness and texture, are predominant in the tactile feel of textile surfaces. Complementary to tribological methods widely used but whose precision may be insufficient, non-contact methods have been developed in order to characterise fabric surface state. These methods are mainly based on optical principles and have been getting a growing interest. In this chapter we will present our contributions to the non-contact characterization of textile surfaces, firstly through the characterization of the state of surface (intrinsic structure and hairiness) and then through the evaluation of some mechanical properties of textile fabrics (strain and tensile properties). Implementations resulting in various apparatuses and some results are given in order to illustrate our purpose. 2. Basics of textile materials and description of our test samples Fibrous materials must be considered at three different scales. First, fibres are the basic elements of textile materials; they correspond to the microscopic scale of the textiles. Second, 1 Device for measuring friction and wear properties. www.intechopen.com
Transcript of Optoelectronic Techniques for Surface Characterization of ...

11
Optoelectronic Techniques for Surface Characterization of Fabrics
Michel Tourlonias1, Marie-Ange Bueno1 and Laurent Bigué2 University of Haute Alsace, Ecole Nationale Supérieure d’Ingénieurs Sud-Alsace,
1Laboratoire de Physique et Mécanique Textiles (EAC 7189 CNRS/UHA), 2Laboratoire Modélisation Intelligence Processus Systèmes (EA 2332),
France
1. Introduction
In the textile field, fabric surface properties influence the tactile feel, the visual aspect and some mechanical properties. They are strongly linked to manufacturing process, particularly to surface processes. Therefore the study of these fabric surface properties proves of importance. More precisely, the tactile feel is one of the most important garment selling points since one of the first consumer actions is to touch the fabric. Thanks to objective tactile parameters, the manufacturer can design and produce fabrics which please the consumers while respecting functionality of cloth. Moreover, for standard woven or knitted structures or low grammage nonwovens, the surface state can give some information about tensile properties or strain during tensile stress. In order to characterize surface contact devices, such as tribometers1, are often used. They provide some information about friction behaviour, roughness of the surface or some other criteria more or less complex. This type of devices is often designed and used for hard materials. Concerning textile surfaces, because of their softness, these methods can have an influence on measurements in so far as superficial hairiness and even intrinsic structure may be modified. Both of these structural characteristics, hairiness and texture, are predominant in the tactile feel of textile surfaces. Complementary to tribological methods widely used but whose precision may be insufficient, non-contact methods have been developed in order to characterise fabric surface state. These methods are mainly based on optical principles and have been getting a growing interest. In this chapter we will present our contributions to the non-contact characterization of textile surfaces, firstly through the characterization of the state of surface (intrinsic structure and hairiness) and then through the evaluation of some mechanical properties of textile fabrics (strain and tensile properties). Implementations resulting in various apparatuses and some results are given in order to illustrate our purpose.
2. Basics of textile materials and description of our test samples
Fibrous materials must be considered at three different scales. First, fibres are the basic
elements of textile materials; they correspond to the microscopic scale of the textiles. Second,
1 Device for measuring friction and wear properties.
www.intechopen.com
Optoelectronics - Materials and Techniques
288
a yarn is an assembly of fibres and corresponds to the mesoscopic scale. And third, yarns are
interlaced to make knitted fabrics or intercrossed to make woven fabrics. There is another
type of textile surfaces which is directly made of fibres (or filaments if their length is
infinite), without intermediate yarn step: the nonwovens. Fibres or filaments are randomly
tangled as a web whose cohesion is given thanks to different processes which can be
mechanical, thermal or chemical.
During manufacturing process, the end of some fibres can emerge from the yarn and the
fabric: it produces a superficial hairiness. This hairiness can be also the consequence of an
abrasive wear, for instance with emery paper or as a consequence of use. Length, size
orientation relative to the surface and density are the main parameters characterising this
hairiness.
As a summary the surface is then composed of elements at two different scales: a structure, i.e.
the fabric itself, and a superficial hairiness. The surface state of fabrics is therefore linked to
phenomena at microscopic scale (fibres and their mechanical properties) and at macroscopic
scale through textile structure due to yarn and/or knitted, woven or nonwoven structures.
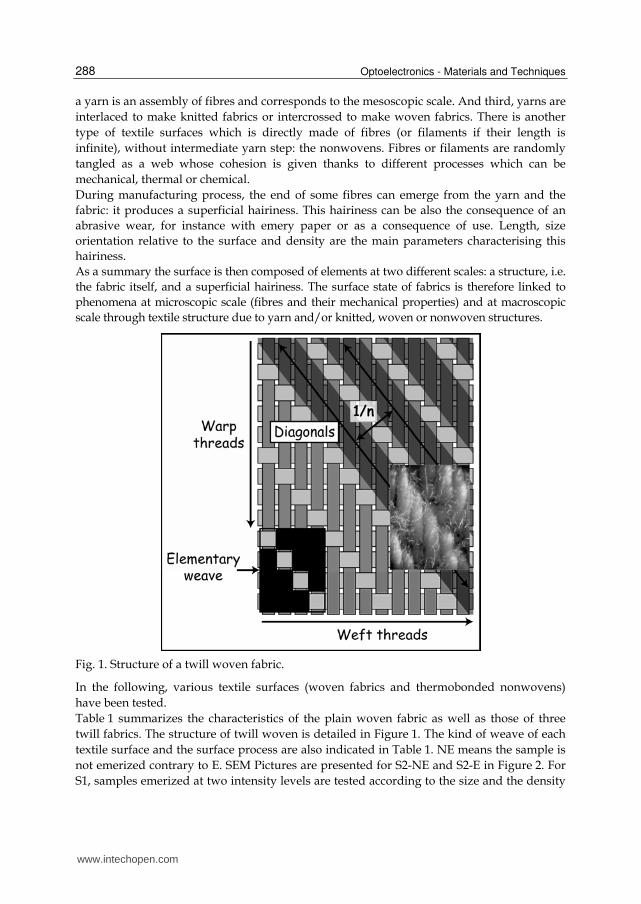
Fig. 1. Structure of a twill woven fabric.
In the following, various textile surfaces (woven fabrics and thermobonded nonwovens)
have been tested.
Table 1 summarizes the characteristics of the plain woven fabric as well as those of three
twill fabrics. The structure of twill woven is detailed in Figure 1. The kind of weave of each
textile surface and the surface process are also indicated in Table 1. NE means the sample is
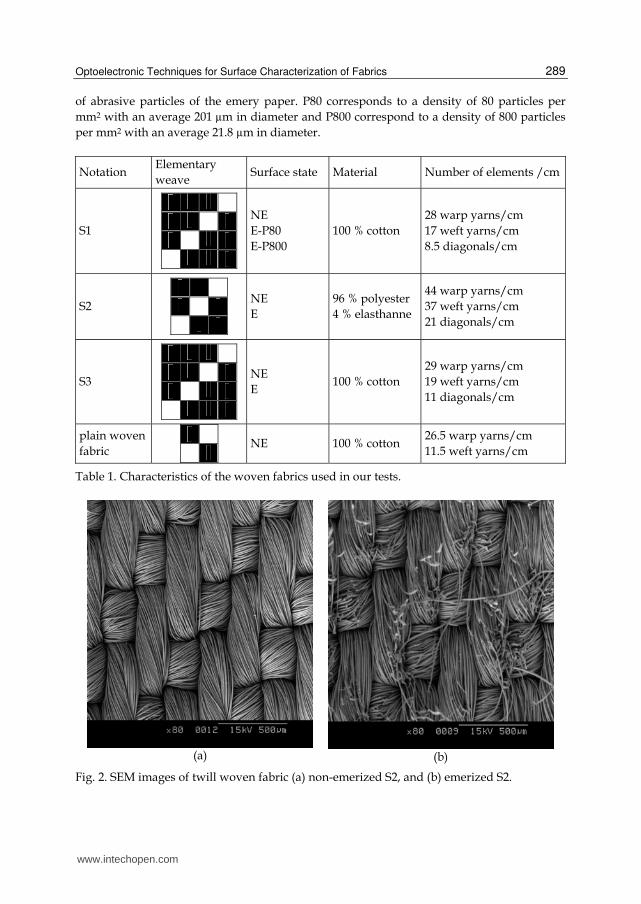
not emerized contrary to E. SEM Pictures are presented for S2-NE and S2-E in Figure 2. For
S1, samples emerized at two intensity levels are tested according to the size and the density
www.intechopen.com
Optoelectronic Techniques for Surface Characterization of Fabrics
289
of abrasive particles of the emery paper. P80 corresponds to a density of 80 particles per
mm2 with an average 201 µm in diameter and P800 correspond to a density of 800 particles
per mm2 with an average 21.8 µm in diameter.
Notation Elementary
weave Surface state Material Number of elements /cm
S1
NE
E-P80
E-P800
100 % cotton
28 warp yarns/cm
17 weft yarns/cm
8.5 diagonals/cm
S2
NE
E
96 % polyester
4 % elasthanne
44 warp yarns/cm
37 weft yarns/cm
21 diagonals/cm
S3
NE
E 100 % cotton
29 warp yarns/cm
19 weft yarns/cm
11 diagonals/cm
plain woven
fabric
NE 100 % cotton 26.5 warp yarns/cm
11.5 weft yarns/cm
Table 1. Characteristics of the woven fabrics used in our tests.
(a)
(b)
Fig. 2. SEM images of twill woven fabric (a) non-emerized S2, and (b) emerized S2.
www.intechopen.com
Optoelectronics - Materials and Techniques
290
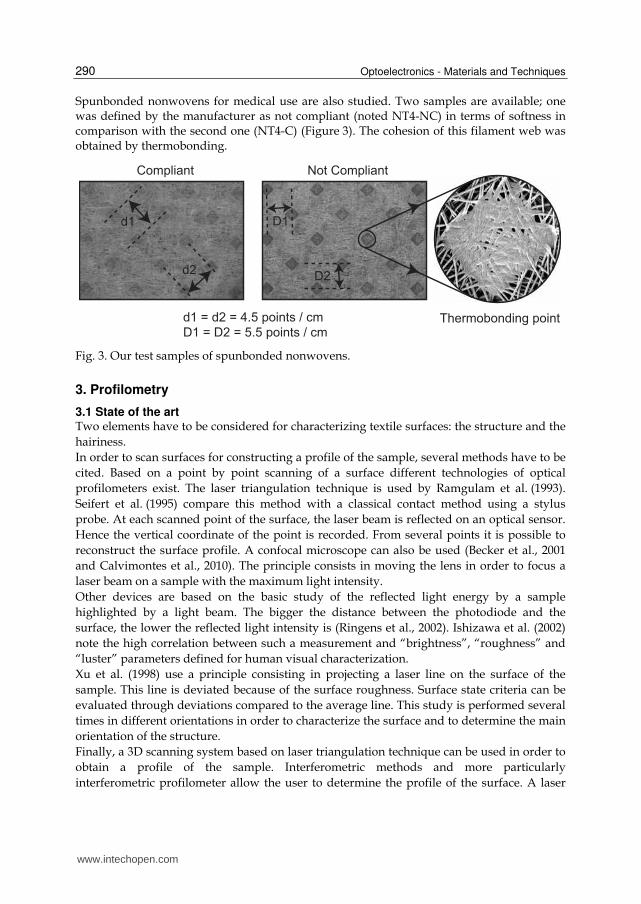
Spunbonded nonwovens for medical use are also studied. Two samples are available; one was defined by the manufacturer as not compliant (noted NT4-NC) in terms of softness in comparison with the second one (NT4-C) (Figure 3). The cohesion of this filament web was obtained by thermobonding.
Thermobonding point
D1
D2
Compliant Not Compliant
d1
d2
d1 = d2 = 4.5 points / cm
D1 = D2 = 5.5 points / cm
Fig. 3. Our test samples of spunbonded nonwovens.
3. Profilometry
3.1 State of the art Two elements have to be considered for characterizing textile surfaces: the structure and the
hairiness.
In order to scan surfaces for constructing a profile of the sample, several methods have to be
cited. Based on a point by point scanning of a surface different technologies of optical
profilometers exist. The laser triangulation technique is used by Ramgulam et al. (1993).
Seifert et al. (1995) compare this method with a classical contact method using a stylus
probe. At each scanned point of the surface, the laser beam is reflected on an optical sensor.
Hence the vertical coordinate of the point is recorded. From several points it is possible to
reconstruct the surface profile. A confocal microscope can also be used (Becker et al., 2001
and Calvimontes et al., 2010). The principle consists in moving the lens in order to focus a
laser beam on a sample with the maximum light intensity.
Other devices are based on the basic study of the reflected light energy by a sample
highlighted by a light beam. The bigger the distance between the photodiode and the
surface, the lower the reflected light intensity is (Ringens et al., 2002). Ishizawa et al. (2002)
note the high correlation between such a measurement and “brightness”, “roughness” and
“luster” parameters defined for human visual characterization.
Xu et al. (1998) use a principle consisting in projecting a laser line on the surface of the
sample. This line is deviated because of the surface roughness. Surface state criteria can be
evaluated through deviations compared to the average line. This study is performed several
times in different orientations in order to characterize the surface and to determine the main
orientation of the structure.
Finally, a 3D scanning system based on laser triangulation technique can be used in order to
obtain a profile of the sample. Interferometric methods and more particularly
interferometric profilometer allow the user to determine the profile of the surface. A laser
www.intechopen.com
Optoelectronic Techniques for Surface Characterization of Fabrics
291
beam is splitted into a part which goes on the fabric and the other which goes on a fixed
mirror. The difference in the optical path between the two beams generates interferential
fringes. The number of fringes is proportional to the optical path difference. As the position
of the mirror is known the altitude of the surface point can be obtained.
Methods based on the projection of fringes (Conte et al.,1990) or speckle (Wang et al., 1998)
on the surface are also used to obtain information about the roughness of the surface in so
far as fringe patterns are obtained and analysed by image processing.
The measurement of textile hairiness was historically performed on yarns. The methods
used are optical with signal or image processing techniques. The most famous devices are
marketed and are the Uster Hairiness Tester (Durand and Schutz, 1983; Felix and Wampfler,
1990), the Zweigle hairiness meter or the Shirley hairiness monitor (Barella and Manich,
1993). Some other published techniques are based on different methods: light depolarization
due to yarn hairiness (Anand et al., 2005), image processing after image capture (Cybulska,
1999; Kuratle, 1999; Nevel et al., 1999), optical coding of yarn shadow with an optical matrix
(Stusak, 2004) or different shapes of optical digital sensors (Hensel et al., 2001). Fabric
hairiness study was recently reported in the literature. Actually fabric hairiness is not
commonly measured, essentially for on-line process control, as singeing, raising and so on.
Like for yarn hairiness control, the method can be optical with a signal or an image
processing (Osthoff-Senge; Governi and Furferi, 2005; Militky and Blesa, 2008).
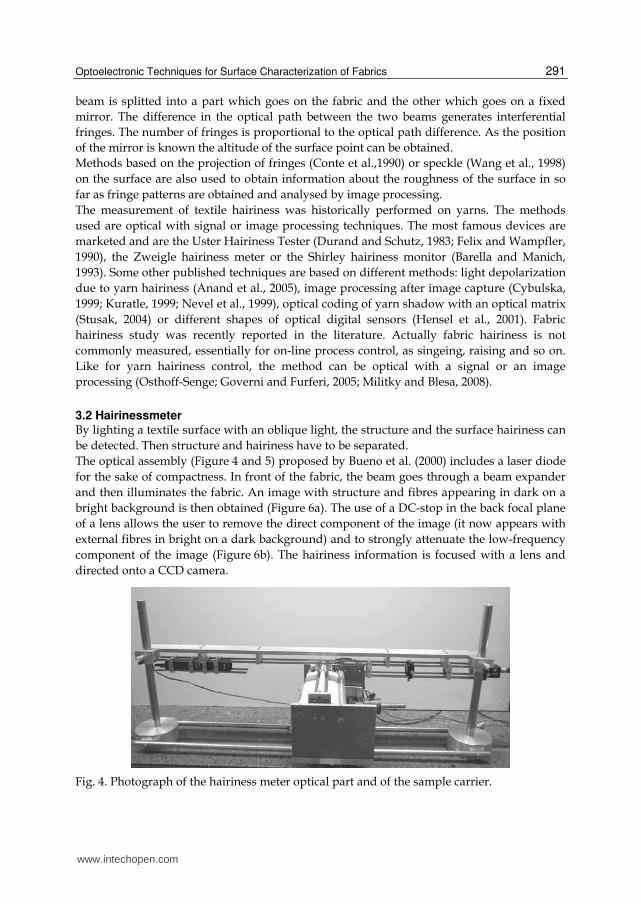
3.2 Hairinessmeter By lighting a textile surface with an oblique light, the structure and the surface hairiness can
be detected. Then structure and hairiness have to be separated.
The optical assembly (Figure 4 and 5) proposed by Bueno et al. (2000) includes a laser diode
for the sake of compactness. In front of the fabric, the beam goes through a beam expander
and then illuminates the fabric. An image with structure and fibres appearing in dark on a
bright background is then obtained (Figure 6a). The use of a DC-stop in the back focal plane
of a lens allows the user to remove the direct component of the image (it now appears with
external fibres in bright on a dark background) and to strongly attenuate the low-frequency
component of the image (Figure 6b). The hairiness information is focused with a lens and
directed onto a CCD camera.
Fig. 4. Photograph of the hairiness meter optical part and of the sample carrier.
www.intechopen.com

Optoelectronics - Materials and Techniques
292
The fabric moves during the measurement with the help of a motorized sample carrier. In order to present a great curvature, the fabric goes on a blade (Figure 5).
diode laser CCD
DC-stopf
f
sample
electrostatical field
Fig. 5. Hairiness meter optical assembly.
(a)
(b)
Fig. 6. Images of fabric hairiness without DC-stop (a), and with DC-stop (b).
The processing consists in computing the average grey level for each line, image by image.
The average value of grey level for each line can be determined for the whole movie:
k n i h
kk 1 i 1
1 1e( j) ( g (i, j))
n w
= =
= =
= ∑ ∑ (1)
where
j is the row number,
i is the column number,
k is the image number,
n is the total number of images in the movie (in this paper n=200),
gi,j,k: grey level of the i,j pixel for the kth image,
w: width of an image,
h: height of an image.
www.intechopen.com
Optoelectronic Techniques for Surface Characterization of Fabrics
293
(a)
(b)
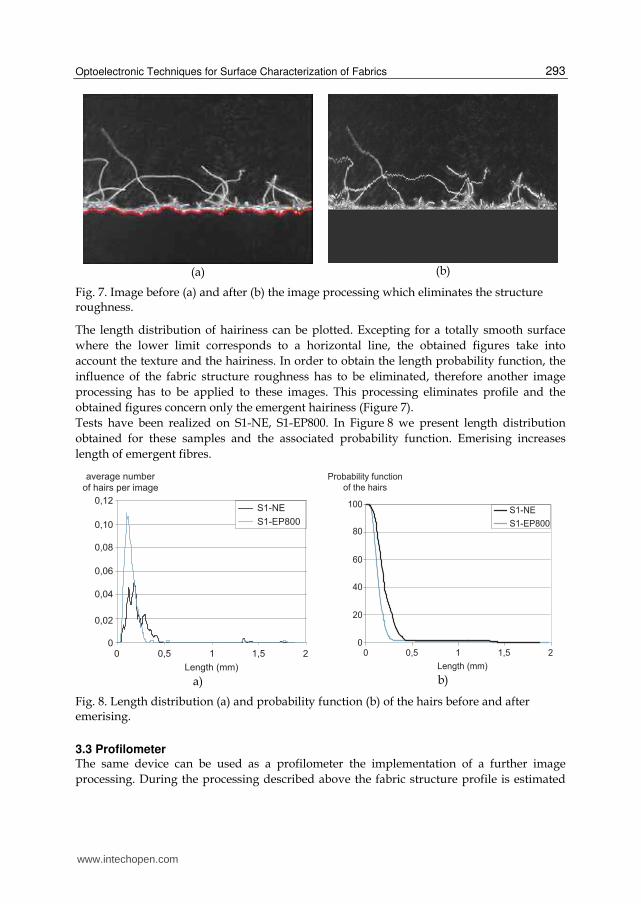
Fig. 7. Image before (a) and after (b) the image processing which eliminates the structure roughness.
The length distribution of hairiness can be plotted. Excepting for a totally smooth surface
where the lower limit corresponds to a horizontal line, the obtained figures take into
account the texture and the hairiness. In order to obtain the length probability function, the
influence of the fabric structure roughness has to be eliminated, therefore another image
processing has to be applied to these images. This processing eliminates profile and the
obtained figures concern only the emergent hairiness (Figure 7).
Tests have been realized on S1-NE, S1-EP800. In Figure 8 we present length distribution
obtained for these samples and the associated probability function. Emerising increases
length of emergent fibres.
Length (mm)
average number
of hairs per image
S1-NE
S1-EP800
0,02
0,04
0,06
0,08
0,10
0,12
00 0,5 21,51
a)
Length (mm)
0 0,5 21,51
100
80
60
40
20
0
Probability function
of the hairs
S1-NE
S1-EP800
b)
Fig. 8. Length distribution (a) and probability function (b) of the hairs before and after emerising.
3.3 Profilometer The same device can be used as a profilometer the implementation of a further image
processing. During the processing described above the fabric structure profile is estimated
www.intechopen.com
Optoelectronics - Materials and Techniques
294
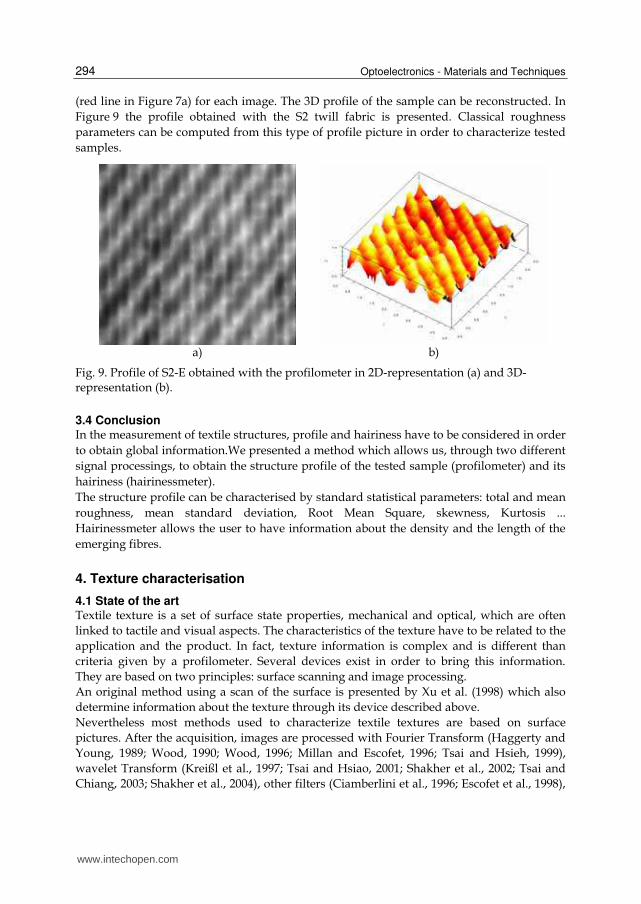
(red line in Figure 7a) for each image. The 3D profile of the sample can be reconstructed. In
Figure 9 the profile obtained with the S2 twill fabric is presented. Classical roughness
parameters can be computed from this type of profile picture in order to characterize tested
samples.
a)
b)
Fig. 9. Profile of S2-E obtained with the profilometer in 2D-representation (a) and 3D-representation (b).
3.4 Conclusion In the measurement of textile structures, profile and hairiness have to be considered in order
to obtain global information.We presented a method which allows us, through two different
signal processings, to obtain the structure profile of the tested sample (profilometer) and its
hairiness (hairinessmeter).
The structure profile can be characterised by standard statistical parameters: total and mean
roughness, mean standard deviation, Root Mean Square, skewness, Kurtosis ...
Hairinessmeter allows the user to have information about the density and the length of the
emerging fibres.
4. Texture characterisation
4.1 State of the art Textile texture is a set of surface state properties, mechanical and optical, which are often
linked to tactile and visual aspects. The characteristics of the texture have to be related to the
application and the product. In fact, texture information is complex and is different than
criteria given by a profilometer. Several devices exist in order to bring this information.
They are based on two principles: surface scanning and image processing.
An original method using a scan of the surface is presented by Xu et al. (1998) which also
determine information about the texture through its device described above.
Nevertheless most methods used to characterize textile textures are based on surface
pictures. After the acquisition, images are processed with Fourier Transform (Haggerty and
Young, 1989; Wood, 1990; Wood, 1996; Millan and Escofet, 1996; Tsai and Hsieh, 1999),
wavelet Transform (Kreißl et al., 1997; Tsai and Hsiao, 2001; Shakher et al., 2002; Tsai and
Chiang, 2003; Shakher et al., 2004), other filters (Ciamberlini et al., 1996; Escofet et al., 1998),
www.intechopen.com
Optoelectronic Techniques for Surface Characterization of Fabrics
295
or with statistical methods as those presented by Herlidou (1999). These techniques also
allow the user to determine defects in textile samples which can be periodic or not. They use
basic pictures of the sample but the image processing is often complex.
We have developed two methods. The first one is based on a kind of particular surface scanning useful for periodical textile surfaces. The second method is an image processing whose interest is to take into account the polarimetric properties of the textile surface.
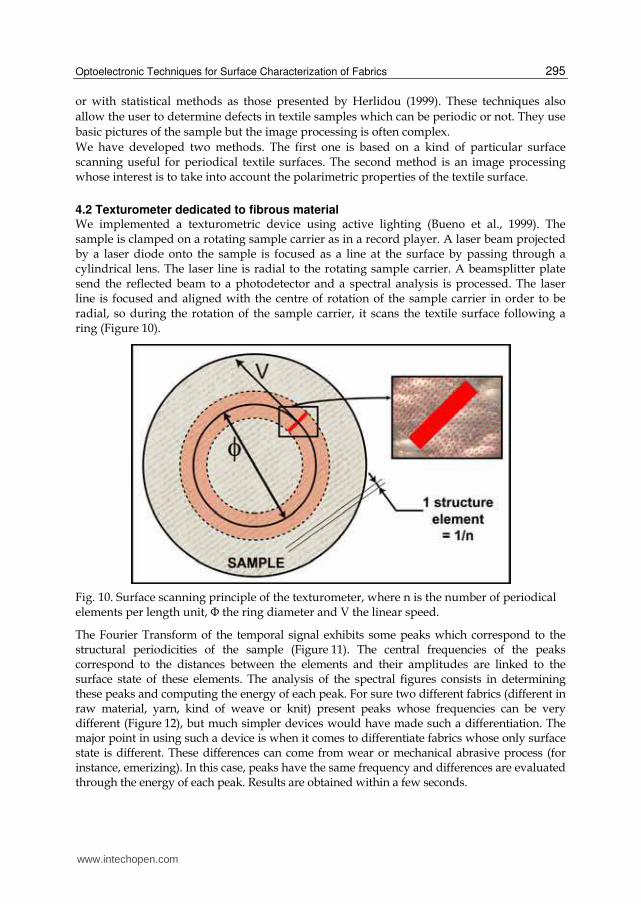
4.2 Texturometer dedicated to fibrous material We implemented a texturometric device using active lighting (Bueno et al., 1999). The sample is clamped on a rotating sample carrier as in a record player. A laser beam projected by a laser diode onto the sample is focused as a line at the surface by passing through a cylindrical lens. The laser line is radial to the rotating sample carrier. A beamsplitter plate send the reflected beam to a photodetector and a spectral analysis is processed. The laser line is focused and aligned with the centre of rotation of the sample carrier in order to be radial, so during the rotation of the sample carrier, it scans the textile surface following a ring (Figure 10).
Fig. 10. Surface scanning principle of the texturometer, where n is the number of periodical elements per length unit, Φ the ring diameter and V the linear speed.
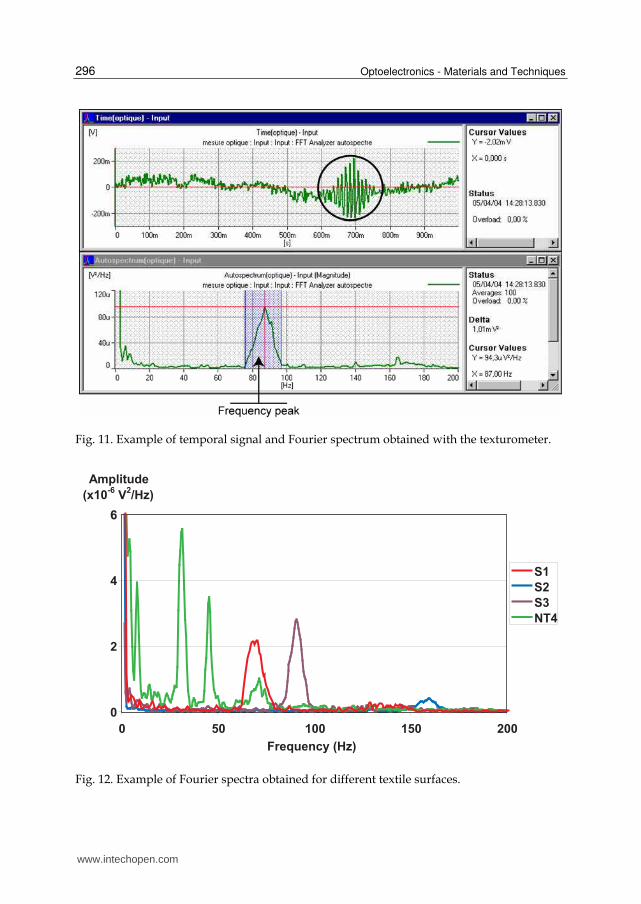
The Fourier Transform of the temporal signal exhibits some peaks which correspond to the structural periodicities of the sample (Figure 11). The central frequencies of the peaks correspond to the distances between the elements and their amplitudes are linked to the surface state of these elements. The analysis of the spectral figures consists in determining these peaks and computing the energy of each peak. For sure two different fabrics (different in raw material, yarn, kind of weave or knit) present peaks whose frequencies can be very different (Figure 12), but much simpler devices would have made such a differentiation. The major point in using such a device is when it comes to differentiate fabrics whose only surface state is different. These differences can come from wear or mechanical abrasive process (for instance, emerizing). In this case, peaks have the same frequency and differences are evaluated through the energy of each peak. Results are obtained within a few seconds.
www.intechopen.com
Optoelectronics - Materials and Techniques
296
Fig. 11. Example of temporal signal and Fourier spectrum obtained with the texturometer.
S1
S2
S3
NT4
0
2
4
6
0 50 100 150 200
Frequency (Hz)
Amplitude
(x10-6
V2/Hz)
Fig. 12. Example of Fourier spectra obtained for different textile surfaces.
www.intechopen.com
Optoelectronic Techniques for Surface Characterization of Fabrics
297
However, although it allows a good differentiation between samples, its results are not
always easily tractable. For instance the same finishing process applied to two different
fabrics can produce opposite peak evolutions: Sometimes the energy of the peak increases
with the hairiness density and other times it decreases. According to the fibres extraction
phenomena with abrasive process, the relief of the texture elements can by amplified or
reduced.
We therefore implemented an enhanced version of this device taking polarimetric properties
of the surface into account, in order to better characterize hairiness and periodical structure
of the sample.
Let us briefly remind the reader the basics of polarimetry.
A light wave is an electromagnetic wave whose polarization characteristics can be
completely represented by its Stokes vector (Goldstein, 2003):
0 0 90
1 0 90
2 45 45
3 r l
S I I
S I IS
S I I
S I I+ −
+⎡ ⎤ ⎡ ⎤⎢ ⎥ ⎢ ⎥−⎢ ⎥ ⎢ ⎥= =⎢ ⎥ ⎢ ⎥−⎢ ⎥ ⎢ ⎥−⎢ ⎥ ⎢ ⎥⎣ ⎦ ⎣ ⎦
f (2)
where
I0: the linearly polarized component along the horizontal axis,
I90: the linearly polarized component along the vertical axis,
I+45: the linearly polarized component at 45°,
I-45: the linearly polarized component at -45°,
Ir: the right circularly polarized component,
Il: the left circularly polarized component.
The degree of polarization (DOP) of such a light beam is defined as:
2 2 2pol 1 2 3
tot 0
I S S SP
I S
+ += = (3)
S0 corresponds to the total light intensity of the light wave and the other components to the
polarized parts.
As P = 1, the wave is totally polarized.
As P = 0, the wave is totally non-polarized.
If 0 < P < 1, P represents the amount of beam polarization.
A preliminary study with an incident linearly polarized beam allowed us a common
optical simplification. It showed that under normal incidence only a phenomenon of
depolarization occurs, i.e. only the S0 and S1 components are non-zero, which means that
neither rotation nor circularization of the polarization occur. So it is possible to simplify
equation 3 which could be calculated only from I0 and I90 components. We rename I0 I⁄⁄
(component whose polarization is parallel to the polarization of the incident beam) and I90
becomes I⊥ .
So the Stokes vector becomes:
www.intechopen.com
Optoelectronics - Materials and Techniques
298
//0 900
0 901 //
45 452
d g3
I II IS
I IS I IS
I IS 0
I IS 0
⊥
⊥
+ −
++ ⎡ ⎤⎡ ⎤⎡ ⎤ ⎢ ⎥⎢ ⎥⎢ ⎥− −⎢ ⎥⎢ ⎥⎢ ⎥= = = ⎢ ⎥⎢ ⎥⎢ ⎥ − ⎢ ⎥⎢ ⎥⎢ ⎥− ⎢ ⎥⎢ ⎥ ⎢ ⎥⎣ ⎦ ⎣ ⎦ ⎣ ⎦
f (4)
And the degree of polarization is:
2
//pol 11
tot 0 0 //
I II SSP
I S S I I
⊥
⊥
−= = = =
+ (5)
The DOP being totally defined with I⁄⁄ and I⊥ , it is only necessary to acquire these two
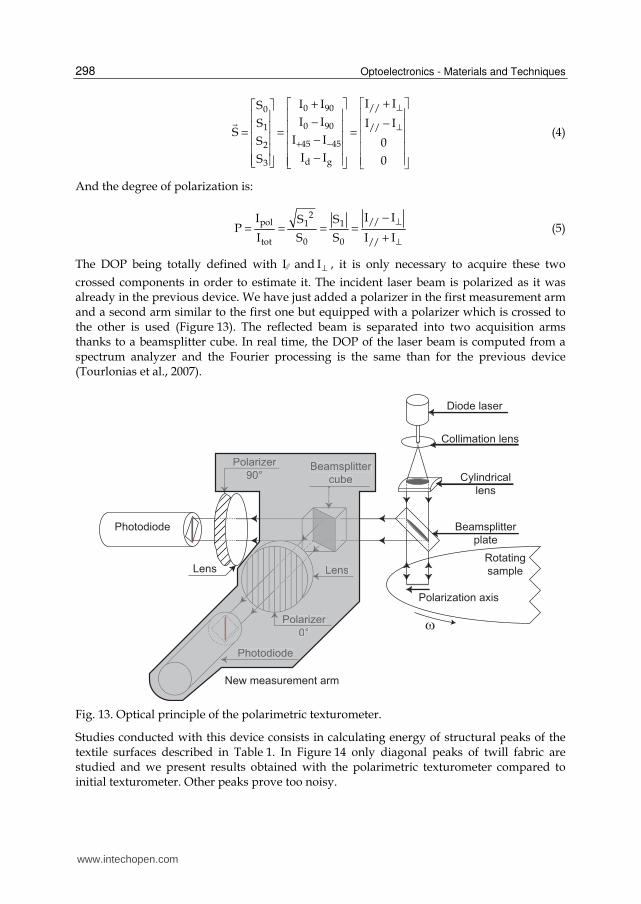
crossed components in order to estimate it. The incident laser beam is polarized as it was already in the previous device. We have just added a polarizer in the first measurement arm and a second arm similar to the first one but equipped with a polarizer which is crossed to the other is used (Figure 13). The reflected beam is separated into two acquisition arms thanks to a beamsplitter cube. In real time, the DOP of the laser beam is computed from a spectrum analyzer and the Fourier processing is the same than for the previous device (Tourlonias et al., 2007).
Diode laser
Collimation lens
Cylindrical
lens
Beamsplitter
plate
Rotating
sample
Photodiode
Lens
ω
Polarization axis
New measurement arm
Beamsplitter
cube
Polarizer
0°
Polarizer
90°
Photodiode
Lens
Fig. 13. Optical principle of the polarimetric texturometer.
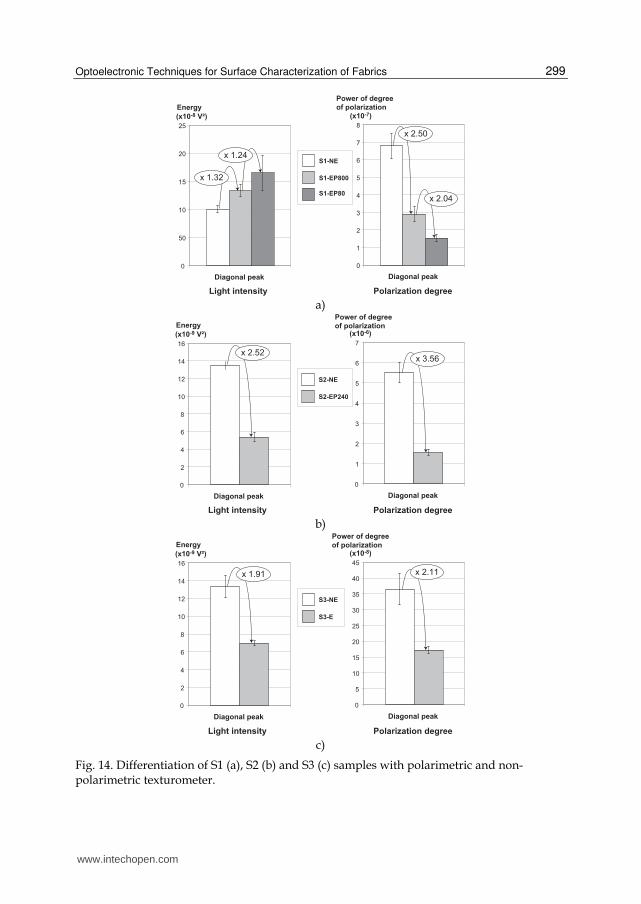
Studies conducted with this device consists in calculating energy of structural peaks of the textile surfaces described in Table 1. In Figure 14 only diagonal peaks of twill fabric are studied and we present results obtained with the polarimetric texturometer compared to initial texturometer. Other peaks prove too noisy.
www.intechopen.com
Optoelectronic Techniques for Surface Characterization of Fabrics
299
0
50
10
15
20
25
Diagonal peak
Energy
(x10-8 V²)
S1-NE
S1-EP800
S1-EP80
0
1
2
3
4
5
6
7
8
Diagonal peak
(x10-7)
Light intensity Polarization degree
Power of degree
of polarization
x 1.32
x 1.24
x 2.50
x 2.04
a)
0
1
2
3
4
5
6
7
Diagonal peak
(x10-6)
0
2
4
6
8
10
12
14
16
Diagonal peak
Energy
(x10-9 V²)
S2-NE
S2-EP240
Polarization degree
Power of degree
of polarization
x 3.56x 2.52
Light intensity b)
0
2
4
6
8
10
12
14
16
Diagonal peak
Energy
(x10-9 V²)
0
5
10
15
20
25
30
35
40
45
Diagonal peak
(x10-8)
S3-NE
S3-E
Polarization degree
Power of degree
of polarization
x 1.91 x 2.11
Light intensity c)
Fig. 14. Differentiation of S1 (a), S2 (b) and S3 (c) samples with polarimetric and non-polarimetric texturometer.
www.intechopen.com
Optoelectronics - Materials and Techniques
300
We can first note that with the non-polarimetric device, emerizing process not always has
the same influence on the results. It depends on the initial fabric. S1 energy increases with
emerizing, whereas energy decreases for the two other samples.
For all three fabrics, the differentiation between samples is reinforced with polarimetric
measurement. For the S1 case, classification is inverted because measurement with the
polarimetric device also takes into account the fibrous disorder due to the emerizing
process.
4.3 Image processing techniques applied to images in degree of polarization The principle used in the previous analysis proved well adapted to woven or knitted fabrics.
But it cannot be used in the case of non-periodic structures (needled nonwovens for
instance) and gives non relevant results when the surface presents zones with very different
characteristics (thermobonded nonwovens in this study). In this case direct imaging is
considered. A polarimetric setup was implemented from the beginning, since it can also
provide classical intensity results (Tourlonias et al., 2010).
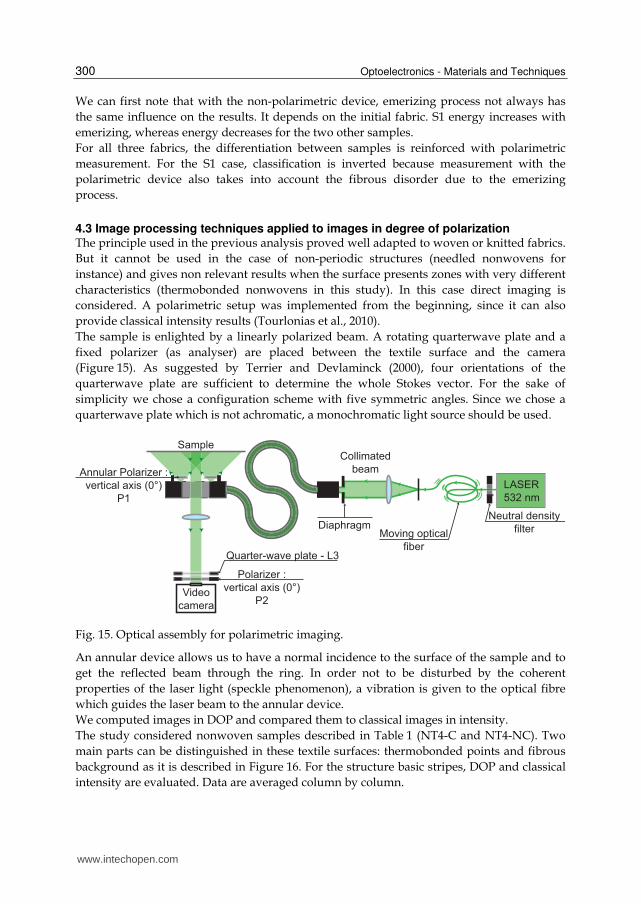
The sample is enlighted by a linearly polarized beam. A rotating quarterwave plate and a
fixed polarizer (as analyser) are placed between the textile surface and the camera
(Figure 15). As suggested by Terrier and Devlaminck (2000), four orientations of the
quarterwave plate are sufficient to determine the whole Stokes vector. For the sake of
simplicity we chose a configuration scheme with five symmetric angles. Since we chose a
quarterwave plate which is not achromatic, a monochromatic light source should be used.
LASER
532 nm
Diaphragm
SampleCollimated
beamAnnular Polarizer :
vertical axis (0°)
P1
Quarter-wave plate - L3
Polarizer :
vertical axis (0°)
P2Video
camera
Moving optical
fiber
Neutral density
filter
Fig. 15. Optical assembly for polarimetric imaging.
An annular device allows us to have a normal incidence to the surface of the sample and to
get the reflected beam through the ring. In order not to be disturbed by the coherent
properties of the laser light (speckle phenomenon), a vibration is given to the optical fibre
which guides the laser beam to the annular device.
We computed images in DOP and compared them to classical images in intensity.
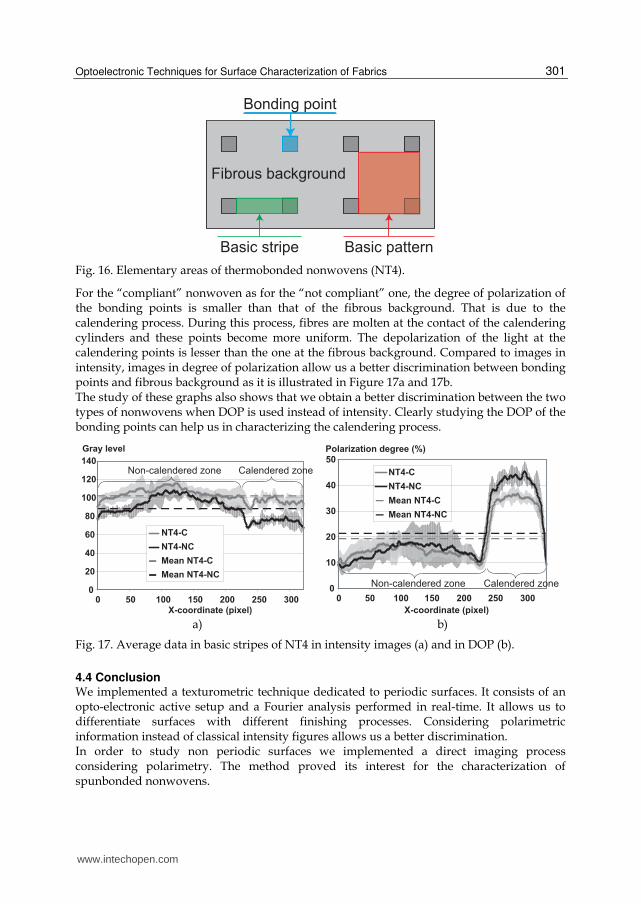
The study considered nonwoven samples described in Table 1 (NT4-C and NT4-NC). Two
main parts can be distinguished in these textile surfaces: thermobonded points and fibrous
background as it is described in Figure 16. For the structure basic stripes, DOP and classical
intensity are evaluated. Data are averaged column by column.
www.intechopen.com
Optoelectronic Techniques for Surface Characterization of Fabrics
301
Basic stripe Basic pattern
Bonding point
Fibrous background
Fig. 16. Elementary areas of thermobonded nonwovens (NT4).
For the “compliant” nonwoven as for the “not compliant” one, the degree of polarization of the bonding points is smaller than that of the fibrous background. That is due to the calendering process. During this process, fibres are molten at the contact of the calendering cylinders and these points become more uniform. The depolarization of the light at the calendering points is lesser than the one at the fibrous background. Compared to images in intensity, images in degree of polarization allow us a better discrimination between bonding points and fibrous background as it is illustrated in Figure 17a and 17b. The study of these graphs also shows that we obtain a better discrimination between the two types of nonwovens when DOP is used instead of intensity. Clearly studying the DOP of the bonding points can help us in characterizing the calendering process.
0
20
40
60
80
100
120
140
0 50 100 150 200 250 300X-coordinate (pixel)
Gray level
Non-calendered zone Calendered zone
NT4-C
NT4-NC
Mean NT4-C
Mean NT4-NC
a)
0
10
20
30
40
50
0 50 100 150 200 250 300
X-coordinate (pixel)
Polarization degree (%)
NT4-C
NT4-NC
Mean NT4-C
Mean NT4-NC
Non-calendered zone Calendered zone
b)
Fig. 17. Average data in basic stripes of NT4 in intensity images (a) and in DOP (b).
4.4 Conclusion We implemented a texturometric technique dedicated to periodic surfaces. It consists of an opto-electronic active setup and a Fourier analysis performed in real-time. It allows us to differentiate surfaces with different finishing processes. Considering polarimetric information instead of classical intensity figures allows us a better discrimination. In order to study non periodic surfaces we implemented a direct imaging process considering polarimetry. The method proved its interest for the characterization of spunbonded nonwovens.
www.intechopen.com
Optoelectronics - Materials and Techniques
302
5. Applications to characterize mechanical properties of textile surfaces
5.1 State of the art Above mentioned optical methods allow the user to obtain information about surface state of textile materials but we also would like to get some information about mechanical properties of such materials. Tensile properties would be of particular interest. Several non-contact extensometers have been developed when it is not the better solution to use strain gauges, especially for great deformations. Hiver et al. (2002) and François et al. (1994), present methods where marks (lines or dots) are added at the surface of the sample. Their displacement during a tensile test is studied thanks to a video camera. Fiedler Company, Grellmann et al. (1997), Casarotto et al. (2003) and Chmelik et al. (2002) also use such methods. Marks which are normal to the tensile direction have reflective properties and are scanned by a laser beam. The reflective beam is acquired by a photodiode and the distance between marks, i.e. strain of the surface, is obtained relative to tensile load. Grellmann and Bierögel present a more complete device based on the same principle, but through several laser sources it is possible to study the strain at different locations. Other methods without any added mark have also been developed. Lighting rough surfaces with coherent light induce speckle pattern whose properties are modified with strain. Image processing have been used by Anwander et al. (2000), Zhang et al. (2002), Laraba-Abbes et al. (2003) and Amodio et al. (2003) using these optical properties. Image correlation techniques allow following strains of the sample. Stereoscopic correlation is also used in order to determine the 3D coordinates of points of the tested material and the displacements of these points correspond to strain as it is proposed by Luo and Chen (2000) and Mistou et al. (2003). Dumont et al. (2003) also characterize woven fabrics with this method. Tension properties of thermobonded nonwovens depend on mechanical properties of the bonding points and on the fibre orientation in the fibrous background. In bonding points material is molten and can be considered as a film. The difficulty consists in evaluating fibre orientation in the fibrous background. Hearle and Stevenson (1963) list and explain different methods in order to determine fibre orientation in their study of nonwoven fabrics. A manual and tedious method, corresponding to means available in 1963, consists in counting fibres in 101 angular parts. Histogram gathers obtained results. Methods based on the study of transmitted light and phenomena of dichroism and birefringence does not seem to give good results. More recently Pourdeyhimi et al. (1993, 1996a, 1996b, 1997a, 1997b, 1999) have conducted a whole study on nonwoven fabrics. A model of nonwoven image is proposed and several image processing techniques are tested in order to determine fibre orientation of this virtual sample. First a tracking algorithm is applied and the end-to-end chord of each fibre gives its orientation, leading to the orientation distribution function. Alternatively a digital Fourier Transform can be used and gives similar information. The third proposed method is a flow field analysis. It is the most accurate method but only gives the mean orientation angle. In the last part of the series of papers Pourdeyhimi et al. explain how to process real nonwoven images in order to apply these techniques. They perform a thresholding process after a contrast enhancement procedure. The tracking method is presented as the best in order to determine the orientation distribution functions whereas Fourier transform proves better for quality control. A device is presented in order to realize an optical Fourier transform. Results obtained with both Fourier studies are similar and the main advantage of the optical method is speed. Pourdeyhimi and Kim (2002) also presented a method based on Hough transform but this method seems to be complex and slow.
www.intechopen.com
Optoelectronic Techniques for Surface Characterization of Fabrics
303
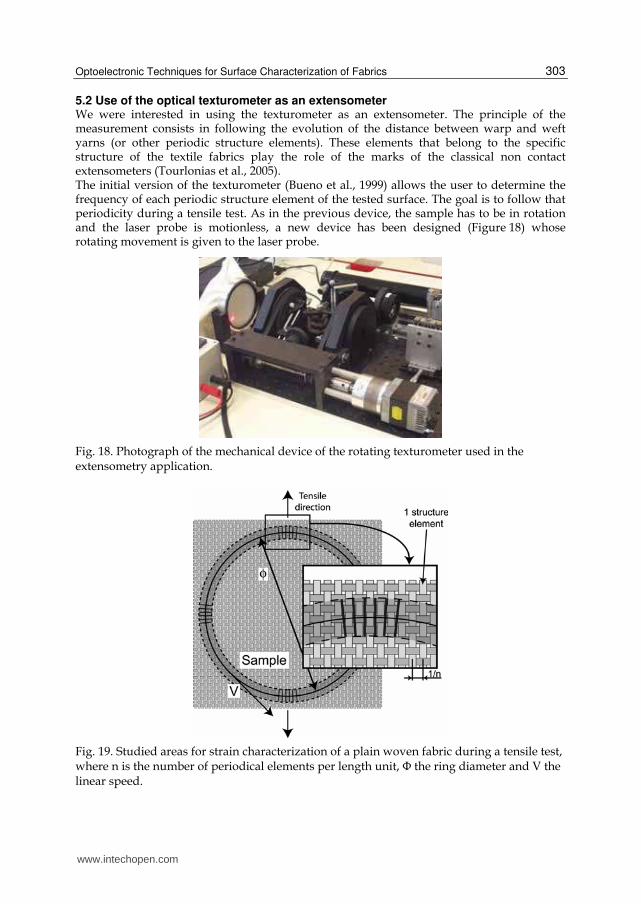
5.2 Use of the optical texturometer as an extensometer We were interested in using the texturometer as an extensometer. The principle of the measurement consists in following the evolution of the distance between warp and weft yarns (or other periodic structure elements). These elements that belong to the specific structure of the textile fabrics play the role of the marks of the classical non contact extensometers (Tourlonias et al., 2005). The initial version of the texturometer (Bueno et al., 1999) allows the user to determine the frequency of each periodic structure element of the tested surface. The goal is to follow that periodicity during a tensile test. As in the previous device, the sample has to be in rotation and the laser probe is motionless, a new device has been designed (Figure 18) whose rotating movement is given to the laser probe.
Fig. 18. Photograph of the mechanical device of the rotating texturometer used in the extensometry application.
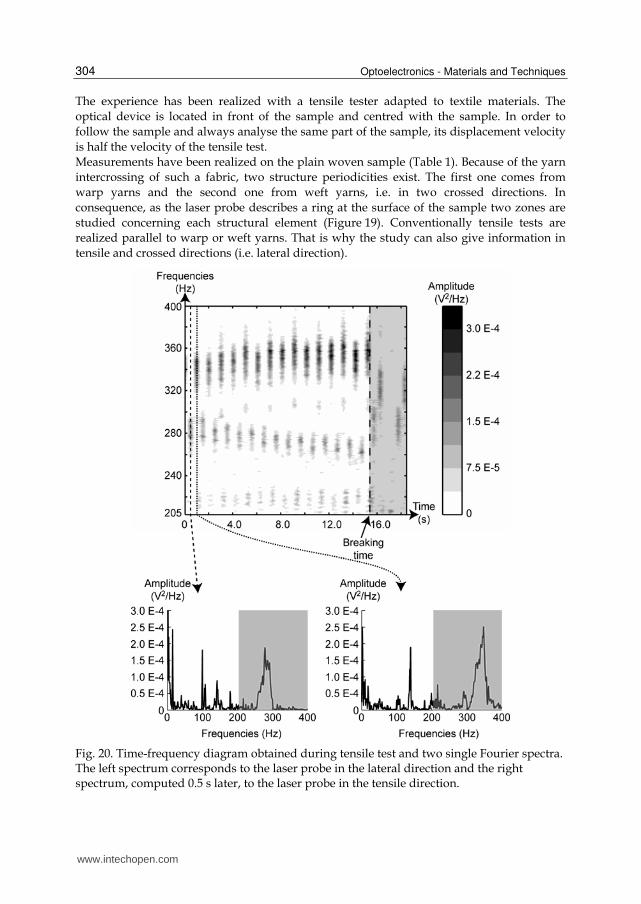
Fig. 19. Studied areas for strain characterization of a plain woven fabric during a tensile test, where n is the number of periodical elements per length unit, Φ the ring diameter and V the linear speed.
www.intechopen.com
Optoelectronics - Materials and Techniques
304
The experience has been realized with a tensile tester adapted to textile materials. The
optical device is located in front of the sample and centred with the sample. In order to
follow the sample and always analyse the same part of the sample, its displacement velocity
is half the velocity of the tensile test.
Measurements have been realized on the plain woven sample (Table 1). Because of the yarn
intercrossing of such a fabric, two structure periodicities exist. The first one comes from
warp yarns and the second one from weft yarns, i.e. in two crossed directions. In
consequence, as the laser probe describes a ring at the surface of the sample two zones are
studied concerning each structural element (Figure 19). Conventionally tensile tests are
realized parallel to warp or weft yarns. That is why the study can also give information in
tensile and crossed directions (i.e. lateral direction).
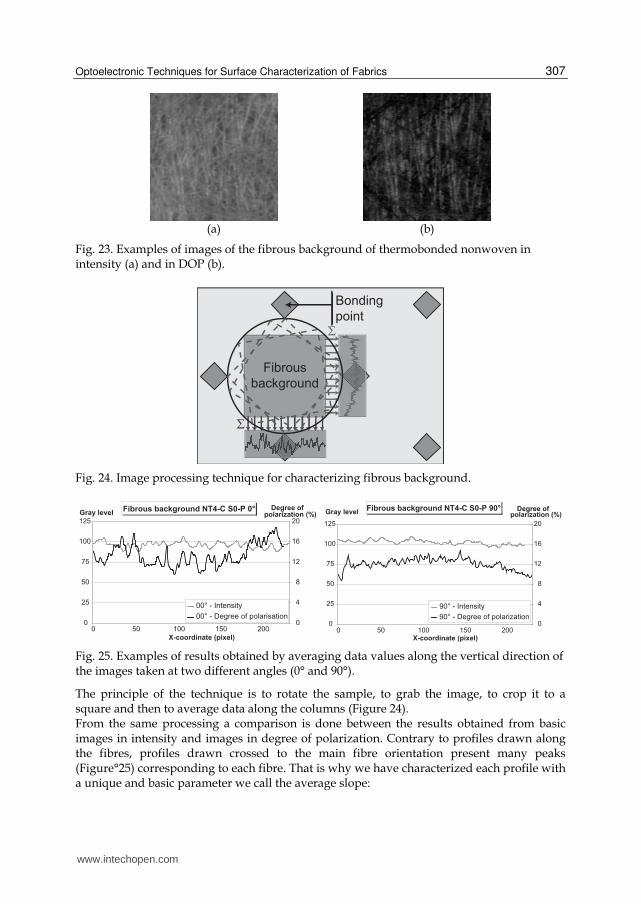
Fig. 20. Time-frequency diagram obtained during tensile test and two single Fourier spectra. The left spectrum corresponds to the laser probe in the lateral direction and the right spectrum, computed 0.5 s later, to the laser probe in the tensile direction.
www.intechopen.com

Optoelectronic Techniques for Surface Characterization of Fabrics
305
So it is possible to study a time–frequency diagram constituted of successive frequential
spectra. The distance variations between periodic elements of the sample correspond to the
evolution of the local strain in each direction.
Figure 20 presents a time–frequency diagram that we obtain with a representation of two
examples of elementary Fourier spectra due to two crossed periodic structure elements.
The central frequency corresponding to their periodicity is quite different. On the time–
frequency diagram we can easily follow the frequency variations of each structure
element.
In the lateral direction, the length variation of a structure element orthogonal to the tensile direction is:
1 0 1 0
V V V Vl dl nl
F F F F
⎛ ⎞ ⎛ ⎞δ = − ⇒ = −⎜ ⎟ ⎜ ⎟⎜ ⎟ ⎜ ⎟⎝ ⎠ ⎝ ⎠ (6)
where
δl: length variation of a structure element orthogonal to the tensile direction (10-3 m),
dl: width variation of the sample (10-3 m),
l: width of the sample (10-3 m),
V: linear speed of the laser beam (10-3 m.s-1),
n: number of studied structure elements per length unit (10-3 m-1),
F0: frequency of the studied element before deformation (Hz),
F1: frequency of the studied element at time t1 (Hz).
Using the same principle, the strain in the longitudinal direction can be calculated:
1 0 1 0
V V V VL dL nL
F F F F
⎛ ⎞ ⎛ ⎞δ = − ⇒ = −⎜ ⎟ ⎜ ⎟⎜ ⎟ ⎜ ⎟⎝ ⎠ ⎝ ⎠ (7)
where
δL: length variation of one structure element in the tensile direction (10-3 m),
dL: length variation of the sample (10-3 m),
L: length of the sample (10-3 m).
Actually, from the study of the structural peaks of these graphs it is possible to determine
the local strain in each direction during the tensile test. By averaging five tests we can obtain
results presented in Figure 21. These tests are performed in the weft direction. Local strains
are evaluated in directions parallel and crossed to the tensile test. We finally reported local
strain vs. mean strain. As expected when the sample stretches in the tensile direction, it
shrinks in width.
Comparative tests have been realized on the same samples with a classic commercial laser extensometer whose principle consists in sticking marks perpendicular to the tensile direction (Fiedler). Results graphs are reported in Figure 22. This graph shows that the two series of results are very close. Nevertheless the commercial device only gives information in one direction at a time. Furthermore, during the tensile test, because of the contraction of the sample, marks made wrinkles that disturb measurement. Finally the drawback of our implementation would be its reduced speed because of the rotation speed of the laser line.
www.intechopen.com

Optoelectronics - Materials and Techniques
306
Fig. 21. Longitudinal and lateral strains obtained in weft directions for the plain woven fabric.
Fig. 22. Longitudinal strain obtained in weft directions for the plain woven fabric with commercial laser extensometer in comparison with our optical extensometer.
5.3 Estimation of fibre orientation in a nonwoven using polarimetric imaging We proved in §4.4 that considering thermobonded nonwovens, polarimetric imaging
allowed differentiating the bonding points from the fibrous background through a basic
image processing.
In this part we will only consider the fibrous background. We propose to apply another
image processing to the same images in degree of polarization in order to determine the
fibre orientation. By visual analysis of images in degree of polarization it is obvious that
fibres are emphasized compared to images in intensity (Figure 23).
www.intechopen.com
Optoelectronic Techniques for Surface Characterization of Fabrics
307
(a)
(b)
Fig. 23. Examples of images of the fibrous background of thermobonded nonwoven in intensity (a) and in DOP (b).
Σ
Σ
Bonding
point
Fibrous
background
Fig. 24. Image processing technique for characterizing fibrous background.
Fibrous background NT4-C S0-P 0°
0
25
50
75
100
125
0 50 100 150 200
X-coordinate (pixel)
Gray level
0
4
8
12
16
20
Degree of polarization (%)
00° - Intensity
00° - Degree of polarisation0
25
50
75
100
125
0 50 100 150 200X-coordinate (pixel)
Gray level
0
4
8
12
16
20
Degree of polarization (%)
90° - Intensity
90° - Degree of polarization
Fibrous background NT4-C S0-P 90°
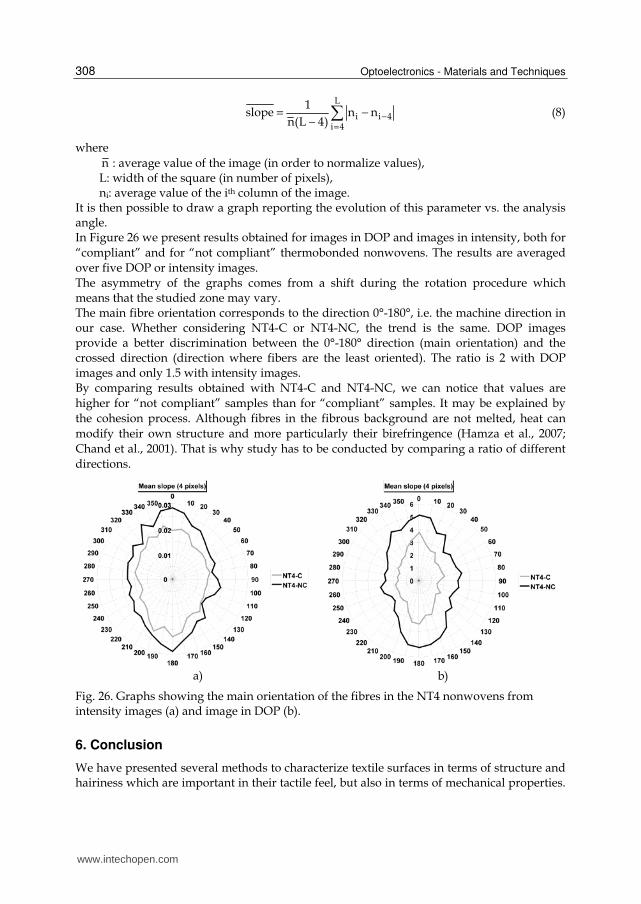
Fig. 25. Examples of results obtained by averaging data values along the vertical direction of the images taken at two different angles (0° and 90°).
The principle of the technique is to rotate the sample, to grab the image, to crop it to a square and then to average data along the columns (Figure 24). From the same processing a comparison is done between the results obtained from basic images in intensity and images in degree of polarization. Contrary to profiles drawn along the fibres, profiles drawn crossed to the main fibre orientation present many peaks (Figure°25) corresponding to each fibre. That is why we have characterized each profile with a unique and basic parameter we call the average slope:
www.intechopen.com
Optoelectronics - Materials and Techniques
308
L
i i 4i 4
1slope n n
n(L 4)−
=
= −−
∑ (8)
where
n : average value of the image (in order to normalize values), L: width of the square (in number of pixels), ni: average value of the ith column of the image.
It is then possible to draw a graph reporting the evolution of this parameter vs. the analysis angle. In Figure 26 we present results obtained for images in DOP and images in intensity, both for
“compliant” and for “not compliant” thermobonded nonwovens. The results are averaged
over five DOP or intensity images. The asymmetry of the graphs comes from a shift during the rotation procedure which means that the studied zone may vary. The main fibre orientation corresponds to the direction 0°-180°, i.e. the machine direction in our case. Whether considering NT4-C or NT4-NC, the trend is the same. DOP images provide a better discrimination between the 0°-180° direction (main orientation) and the crossed direction (direction where fibers are the least oriented). The ratio is 2 with DOP images and only 1.5 with intensity images. By comparing results obtained with NT4-C and NT4-NC, we can notice that values are
higher for “not compliant” samples than for “compliant” samples. It may be explained by
the cohesion process. Although fibres in the fibrous background are not melted, heat can
modify their own structure and more particularly their birefringence (Hamza et al., 2007;
Chand et al., 2001). That is why study has to be conducted by comparing a ratio of different
directions.
a)
b)
Fig. 26. Graphs showing the main orientation of the fibres in the NT4 nonwovens from intensity images (a) and image in DOP (b).
6. Conclusion
We have presented several methods to characterize textile surfaces in terms of structure and hairiness which are important in their tactile feel, but also in terms of mechanical properties.
www.intechopen.com
Optoelectronic Techniques for Surface Characterization of Fabrics
309
In order to avoid artifacts likely to occur with mechanical techniques when studying this tiny hairiness, we only considered optical techniques, therefore contactless. These techniques combine active imaging, enhanced detection (esp. polarimetric detection) and post-processing and were implemented into three setups. One is a hairinessmeter also able to work as a profilemeter for any soft material, the second is a texturometer for periodically structured materials whose a modified version allows to study samples in situ and the third one consists of a polarimetric imager. Through detailed examples, these methods have proved their interest in particular applications considering industrial issues (differentiation of very close samples, characterization or control during manufacturing process) as well as their speed of operation compared to methods often based on tedious data acquisition or long processings. It was also shown that obtaining several parameters or metrics with a unique measurement (for instance, periodical structure and state of surface with the polarimetric texturometer) is possible.
7. Acknowledgements
The authors wish to thank the Région Alsace for partial funding of this research.
8. References
Amodio, D., Broggiato, G. B., Campana, F. & Newaz, G.-M., Digital Speckle Correlation for Strain Measurement by Image Analysis, Experimental Mechanics 43(4) (2003) 396-402.
Anand, Arun, Chhaniwal, Vani K. & Narayanamurthy, C. S., Hairiness measurement of textile yarns using crossed polarizers, Review of Scientific Instruments 76(7) (2005) 076104-3.
Anwander, M., Zagar, B. G., Weiss, B. & Weiss, H., Noncontacting Strain Measurements at High Temperatures by the Digital Laser Speckle Technique, Experimental Mechanics 40(1) (2000) 98-105.
Barella, A. & Manich, A.M., The hairness of yarns, Textile Progress 24(3) (1993) 1-49. Becker, Jean-Marie, Grousson, Stephane & Jourlin, Michel, Surface state analysis by means
of confocal microscopy, Cement and Concrete Composites 23(2-3) (2001) 255-259. Bueno, Marie-Ange, Durand, Bernard & Renner, Marc, Noncontact Measurements of
Sanding and Raising Effects, Textile Research Journal 69(8) (1999) 570-575. Bueno, Marie-Ange, Durand, Bernard & Renner, Marc, Optical characterization of the state
of fabric surfaces, Optical Engineering 39(6) (2000) 1697-1703. Calvimontes, Alfredo, Dutschk, Victoria & Stamm, Manfred, Advances in Topographic
Characterization of Textile Materials., Textile Research Journal 80(11) (2010) 1004-1015.
Casarotto, L., Tutsch, R., Ritter, R., Weidenmuller, J., Ziegenbein, A., Klose, F. & Neuhauser, H., Propagation of deformation bands investigated by laser scanning extensometry, Computational Materials Science 26 (2003) 210-218.
Chand, Subhash, Bhat, Gajanan S., Spruiell, Joseph E. & Malkan, Sanjiv, Structure and properties of polypropylene fibers during thermal bonding, Thermochimica Acta 367-368((2001) 155-160.
Chmelik, Frantisek, Ziegenbein, Alf, Neuhauser, Hartmut & Lukac, Pavel, Investigating the Portevin-Le Chatelier effect by the acoustic emission and laser extensometry techniques, Materials Science and Engineering A 324(1-2) (2002) 200-207.
www.intechopen.com
Optoelectronics - Materials and Techniques
310
Ciamberlini, Claudio, Francini, Franco, Longobardi, Giuseppe, Sansoni, Paola & Tiribilli, Bruno, Defect detection in textured materials by optical filtering with strutured detectors and self-adaptable masks, Society of Photo-Optical Instrumentation Engineers 35(3) (1996) 838-844.
Conte, M., Jamet, Y., Duhamel, J., Jarrigeon, M. & Calonnier, M., Roughness Measurement by Laser, Industrie Textile 1212) (1990) 105-107.
Cybulska, Maria, Assessing Yarn Structure with Image Analysis Methods, Textile Research Journal 69(5) (1999) 369-374.
Dumont, Francois, Hivet, Gilles, Rotinat, Rene, Launay, Jean, Boisse, Philippe & Vacher, Pierre, Mesures de champs pour des essais de cisaillement sur des renforts tisses: Field measurements for shear tests on woven reinforcements, Mecanique & Industries 4(6) (2003) 627-635.
Durand, B. & Schutz, R. A., Procédé et dispositif pour analyser les éléments émergeant de la surface
d'un produit. 1983: French Patent 3 556 837. Escofet, Jaume, Navarro, Rafael, Millan, Maria S. & Pladellorens, Josep, Detection of local
defects in textile webs using Gabor filters, Optical Engineering 37(8) (1998) 2297-2307.
Felix, Ernst & Wampfler, Hans, Method and apparatus for examining hairiness of yarn. 1990, Zellweger Uster: US.
Fiedler, Laser Extensometer/Laser Doppler Extensometer, http://www.foe.de/. François, P., Gloaguen, J.-M., Hue, B. & Lefebvre, J.-M., Volume strain measurements by
optical extensometry: application to the tensile behaviour of RT-PMMA, Journal de Physique III 4(2) (1994) 321-329.
Goldstein, Dennis, Polarized Light - Second Edition, revised and expanded, Marcel Dekker, New-York, Basel, 2003.
Governi, Lapo & Furferi, Rocco. An Image Processing based Method for Monitoring the Raising Process. in Abstracts of the Fiber Society Symposium. 2005. Sankt Gallen (Switzerland).
Grellmann, Wolfgang & Bierögel, Christian, Laserextensometrie anwenden:: Einsatzmöglichkeiten und Beispiele aus der Kunststoffprüfung = Equipent for laser extensometry. Potential of employment and examples for the application in testing of polymers, Materialprüfung 40 (11-12) (1998) 452-459.
Grellmann, Wolfgang, Bierögel, Christian & Konig, S., Evaluation of deformation behaviour in polyamide using laser extensometry, Polymer Testing 16(3) (1997) 225-240.
Haggerty, Joe & Young, Matt, Spatial light modulator for texture classification, Applied Optics 28(23) (1989) 4992-4995.
Hamza, A.A., Belal, A.E., Sokkar, T.Z.N., El-Bakary, M.A. & Yassien, K.M., Measurement of the spectral dispersion curves of low birefringence polymer fibres, Optics and Lasers in Engineering 45(9) (2007) 922-928.
Hearle, J.W.S. & Stevenson, P.J., Nonwoven Fabric Studies - Part III: The Anisotropy of Nonwoven Fabrics, Textile Research Journal 33(11) (1963) 877-888.
Hensel, Rolf, Wampfler, Hans, Raynor, Jeffrey Mitchell & Seitz, Peter Markus, Device for
optically recording, digitally, a parameter on a longitudinally moved thread-type material. 2001, Zellweger Luwa AG: US.
Herlidou, Sandra, Ph.D thesis: Caractérisation tissulaire en IRM par l'analyse de texture : Etude
du tissu musculaire et de tumeurs intracraniennes. 1999, Université de Rennes 1: Rennes.
www.intechopen.com
Optoelectronic Techniques for Surface Characterization of Fabrics
311
Hiver, Jean-Marie, Dahoun, Abdesslam & Christian, G'Sell. Endommagement plastique dans les mélanges de polymères : mesure in-situ en temps réel dans la striction. in Matériaux : de la conception à la mise en oeuvre. 2002. Tours.
Ishizawa, H., Nishimatsu, T., Kamijyo, M. & Toba, E., Measurement of Surface Properties of Woven Fabrics Using an Optical Bundle, Journal of Textile Engineering 48(1) (2002) 5-10.
Kreißl, Mario, Heiko, Schwarzer & Teiwes, Stephan, Optical processor for real-time detection of defects in textile webs, Proc. SPIE 3073 : Optical Pattern Recognition VIII (1997) 307-311.
Kuratle, Christoph, Method and device for determining the optical features of treads. 1999, Maschinenfabrik Rieter AG: World.
Laraba-Abbes, Fazilay, Ienny, Patrick & Piques, Roland, A new 'tailor-made' methodology for the mechanical behaviour analysis of rubber-like materials: I. Kinematics measurements using a digital speckle extensometry, Polymer 44(3) (2003) 807-820.
Luo, P. F. & Chen, J. N., Measurement of Curved-surface Deformation in Cylindrical Coordinates, Experimental Mechanics 40(4) (2000) 345-350.
Militky, Jiri & Blesa, Martin, Evaluation of patterned fabric surface roughness., Indian Journal of Fibre & Textile Research 33(3) (2008) 246-252.
Millan, Maria S. & Escofet, Jaume, Fourier-domain-based angular correlation for quasiperiodic pattern recognition. Applications to web inspection, Applied Optics 35(31) (1996) 6253-6260.
Mistou, Sebastien, Karama, Moussa, Dalverny, Olivier, Siguier, Jean-Michel & Guigue-Joguet, Pascale, Mesure 3D sans contact des deplacements et deformations sur des films plastiques transparents par stereo-correlation: 3D non-contact measurement of strain and displacement on transparent plastic films by stereo correlation, Mecanique & Industries 4(6) (2003) 637-643.
Nevel, Avishaï, Gordon, Kendall W. & Leary, Steven, System and method for determining yarn
hairiness. 1999, Lawson Hamphill Inc.: US. OSTHOFF-SENGE. – Hairiness Measuring Device Hamsat, http://www.osthoff-senge.com/en/produkte.html. Pourdeyhimi, B., Assessing Fiber Orientation In Nonwoven Fabrics, INDA J. Nonwoven Res
5(4) (1993) 29-36. Pourdeyhimi, B. & Dent, R., Measuring Fiber Orientation in Nonwovens - Part IV: Flow
Field Analysis, Textile Research Journal 67(3) (1997) 181-187. Pourdeyhimi, B., Dent, R. & Davis, H., Measuring Fiber Orientation in Nonwovens - Part III:
Fourier Transform, Textile Research Journal 67(2) (1997) 143-151. Pourdeyhimi, B., Dent, R., Jerbi, A., Tanaka, S. & Deshpande, A., Measuring Fiber
Orientation in Nonwovens - Part V: Real Webs, Textile Research Journal 63(3) (1999) 185-192.
Pourdeyhimi, B. & Kim, H. S., Measuring Fiber Orientation in Nonwovens: The Hough Transform., Textile Research Journal 72(9) (2002) 803.
Pourdeyhimi, B., Ramanathan, R. & Dent, R., Measuring Fiber Orientation in Nonwovens - Part I: Simulation, Textile Research Journal 66(11) (1996a) 713-722.
Pourdeyhimi, B., Ramanathan, R. & Dent, R., Measuring Fiber Orientation in Nonwovens - Part II: Direct Tracking, Textile Research Journal 66(12) (1996b) 747-753.
Ramgulam, R.-B., Amirbayat, J. & Porat, I., Measurement of fabric roughness by a non-contact method, Journal of the Textile Institute 84(1) (1993) 99-106.
www.intechopen.com

Optoelectronics - Materials and Techniques
312
Ringens, Werner, Bahners, Thomas & Schollmeyer, Eckhard, Characterisation and control of thread datain textil processes using optical profilometry, Melliand Textilberichte/International Textile Reports 83(20) (2002) 715-716/E140.
Seifert, Ralph, Raue, Peter, Offermann, Peter, Bahners, Thomas, Schollmeyer, Eckhard, Mägel, Matthias & Fuchs, Hilmar, Surface Characterisation of Textile Fabrics.: Part 3: Profilometric Measuring Systems, Melliand Textilberichte/International Textile Reports 76(9) (1995) 636-639/E164-E166.
Shakher, C., Ishtiaque, S.M. , Singh, S.K. & Zaidi, H.N., Application of Wavelet Transform in Characterization of Fabric Texture, Journal of the Textile Institute 95(1) (2004) 107 - 120.
Shakher, Chandra, Istiaque, S.-M. & Singh, Shashi-Kumar, Application of wavelet transform in characterization of fabric texture, Proc. SPIE 4929 : Optical Information Processing Technology (2002) 158-164.
Stusak, Miroslav, Method and device for contactless measurement of a linear tactile formation such
as yarn etc. 2004: US - 10/405,581. Terrier, Patrick & Devlaminck, Vincent, Système polarimétrique pour l'analyse d'images,
Traitement du Signal 17(5-6) (2000) 479-490. Tourlonias, Michel, Bigué, Laurent & Bueno, Marie-Ange, Contribution of polarimetric
imaging for the characterization of fibrous surface properties at different scales, Optics and Lasers in Engineering 48(1) (2010) 75-82.
Tourlonias, Michel, Bigué, Laurent & Bueno, Marie-Ange, Polarimetric measurements of fabric surfaces, Optical Engineering 46(8) (2007) 083602.
Tourlonias, Michel, Bueno, Marie-Ange, Bigué, Laurent, Durand, Bernard & Renner, Marc, Contactless Optical Extensometer for Textile Materials, Experimental Mechanics 45(5) (2005) 420-426.
Tsai, Du-Ming & Chiang, Cheng-Huei, Automatic band selection for wavelet reconstruction in the application of defect detection, Image and Vision Computing 21(5) (2003) 413-431.
Tsai, Du-Ming & Hsiao, Bo, Automatic surface inspection using wavelet reconstruction, Pattern Recognition 34(6) (2001) 1285-1305.
Tsai, Du-Ming & Hsieh, C. -Y., Automated surface inspection for directional textures, Image and Vision Computing 18(1) (1999) 49-62.
Wang, W., L. Wong, P., B. Luo, J. & Zhang, Z., A new optical technique for roughness measurement on moving surface, Tribology International 31(5) (1998) 281-287.
Wood, Errol-J., Applying Fourier and Associated Transforms to Pattern Characterization in Textiles, Textile Research Journal 60(4) (1990) 212-220.
Wood, Errol-J., Objective measurement of carpet appearance by image analysis - Part 1 : Principles and methodology, Melliand Textilberichte/International Textile Reports 77(7-8) (1996) 452-459/E99-E102.
Xu, Bugao, Cuminato, D.-F. & Keyes, N.-M., Evaluating Fabric Smoothness Appearance with a Laser Profilometer, Textile Research Journal 68(12) (1998) 900-906.
Zhang, Dongsheng, Eggleton, Charles D. & Arola, Dwayne D., Evaluating the Mechanical Behavior of Arterial Tissue using Digital Image Correlation, Experimental Mechanics 42(4) (2002) 409-416.
www.intechopen.com
Optoelectronics - Materials and TechniquesEdited by Prof. P. Predeep
ISBN 978-953-307-276-0Hard cover, 484 pagesPublisher InTechPublished online 26, September, 2011Published in print edition September, 2011
InTech EuropeUniversity Campus STeP Ri Slavka Krautzeka 83/A 51000 Rijeka, Croatia Phone: +385 (51) 770 447 Fax: +385 (51) 686 166www.intechopen.com
InTech ChinaUnit 405, Office Block, Hotel Equatorial Shanghai No.65, Yan An Road (West), Shanghai, 200040, China
Phone: +86-21-62489820 Fax: +86-21-62489821
Optoelectronics - Materials and Techniques is the first part of an edited anthology on the multifaceted areas ofoptoelectronics by a selected group of authors including promising novices to the experts in the field.Photonics and optoelectronics are making an impact multiple times the semiconductor revolution made on thequality of our life. In telecommunication, entertainment devices, computational techniques, clean energyharvesting, medical instrumentation, materials and device characterization and scores of other areas of R&Dthe science of optics and electronics get coupled by fine technology advances to make incredibly large strides.The technology of light has advanced to a stage where disciplines sans boundaries are finding itindispensable. Smart materials and devices are fast emerging and being tested and applications developed inan unimaginable pace and speed. Here has been made an attempt to capture some of the materials andtechniques and underlying physical and technical phenomena that make such developments possible throughsome real time players in the field contributing their work and this is sure to make this collection of essaysextremely useful to students and other stake holders such as researchers and materials scientists in the areaof optoelectronics.
How to referenceIn order to correctly reference this scholarly work, feel free to copy and paste the following:
Michel Tourlonias, Marie-Ange Bueno and Laurent Bigue (2011). Optoelectronic Techniques for SurfaceCharacterization of Fabrics, Optoelectronics - Materials and Techniques, Prof. P. Predeep (Ed.), ISBN: 978-953-307-276-0, InTech, Available from: http://www.intechopen.com/books/optoelectronics-materials-and-techniques/optoelectronic-techniques-for-surface-characterization-of-fabrics

© 2011 The Author(s). Licensee IntechOpen. This chapter is distributedunder the terms of the Creative Commons Attribution-NonCommercial-ShareAlike-3.0 License, which permits use, distribution and reproduction fornon-commercial purposes, provided the original is properly cited andderivative works building on this content are distributed under the samelicense.