Options for Changing the Retirement System for … · The Defined Contribution Plan 8 Spending on...
51
CONGRESS OF THE UNITED STATES CONGRESSIONAL BUDGET OFFICE CBO Options for Changing the Retirement System for Federal Civilian Workers AUGUST 2017
Transcript of Options for Changing the Retirement System for … · The Defined Contribution Plan 8 Spending on...

CONGRESS OF THE UNITED STATESCONGRESSIONAL BUDGET OFFICE
CBOOptions for Changing
the Retirement System for Federal Civilian Workers
AUGUST 2017

NotesNumbers in the text and tables may not add up to totals because of rounding.
Unless otherwise indicated, budgetary numbers are presented for fiscal years, not calendar years. Fiscal years run from October 1 to September 30 and are designated by the calendar year in which they end.
www.cbo.gov/publication/53003

Contents
Summary 1What Retirement Systems Does the Federal Government Operate for Its Civilian Employees? 1How Much Does the Federal Government Spend on Its Retirement Systems? 1How Does FERS Affect Current Pay and Retirement Income? 1How Does FERS Affect Recruitment and Retention? 2What Are Some Options to Change FERS? 2
The Federal Retirement Systems for Civilian Workers 5The Defined Benefit Pension 5
BOX 1. HOW THE CIVIL SERVICE RETIREMENT AND DISABILITY TRUST FUND IS FINANCED 7The Defined Contribution Plan 8
Spending on Federal Retirement Benefits 9The Net Cost of Federal Retirement Benefits on a Cash Basis 10The Net Cost of Federal Retirement Benefits on an Accrual Basis 12
The Role of the Federal Retirement System in Employees’ Compensation 13Current Pay 13Retirement Income 13
The Role of the Federal Retirement System in the Recruitment and Retention of Federal Workers 14
Recruitment 14Retention 17
Options for Changing the Federal Retirement System 20Changes to the Pension Plan 22Replacing the Pension With Larger Government Contributions to TSP for New Employees 29
Appendix 36
Definitions 43
List of Figures and Tables 45
About This Document 46


Options for Changing the Retirement System for Federal Civilian Workers
SummaryThe federal government employs about 2.7 million civil-ian workers—1.8 percent of the U.S. workforce. Like many employers, the federal government compensates its employees with salaries, wages, and other benefits that are paid as they are earned, as well as deferred compensa-tion in the form of retirement benefits. Lawmakers have expressed interest in examining the current structure of retirement benefits to ensure that the government provides adequate compensation to attract and retain skilled employees while not paying more than needed to accomplish that goal. Therefore, this report analyzes several potential changes to the federal retirement system and their impact on the federal budget over 75 years.
What Retirement Systems Does the Federal Government Operate for Its Civilian Employees?The federal government currently provides its civilian employees with pensions under two different systems: The Civil Service Retirement System (CSRS), which is phasing out and has been closed to new participants since 1983, and the Federal Employees Retirement Sys-tem (FERS), in which almost all current workers par-ticipate. In addition, it operates the Thrift Savings Plan (TSP), a defined contribution plan for federal civilian employees. The TSP is similar to 401(k) accounts, which are common in the private sector. (The federal govern-ment also provides health care to retirees through the Federal Employees Health Benefits, or FEHB, program and operates a few other smaller retirement programs, though those are not the focus of this report.)
How Much Does the Federal Government Spend on Its Retirement Systems?In 2016, the federal government spent $91 billion on retirement benefits for most of its civilian employees: $70 billion for CSRS pensions for civilian retirees and their survivors; $13 billion for FERS pensions for civilian retirees and their survivors; and $8 billion for contribu-tions to TSP. Those expenditures were partially offset by $3 billion in revenues from employees’ contributions to the CSRS and FERS pension plans.
Under current law, the government’s net cash outflows for the federal civilian retirement system (that is, the system’s outlays minus its revenues) are projected to grow by an average of about 2.8 percent annually between 2018 and 2027. Over a longer time horizon—75 years—they would decline sharply as a share of gross domestic product (GDP)—from 0.48 percent of GDP in 2016 to 0.13 percent of GDP in 2091, the Congressional Budget Office projects. Also, the composition of that spending would change. By the 2060s, CSRS would be almost completely phased out. Almost all spending would be on the pensions provided through FERS and on contribu-tions to TSP (see Figure 1).
How Does FERS Affect Current Pay and Retirement Income?The structure of FERS affects federal workers’ current pay as well as their retirement income—the amount of income they will receive from the pension and from their TSP accounts. For the purposes of this report, “cur-rent pay” is defined as the worker’s salary or other cash compensation minus the amount of the contributions he or she is statutorily required to make to the pension plan and voluntarily makes to TSP. Workers hired in 2018 who will eventually receive a pension will contrib-ute 12 percent of their salary, on average, to the pension plan and TSP, CBO projects. The federal government will contribute an amount equal to 15.5 percent of those workers’ salaries for those purposes, CBO projects.
The amount of income from the pension depends on a worker’s age, years of service at retirement, and earnings history, whereas income from a TSP account depends on the employer’s and the employee’s contributions and the employee’s investment decisions. For workers with the same number of years of federal service, the replacement rate—retirement income as a share of preretirement earnings—is generally higher for workers who join the government at older ages than for workers who join at younger ages. Moreover, for workers who join at older ages, a larger share of retirement income will come from the pension than from TSP.

2 OptiOns fOr Changing the retirement system fOr federal Civilian WOrkers august 2017
How Does FERS Affect Recruitment and Retention?The effect FERS has on recruitment depends on the career plans of the workers whom agencies want to hire. Because the value of the pension grows with the num-ber of years of service, the pension attracts workers who anticipate a long career in the federal government but not workers who do not expect to remain in federal ser-vice for a long time. In contrast, TSP probably enhances recruitment among a broader group of workers because employees are eligible for federal contributions of up to 5 percent of their salary regardless of their age and tenure.
The pension and TSP also affect the retention of federal workers differently. For midcareer employees, the pen-sion benefit provides an incentive to stay in government in order to qualify for a larger pension. By contrast, that incentive is limited for workers who are early in their careers because they will have to work for the govern-ment many more years before they retire. For workers who are eligible to retire with a full pension, working for an additional year would mean forgoing pension
payments for that year, so for them, the plan may serve as a disincentive to stay. TSP probably provides an incentive to stay in government at most points in a career because the value of the benefit does not depend on how long the worker has been employed or how far from retirement he or she is.
What Are Some Options to Change FERS?To explore how changing FERS would affect spending in the long term, CBO assessed two types of options (see Table 1). One type would modify the pension plan either by changing employees’ contributions to the plan or by changing the formula used to calculate benefits. The other type would replace the pension for new employ-ees with larger contributions from the government to employees’ TSP accounts—a change that would be similar to the shift during recent decades from defined benefit to defined contribution retirement plans in many private-sector companies and some state governments. The options CBO analyzes in those categories are illus-trative; other options could be designed to be more or less costly to the government.
Figure 1 .
Net Government Outflows for Major Federal Civilian Retirement ProgramsThe federal retirement system’s net cash outflows for civilian workers will decline as a share of GDP under current law, CBO projects. Net outflows will fall relative to GDP because the number of CSRS retirees will decline (the CSRS pension tends to cost more than the FERS pension) and because the number of federal workers will decline as a share of the U.S. workforce.
Percentage of GDP
0
0.1
0.2
0.3
0.4
0.5
0.6
1990 2000 2010 2020 2030 2040 2050 2060 2070 2080 2090
Historical Projected
TSP
FERS
CSRS
Source: Congressional Budget Office, using historical data from the Office of Personnel Management and the Federal Retirement and Thrift Investment Board.
Historical data for CSRS and FERS pensions are through 2015, the most recent year for which such data are available. Historical data for TSP contributions are estimates based on data from 2014, the most recent year for which such data are available. To estimate TSP contributions in other past years, CBO used the percentage of FERS payroll costs in 2014. Net outflows for CSRS and FERS pensions include outlays for pension benefits minus revenues from employees’ contributions to the pension plan. For TSP, net outflows are the government’s contributions to employees’ TSP accounts.
CSRS = Civil Service Retirement System; FERS = Federal Employees Retirement System; GDP = gross domestic product; TSP = Thrift Savings Plan.

3august 2017 OptiOns fOr Changing the retirement system fOr federal Civilian WOrkers
Table 1 .
Estimated Effects of Several Options That Would Change the FERS Pension Plan and Contributions to TSP
Nominal Present-Value Percentage Terms, Terms, Change in
Accrual Costb
-14 -3 n.a. No effect Decreases for workers hired before 2014
Current pay declines for workers hired before 2014; retirement income changes for those who leave federal work early as a result
10 13 22 Increase Increases for workers hired after 2012
Current pay increases for workers hired after 2012
-1 -3 -4 Slight Decreases for Current pay remainsdecrease midcareer workers; the same; retirement
increases for income declines retirement-eligibleworkers
24 10 -6 Increase Increases for early- Current pay increases.career and retirement- Retirement income increases
Contribution to a Maximum eligible workers; for workers without a full of 15 Percent decreases for midcareer career in federal government;
workers uncertainty of retirement income increases
17 -3 -29 Uncertain Increases for early- Current pay increases.career and retirement- Average retirement income eligible workers; decreases; uncertainty of decreases for retirement income midcareer workers increases
1. Increase Pension Contributions of Some Employees
4. Eliminate Pension,
5. Eliminate Pension,Increase Government's TSP
Increase Government's TSP
RetentionCurrent Pay and
Retirement Incomec
Options That Would Replace the Pension Plan With Larger Contributions to TSP for New Employees
Contribution to 10 Percent
RecruitmentOptions That Would Change the Pension Plan
Option
Formula to High 5
2. Decrease Pension Contributions of Some Employees
Percentage Change in the Government's Net Outflowsa
3. Change Pension
Source: Congressional Budget Office.
Option 1 would increase the FERS contribution rate to 4.4 percent for current employees (from 0.8 percent for employees hired before 2013 and from 3.1 percent for employees hired in 2013).
Option 2 would decrease the FERS contribution rate to 0.8 percent for all employees (from 4.4 percent for employees hired after 2013 and from 3.1 percent for employees hired in 2013).
Option 3 would decrease FERS pensions by basing the retirement benefit on the five years of highest salary (instead of three years of highest salary).
Option 4 would eliminate the FERS pension, increase the government’s automatic TSP contribution to 8 percent of salary, and require the government to match employees’ contributions up to an additional 7 percent.
Option 5 would eliminate the FERS pension, increase the government’s automatic TSP contribution to 10 percent of salary, and eliminate the government’s matching contribution.
A discount rate equal to the interest rate projected for 20-year Treasury securities was used in the calculation of present discounted values.
FERS = Federal Employees Retirement System; TSP = Thrift Savings Plan; n.a. = not applicable.
a. Net outflows represent an increase in budget deficits. They include outlays for FERS pension benefits, plus the government’s contributions to workers’ TSP accounts minus revenues from employees’ contributions to the pension plan. The percentage change in net outflows is measured relative to net outflows for the FERS pension and TSP.
b. The estimated accrual cost is calculated for workers with no prior federal service who are projected to join the federal workforce in 2018.
c. Current pay is workers’ salary minus their required contributions to the pension plan and minus their projected voluntary contributions to the defined contribution plan. Retirement income is the pension plus the annuitized value of workers’ TSP accounts. It excludes payments from Social Security, other employer-sponsored retirement plans, and personal savings.

4 OptiOns fOr Changing the retirement system fOr federal Civilian WOrkers august 2017
CBO estimated the net costs of the options on both a cash basis and on an accrual basis. On a cash basis, federal outlays (pension payments and the government’s contributions to TSP) and revenues (employees’ con-tributions to the pension plan) are recorded at the time when those transactions occur. For pension payments, those transactions can be many years after the obligation to make those payments was incurred. On a cash basis, CBO measured net federal outflows in nominal terms over the next 10 years and in present-value terms over the 75-year projection period. By contrast, when mea-suring net costs on an accrual basis, CBO approximated the percentage of workers’ salaries that the government would need to set aside each year to fully fund those workers’ benefits. For illustrative purposes, CBO com-pared the cash and accrual costs for federal employees who would be hired in 2018.
Change the FERS Pension Plan. Three options would change the terms of the FERS pension:
� Option 1. Increase the pension contribution to 4.4 percent of salary for all employees. (Currently that rate is 0.8 percent for employees hired before 2013 and 3.1 percent for employees hired in 2013. It is already 4.4 percent for employees hired after 2013.)
�� Option 2. Decrease the pension contribution rate to 0.8 percent for all employees.
�� Option 3. Decrease pensions by basing the retirement benefit on the five years of highest salary (instead of the three years of highest salary, as in current law).
Option 1 would reduce the federal government’s net costs for retirement for employees enrolled in FERS by 14 percent on a cash basis over the next 10 years, and by 3 percent on a present-value basis over the 75-year pro-jection period. Because the option would affect only cur-rent workers hired in 2013 or earlier, the government’s savings would gradually decline as those workers retire or leave government. For the same reason, retirement costs for new federal employees would remain unchanged on an accrual basis. Correspondingly, CBO expects that the federal government’s ability to recruit new employees would be unaffected. However, the option would increase the number of employees who chose to leave federal service because their current pay would be reduced. The most experienced and highly qualified employees would be those most likely to leave.
Option 2 would increase the government’s net retirement costs for employees enrolled in FERS by 10 percent on a cash basis over the next 10 years, and by 13 percent over the 75-year period. On an accrual basis, the option would increase retirement costs for new employees by 22 percent. However, this option would enable the government to recruit and retain a more highly qualified workforce by increasing both current pay and the value of the pension plan (net of the employees’ contributions) for workers who were hired recently as well as those who will be hired in the future.
Option 3 would reduce the government’s net retirement costs for employees enrolled in FERS by 1 percent on a cash basis over the next 10 years, and by 3 percent over the 75-year period. The option would reduce costs by 4 percent on an accrual basis for new employees. CBO expects a small decrease in the recruitment and retention of highly qualified workers because the reduction in the pension is relatively small and because changes in retire-ment benefits would have less effect than would a similar change in current pay.
Replace the FERS Pension With Larger Government Contributions to TSP for New Employees. Two options would eliminate the FERS pension for new employees and replace it with larger TSP contributions. On a cash basis, such options would impose costs in the near term because they would require larger outlays at the time the benefit is earned, but costs would be lower in the future, when employees affected by the options retired.
�� Option 4. Eliminate the FERS pension, increase the government’s automatic TSP contribution to 8 percent of salary, and require the government to match up to 7 percent of additional contributions for new employees.
�� Option 5. Eliminate the FERS pension, increase the government’s automatic TSP contribution to 10 percent of salary, and eliminate the government’s matching contribution to TSP.
Option 4 would increase the government’s net retirement costs for employees enrolled in FERS on a cash basis by 24 percent over the next 10 years and by 10 percent over the 75-year period. However, the net cash cost of this option would be lower than the cost under current law if the analysis was projected over a sufficiently long period

5august 2017 OptiOns fOr Changing the retirement system fOr federal Civilian WOrkers
to incorporate the full savings from reduced future liabilities. On an accrual basis, net retirement costs for new federal employees would be about 6 percent lower than costs under current law. The option would probably increase the recruitment and retention of early-career and retirement-eligible employees, though it would reduce the retention of midcareer employees.
Option 5 would increase the government’s net retirement costs for employees enrolled in FERS on a cash basis by 17 percent over the next 10 years and reduce them by about 3 percent over the 75-year period. On an accrual basis, the option would reduce costs by 29 percent for new federal employees. The effect of the option on recruitment is uncertain. CBO expects that the option would increase retention of early-career and retire-ment-eligible employees, but by less than Option 4.
The Federal Retirement Systems for Civilian WorkersLike many employers in the private sector, the federal government compensates its workers with both wages and nonwage benefits such as defined benefit pensions and contributions to retirement savings accounts. Those benefits help the government attract and retain employ-ees with the skills that are required to perform its many different functions. However, good management of the federal government requires that it does not pay more than needed to attract and retain such employees.
Almost all federal civilian workers participate in FERS or CSRS.1 Because CSRS has been closed to new par-ticipants since 1983, almost all current workers are in FERS, whereas the majority of current pension recipi-ents are in CSRS. According to the Office of Personnel Management (OPM), in September 2015 there were 2.7 million active federal civilian employees, 2.5 million
1. The plans discussed in this report pertain to about 85 percent of the federal civilian workforce. CSRS and FERS both provide special benefits for certain air traffic controllers, bankruptcy judges, Congressional employees, firefighters, law enforcement officers, Members of Congress, and others, which are not examined here. Workers in those categories accrue benefits at higher rates in both CSRS and FERS than do other federal employees and could be subject to different employee contribution rates or retirement eligibility ages. In some cases, smaller retirement plans have been created by statute (such as the Foreign Service Retirement and Disability System) or set up by agencies that have authority to set compensation (for instance, the Federal Reserve).
of whom participated in the FERS pension plan.2 By contrast, 1.9 million of the 2.6 million retirees received benefits from CSRS in 2015.
Both CSRS and FERS consist of a pension and a defined contribution plan that resemble many plans in the private sector.3 (For details about these terms, see the Definitions at the end of this report.) The pension is a regular payment that typically commences at the time the federal worker retires and ends at his or her death or the death of his or her survivor, if the retiree has chosen the joint-survivor pension. The amount of the payment is determined by a worker’s salary history, years of service, and the age at which he or she claims benefits.
The defined contribution plan is similar to 401(k) plans in the private sector—the participants own the assets in their accounts, direct the investments, and decide the amount and frequency of their contribu-tions. The employer provides automatic and matching contributions.
The federal government’s outlays for retirement benefits in a given year consist of paying pensions to current retirees or their eligible family members and contributing to the TSP accounts of current employees. Those outlays are partially offset by revenues from required contribu-tions made by current employees to the pension plan. In addition, the federal government pays the employer’s share of Social Security payroll taxes for its employees enrolled in FERS. However, analyzing Social Security costs or benefits is outside the scope of this report, as are any effects on tax revenues that might occur as a result of the options analyzed in the report.
The Defined Benefit PensionIn both CSRS and FERS, workers are eligible to start receiving pensions upon leaving the federal workforce, as long as they have reached a certain age and accumulated a certain number of years of service with the federal gov-ernment. In general, workers are not eligible to receive
2. The number of employees is determined on a full-time-equivalent basis and includes employees on leave without pay who retain coverage.
3. The CSRS program was created in 1920 as a stand-alone defined benefit plan, which predated and later ran parallel to Social Security for many decades. FERS was created by the Congress in 1986 to provide federal workers with three forms of retirement income—a defined benefit plan, a defined contribution plan, and coverage under Social Security.

6 OptiOns fOr Changing the retirement system fOr federal Civilian WOrkers august 2017
pensions if they have less than five years of service (also known as a vesting period) at the time they retire.4 Both plans also require employees to contribute a certain per-centage of their pay to the Civil Service Retirement and Disability Fund (CSRDF) that finances their pension benefits.5 (For a more detailed discussion of funding for CSRDF, see Box 1.)
CSRS and FERS offer tax incentives for saving by deferring some federal income tax on contributions until retirement. Although employees pay federal income taxes on the income used to make their required contributions to the pension plan at the time those contributions are made, federal taxes on the employer’s contributions, and on the amounts by which the pension benefits exceed the employee’s and employer’s combined contributions, are deferred until the pension is received.
However, CSRS and FERS differ in certain ways. For instance, participants in CSRS are not generally covered by Social Security. Consequently, the CSRS pension formula is designed to replace a larger share of earnings than the FERS pension formula. In contrast, employees participating in FERS are covered by Social Security and generally expect to receive payments from the Social Security system in retirement. The two plans also differ in retirement eligibility ages and required contributions. Other differences between the two programs include the benefits provided for workers who become disabled on the job, surviving dependents, and former spouses, as well as automatic cost-of-living adjustments to the pension.6
4. Instead, those workers will be paid back their own contributions to the plan with a certain rate of return. In both CSRS and FERS, workers may opt to withdraw their contributions upon separation and give up the right to a pension.
5. In contrast, most plans in the private sector do not require employees to make contributions.
6. For detailed information on cost-of-living adjustments, see Katelin P. Isaacs, Federal Employees’ Retirement System: Benefits and Financing, Report for Congress 98-810 (Congressional Research Service, July 15, 2015). For a detailed description of federal disability and survivor benefits, see Katelin P. Isaacs, Disability Retirement for Federal Employees, Report for Congress RS22838 (Congressional Research Service, March 25, 2014), and Survivor Benefits for Families of Civilian Federal Employees and Retirees, Report for Congress RS21029 (Congressional Research Service, December 18, 2012). For a discussion of how replacement rates compare in CSRS, FERS, and the private sector, see Patricia P. Martin, “Comparing Replacement Rates Under Private and
The CSRS Pension. The CSRS pension is based on length of service, age at retirement, and the highest average salary earned during any three consecutive years of service (known as the “high-3” average salary). To be eligible for an immediate pension, workers must have reached age 55 and have at least 30 years of service, age 60 with at least 20 years of service, or age 62 with at least 5 years of service. For most employees, the CSRS pension as a percentage of the high-3 is computed by multiplying the first five years of service by 1.5 percent, plus 1.75 percent times years of service for the next five years, plus 2 percent times remaining years of service.7 Thus, an employee who worked for 30 years and retires at age 62 can expect to receive an annual benefit equal to 56.25 percent of his or her high-3 salary.
While working for the federal government, employees in CSRS are required to contribute 7 percent of their cur-rent salary to fund retirement benefits. The employing agencies of those workers contribute another 7 percent. Employees in CSRS do not pay Social Security payroll taxes and do not earn Social Security benefits for their federal service.
The FERS Pension. Employees in FERS become eligible to draw a pension upon separation when they reach the minimum retirement age and have at least 30 years of federal service. That minimum retirement age is 56 for employees born between 1953 and 1964, and it grad-ually increases to 57 for employees born in later years.8 Former employees also receive pension payments if they have at least 20 years of service and have reached age 60 or have at least 5 years of service and have reached age 62.
Retiree benefits in FERS are also based on years of fed-eral service, age at retirement, and average earnings, but they are calculated using a different formula from that applicable to workers in CSRS. The amount of the FERS
Federal Retirement Systems,” Social Security Bulletin, vol. 65, No. 1 (2003/2004), https://go.usa.gov/xRk38.
7. The CSRS pension is capped at 80 percent of the high-3 average salary.
8. Former employees with at least 10 years of service can choose to start receiving reduced payments as early as their minimum retirement age. Those payments are permanently reduced by 5/12 percent for every month that the date of the first payment precedes the date at which the former employees would have received their first unreduced payment. In this report, eligible for retirement refers to employees who are eligible for a full pension.

7august 2017 OptiOns fOr Changing the retirement system fOr federal Civilian WOrkers
Box 1.
How the Civil Service Retirement and Disability Trust Fund Is Financed
The Civil Service Retirement and Disability Trust Fund (CSRDF), an accounting mechanism in the federal budget created to administer the Civil Service Retirement System (CSRS) and the Federal Employees Retirement System (FERS), holds assets and tracks income and outlays. Most assets in the CSRDF—like all assets in the Social Security trust funds—are invested in special-issue U.S. Treasury securities. Inflows to the CSRDF come from contributions from federal employees and their employing agencies as well as transfers from the general fund of the Treasury (for interest on the trust fund balances and for certain unfunded liabilities).1 Pension payments to beneficia-ries account for almost all of the fund’s outflows.
Employers and employees in both CSRS and FERS are required to contribute toward the cost of retirement benefits. However, the employing agencies of workers in CSRS do not contribute the full cost of promised benefits to the fund. Work-ers in the CSRS program contribute 7 percent of their salary to retirement benefits and the employing agencies contribute an additional 7 percent. Together, those contributions are 14 per-cent of the employee’s salary, well short of the 29.3 percent of payroll that the Office of Personnel Management (OPM) estimates would be required to fully fund CSRS.2
Unlike CSRS, FERS is required by law to be fully funded.3 That is, employers of workers in FERS are required to set aside enough money each year from the combined contributions by employers and employees to pay the retirement benefits accrued by those workers that year.4 Most employees in FERS
1. Agency contributions to CSRDF are intragovernmental transfers. Those transactions are income to the fund, but they are not income to the U.S. government. They do not affect the government’s budget deficit or surplus because no money is received or spent by the government.
2. The 29.3 percent of payroll is OPM’s estimate of the net accrual cost of CSRS benefits for current CSRS workers.
3. The funding provisions for CSRS and FERS are different for Postal Service employees. See Office of Personnel Management, Civil Service Retirement and Disability Fund Annual Report, Fiscal Year Ended September 30, 2016 (February 2017), https://go.usa.gov/xRQ56.
4. Accrual budgeting can provide better information for personnel decisions. Because the employing agencies of workers enrolled in FERS are required to fully recognize in their budgets the cost of future pension benefits for their employees, they are more likely than the employing agencies of workers enrolled in CSRS to consider the implications of future retirement costs when determining the size and composition of their workforce.
who were hired before January 1, 2013, contribute 0.8 percent of their salary toward the pension plan. Their employing agencies contribute the remainder of the cost necessary to fully fund those workers’ benefits. That combined cost, according to OPM, is currently 14.5 percent of workers’ sal-aries. Recently, the Middle Class Tax Relief and Job Creation Act of 2012 increased the contribution rate of FERS employees from 0.8 percent to 3.1 percent for most employees hired after December 31, 2012, and the Bipartisan Budget Act of 2013 increased the contribution rate further to 4.4 percent for most employees hired after December 31, 2013. According to OPM, currently the combined contribution rate for employer and employee that is necessary to fully fund benefits is 15.0 per-cent for workers in FERS hired between January 1, 2013, and December 31, 2013, and 15.1 percent for workers hired after December 31, 2013.
As of September 2015, the CSRDF had unfunded liabilities of $790 billion, 94 percent ($740 billion) of which was in CSRS because agencies are not required to set aside adequate funds for CSRS every year. Nevertheless, inflows to and out-flows from the fund are projected to balance out over the long term—because the Treasury makes an annual payment to the fund to cover those unfunded liabilities. Also, the Bipartisan Budget Act stipulated that employers’ contributions for work-ers who contribute 4.4 percent should not be correspondingly reduced and that contributions in excess of those necessary to fully fund the benefits of those workers should be used to address the unfunded liability of CSRS.
As a result, unlike the Social Security trust funds, the CSRDF is not in danger of being exhausted. But a significant part of the fund’s annual income comes from the Treasury’s general fund in the form of interest payments and the annual payment to cover unfunded liabilities. In fiscal year 2016, the fund received $28 billion in interest payments and $36 billion for unfunded liabilities, compared with $30 billion in agency con-tributions and $3 billion in employee contributions. The funds required to make the benefit payments that are not covered by annual contributions from employees and their employing agencies and interest payments have to be generated each year through taxes, income from other government sources, or borrowing from the public.

8 OptiOns fOr Changing the retirement system fOr federal Civilian WOrkers august 2017
pension as a percentage of the high-3 salary is computed at 1.0 percent times the number of years of federal ser-vice. If the worker retires at age 62 or later, with at least 20 years of service, a factor of 1.1 percent is used rather than 1.0 percent. Hence, an employee who worked for 30 years and retires at age 62 can expect to receive an annual benefit equal to about 33 percent of his or her high-3 salary in FERS.9 In addition, that worker would be eligible for a Social Security retiree benefit, based on his or her long-term earnings history. For example, an employee who worked for 30 years and earned a sal-ary equal to the average wage in the economy would be eligible for an annual Social Security benefit equal to 40 percent of his or her high-3 salary if claimed at the full retirement age, or 30 percent if claimed at age 62.10 The average Social Security benefit for lower-paid federal workers would be a larger share of their preretirement earnings than would the Social Security benefit for high-er-paid federal workers. The reason is that, in contrast to FERS, Social Security uses a progressive formula to calculate the benefit.11
Similar to CSRS, employees participating in FERS are required to contribute a percentage of their current salary toward retirement benefits. In general, workers in FERS who were hired before 2013 contribute
9. Calculations are illustrative and are based on a worker born in 1955 who retires at age 62 in 2017 and has had an uninterrupted 30-year career, earning a salary equivalent to the average wage in the economy in each of those years.
10. The high-3 salary of that worker is assumed to equal the average of his or her salary from ages 59 through 61. The worker’s full retirement age for Social Security is 66 years and 2 months. The worker would be eligible for a monthly Social Security benefit as early as age 62 but that benefit would be about 26 percent lower than the monthly benefit he or she would be eligible for at the full retirement age.
11. Unlike the CSRS or FERS pension, the Social Security benefit amount is based on workers’ highest 35 years of earnings and is calculated using a progressive formula: Low-income workers on average receive a higher replacement rate from Social Security than do high-income workers. The calculation in the text is illustrative. The Social Security replacement rate that a federal worker would be eligible to receive could vary considerably and would also depend on the age at which the worker claims his or her Social Security benefit. Workers can choose to claim monthly benefits as early as age 62, but those benefits would be permanently reduced. Alternatively, workers can delay claiming benefits until they reach full retirement age, in which case they would receive the full benefit, or they can delay claiming benefits past their full retirement age up to age 70 and receive a permanently increased benefit.
0.8 percent of their salary. The Middle Class Tax Relief and Job Creation Act of 2012 and the Bipartisan Budget Act of 2013 increased the contribution rates of newly hired employees enrolled in FERS. Federal employees who entered service during calendar year 2013 contrib-ute 3.1 percent of salary toward their retirement pensions and are referred to as FERS–Revised Annuity Employees (FERS-RAE). Federal employees who were first hired after December 31, 2013, contribute 4.4 percent of salary toward their pension and are referred to as FERS–Further Revised Annuity Employees (FERS-FRAE). The increase in employees’ contributions was not accompa-nied by any corresponding increase in the retirement benefit formula, which remained unchanged. In addition to employees’ contributions, their agencies also contrib-ute a percentage of the employees’ salaries to the pension plan (in 2016 agencies contributed 13.2 percent of salary for workers in FERS and 11.1 percent of salary for work-ers in FERS-RAE and FERS-FRAE). Employees and their agencies also make contributions to Social Security.
The Defined Contribution Plan TSP, which is similar to 401(k) accounts in the private sector, is the defined contribution portion of federal retirement benefits. Employees in both CSRS and FERS are allowed to contribute to TSP. For employees in FERS, the federal employer matches a portion of their contributions to their TSP accounts. For workers in CSRS, the employer does not match contributions.
Participants in TSP can choose between two tax treat-ments of their TSP contributions. One is a traditional treatment in which the worker defers paying income taxes on contributions and the returns earned on them until he or she withdraws the money in retirement. The second is a Roth treatment in which the worker pays federal income taxes on contributions as he or she makes them, but does not pay taxes on contributions or returns at withdrawal. Both the traditional and Roth TSPs provide the worker with the benefit of tax-free com-pounding until the account balances are withdrawn. The benefit of the two tax treatments depends on the worker’s tax rate when the contributions are made relative to the rate when he or she withdraws them.
The federal government’s costs for TSP predominantly come from the employing agencies’ contributions to the

9august 2017 OptiOns fOr Changing the retirement system fOr federal Civilian WOrkers
accounts of FERS employees.12 Employers automatically contribute an amount equal to 1 percent of basic pay to the TSP accounts of all FERS employees, regardless of whether employees themselves choose to contribute.13 In addition, employers match FERS employees’ contribu-tions up to 5 percent of salary according to the following schedule: The first 3 percent of pay that an employee contributes is matched dollar for dollar; the next 2 per-cent is matched at 50 cents on the dollar; and contribu-tions above 5 percent of pay are not matched. Employees in CSRS are allowed to participate in TSP but do not receive any automatic or matching contributions from their employers.
TSP participants in FERS are immediately vested in (that is, entitled to) their own contributions and any matching contributions by agencies. However, TSP participants must work a minimum number of years in order to be vested in the agencies’ automatic contribu-tions and associated earnings in their accounts. For most FERS employees, the TSP vesting requirement is three years.14
Unlike the pension plan, TSP does not guarantee a benefit amount in retirement.15 Instead, participants
12. One exception is the additional cost to the government associated with workers’ investments in TSP’s G fund. The interest rate on those investments resets monthly and is based on the weighted average yield of all outstanding Treasury notes and bonds with four or more years to maturity. The return on that fund is somewhat higher than other marketable investments of similar risk. For more information, see Andrew Biggs and Jason Richwine, Comparing Federal and Private Sector Compensation, Working Paper 2011-02 (AEI Economic Policy, March 2011), http://tinyurl.com/n6trqq6. CBO did not estimate the cost associated with the subsidy to the G Fund going forward, because CBO estimates that the budgetary cost of that subsidy is small and the adoption of the life-cycle funds as the default investment funds in TSP since 2015 will diminish the share of assets that federal workers invest in the G fund.
13. For more details on the specifics of TSP, see Thrift Savings Plan (accessed July 27, 2017), https://www.tsp.gov/index.html.
14. Employees serving in certain positions, including some senior executive level positions, Members of Congress, and Congressional employees, need to complete only two years of service to meet the TSP vesting requirement.
15. Other benefits provided by the pension plan include a benefit in the event of a worker’s disability and a spousal or dependent’s benefit in the event of a worker’s death. Unlike the pension plan, TSP does not guarantee such benefits. However, upon the worker’s or retiree’s death, his or her descendants can keep the remaining TSP balance.
are entitled to the balances in their TSP accounts, from which they can withdraw money penalty-free once they reach age 59½.16 Workers in TSP bear all the investment risk associated with their chosen investment portfo-lios. The amount employees accumulate in their TSP accounts by retirement depends on the amount contrib-uted to the plan and the performance of the account’s investments.
Most federal civilian workers choose to participate in TSP. As of 2014—the most recent year for which data are available—about 65 percent of workers in CSRS and 90 percent of workers in FERS contributed to their accounts. Among those who contributed, the average contribution rate was 8.5 percent of salary for workers in CSRS and 8.1 percent of salary for workers in FERS. The employing agencies of FERS workers contributed 4.3 percent of salary to the accounts of their workers, on average.
Spending on Federal Retirement Benefits CBO examined historical net outflows for the federal civilian retirement systems starting in 1990 and pro-jected net outflows over the next 75 years as a percentage of GDP (see Figure 1 on page 2). The federal costs of retirement benefits are recorded as federal outlays on a cash basis when retirees and survivors receive their pension payments and when agencies make TSP contri-butions. Employees’ contributions to the pension plan are recorded as revenues at the time they are made.17 By contrast, on an accrual basis, the costs of future pension obligations are recognized when the commitment to pay them is incurred.
Because there are advantages to each accounting method, CBO has included both cash and accrual estimates throughout this report. Measuring cost on a cash basis provides the information needed to determine how the retirement system affects the federal budget in a given
16. The Internal Revenue Service requires individuals past the age of 70½ to take minimum distributions from their defined contribution accounts each year.
17. Federal agencies’ contributions to the CSRDF are intragovernmental transfers in which budget authority is transferred from federal agencies to the trust fund. Intragovernmental transfers have no effect on the size of the government’s annual budget deficit or surplus. However, they affect discretionary spending, which is subject to caps through fiscal year 2021. (Discretionary spending is controlled by annual appropriation acts.)

10 OptiOns fOr Changing the retirement system fOr federal Civilian WOrkers august 2017
year. Cash-based estimates, however, fall short of being a comprehensive measure of the cost of the federal retire-ment program because they fail to show the liability that taxpayers incur for future retirement benefits in a given year, as accrual estimates do. Because of the timing of outlays, when a pension plan is measured on a cash basis, it could appear to be much less expensive than a defined contribution plan when examined over a short time hori-zon, even if the plans would provide the same amount of retirement benefits. The reason is that federal outlays for TSP occur early, when participants are still working, whereas outlays for the pension plan occur much later, when they are retired.
For the purposes of this report, federal retirement benefits encompass only the defined benefit and defined contribution programs—CSRS, FERS, and TSP. Some policy options discussed in the report might affect the cost of other benefits for retired workers, such as costs for retirees’ health care in the Federal Employees Health Benefits program. Eligibility and receipt of such benefits might be affected by the various options described in this report and might further affect workers’ behavior. Such effects are outside the scope of this report and are not reflected in the cost estimates.
Also excluded from the estimates in this report are administrative costs related to the management of the CSRDF or employees’ TSP accounts. Both of those costs are relatively small.18 Changes in spending that stem from changes in administrative costs because of the options are also excluded.
CBO did not analyze tax revenues related to the provi-sion of federal retirement benefits because it lacked the information to accurately identify federal employees’ tax brackets. Under the Internal Revenue Code, the defined benefit and defined contribution plans offer tax
18. CSRDF’s Board of Actuaries estimates the fund’s administrative costs to be about 0.27 percent of benefits. See Office of Personnel Management, Civil Service Retirement and Disability Fund Annual Report, Fiscal Year Ended September 30, 2016 (February 2017), https://go.usa.gov/xRQ56. According to the Federal Retirement Thrift Investment Board, expenses related to administering TSP are mostly offset by forfeitures of the agencies’ automatic 1 percent contributions to workers enrolled in FERS who leave federal service before they become vested, other forfeitures, and loan fees. TSP participants share in the remainder of the costs. For 2016, the average net expense was $0.38 per $1,000 invested. See Federal Retirement Thrift Investment Board, “Expense Ratio” (accessed July 24, 2017), https://go.usa.gov/xRTwt.
incentives to both employers and participating employ-ees. In general, employers’ and employees’ contributions to defined contribution plans and employers’ contri-butions to pension plans are excluded from employees’ federal income taxes when those contributions are made. Instead, income generated from those contributions is taxed when received in retirement.
The Net Cost of Federal Retirement Benefits on a Cash BasisThe federal budget largely measures cash flows into and out of the U.S. Treasury, and for the most part reports those cash flows in the year in which they occur.19 CBO routinely projects the budgetary effects of the federal retirement programs over the current year and the com-ing 10 years on a cash basis as part of its baseline budget projections under current law. On a cash basis, benefit payments to retirees and survivors and employer’s contri-butions to TSP are recorded as federal outlays when they are paid, and employees’ contributions to the pension plan are recorded as revenues when they are received.
Since 1990, most outlays for the federal retirement pro-grams have compensated retirees in CSRS. In the com-ing decades, CBO expects a greater share of retirement spending will go to FERS retirees. Over the same period, federal spending for retirement benefits will decline as a share of GDP. The two main factors that will contrib-ute to that trend are the decline in the share of retirees receiving CSRS benefits, which cost the government
19. The costs of some programs or activities are reported on an accrual basis. In particular, the Federal Credit Reform Act of 1990 requires federal direct loans and loan guarantees—the cash flows of which typically extend well beyond the period covered by baseline projections—to be recorded in the budget on an accrual rather than cash basis. For those programs, the estimated lifetime cost of a new loan or loan guarantee is recorded in the budget in the year the loan is disbursed. See, for example, Congressional Budget Office, “CBO’s January 2017 Baseline Projections for the Student Loan Program” (January 2017), https://go.usa.gov/xRQeg. For more information on the budgetary treatment of federal credit programs, see Mindy R. Levit, Budgetary Treatment of Federal Credit (Direct Loans and Loan Guarantees): Concepts, History, and Issues for Congress, Report for Congress R42632 (Congressional Research Service, June 24, 2014). For more information on cash versus accrual accounting in the federal budget, see Congressional Budget Office, Comparing Budget and Accounting Measures of the Federal Government’s Fiscal Condition (December 2006), www.cbo.gov/publication/18262.

11august 2017 OptiOns fOr Changing the retirement system fOr federal Civilian WOrkers
more than FERS benefits, and the decline of the federal civilian workforce as a share of the total workforce.20
Cash Flows From 1990 to 2016. In 2016, net outflows for CSRS and FERS pension benefits and TSP contri-butions were an estimated $87 billion, or 0.48 percent of GDP. The federal government paid pension benefits of $82 billion to civilian retirees and their survivors in that year. Roughly 85 percent of that amount was paid to CSRS retirees, who were 73 percent of the 2.6 million retirees in 2016. In addition, the federal government paid an estimated $8 billion to the TSP accounts of fed-eral employees. At the same time, federal employees paid about $3 billion to the pension plan in 2016, offsetting a portion of the government’s outlays.
Net outflows for federal retirement benefits, measured as a percentage of GDP, were similar in 2016 to what they had been in 1990: 0.48 percent of GDP in 2016 and 0.47 percent of GDP in 1990.
Between 1990 and 2016, the composition of spending on federal retirement changed. Net outflows for retir-ees and survivors in CSRS declined from 0.45 percent of GDP in 1990 to 0.38 percent of GDP in 2016. In contrast, net outflows for retirees and survivors in FERS increased from zero in 1990 to 0.06 percent of GDP in 2016. The federal government’s contributions to TSP also increased as a share of GDP over that period, from 0.02 percent in 1990 to 0.04 percent in 2016. Those trends are explained by the gradual phaseout of the
20. CBO generally presents long-term estimates as percentages of GDP and not in nominal dollars. In the agency’s judgment, a presentation in nominal dollars can be misleading. The key problem is that a dollar today means something very different from a dollar in the distant future, for at least two reasons. First, the cumulative effect of changes in prices over a long period can be quite large, so a dollar amount in the distant future will have much lower value than the same dollar amount today. Second, the population, the economy, and people’s incomes will all grow substantially over time, so a dollar amount in the distant future will be much smaller relative to the size of the economy or a person’s income than the same dollar amount today. Alternatively, net outflows for the retirement system could be measured as a percentage of federal salaries, although that measure does not incorporate population growth because CBO does not project that the size of the federal civilian workforce will change. Measured as a percentage of salaries, therefore, under current law, net outflows for the retirement systems would fall by 44 percent between 2018 and 2091, whereas they would fall by 72 percent over that period when measured as a percentage of GDP, CBO estimates.
CSRS system. Because CSRS was closed to new partici-pants in 1983 and replaced by FERS, the share of CSRS beneficiaries as a percentage of all beneficiaries and the share of outlays for CSRS as a percentage of total outlays have been declining.
Cash Flows From 2017 to 2091. The net cost of federal retirement benefits is projected to rise more slowly than GDP over the next decade. As a result, if current law remained unchanged, net federal outflows for retirement benefits would increase in dollar terms but decline as a share of GDP, CBO projects (see Figure 1 on page 2 and Table 2 on page 12). Net outflows for CSRS would not change significantly, whereas outflows for FERS and TSP would both increase substantially. In 2027, combined net outflows for federal retirement benefits would be 31 percent higher (in dollar terms) than in 2017. However, in 2027, those outflows would be a smaller share of GDP than in the previous 25 years, CBO projects.
Under current law, net outflows for federal retirement would decline from 0.41 percent of GDP in 2028 to 0.13 percent of GDP at the end of the 75-year projec-tion period—as those outflows are projected to grow at an average annual rate of 2.3 percent, whereas GDP is projected to grow by an average of 4.1 percent per year. Two main factors contribute to the relatively slow growth in benefit payments. First, the share of retirees receiving benefits from CSRS would decline over that period (almost all CSRS beneficiaries will leave the federal retirement system by the 2060s, CBO projects), and CSRS benefits cost the government more than FERS benefits. Second, the total size of the U.S. workforce will increase, CBO projects, and under current law, the federal workforce would represent a smaller share of the total workforce.21 Under current law, CBO projects that the number of federal workers would remain unchanged after 2015 and over the next 10 years. Consistent with historical trends, CBO also projected that the size of the federal workforce would remain unchanged over the 75-year period.
CBO’s projections of the cost to the federal government of retirement benefits are based in part on the benefits of current retirees and the salaries of current and incoming
21. Between 2007 and 2015, the number of federal workers remained roughly unchanged and federal workers declined as a share of the workforce.

12 OptiOns fOr Changing the retirement system fOr federal Civilian WOrkers august 2017
employees.22 Those data were supplemented with infor-mation on TSP account balances, participation, and con-tributions from current participants.23 (For more details on CBO’s methodology, see the appendix.)
The Net Cost of Federal Retirement Benefits on an Accrual BasisAn alternative way to measure the cost of federal retire-ment benefits is on an accrual basis. On that basis, the cost of retirement benefits that will be paid when work-ers retire (that is, in the future) is incorporated into the current cost of their compensation. That approach allows future retirement liabilities to be recognized as they are incurred, as opposed to waiting until the cash is received
22. The data were provided by OPM.
23. The data were provided by the Federal Retirement Thrift Investment Board.
or paid out. Because such an approach treats current and deferred forms of compensation equally, it avoids bud-getary effects resulting from the timing of compensation and facilitates the comparison of an employer’s compen-sation costs for a pension plan with those for a defined contribution plan.
On an accrual basis, CBO projects that under current law total lifetime retirement-related net outflows for the cohort of employees starting federal service in 2018 would be 14.2 percent of the salaries of those workers. CBO chose that group of workers to illustrate the cost of federal retirement on an accrual basis under current law and under the five options presented in this report because it is the first cohort of employees that could be affected by those options.
Table 2 .
Projected Outlays, Revenues, and Net Outflows for Major Federal Civilian Retirement ProgramsBillions of Dollars
Total,Actual,
2016 2017 2018 2019 2020 2021 2022 2023 2024 2025 2026 2027 2027
70 70 70 71 71 72 72 72 72 71 71 70 7111 1 * * * * * * * * * * 2___ ___ ___ ___ ___ ___ ___ ___ ___ ___ ___ ___ ____
69 69 70 70 71 71 72 72 71 71 71 70 709
13 14 16 18 20 23 26 29 32 35 38 42 2792 3 3 4 4 4 5 5 6 6 7 8 52__ __ __ __ __ __ __ __ __ __ __ __ ____
10 11 13 15 16 18 21 23 26 29 32 35 227
8 9 9 9 10 10 10 11 11 11 12 12 105___ ___ ___ ___ ___ ____ ___ ___ ___ ___ ___ ___ ____88 89 91 94 97 100 103 106 108 111 114 117 1,041
0.48 0.47 0.46 0.46 0.45 0.45 0.45 0.44 0.44 0.43 0.42 0.42 0.44
Outlaysa
Revenuesb
Net Outflowsc
Outlaysa
Revenuesb
Net Outflowsc
Civil Service Retirement System
Federal Employees Retirement System
Thrift Savings Plan
Outlaysd
Total Net OutflowsTotal Net Outflows as a Percentage
of Gross Domestic Product
Source: Congressional Budget Office.
TSP = Thrift Savings Plan; * = between zero and $0.5 billion.
a. Outlays consist of pension benefits and refunds of employees’ contributions to the pension plan.
b. Revenues consist of employees’ contributions to the pension plan.
c. Net outflows are outlays for benefits minus the revenues that the government collects from employees’ contributions to the pension plan.
d. Outlays for TSP are the government’s contributions to employees’ TSP accounts. Outlays for 2016 are estimated.

13august 2017 OptiOns fOr Changing the retirement system fOr federal Civilian WOrkers
The Role of the Federal Retirement System in Employees’ CompensationThe federal retirement system influences the amount of compensation that employees receive when they earn it and the amount they receive during retirement. Changes to the federal retirement system can affect the amount of workers’ compensation and can change the balance between current pay (that is, salary minus retirement contributions) and retirement income.24
Current PayFederal retirement plans play a role in workers’ com-pensation by determining the current pay that individ-uals receive while working for the federal government. Employees’ current pay (as defined in this report) equals their salary or other cash compensation minus the amount of contributions they are required to make to the pension plan and the voluntary contributions they make to their TSP plan.
CBO projects that workers hired in 2018 who go on to receive a pension would contribute 4.4 percent of their salary to the pension plan and an average of 7.6 percent of salary to TSP, resulting in current pay that would be 12 percent lower than salary, on average.
Retirement IncomeTo assess the effects of potential changes to FERS on workers’ income in retirement, CBO estimated that income as a share of the worker’s preretirement earnings, known as a replacement rate. The replacement rate mea-sures the extent to which workers’ income in retirement is commensurate with their income prior to retirement.
The replacement rate CBO estimated is the ratio of employees’ annual retirement income from the pension and TSP to their average earnings in their last three years before retirement. The calculation required CBO to estimate annual retirement income from TSP savings. In contrast to pensions, TSP benefits are in the form of an account balance that workers have accumulated at the time of retirement. Therefore, CBO estimated an expected annuity stream that could be purchased with the accumulated TSP balance and added that annual
24. For a more detailed description of the compensation the federal government provides its employees, see Congressional Budget Office, Comparing the Compensation of Federal and Private-Sector Employees, 2011–2015 (April 2017), Appendix B, www.cbo.gov/publication/52637.
income from TSP to the annual pension.25 CBO did not include retirement income from Social Security, from private savings, or from retirement plans from other employers in the calculation of the replacement rate because those data were not available.
The pension plan and TSP differ in the way benefits build up over time. For the same number of years of service, a worker who joined the federal workforce later in life would receive a higher replacement rate from his or her pension than a worker who joined earlier in his or her career. For example, among workers who leave fed-eral service after 15 years, those who joined in their 40s could expect an average replacement rate of 14 percent from their pension, whereas those who joined in their 20s could expect an average replacement rate of 7 per-cent. The opposite is true for TSP. The average projected replacement rate from TSP is 10 percent for workers who joined in their 40s and 12 percent for workers who joined in their 20s (see Figure 2). Two factors contribute to that result. One, because the government’s pension payment is based on the average of a worker’s three years of highest salary (which usually occur at the end of his or her federal service), the pension plan favors workers who spend a given number of years in federal service later in their careers, when their earnings are higher and they are closer to their retirement age. Two, because the benefit of compound interest favors workers who start saving at an early age, employees who join the federal workforce earlier in their careers gain greater expected benefits from TSP than do those who join later. However, because annual contributions to TSP are proportionate to a worker’s salary, the government’s TSP payment is equally valuable to all workers, regardless of when they join TSP.
The federal government funds a considerable share of its employees’ retirement income. For workers hired in 2018 who are projected to receive a pension in retire-ment, the employing agencies will incur pension costs equal, on average, to 11.2 percent of workers’ salaries and TSP costs equal, on average, to 4.3 percent of work-ers’ salaries. That brings the government’s total costs for
25. However, CBO did not attempt to incorporate the fees that would stem from purchasing annuities. For a detailed description of the assumptions underlying CBO’s projection of retirees’ replacement rates, see the appendix.

14 OptiOns fOr Changing the retirement system fOr federal Civilian WOrkers august 2017
the pension and TSP to 15.5 percent of workers’ salaries, on average.26
The Role of the Federal Retirement System in the Recruitment and Retention of Federal Workers The federal retirement system affects people’s incentives to begin working for the government or remain in ways that depend on people’s career plans and vary over the course of their careers. As a result, changes in FERS that affect workers’ current pay or retirement income
26. On an accrual basis, the net cost to the government for the full cohort of workers starting in 2018 would be lower, 14.2 percent of salary. The reason is that over time, some employees will separate before becoming vested in the pension or will choose to have the government return their pension contributions and give up their rights to a pension.
can affect the government’s ability to recruit and retain qualified workers.
RecruitmentThe amount of compensation, as well as the way it is distributed between current pay, pension payments, and TSP, can affect the government’s ability to recruit high-quality employees. Even though the size of the fed-eral workforce has changed little over the past 10 years, the government has hired about a quarter of a million employees per year over that period, CBO estimates. Most of those people joined the government when they were between the ages of 20 and 40, and the most common starting age was 26. The majority of the new employees have replaced departing workers, although the Department of Veterans Affairs has substantially increased its number of employees to expand the services it provides, whereas the Postal Service has gotten smaller.
Figure 2 .
Average Share of Preretirement Earnings Replaced at Age 62 or at Retirement for Workers Hired in 2018 Who Leave Federal Service After 15 Years, Under Current Law
TSP Pension
Share of Preretirement Earnings
10
11
12
14
8
7
0 15 30
Age 40 to 49 at Date of Hire
Age 30 to 39 at Date of Hire
Age 20 to 29 at Date of Hire
Source: Congressional Budget Office.
Estimates shown are for workers with no prior federal service who will join the federal workforce in 2018 and leave federal service after 15 years. Those workers would generally receive a pension in retirement.
Under current law, employees hired in 2018 will contribute 4.4 percent of their salary to the FERS pension plan. The government will make an automatic TSP contribution of 1 percent of salary and match employees’ contributions up to an additional 4 percent.
Replacement rates were calculated at age 62 or at the age of retirement from federal service, whichever is later. Preretirement earnings were measured as the workers’ average earnings in the last three years before retirement, adjusted for average growth in economywide earnings if they left federal service before becoming eligible for an immediate pension. Retirement income is the pension plus the annuitized value of workers’ TSP account balances at the time of retirement. The projected TSP account balances include the accumulated employers’ and employees’ contributions and the investment returns on those contributions. Retirement income excludes payments from Social Security, other employer-sponsored retirement plans, and personal savings.
The length of the bars reflects unrounded numbers.
FERS = Federal Employees Retirement System; TSP = Thrift Savings Plan.
The replacement rate from the pension is larger for workers hired at an older age in part because they are closer to the age at which they are eligible to draw a pension.

15august 2017 OptiOns fOr Changing the retirement system fOr federal Civilian WOrkers
The pension payments provided through FERS and the government’s contributions to employees’ TSP accounts are both attractive to potential employees. In recent years, lawmakers increased employees’ required contribu-tions to the pension plan, which had the effect of reduc-ing the amount of current pay that agencies can offer to potential employees.
To analyze the effect of those changes on recruitment, CBO estimated the value employees place on retirement income relative to current income. That estimate is subject to considerable uncertainty, and other estimates could reasonably be made that could lead to different conclusions about the effect that the amounts of current pay and the pension plan have on recruitment. (For additional details, see the appendix.)
Effect of Current Pay on Recruitment. The average quality of newly-hired employees tends to rise or fall depending on the amount of current pay, in CBO’s judg-ment. The amount of current pay that federal workers receive is reduced by the contributions they must make
to the FERS pension plan and the contributions they elect to make to their TSP accounts.
One way to assess the effects of changes in current pay is to examine what occurred after the required pension contribution was raised from 0.8 percent of salary in 2012 to 3.1 percent in 2013. (Data on the effects of the more recent increase to 4.4 percent were not readily available at the time of the analysis.) CBO found that two measures of new employees’ performance declined following the 2013 reduction in current pay (see Table 3). First, workers hired in 2013 were less likely than those hired in 2012 to have their performance rated as “fully successful” or better by their supervisors. Second, they were more likely to be dismissed, or “involuntarily separated,” early in their careers. Those results suggest that decreases in current pay may affect recruitment, but the analysis encompasses a short period and cannot account for every factor that might have contributed to the differences in employees’ perfor-mance. Other research found that a 1 percent decrease in the average federal salary relative to the average private- sector salary was associated with a 2 percent decrease in
Table 3 .
Salary, Performance, and Retention of Newly Hired Employees
Employees EmployeesHired in 2012 Hired in 2013 Percentage Difference
Percentage of Salary That Employees Contribute to the Pension Plan 0.8 3.1 n.a.Average Starting Salary (2016 Dollars)
Salary 57,100 56,300 -1.4Salary Minus Contributions to the Pension Plan 56,600 54,400 -3.8
Performance Measures (Percentage of newly hired employees)First Performance Rating Above “Fully Successful” 53.6 52.5 -2.2Involuntarily Separated During First 13 Months 2.2 2.5 11.6
Retention Measure (Percentage of newly hired employees)Voluntarily Separated During First 13 Months 8.2 9.1 11.7
Source: Congressional Budget Office, using data from the Office of Personnel Management.
CBO compared employees hired in 2012, the last year employees’ contribution rate to the pension plan was 0.8 percent, to employees hired in 2013, during which employees’ contribution rate to the pension plan was 3.1 percent. To compare similar jobs in similar locations, CBO limited its analysis to workers on the General Schedule, and the salaries, performance measures, and retention measure were adjusted to account for differences between the two groups of employees in occupations, grades, and locations.
Figures were converted from nominal amounts with the price index for personal consumption expenditures, which is calculated by the Bureau of Economic Analysis.
Performance ratings were for employees in the most common ratings system and were adjusted for differences in the timing of the evaluations.
Tracking separations for 13 months captures most of the separations that occur within a month of the first performance evaluation.
n.a. = not applicable.
16 OptiOns fOr Changing the retirement system fOr federal Civilian WOrkers august 2017
the number of federal job applicants meeting the mini-mum qualifications for federal positions.27 However, it is not clear that a reduction in federal salaries would have led to a shortage of highly qualified recruits because data on the number of applicants who met more stringent qualifications were not examined.
Although changes in current pay that result from changes in the required contributions to the FERS pension plan may affect recruitment, changes in current pay that result from changes in a worker’s voluntary contributions to the TSP probably do not. That is both because those contributions are voluntary and because money in a TSP account can be accessed in ways that money contributed to the pension plan cannot. To maximize the amount of money that the government contributes, employees would have to contribute 5 percent of salary to their TSP accounts. However, many employees choose to con-tribute less and thus forgo less of their income but still receive most of the government’s contribution. Moreover, funds contributed to TSP are more accessible than the sums contributed to the pension plan. Employees can borrow from their past TSP contributions but cannot borrow from past contributions to the pension plan.
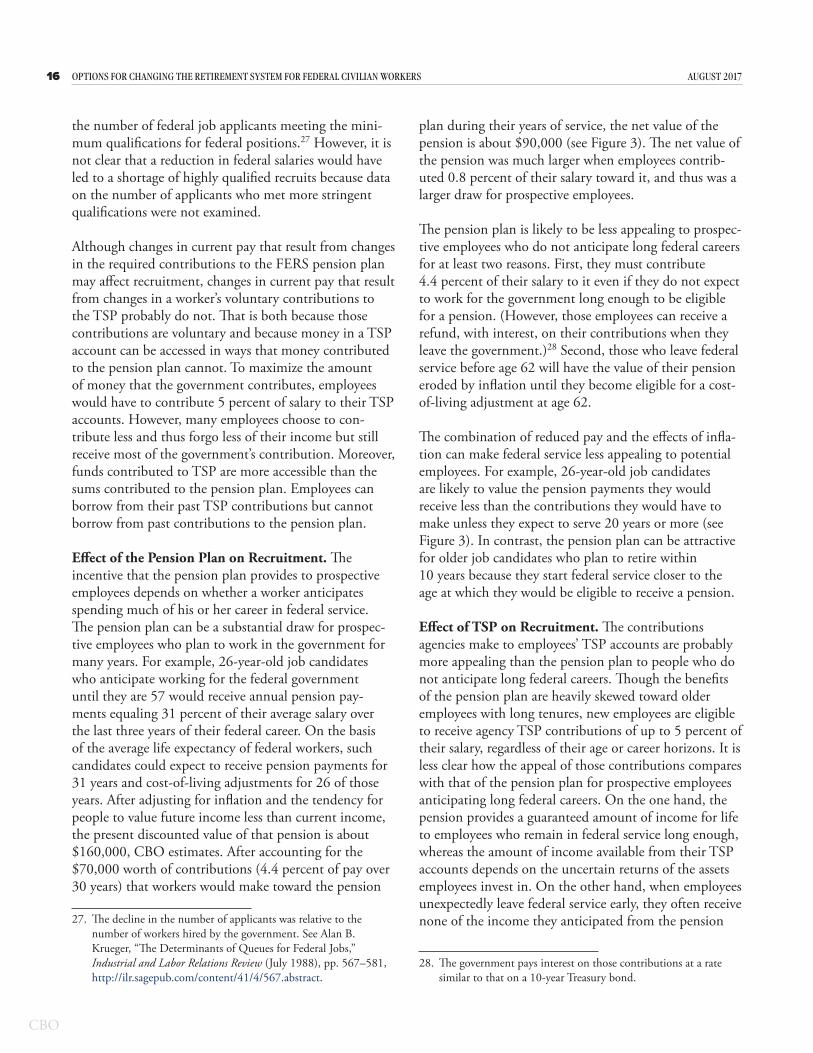
Effect of the Pension Plan on Recruitment. The incentive that the pension plan provides to prospective employees depends on whether a worker anticipates spending much of his or her career in federal service. The pension plan can be a substantial draw for prospec-tive employees who plan to work in the government for many years. For example, 26-year-old job candidates who anticipate working for the federal government until they are 57 would receive annual pension pay-ments equaling 31 percent of their average salary over the last three years of their federal career. On the basis of the average life expectancy of federal workers, such candidates could expect to receive pension payments for 31 years and cost-of-living adjustments for 26 of those years. After adjusting for inflation and the tendency for people to value future income less than current income, the present discounted value of that pension is about $160,000, CBO estimates. After accounting for the $70,000 worth of contributions (4.4 percent of pay over 30 years) that workers would make toward the pension
27. The decline in the number of applicants was relative to the number of workers hired by the government. See Alan B. Krueger, “The Determinants of Queues for Federal Jobs,” Industrial and Labor Relations Review (July 1988), pp. 567–581, http://ilr.sagepub.com/content/41/4/567.abstract.
plan during their years of service, the net value of the pension is about $90,000 (see Figure 3). The net value of the pension was much larger when employees contrib-uted 0.8 percent of their salary toward it, and thus was a larger draw for prospective employees.
The pension plan is likely to be less appealing to prospec-tive employees who do not anticipate long federal careers for at least two reasons. First, they must contribute 4.4 percent of their salary to it even if they do not expect to work for the government long enough to be eligible for a pension. (However, those employees can receive a refund, with interest, on their contributions when they leave the government.)28 Second, those who leave federal service before age 62 will have the value of their pension eroded by inflation until they become eligible for a cost-of-living adjustment at age 62.
The combination of reduced pay and the effects of infla-tion can make federal service less appealing to potential employees. For example, 26-year-old job candidates are likely to value the pension payments they would receive less than the contributions they would have to make unless they expect to serve 20 years or more (see Figure 3). In contrast, the pension plan can be attractive for older job candidates who plan to retire within 10 years because they start federal service closer to the age at which they would be eligible to receive a pension.
Effect of TSP on Recruitment. The contributions agencies make to employees’ TSP accounts are probably more appealing than the pension plan to people who do not anticipate long federal careers. Though the benefits of the pension plan are heavily skewed toward older employees with long tenures, new employees are eligible to receive agency TSP contributions of up to 5 percent of their salary, regardless of their age or career horizons. It is less clear how the appeal of those contributions compares with that of the pension plan for prospective employees anticipating long federal careers. On the one hand, the pension provides a guaranteed amount of income for life to employees who remain in federal service long enough, whereas the amount of income available from their TSP accounts depends on the uncertain returns of the assets employees invest in. On the other hand, when employees unexpectedly leave federal service early, they often receive none of the income they anticipated from the pension
28. The government pays interest on those contributions at a rate similar to that on a 10-year Treasury bond.

17august 2017 OptiOns fOr Changing the retirement system fOr federal Civilian WOrkers
plan, whereas they keep most or all of the contributions their agency has made to their TSP account.29
RetentionThe amount of compensation and its composition also affect retention. By enticing its employees to continue their service, the federal government retains the exper-tise that those workers have accumulated. That expertise can be particularly difficult to replace because the tasks
29. The majority of federal employees who leave before completing three years of service forfeit the automatic contributions their agency made to TSP but keep any matching contributions.
performed by federal employees often differ substantially from the tasks performed for other employers.30 Thus, the quality of the federal workforce would decline and the costs of training new employees would rise if agencies were not able to retain a high percentage of their employ-ees from one year to the next. But very high retention rates can be inefficient for at least two reasons. First, high retention can leave agencies with too little flexibility to
30. For example, the tasks that accountants for the Internal Revenue Service perform to audit tax returns can differ substantially from the tasks of the private-sector accountants who prepare those returns.
Figure 3 .
The Net Value of a FERS Pension to a Worker Considering Federal Employment at Age 26, by Anticipated Years of Service and Age of SeparationThe net value of the pension differs for prospective federal employees depending on how much they pay for the pension from their own salary and how long they anticipate working for the federal government. After 20 years of service, an employee is eligible for a pension without benefit reductions at age 60. After 30 years of service, an employee is eligible for a pension without benefit reductions at age 57. The pension for a worker who contributes 4.4 per-cent of his or her salary and who would leave with fewer than 20 years of service would be less valuable than the contributions he or she made to it.
Thousands of Dollars
Required Percentage of
Anticipated Age of Separation From Federal Service
Salary Contributed
0.8 percent
20 Yearsof Service
30 Yearsof Service
3.1 percent
4.4 percent
-20
20
60
100
140
180
26 30 34 38 42 46 50 54 58 62 66 70 74
Source: Congressional Budget Office.
Estimates shown are for people age 26 who are considering a federal job with a salary of $50,000 and who would wait to begin receiving pension payments until they are eligible for the full amount instead of taking reduced payments that begin at an earlier age.
Most employees in FERS hired before 2013 contribute 0.8 percent of their salary to the pension; most hired in 2013 contribute 3.1 percent; and most hired in 2014 or later contribute 4.4 percent.
The net value at date of hire is the value of the pension payments workers would receive in retirement minus the value of the contributions they would make to the pension plan. Payments and contributions are discounted back to the date of hire at a rate equal to the interest rate projected for 20-year Treasury securities plus about 2 percentage points to illustrate the value of the pension when workers are considering federal service at age 26. If the value of those payments is less than the value of their contributions, then they would elect to have their contributions refunded and forgo the pension. In those instances, the workers place a negative net value on the pension because the return they receive on their contributions is less than the discount rate. For instance, workers with 19 years of service who contribute 4.4 percent of their salary to the pension plan are likelier to elect to have their contributions refunded than those with 20 years of service. Those with 20 years of service would be eligible for a pension without benefit reductions at age 60, whereas those with 19 years of service would not be eligible for such a pension until age 62.
FERS = Federal Employees Retirement System.

18 OptiOns fOr Changing the retirement system fOr federal Civilian WOrkers august 2017
hire workers with new or different skills that might be needed if demands on those agencies change over time. Second, high retention rates among older employees may reduce workforce quality because workers’ productivity eventually declines.31
Federal retention rates differ substantially from those for private-sector firms, where pensions have become rare (see Table 4). The separation rate among mid career employees in the private sector is about eight times higher than the rate for federal employees. Many factors probably contribute to higher rates of retention for fed-eral employees. For instance, federal workers can relocate and yet continue to work for the government, as the fed-eral government is a large employer with offices in many parts of the country. However, the pension plan probably plays a substantial role. It most likely contributes both to the higher rates of retention among midcareer employees and to lower retention rates after 30 years of service.
Effect of Current Pay on Retention. Changing cur-rent pay would change retention rates, CBO expects. For instance, retention rates declined when the increase in employees’ contributions to FERS decreased their current pay. Employees hired in 2013 were roughly
31. For a discussion of whether employers use pensions to encourage older workers to retire see David Neumark, “Productivity, Compensation, and Retirement,” in Gordon L. Clark, Alicia H. Munnell, and J. Michael Orszag, eds., Oxford Handbook of Pensions and Retirement Income (Oxford University Press, 2006), pp. 721–739, http://tinyurl.com/ybjea58s.
10 percent more likely to quit federal service within 13 months than employees hired in 2012 (see Table 3 on page 15). Other factors that could have contributed to the decline in retention were the intermittent furloughs that several agencies imposed in 2013 and the partial shutdown of most agencies during the first two weeks of October 2013. However, retention declined between 2012 and 2013 even when the furloughing agencies were excluded from the analysis, and when the months of September, October, and November were excluded.
An increase in current pay would boost retention more than would an equivalent increase in retirement pen-sions, in CBO’s judgment. To reach this conclusion, CBO compared the changes in retention following the across-the-board salary increases received by employees in major metropolitan areas in 1991 and the reductions in pension benefits imposed by the switch from CSRS to FERS. Retention rose substantially following the salary increases but only changed slightly after the switch to FERS even though pension benefits under that system are usually much smaller than they are under CSRS. Based on those findings, CBO concluded that a salary increase would raise retention more than an increase in pension benefits that cost the government the same amount.
Effect of the Pension Plan on Retention. The pension plan boosts retention among workers who are nearing the point in their service at which they become eligible for a pension immediately upon separation and reduces retention among workers who have passed that point. The pension plan’s effects on the retention of workers who are many years away from receiving one are unclear.
The pension plan appeals to workers as they get closer to becoming eligible for a pension immediately upon separation, in CBO’s judgment. CBO examined workers who were hired at age 26 in 1984 and therefore would have become eligible for a pension if they completed 30 years of service.32 Almost all of the workers in that
32. CBO used data from OPM that cover the vast majority of federal civilian personnel (with the exception of Postal Service employees). CBO focused its analysis on the first group of employees enrolled in FERS (in 1984) to maximize the number of years over which to examine retention. The analysis is limited to workers who choose to leave; it excludes workers who were involuntarily removed from service for poor performance, misconduct, or other reasons. (For additional details, see the appendix.)
Table 4 .
Separation Rates for Workers Hired in 1984
Federal Government Private Sector
1 to 10 11 2111 to 29 1 830 to 32 25 18
Average Annual Separation Rate as a Percentage of the Workforce in the Previous YearYears
of Service
Source: Congressional Budget Office, using data for February 1996 through January 2016 from the job tenure supplement to the Current Population Survey.
Because data are not available prior to 1996, estimates of the separation rates for workers with 1 to 12 years of service are based on the separation rates of workers hired in 1996. Separation rates incorporate both voluntary and involuntary separations because it is difficult to distinguish between them in the data.

19august 2017 OptiOns fOr Changing the retirement system fOr federal Civilian WOrkers
group who completed 20 years of service continued their federal employment until they were eligible to draw a pension (see Figure 4). The FERS pension plan proba-bly played a central role in that absence of separations. By staying the additional 10 years, employees earned additional pension payments worth a total of about twice their annual salary. In particular, by serving the 30th year those workers became eligible to receive pensions at their current age of 56 instead of age 60, thus accruing four more years of pension payments. Each of those years of
payments amounts to about 30 percent of their annual salary. The employees examined here were required to contribute 0.8 percent of their salary to the pension plan, whereas employees hired more recently have to contrib-ute 4.4 percent of their salary. But even when contribut-ing 4.4 percent of salary, workers who complete 20 years of service after being hired at age 26 will receive addi-tional pension payments worth a total of almost twice their annual salary by staying an additional 10 years.
Figure 4 .
Voluntary Separations and Change in Accrued Value of a FERS Pension as a Share of SalaryPercentage of Workers
0
5
10
15
20
26 31 36 41 46 51 56
Immediately Eligible for a Full Pension
Percentage of Salary
-200
20406080
100120
26 31 36 41 46 51 56
Year Prior to Immediate Eligibility for a Full Pension
Age
Source: Congressional Budget Office, using data for 1984 through 2014 from the Office of Personnel Management.
Estimates shown are for employees who were hired at age 26 in 1984, the year FERS went into effect.
Employees become eligible to draw a pension if they have reached a certain age and years of service: age 62 with at least 5 years of service; age 60 with at least 20 years of service; and a minimum retirement age with at least 30 years of service. The minimum retirement age is 56 for employees born between 1953 and 1964, and it gradually increases to 57 for employees born after 1964.
Data on voluntary separations were readily available for the first 31 years of service under FERS. About 30 percent of the employees remained in the federal workforce longer than that.
The accrued value of a pension from an additional year of service is the discounted value of larger annuity payments from an additional year of federal service minus employees’ contributions to the pension plan.
FERS = Federal Employees Retirement System.
The accrued value of a pension from an additional year of service for those workers would be more than 100 percent of a year’s salary for those in the year prior to immediate eligibility for a full pension. If they completed that year, they could draw a full pension at age 56, whereas if they left during that year, they could not draw a full pension until age 60.
Voluntary separations from federal service for workers hired at age 26 in 1984 declined as they advanced toward immediate eligibility for a full pension at age 56.

20 OptiOns fOr Changing the retirement system fOr federal Civilian WOrkers august 2017
The pension plan reduces retention among workers once they become eligible for a pension immediately upon retirement. That is because employees who are eligible to receive pension payments forgo those payments if they continue serving, and the value of those forgone payments can exceed any increase in future pension payments from the additional service. For instance, among federal employees who were hired at age 26 in 1984 and still employed by the government at age 56, when they became eligible to retire, about 15 percent retired before turning 57. That is the last year of data on separations available to CBO for that group, but people who were hired at older ages can be followed to higher ages. Among workers who were hired at age 40 in 1984 and served until age 60, when they could start receiving a pension, about half left before turning 65. The increase in employees’ contributions in 2013 is likely to further reduce retention among retirement-eligible employees because they would have to contribute 4.4 percent of their salary in addition to forgoing pension payments.
It is unclear how the pension plan affects retention among employees who were hired recently. Retention rates are lower early in workers’ careers in part because that is when they are most likely to conclude that a job is a poor fit for them. The pension plan might have a modest effect on those retention rates, but the direction of that effect is unclear. On the one hand, the design of the pension plan provides only a limited retention incen-tive for early-career employees because it will typically be many years before they will receive pension payments. On the other hand, the large pension payments available to workers who remain in federal service for many years probably attract employees who are likely to stay through the early years to eventually receive those payments.
Effect of TSP on Retention. The effects of TSP on retention are roughly consistent over most of workers’ careers. In 2014, about 85 percent of employees received agency contributions equaling 4 percent to 5 percent of their salary. Employees of all ages and tenures receive substantial agency contributions. The lowest average contribution CBO measured, 3.5 percent, was for 39-year-olds with 22 years of service. That additional compensation generally increases retention but can reduce retention for older workers by making retirement affordable at a younger age, in CBO’s judgment.
Options for Changing the Federal Retirement SystemLawmakers could make changes to the federal retire-ment system that would change future spending. In this report, CBO examined two broad sets of options that would either revise the FERS pension plan or replace the pension plan for newly hired workers with an expanded defined contribution plan. CBO examined how each of the options would change federal spending on a cash basis and on an accrual basis, under the assumption that appropriations would be changed by a commensurate amount.33 CBO also analyzed how each of the options would affect workers’ current pay (that is, salary minus retirement contributions) and retirement income and how each option would affect the federal government’s ability to recruit and retain a qualified workforce.
In the first category of options—revising the pension—CBO looked at three specific options. Similar to options that CBO has assessed previously, they would either change employees’ contributions to the FERS pension plan or they would alter the formula used to calculate pension benefits.34 By showing the budgetary effects over 75 years, this analysis shows how the effects of some options would grow beyond the traditional 10-year bud-get window, whereas the effects of other options would decline over that longer period.
In the second category—eliminating the pension plan and increasing the employer’s TSP contributions—the agency examined two specific options. Those options show the effects of changing the structure of the federal government’s retirement plan to be more similar to those offered by many private-sector companies and some state governments during recent decades. The options are intended to be illustrative of the choices law makers would face in making such a switch. For example, law-makers would need to choose the amount of the govern-ment’s automatic and matching contributions to TSP. Those choices could be more or less costly to the government than the options considered here.
33. Specifically, CBO assumed that appropriations would be increased to cover the cost of additional agency contributions to employees’ TSP accounts. In contrast, CBO assumed that changes to the FERS defined benefit plan would not affect appropriations because those changes would not directly affect discretionary spending.
34. See, for instance, Option 12 in Congressional Budget Office, Options for Reducing the Deficit: 2017 to 2026 (December 2016), www.cbo.gov/publication/52142.

21august 2017 OptiOns fOr Changing the retirement system fOr federal Civilian WOrkers
All options would take effect in 2018, and their net costs are projected on a cash basis over 75 years from the current year, 2017, through 2091.35 (See Table 5 for a summary of the effects of the options on a cash basis.) The net costs of all options are projected on an accrual
35. The personnel costs of some agencies are reimbursed and the amounts of those reimbursements could change in response to changes in personnel costs. This report does not account for the effects of those potential changes.
basis for federal workers hired in 2018. (See Figure 5 for a summary of the effects of the options on an accrual basis.)36 The options would also change the portion of
36. Figure 5 shows net costs for only the 2018 cohort—the group of workers who start working for the federal government that year. Unlike examining costs on a cash basis, doing so on an accrual basis allows the full cost (over workers’ lifetimes) of retirement benefits for a given group of workers under current law to be compared with the full cost under each of the options. CBO
Table 5 .
Change in the Government’s Net Outflows for FERS Under Several Options That Would Change the FERS Pension Plan and Contributions to TSP
Percentage of Gross Percentage of Net OutflowsBillions of Dollars, Domestic Product, Under Current Law,
a b c
1. Increase Pension Contributions of Some Employees -47 -0.005 -3
2. Decrease Pension Contributions of Some Employees 32 0.021 13
3. Change Pension Formula to High 5 -3 -0.004 -3
TSP for New Employees
4. Eliminate Pension, Increase Government's TSP 79 0.015 10Contribution to a Maximum of 15 Percent
5. Eliminate Pension, Increase Government's TSP 58 -0.006 -3Contribution to 10 Percent
Change the Pension Plan
Replace the Pension Plan With Larger Contributions to
Source: Congressional Budget Office.
Option 1 would increase the FERS contribution rate to 4.4 percent for current employees (from 0.8 percent for employees hired before 2013 and from 3.1 percent for employees hired in 2013).
Option 2 would decrease the FERS contribution rate to 0.8 percent for all employees (from 4.4 percent for employees hired after 2013 and from 3.1 percent for employees hired in 2013).
Option 3 would decrease FERS pensions by basing the retirement benefit on the five years of highest salary (instead of three years of highest salary).
Option 4 would eliminate the FERS pension, increase the government’s automatic TSP contribution to 8 percent of salary, and require the government to match employees’ contributions up to an additional 7 percent.
Option 5 would eliminate the FERS pension, increase the government’s automatic TSP contribution to 10 percent of salary, and eliminate the government’s matching contribution.
A discount rate equal to the interest rate projected for 20-year Treasury securities was used in the calculation of present discounted values.
FERS = Federal Employees Retirement System; GDP = gross domestic product; TSP = Thrift Savings Plan.
a. Net outflows represent an increase in budget deficits. They include outlays for FERS pension benefits plus the government’s contributions to workers’ TSP accounts minus revenues from employees’ contributions to the pension plan.
b. Net present value of change in net outflows measured as a share of GDP.
c. Net present value of change in net outflows measured as a share of net outflows for the pension plan and TSP under current law. Net outflows include outlays for FERS pension benefits plus the government’s contributions to employees’ TSP accounts minus revenues from employees’ contributions to the pension plan.

22 OptiOns fOr Changing the retirement system fOr federal Civilian WOrkers august 2017
workers’ compensation that goes toward current pay versus the portion that gets contributed toward their retirement. (See Figure 6 for a summary of how the options are projected to change workers’ current pay and employees’ and employers’ contributions to the pension plan and TSP for the 2018 cohort.)
examines the 2018 cohort because that is the first cohort that would be affected by the options that eliminate the pension.
Figure 5 .
Net Accrual Cost to the Government of Retirement Benefits as a Share of Lifetime Salary for Workers Hired in 2018, Under Current Law and Under Several OptionsPercent
10.0
13.3
13.7
17.3
14.2
0 10 20
Option 5. Eliminate Pension, Increase Government'sTSP Contribution to 10 Percent
Option 4. Eliminate Pension, Increase Government’sTSP Contribution to a Maximum of 15 Percent
Option 3. Change Pension Formula to High 5
Option 2. Decrease Pension Contributions of Some Employees
Option 1. Increase Pension Contributions of Some Employees
Current Law
Same as current law for workers hired in 2018
Source: Congressional Budget Office.
Estimates shown are for workers with no prior federal service who are projected to join the federal workforce in 2018, irrespective of whether they receive a pension in retirement.
Under current law, employees hired in 2018 will contribute 4.4 percent of their salary to the FERS pension. The government will make an automatic TSP contribution of 1 percent of salary and match employees’ contributions up to an additional 4 percent.
Option 1 would increase the FERS contribution rate to 4.4 percent for current employees (from 0.8 percent for employees hired before 2013 and from 3.1 percent for employees hired in 2013). Option 1 is the same as current law for workers hired in 2018.
Option 2 would decrease the FERS contribution rate to 0.8 percent for all employees (from 4.4 percent for employees hired after 2013 and from 3.1 percent for employees hired in 2013).
Option 3 would decrease FERS pensions by basing the retirement benefit on the five years of highest salary (instead of three years of highest salary).
Option 4 would eliminate the FERS pension, increase the government’s automatic TSP contribution to 8 percent of salary, and require the government to match employees’ contributions up to an additional 7 percent.
Option 5 would eliminate the FERS pension, increase the government’s automatic TSP contribution to 10 percent of salary, and eliminate the government’s matching contribution.
These numbers approximate the share of workers’ salaries that would need to be set aside each year to fully fund those workers’ benefits. Retirement benefits and lifetime salary are discounted at a rate equal to the interest rate projected for 20-year Treasury securities.
FERS = Federal Employees Retirement System; TSP = Thrift Savings Plan.
Changes to the Pension PlanThe three options examined here would change the pen-sion plan in FERS by increasing some employees’ con-tributions, decreasing some employees’ contributions, or changing the formula that determines the basic pension.
Option 1. Increase Pension Contributions of Some Employees. Under this option, all employees enrolled in FERS would contribute 4.4 percent of their salary toward their pensions. The contribution rate would increase by 3.6 percentage points for employees who

23august 2017 OptiOns fOr Changing the retirement system fOr federal Civilian WOrkers
Figure 6 .
Current Pay and Share of Salary Contributed to the Pension Plan and TSP for Workers Hired in 2018, Under Current Law and Under Several OptionsThe current pay of federal employees varies depending on how much they are required to pay for their pension and how much they choose to save in TSP.
Percent
92.5
91.6
88.0
91.6
88.0
4.4
0.8
4.4
7.5
8.4
7.6
7.6
7.6
10.6
14.8
11.2
10.0
13.3
4.3
4.3
4.3
5. Eliminate Pension, Increase Government’sTSP Contribution to 10 Percent
4. Eliminate Pension, Increase Government’sTSP Contribution to a Maximum of 15 Percent
3. Change Pension Formula to High 5
2. Decrease Pension Contributions of Some Employees
1. Increase Pension Contributions of Some Employees
Current Law
Employees’ Contributions
Pension
TSPCurrent Pay
Same as current law for workers hired in 2018
Salary
Government’sContributions
Source: Congressional Budget Office.
Estimates shown are for workers with no prior federal service who are projected to join the federal workforce in 2018 and receive a pension in retirement.
Pay and contributions represent average values during workers’ federal service. Employees’ contributions to the pension plan are mandatory; contributions to TSP are optional. Current pay is salary minus employees’ required contributions to the pension plan and voluntary contributions to TSP.
Under current law, employees hired in 2018 will contribute 4.4 percent of their salary to the FERS pension. The government will make an automatic TSP contribution of 1 percent of salary and match employees’ contributions up to an additional 4 percent.
Option 1 would increase the FERS contribution rate to 4.4 percent for current employees (from 0.8 percent for employees hired before 2013 and from 3.1 percent for employees hired in 2013). Option 1 is the same as current law for workers hired in 2018.
Option 2 would decrease the FERS contribution rate to 0.8 percent for all employees (from 4.4 percent for employees hired after 2013 and from 3.1 percent for employees hired in 2013).
Option 3 would decrease FERS pensions by basing the retirement benefit on the five years of highest salary (instead of three years of highest salary).
Option 4 would eliminate the FERS pension, increase the government’s automatic TSP contribution to 8 percent of salary, and require the government to match up to an additional 7 percent.
Option 5 would eliminate the FERS pension, increase the government’s automatic TSP contribution to 10 percent of salary, and eliminate the government’s matching contribution.
A discount rate equal to the interest rate projected for 20-year Treasury securities was used in the calculation of present discounted values.
FERS = Federal Employees Retirement System; TSP = Thrift Savings Plan.

24 OptiOns fOr Changing the retirement system fOr federal Civilian WOrkers august 2017
enrolled in FERS before 2013 and by 1.3 percentage points for employees who enrolled in FERS in 2013. The increased contribution rates would be phased in between 2018 and 2021. Future pensions would not change under the option, and the option would not affect employees hired in 2014 or later. Those employees already contribute 4.4 percent of their salary toward the pension plan. Agencies’ contributions would remain the same.37
Effect on Federal Spending on a Cash Basis. The first option would reduce the government’s net outflows associated with the retirement system by $47 billion from 2018 through 2027. As a result, CBO estimates, the government’s net costs for FERS pensions and
37. An increase in the employees’ contribution rate could cause more employees who separate early to take a refund of their contributions, which in turn could slightly raise gross outlays for retirement benefits and might raise the share of salaries that agencies have to contribute to the CSRDF to fully fund the benefits of the remaining workers. CBO did not take such effects into account because no information was available on workers’ refund rates under different contribution rate regimes.
TSP contributions would be about 3 percent less over 75 years under this option than under current law in present-value terms—that is, considered as a single lump sum in today’s dollars. The option would mostly affect revenues, which would increase as the amount that the federal government collects from employees’ contribu-tions to FERS increases. Outlays would also increase somewhat under the option because of an increase in refunds to employees who leave federal service and withdraw the contributions that they have made to the pension. The effect of the option, in present-value terms over the 75-year period, would be a reduction in net out-flows of 0.005 percent of the present value of GDP over the same period (see Table 5 on page 21).
Because the option would only affect the contributions of employees hired before 2014, most of the revenue increases would occur in the years immediately following implementation, with a peak in 2021 (the last year of the phase-in period). Revenue increases would build up and then gradually dissipate as employees hired before 2014 leave federal service (see Figure 7).
Figure 7 .
Change in the Government’s Net Outflows for FERS if Pension Contributions of Some Employees Were Increased (Option 1)Over the 75-year period, net outflows for the pension plan and TSP under the option would be 3 percent lower than net outflows under current law.
Percentage of Gross Domestic Product
-0.030
-0.025
-0.020
-0.015
-0.010
-0.005
0.0002017 2025 2033 2041 2049 2057 2065 2073 2081 2089
Source: Congressional Budget Office.
Option 1 would increase the FERS contribution rate to 4.4 percent for current employees (from 0.8 percent for employees hired before 2013 and from 3.1 percent for employees hired in 2013).
Net outflows for FERS pensions include outlays for pension benefits minus revenues from employees’ contributions to the pension plan. The amount shown for each year is the change in net outflows that would occur in that particular year under the option.
FERS = Federal Employees Retirement System.

25august 2017 OptiOns fOr Changing the retirement system fOr federal Civilian WOrkers
Effect on Federal Spending on an Accrual Basis. Because the first option would affect only current workers, on an accrual basis retirement costs for the cohort of federal civilian workers hired in 2018 would remain unchanged from current law (see Figure 5 on page 22).
Effect on Workers’ Current Pay. Current pay would decline for federal civilian workers hired before 2013 by 3.6 per-centage points of their salary and would decline for those hired in 2013 by 1.3 percentage points.38 Because workers hired in 2018 will already contribute 4.4 percent under current law, the option would not affect their current pay, their contributions toward their pensions, or the costs to the government of their retirement benefits (see Figure 6 on page 23).
Effect on Workers’ Retirement Income. Option 1 would slightly reduce the retirement income that some federal workers receive. Because the option would not alter the formula that determines the pension, changes in federal retirement income would result only from changes in years of federal service or employees’ contributions to TSP. A decrease in average years of service would lead to a reduction in the average replacement rate that workers receive from their pension. It would also lead to lower TSP balances as a result of the shorter period over which workers would receive employers’ automatic and match-ing contributions. Because the option would decrease employees’ current pay, it could also affect workers’ replacement rates by affecting their contributions to TSP. CBO did not estimate those effects because of consider-able uncertainty surrounding them.
Effect on Recruitment. Option 1 would not affect the fed-eral government’s ability to recruit new employees. That is because employees hired in 2014 or later (as all new employees would be) would be unaffected by the option.
Effect on Retention. The option would lead to a mod-est increase in the number of employees who chose to leave federal service over the next 10 years. The most experienced and highly qualified employees would be the most likely to resign because of a rise in the employ-ees’ contribution rate. That is in part because the most experienced employees have served long enough to be
38. Those increases in contributions correspond to slightly bigger percentage declines in after-tax compensation because employee contributions are subject to income and payroll taxes. However, the income tax implications are outside the scope of this report.
eligible for a FERS pension immediately upon leaving the federal workforce and are forgoing pension payments by remaining in federal service. Some of those employees would choose to retire instead of making larger con-tributions to the pension plan in addition to forgoing payments. Also, some of the most highly qualified federal employees have more lucrative job opportunities in the private sector than in the federal government, in part because private-sector salaries have grown faster than fed-eral salaries since 2010. More of those employees would leave for the private sector under Option 1. Beyond the next 10 years, the effect of the option on retention rates would dissipate as the portion of the workforce subject to the increased pension payment shrank.
Option 2. Decrease Pension Contributions of Some Employees. Under this option, all employees would contribute 0.8 percent of their salary toward the pension. The contribution rate would not change for employees who enrolled in FERS before 2013. It would decline from 3.1 percent for those hired in 2013 and from 4.4 percent for those hired in 2014 or later. The formula for calculating defined benefit pensions would not change under the option. Agencies’ contributions for employees hired in 2013 or later would increase to ensure that the retirement pensions for those employees remained fully funded.
Effect on Federal Spending on a Cash Basis. The option would increase the government’s net outflows associ-ated with the retirement system by $32 billion from 2018 through 2027. In present-value terms, the gov-ernment’s net costs for FERS pensions and TSP would be 13 percent larger over the 75-year projection period than they would be under current law, CBO estimates. Revenues would decline as the amount that the federal government collected from employees’ contributions to FERS decreased. Outlays would decline somewhat under the option because of a decrease in the refunds paid to employees who leave federal service and withdraw the contributions that they have made to the pension. The effect of the option in present-value terms over the 75-year period would be an increase in net outflows of 0.02 percent of the present value of GDP over the same period (see Table 5 on page 21).
Because the reduction in employees’ contributions would be paralleled by an equivalent increase in the government’s contribution rate for the pension, agencies would require larger appropriations (all else being equal).

26 OptiOns fOr Changing the retirement system fOr federal Civilian WOrkers august 2017
However, those contributions are intragovernmental transactions and the change in the amount would have no net effect on the budget.
Because the option would affect the contributions of employees hired in 2013 or later—including all future employees—the decrease in revenues would grow larger over time. Revenues would drop in 2018, the year of implementation, and continue to decline gradually. As a result, net outflows would increase in 2018 and grad-ually increase over time. However, they would eventu-ally decline as a share of GDP, as the size of the federal workforce declines as a share of the total U.S. workforce, CBO projects (see Figure 8).
Effect on Federal Spending on an Accrual Basis. CBO estimates that Option 2 would increase the government’s net retirement costs for new employees hired in 2018 by 22 percent on an accrual basis. Net lifetime costs for retirement benefits would rise from 14.2 percent of salaries under current law to 17.3 percent of salaries under the option. The increase in the government’s accrual cost is somewhat smaller than the corresponding
3.6 percentage-point reduction in employees’ contribu-tion rate because the cost of funding the future benefits of the 2018 cohort is lowered by those employees who withdraw their contributions upon separating and give up their rights to a pension.
Effect on Workers’ Current Pay. Option 2 would increase the current pay of federal civilian workers hired after 2013 by 3.6 percentage points of their salary and the current pay of federal civilian workers hired in 2013 by 2.3 percentage points (see Figure 6 on page 23). The average worker hired in 2018 who went on to receive a pension would contribute 0.8 percent to the pension plan and 7.6 percent to TSP for a combined employee savings rate of 8.4 percent during his or her service, com-pared with 12.0 percent under current law.
Effect on Workers’ Retirement Income. Because Option 2 would change only employees’ contributions, not the pension formula, CBO projects that it would only modestly change workers’ retirement income, and that change would occur through a possible increase in expected years of federal service. An increase in the
Figure 8 .
Change in the Government’s Net Outflows for FERS if Pension Contributions of Some Employees Were Decreased (Option 2)Over the 75-year period, net outflows for the pension plan and TSP under the option would be 13 percent higher than net outflows under current law.
Percentage of Gross Domestic Product
0.000
0.005
0.010
0.015
0.020
0.025
0.030
2017 2025 2033 2041 2049 2057 2065 2073 2081 2089
Source: Congressional Budget Office.
Option 2 would decrease the FERS contribution rate to 0.8 percent for all employees (from 4.4 percent for employees hired after 2013 and from 3.1 percent for employees hired in 2013).
Net outflows for FERS pensions include outlays for pension benefits minus revenues from employees’ contributions to the pension plan. The amount shown for each year is the change in net outflows that would occur in that particular year under the option.
FERS = Federal Employees Retirement System.

27august 2017 OptiOns fOr Changing the retirement system fOr federal Civilian WOrkers
average years of service before retirement could lead to an increase in the average replacement rate that workers receive from their pension and could also lead to higher TSP balances as a result of the longer period over which the workers receive automatic and matching contribu-tions from the government. Because the option would increase employees’ current pay, it could also affect their retirement income by causing them to increase contribu-tions to TSP. CBO did not estimate those effects because of considerable uncertainty surrounding the effect of the option on workers’ behavior.
Under this option, the federal government would fund a larger share of its employees’ retirement income than it would under current law. The employing agencies of workers hired in 2018 who go on to receive a pension would incur total costs for the pension and TSP equal to 19.1 percent of workers’ salaries, up from 15.5 percent under current law (see Figure 6 on page 23).
Effect on Recruitment. Option 2 would enable the government to recruit a more highly qualified workforce by substantially decreasing the amount new workers pay for the pension. In particular, reducing employees’ contribution rates would make the pension plan more appealing to workers who are uncertain how long they would be in federal service. Using 26-year-old job candidates who expect to serve for 10 years as an example, CBO estimates that the net value of the pension for the candidates would be $9,000 under this option, compared with −$4,000 under current law (see Figure 3 on page 17). (The latter amount stems from the difference between the amount of interest workers would receive on their past contributions if they withdrew from FERS upon leaving federal employment, and the value they would have placed on being able to spend those contributions when they were earned.) More generally, the option would boost the net value of the pension regardless of how long the job candidate planned to stay in federal service.
Effect on Retention. Option 2 would also help the govern-ment retain a highly qualified workforce by reducing the number of recently hired employees who choose to leave federal service over the next 10 years. The gains in reten-tion would probably grow in later years as the portion of the workforce subject to the option expanded.
Option 3. Change the Pension Formula to High 5. This option would change how earnings are measured
when calculating the FERS pension payment. Under the option, average earnings would be calculated using the five consecutive years of employees’ highest earnings, rather than three years.
Effect on Federal Spending on a Cash Basis. Compared to current law, Option 3 would decrease the amount that the federal government pays for retirement benefits by $3 billion over the next 10 years. It would decrease spending on FERS pensions and TSP by 3 percent over 75 years in present-value terms, CBO estimates. Reve-nues would not be affected because contributions would be unchanged. The effect of the option would be to reduce outlays by 0.004 percent of the present value of GDP over the same period (see Table 5 on page 21).
Because Option 3 would affect only future pension recipients, the savings would increase gradually over time as more federal employees retired under the new rules, and then decline slightly as a share of GDP, as the federal civilian workforce declines as a share of the total U.S. workforce, CBO projects. As a result, the outlay savings would decline gradually over the next 30 years as a per-centage of GDP (see Figure 9).
Effect on Federal Spending on an Accrual Basis. The option would reduce the government’s net retirement costs by 3.5 percent on an accrual basis for the cohort of federal civilian workers hired in 2018 (see Figure 5 on page 22).
Effect on Workers’ Current Pay. Option 3 would only affect future pension payments. It would not affect workers’ current pay or their contributions to retirement, which would remain the same as under current law.
Effect on Workers’ Retirement Income. Because Option 3 would change the formula that determines the FERS pension, CBO projects that it would lead to a modest reduction in retirement income. Work-ers might choose to offset some of the decline in their retirement income by saving more in their TSP accounts. The degree to which federal employees might do that, however, would depend on how close to retirement they are and what other private savings they have. CBO could not examine the effects of this option on TSP contribu-tions because of a lack of information on federal workers’ private savings.

28 OptiOns fOr Changing the retirement system fOr federal Civilian WOrkers august 2017
Because of the reduction in the pension benefit, employing agencies would fund a smaller portion of their employees’ retirement income than they would under current law. The employing agencies of workers hired in 2018 who are projected to receive a pension in retirement would incur costs for the pension equal to 10.6 percent of workers’ salaries and costs for the TSP equal to 4.3 percent of workers’ salaries, for a combined total cost of 14.9 percent of salary under the option, compared with 15.5 percent under current law.
Effect on Recruitment. The option would have a small effect on the government’s ability to attract highly qual-ified workers because it would only modestly reduce the retirement benefit they would receive. The effect would also be small in that many potential hires are probably insensitive to modest changes in the size of the pension because they are uncertain whether they will remain in federal service long enough to receive it.
Effect on Retention. Option 3 would cause a small reduction in retention rates for midcareer employees but increase retention rates slightly for employees who are already at an age at which they can retire. Midcareer
employees would have less incentive to remain until they are eligible for a pension because that pension would be smaller. Some employees who are eligible to retire would postpone departure to compensate for the retirement income lost under the option.
Generally, reducing pensions might be less harmful to the federal government’s ability to compete with the private sector in attracting and retaining highly qualified personnel than a reduction in current pay might be. The reason is twofold. First, research indicates that past changes in retirement benefits have had less effect on recruitment and retention than past changes in salaries.39
Second, lower pension payments would make the mix between current pay and retirement income offered
39. Specifically, CBO found that locality-based salary increases had a larger effect on retention than the change in retirement benefits between CSRS and FERS. Other research indicates that the number of workers applying for federal jobs increased when federal salaries compared more favorably with private-sector salaries, whereas the relative generosity of federal benefits was not associated with an increase in the number of job applicants. See Alan B. Krueger, “The Determinants of Queues for Federal Jobs,” Industrial and Labor Relations Review (July 1988), pp. 567–581, http://ilr.sagepub.com/content/41/4/567.abstract.
Figure 9 .
Change in the Government’s Net Outflows for FERS if the Pension Formula Was Changed to High 5 (Option 3)Over the 75-year period, net outflows for the pension plan and TSP under the option would be 3 percent lower than net outflows under current law.
Percentage of Gross Domestic Product
-0.030
-0.025
-0.020
-0.015
-0.010
-0.005
0.0002017 2025 2033 2041 2049 2057 2065 2073 2081 2089
Source: Congressional Budget Office.
Option 3 would decrease FERS pensions by basing the retirement benefit on the five years of highest salary (instead of three years of highest salary).
Net outflows for FERS pensions include outlays for pension benefits minus revenues from employees’ contributions to the pension plan. The amount shown for each year is the change in net outflows in that particular year that would occur under the option.
FERS = Federal Employees Retirement System.

29august 2017 OptiOns fOr Changing the retirement system fOr federal Civilian WOrkers
by the federal government more like that offered by private-sector employers. Reductions in salaries, in contrast, would make the difference in that mix even bigger.
Replacing the Pension With Larger Government Contributions to TSP for New EmployeesDuring recent decades, many private-sector companies have restructured the retirement benefits that they offer to employees. In most cases, those private-sector employ-ers switched from defined benefit to defined contribution retirement programs.
Some state and local governments have also restructured their pension plans, although they have typically opted to preserve their traditional defined benefit plans while shifting away from complete reliance on those plans. Instead, they offer defined contribution plans as alterna-tives or offer hybrid plans that reduce the defined benefit and add or increase defined contribution options.
The shift toward defined contribution plans has gener-ally reduced employers’ uncertainty about costs in the future.40 From the employees’ perspective, the shift has made it easier to change jobs because they can more easily carry retirement benefits from one employer to another. At the same time, however, it has reduced finan-cial security for employees, who take on more responsi-bility for saving enough for retirement over the course of their careers and for investing those savings wisely.
Under both options in this section, the pension plan would be eliminated for federal workers hired in 2018 and later. Agencies’ contributions to TSP would increase for those workers to partially or fully offset the decline in retirement benefits associated with the elimination of the pension. For workers hired before 2018, the defined benefit and the TSP benefit would remain the same as under current law.
40. In a pension plan, employers bear risk related to investment returns on the resources set aside to pay out the benefits when they are due and the length of time over which pensions would have to be paid. Funding shortfalls and stock market volatility have resulted in some private-sector and state and local government plans being underfunded. In contrast, in a defined contribution plan, the employer makes regular contributions to savings accounts that are owned by the workers and thus does not face risks related to investment returns or workers’ life expectancy.
Because the two options differ only in the structure and amount of the employer’s TSP contribution, they would have similar types of effects on compensation, recruit-ment, and retention, but the effects of each option would differ in magnitude.
The options in this section are illustrative. The amounts of the agencies’ contributions to TSP could be set at various other levels.
Specifically, the two options are the following:
� Option 4. Eliminate the pension plan; increase the government’s automatic TSP contribution to 8 percent of salary, and require the government to match up to 7 percent of additional contributions for new employees, for a total contribution of as much as 15 percent.
� Option 5. Eliminate the pension plan, increase the employer’s automatic TSP contribution to 10 percent of salary, and eliminate the employer’s matching contribution for new employees.
Option 4. Eliminate the Pension and Increase the Government’s TSP Contribution to 8 Percent, Plus up to a 7 Percent Match. Under Option 4, agencies’ auto-matic contributions to TSP would increase to 8 percent of salary (from 1 percent under current law) and employ-ers would match employees’ contributions according to the following schedule: The first 5 percent of salary that an employee contributes would be matched dollar for dollar; the next 4 percent would be matched at 50 cents on the dollar; and any contributions above 9 percent of pay would not be matched. Employees who want to maximize their employer’s matching contributions would contribute 9 percent of their salary to TSP and receive an employer’s contribution of 15 percent of salary (the 8 percent automatic contribution and 7 percent matching contribution), for a total of 24 percent of pay contributed to the workers’ TSP accounts.
Under the option, all new employees would automat-ically be enrolled in TSP at a default contribution rate of 5 percent of salary (an increase from 3 percent under current law). A worker who does not change his or her contribution rate would receive a 13 percent contribu-tion from his or her agency (an 8 percent automatic con-tribution and a 5 percent matching contribution). TSP participants would be immediately vested in (entitled to)

30 OptiOns fOr Changing the retirement system fOr federal Civilian WOrkers august 2017
their own contributions and the employers’ automatic and matching contributions. A participant in TSP would be allowed to change his or her contribution rate, subject to limits set by the Internal Revenue Service.41
Also under the option, the ability of retirees to continue their health insurance coverage through the Federal Employees Health Benefits program into retirement would remain the same. That is, though the FERS pension would be eliminated, CBO assumed that the rules regarding eligibility for health insurance coverage for retirees would be adjusted so that eligibility for such coverage would not change.42
Option 5. Eliminate the Pension and Increase the TSP Contribution to 10 Percent. Under Option 5, agencies’ automatic contributions to TSP would increase to 10 percent of salary (from 1 percent under current law) and the employer match would be discontinued. All new employees under the option would be automatically enrolled in TSP at a default contribution rate of 5 per-cent of salary (from 3 percent under current law). TSP participants would be immediately vested in (entitled to) their own contributions and their employer’s automatic contributions. Workers who do not change their default contribution rates would have a total of 15 percent of salary contributed to their TSP accounts each period.
As under Option 4, the ability of retirees to continue their health insurance coverage through the FEHB program into retirement would remain the same. That
41. Employees’ and employers’ contributions to TSP are subject to IRS limits. In 2017, employees’ contributions are limited to $18,000 (combined traditional and Roth) and combined employee and employer contributions are limited to $54,000. Individuals over age 50 are allowed an additional $6,000 of catch-up contributions. Under current law, changes to those thresholds are related to changes in the consumer price index. In the projections, CBO modeled those limits to increase over time at the rate of growth of wages in order to keep constant the share of employees for whom the limits impose a constraint on savings. Under such a projection, CBO does not expect those limits to impose significant restrictions on employees’ TSP contributions. For example, in 2017, a 9 percent employee contribution rate, needed for receiving the full employer match under Option 4, would be barred by the IRS limits only for federal employees earning more than $200,000 per year. In 2014, less than 5 percent of federal employees contributed to TSP at the maximum allowed IRS limit.
42. Under current law, workers who have had FEHB coverage during the five years preceding retirement and who are eligible for a pension can continue their FEHB enrollment into retirement.
is, though the FERS pension would be eliminated, CBO assumed that the rules regarding eligibility for health insurance coverage for retirees would be adjusted so that eligibility for such coverage would not change.
Effects of Options 4 and 5. The two options would affect federal spending for employer-provided retire-ment benefits, as well as workers’ current pay, retirement income, recruitment, and retention.
Effect on Federal Spending on a Cash Basis. Both options would increase net costs to the government over the next 10 years. During that period, Option 4 would increase outlays by $52 billion, reduce revenues by $27 billion, and result in a $79 billion increase in net outflows. Over the same period, Option 5 would increase outlays by $31 billion and reduce revenues by $27 billion. Thus, Option 5 would result in a $58 billion increase in net outflows. The added outlays would result from the government’s larger contributions to the TSP accounts of newly hired workers; the revenue losses would stem from smaller contributions by employees to the pension plan because new hires would not be enrolled in that plan and would not contribute to it (see Table 5 on page 21).
Overall, on a cash basis Option 4 would result in net costs to the government that are 10 percent higher over the 75-year projection period than costs under current law, whereas Option 5 would result in net costs that are 3 percent lower than under current law (see Table 5 on page 21).
Under both options, the federal government would start realizing savings on a cash basis as the workers affected by the options began to retire (see Figure 10). Under the options, the federal government would carry no further obligations and make no subsequent retirement pay-ments to workers who are no longer in federal service. Starting in the 2050s, annual net outflows under the options would be smaller than under current law, CBO expects.
Because the years in which these two options would have net costs to the government occur within the 75-year time horizon, but not all of the years of cash savings do, the accrual estimates provide a more comprehensive measure of their effects and are more informative when comparing costs under the options with costs under current law.

31august 2017 OptiOns fOr Changing the retirement system fOr federal Civilian WOrkers
Effect on Federal Spending on an Accrual Basis. CBO pro jects that for the 2018 cohort, the net cost to the government of either option on an accrual basis would be lower than under current law. The government’s net retirement costs under current law would be about 14.2 percent of salaries for the 2018 cohort. For that group, the government’s net costs are projected to be 13.3 percent of salaries under Option 4 and 10.0 percent of salaries under Option 5 (see Figure 5 on page 22). The reason that both options cost less than current law on an accrual basis, but not on a cash basis, is because the net budgetary savings of the options on a cash basis would take longer than 75 years to be fully realized.
CBO estimates that savings under the options would increase more for cohorts hired after 2018. The rea-son that those savings would increase over time is that projected costs under current law increase faster than projected costs under the options. CBO anticipates that lifetime retirement costs for future cohorts hired under
current law would increase as a percentage of their life-time salaries because of improvements in life expectancy and, consequently, longer projected receipt of pensions for future cohorts. Because CBO did not project cor-responding increases in the length of workers’ careers, lifetime retirement costs for future cohorts hired under the options would remain roughly unchanged over time as a percent of those workers’ lifetime salaries.
Effect on Workers’ Current Pay. The options would change the current pay of the affected workers. Because workers under both options would no longer be required to con-tribute 4.4 percent of pay to the pension plan, their cur-rent pay would automatically increase. However, because workers contribute to TSP on a voluntary basis, it is more difficult to predict how their contributions would change under the options. CBO judged that the higher matching contributions and the higher default contri-bution rate under the options would result in employ-ees’ making a larger contribution to TSP, on average,
Figure 10 .
Change in the Government’s Net Outflows for FERS if the Pension Was Eliminated and the Government’s TSP Contribution Was Increased (Options 4 and 5)Over the 75-year period, net outflows for the pension plan and TSP under Option 4 would be 10 percent higher than outflows under current law, and net outflows under Option 5 would be 3 percent lower than net outflows under current law.
Percentage of Gross Domestic Product
4. Eliminate Pension, Increase Government’s TSP Contribution to a Maximum of 15 Percent
5. Eliminate Pension, Increase Government’s TSP Contribution to 10 Percent
-0.10
-0.06
-0.02
0.02
0.06
0.10
2017 2025 2033 2041 2049 2057 2065 2073 2081 2089
Source: Congressional Budget Office.
Option 4 would eliminate the FERS pension, increase the government’s automatic TSP contribution to 8 percent of salary, and require the government to match employees’ contributions up to an additional 7 percent for new employees.
Option 5 would eliminate the FERS pension, increase the government’s automatic TSP contribution to 10 percent of salary, and eliminate the government’s matching contributions for new employees.
Net outflows for FERS pensions include outlays for pension benefits minus revenues from employees’ contributions to the pension plan. For TSP, net outflows are the government’s contributions to employees’ TSP accounts. The amount shown for each year is the change in net outflows in that particular year that would occur under the option.
FERS = Federal Employees Retirement System; TSP = Thrift Savings Plan.

32 OptiOns fOr Changing the retirement system fOr federal Civilian WOrkers august 2017
under Option 4 than under current law (see Figure 6 on page 23). That higher contribution rate would offset some of the increase in current pay. Overall, CBO projects that the average current pay of workers affected by this option would be higher than their average current pay under current law.
In contrast, CBO expects that the employees’ contri-bution rate to TSP would be similar under Option 5 to their contribution rate under current law, because the absence of matching contributions would reduce their contributions by about the same amount that increasing the default contribution rate to 5 percent would increase it.
Under both options, agencies’ contributions toward the retirement benefits of their workers would be lower.
Effect on Workers’ Retirement Income. CBO also projected the effects that the two options would have on workers’ retirement income as measured by their expected average replacement rate (federal retirement income as a percent-age of preretirement earnings) at age 62. CBO projected that the average salary replacement rate for a worker hired in 2018 who leaves the federal government after 15 years (the average length of federal service) would be about 21 percent under Option 4, about 17 percent under Option 5, and about 24 percent under current law. The lack of an employer match under Option 5, however, might discourage some workers from contrib-uting to the plan and could further reduce their TSP accumulations and replacement rate beyond what CBO has projected.43
Unlike pension benefits, retirement benefits under the defined contribution plan accumulate more evenly over a worker’s tenure. As a result, for workers who join the federal workforce relatively young (in their 20s) and remain for 15 years, average replacement rates would
43. Although the presence of an employer match has been shown to increase the share of workers who participate and contribute to a defined contribution plan, more recent studies have indicated that the effect of automatic enrollment might be stronger than that of the employer match. For example, one study finds that automatic enrollment raises participation even in the absence of more traditional plan features known to be effective, such as the employer match. See John Beshears and others, “The Impact of Employer Matching on Savings Plan Participation Under Automatic Enrollment,” in David A. Wise, ed., Research Findings in the Economics of Aging (University of Chicago Press, 2010), pp. 11–327, www.nber.org/chapters/c8208.
be higher than those under current law under Option 4 and roughly on par with current law under Option 5 (see Figure 11). For workers who join the federal work-force in their 40s, average replacement rates under both options would be lower than average replacement rates under current law.
CBO projected workers’ TSP accumulations and con-verted them into annuities using the rate of return on 20-year Treasury securities, thereby equalizing the risks to employees in the defined benefit and defined contri-bution plans. (For additional details, see the appendix.) In doing so, CBO was able to compare replacement rates under current law and under the options examined here while holding workers’ investment risk constant. How-ever, under both Option 4 and Option 5, most employ-ees could expect higher long-run returns, on average, than that calculation would indicate, but they would also expose themselves to more investment and market risk under the options than under current law; depending on their investment returns, some workers would be worse off.
In addition, unless workers purchased an annuity with their TSP balances, they would also expose themselves to the risk of outliving their resources—a risk that they are partially insured against by the pension.44
Effect on Recruitment. Changes in workers’ current pay and retirement income under the options would affect recruitment and retention. Increasing the maximum agency TSP contribution to 15 percent under Option 4 would probably improve recruitment more than elimi-nating the pension would hamper it. In particular, many prospective employees who are uncertain how long they will stay in federal service might prefer the agency’s addi-tional contributions over the pension because they could keep most of the agency’s contributions no matter when they left the federal workforce. Moreover, portability across employers and the more even accrual of benefits in TSP would make workers’ projected retirement income under the options less dependent on their high-3 salary and their expected tenure with the federal government—both of which are highly uncertain. However, under the option, workers would bear more investment risk than
44. CBO’s analysis captures the approximate value of TSP contributions but does not attempt to incorporate the fees that would stem from purchasing annuities in the private market, as very few people choose to annuitize their TSP balances.

33august 2017 OptiOns fOr Changing the retirement system fOr federal Civilian WOrkers
Figure 11 .
Average Share of Preretirement Earnings Replaced at Age 62 or at Retirement for Workers Hired in 2018 Who Leave Federal Service After 15 Years Under Current Law, Option 4, and Option 5For federal workers hired in their 20s in 2018 who remain for the average length of service, 15 years, average replacement rates under the two options to eliminate the pension and increase TSP contributions would be about the same as under current law, or higher. For federal workers hired in their 40s in 2018, those rates would be lower than under current law.
5. Eliminate Pension, Increase Government’sTSP Contribution to 10 Percent
4. Eliminate Pension, Increase Government’sTSP Contribution to a Maximum of 15 Percent
Current Law
Ages 40 to 49 at Date Hired
Share of Preretirement Earnings
15
19
10 14
0 15 30
5. Eliminate Pension, Increase Government’sTSP Contribution to 10 Percent
4. Eliminate Pension, Increase Government’sTSP Contribution to a Maximum of 15 Percent
Current Law
Ages 30 to 39 at Date Hired
17
21
11 8
0 15 30
5. Eliminate Pension, Increase Government’sTSP Contribution to 10 Percent
4. Eliminate Pension, Increase Government’sTSP Contribution to a Maximum of 15 Percent
Current Law
Ages 20 to 29 at Date HiredTSP Pension
19
24
12 7
0 15 30
Source: Congressional Budget Office.
Estimates shown are for workers with no prior federal service who will join the federal workforce in 2018 and leave federal service after 15 years. Those workers would generally receive a pension in retirement.
Under current law, employees hired in 2018 will contribute 4.4 percent of their salary to the FERS pension plan. The government will make an automatic TSP contribution of 1 percent of salary and match employees’ contributions up to an additional 4 percent.
Option 4 would eliminate the FERS pension, increase the government’s automatic TSP contribution to 8 percent of salary, and require the government to match employee’s contributions up to an additional 7 percent.
Option 5 would eliminate the FERS pension, increase the government’s automatic TSP contribution to 10 percent of salary, and eliminate the government’s matching contribution.
Replacement rates were calculated at age 62 or at the age of retirement from federal service, whichever is later. Preretirement earnings were measured as workers’ average earnings in the last three years before retirement, adjusted for average growth in economywide earnings if they left federal service before becoming eligible for an immediate pension. Retirement income is the pension plus the annuitized value of workers’ TSP account balances at the time of retirement. The projected TSP account balances include the accumulated employers’ and employees’ contributions and the investment returns on those contributions. Retirement income excludes payments from Social Security, other employer-sponsored retirement plans, and personal savings.
The length of the bars reflects unrounded numbers.
FERS = Federal Employees Retirement System; TSP = Thrift Savings Plan.

34 OptiOns fOr Changing the retirement system fOr federal Civilian WOrkers august 2017
they do under current law because more of their retire-ment income would come from TSP.
Option 5 would also reduce the uncertainty about retirement income that stems from prospective employ-ees’ being unsure if they would remain in federal service long enough to receive a substantial pension. However, the option would reduce the average amount of retire-ment income and workers would bear more investment risk than they do under current law, which could lessen the attractiveness of the overall compensation package provided by the federal government. CBO could not determine whether, on average, the decrease in qual-ified applicants that would result from the reduction in compensation and the increase in investment risk would be smaller or larger than the increase in qualified applicants resulting from the elimination of uncertainty over whether they would serve long enough to receive a pension. However, positions that require professional and advanced degrees might become particularly difficult to fill, because federal workers with those qualifications already receive less compensation than their private-sec-tor counterparts do, on average.45
45. See Congressional Budget Office, Comparing the Compensation of Federal and Private-Sector Employees, 2011 to 2015 (April 2017), www.cbo.gov/publication/52637.
Effect on Retention. Option 4 and Option 5 would increase retention among early-career employees as well as those who would have been eligible for retire-ment under current law but reduce it among midcareer employees. For about the first15 years of their careers, most employees would accrue more benefits under those options than they would under current law. Put another way, the increase in agencies’ contributions to their employees’ TSP accounts would more than offset the loss of the pension after taking into account the cost employ-ees incur in contributing to the pension (see Figure 12). From about year 20 until they are eligible to retire, most employees would accrue much less benefit under Option 4 and Option 5 than under current law, giving employ-ees at that stage of their careers less incentive to stay. Employees who would have stayed long enough to col-lect a pension would be more likely to remain employed with the federal government past that age under both options, because doing so would no longer entail forgo-ing pension payments. Because agencies would provide more TSP contributions under Option 4 than Option 5, Option 4 would give a larger boost to early-career reten-tion and reduce midcareer retention by less.

35august 2017 OptiOns fOr Changing the retirement system fOr federal Civilian WOrkers
Figure 12 .
How the Value of the Pension and TSP to an Employee Hired at Age 26 Changes With an Additional Year of Service Under Current Law, Option 4, and Option 5Percentage of Salary
-30
0
30
60
90
120
26 30 34 38 42 46 50 54 58 62 66
Source: Congressional Budget Office.
Estimates shown are for workers who are hired at age 26 and who would wait to begin receiving pension payments until they are eligible for the full amount instead of taking reduced payments that begin at an earlier age. Current law estimates shown here differ from those shown for 4.4 percent of salary contributed in Figure 3 in four ways. One, estimates shown here are for the combined value of the pension and TSP instead of just the pension. Two, payments and contributions are discounted back to each age here as opposed to age 26. Three, this figure shows changes in the accrued value from one year to the next as opposed to the cumulative accrued value. Four, estimates here are as a percentage of salary rather than in thousands of dollars.
Under current law, employees hired after 2013 contribute 4.4 percent of their salary to the FERS pension. The government makes an automatic TSP contribution of 1 percent of salary, and matches employees’ contributions up to an additional 4 percent.
Option 4 would eliminate the FERS pension, increase the government’s automatic TSP contribution to 8 percent of salary, and require the government to match employees’ contributions up to an additional 7 percent.
Option 5 would eliminate the FERS pension, increase the government’s automatic TSP contribution to 10 percent of salary, and eliminate the government’s matching contribution.
The value of the pension and the TSP is the discounted value of larger pension payments and the government’s additional contributions to TSP from an additional year of federal service minus the employee’s contributions to the pension. Payments and contributions are discounted back to the employee’s age at a rate equal to the interest rate projected for 20-year Treasury securities plus about 2 percentage points to illustrate the value of the pension and TSP at each age.
Employees enrolled in FERS participate in Social Security under current law and would continue to do so under both options. Those benefits are not included in this analysis.
FERS = Federal Employees Retirement System; TSP = Thrift Savings Plan.
4. Eliminate Pension, Increase Government’s TSP Contribution to a Maximum of 15 Percent5. Eliminate Pension, Increase Government’s TSP Contribution to 10 Percent
Current Law
Years of Service Are Multiplied by a Larger Factor to Determine the Pension BenefitWill Become Eligible for
Pension Benefits at Age 60
Will Become Eligible for Pension Benefits at Age 57
Age

A P P E N D I X
Appendix: CBO’s Analytic Approach
T his appendix summarizes the approaches this report takes in projecting the outlays and revenues of the federal retirement systems on a cash basis; in estimating federal retirement
costs on an accrual basis; and in projecting the changes in the compensation, recruitment, and retention of federal civilian workers if the federal retirement systems were changed.
How CBO Projected Outlays and Revenues of the Federal Retirement Systems in the Long TermThe Congressional Budget Office relied on data from several sources to project the number of people receiv-ing retirement benefits from the federal government, the number of federal employees making contributions to the Civil Service Retirement and Disability Fund (CSRDF), and the outlays and revenues for each group. CBO then estimated total outlays and revenues for the federal retirement systems based on those projections. Those estimates of total outlays and revenues are pre-sented as annual amounts over the next 10 years and as a share of gross domestic product (GDP) over the next 75 years.
Data SourcesCBO used data from multiple sources. Information used to project the number of people receiving benefits from the federal retirement systems (retirees or their surviving spouses or children, if eligible) as well as the number of federal employees contributing to CSRDF was provided by the Office of Personnel Management (OPM). The most recent data available when this report was prepared were for 2015. Information used to project both average outlays and average revenues per person was provided by OPM and the Federal Retirement Thrift Investment Board (FRTIB). OPM provided information as of 2015 on benefit amounts for current retirees and their surviving dependents, and on employees’ salaries. That information was used to project average annual outlays for retirees’ benefits and average annual revenues from
employees’ contributions to the pension plan (which are a share of employees’ salaries).
FRTIB provided information on the participation of current employees and the contributions of current participants to the Thrift Savings Plan (TSP). The most recent data available from FRTIB were for 2014. That information was used to project average annual federal payments to employees’ TSP accounts.
Projecting the Number of Retirees and EmployeesFuture outlays and revenues in the federal retirement system will depend in part on the number of workers making contributions and the number of people receiv-ing benefits.
Under current law, CBO projects that the number of federal workers would remain unchanged after 2015 and over the next 10 years. Consistent with historical trends, CBO also projected that the size of the federal work-force would remain unchanged over the 75-year period. That is, CBO projected that the number of new federal civilian workers hired each year would equal the num-ber of workers retiring or leaving the federal workforce that year. In those projections, the characteristics of new workers, such as sex, age, previous years of service, and average salary, are consistent with recent information on newly hired employees provided by OPM. OPM made similar projections in its CSRDF Annual Report.1
The number of people receiving benefits will depend not only on the number of workers but also on retirement and mortality rates. CBO used retirement and mortality rates employed by the CSRDF Board of Actuaries to project the number of benefit recipients in each year. The retirement rates differ by sex, age, years of service, and type of pension. The mortality rates differ by sex, year of birth, and type of pension; those rates incorporate declines in mortality at a given age over time.
1. See Office of Personnel Management, Civil Service Retirement and Disability Fund Annual Report, Fiscal Year Ended September 30, 2016 (February 2017), https://go.usa.gov/xRQ56.

37APPENDIX OptiOns fOr Changing the retirement system fOr federal Civilian WOrkers
Projecting Outlays and RevenuesIn addition to the number of retirees and workers, out-lays and revenues also depend on the amount of spend-ing and revenues per person.
Spending consists of pension payments and agencies’ contributions to the TSP accounts of their employees. In turn, the size of pension payments and employer’s con-tributions depends on workers’ salaries. CBO projected workers’ salaries using earnings growth rates based on CBO’s long-term macroeconomic forecast of the econ-omy and on rates for merit increases used by the CSRDF Board of Actuaries. CBO projected recipients’ pension amounts using the program rules and applying cost-of-living increases that were consistent with CBO’s projec-tions of inflation. Agencies’ contributions to TSP also depend on how much workers choose to contribute to their accounts. CBO projected employees’ participation and contributions to TSP using data from the FRTIB.
Revenues consist of employees’ contributions to the pen-sion plan. CBO’s projections of those amounts are based on projections of workers’ salaries and the FERS rules.2
Estimating the Present Values of Future Outlays and RevenuesTo present the results of the long-term projections suc-cinctly, CBO summarized annual outlays and revenues as a single number that covers a given period by estimating the present value of those outlays and revenues. CBO estimated the present value of outlays and revenues for the 75-year horizon from 2017 through 2091. Such a measure facilitates comparison of the cash costs of the civilian federal retirement systems between current law and the options, especially when current law and the options differ in the timing of outlays or revenues.3
The present value of a given stream of future outlays or revenues depends on the rate of interest—known as the discount rate—that is used to translate those streams into current dollars. In estimating those present values, CBO used a discount rate equal to CBO’s long-term projec-tion of the nominal rate of return on 20-year Treasury
2. CBO did not analyze effects of the options on the federal government’s tax revenues or spending, other than those related to the federal retirement system.
3. CBO has used similar measures in other reports. See, for example, Congressional Budget Office, CBO’s 2016 Long-Term Projections for Social Security: Additional Information (December 2016), www.cbo.gov/publication/52298.
securities.4 Twenty years is approximately the average maturity of the defined benefit obligations.
How CBO Projected Costs in the Federal Retirement Systems on an Accrual BasisUsing an accrual measure, CBO estimated net lifetime outflows for a given group of workers under current law and under the options, and expressed those outflows as a percentage of the lifetime salaries of that same group of workers. The measure approximates the percentage of workers’ salaries that needs to be set aside each year to fully fund those workers’ benefits.5
Net lifetime outflows are calculated as the sum of the discounted present values of the projected annual outlays for defined benefit pension payments (to the retired workers and their spouses and children, if eligible), minus employees’ contributions to the pension plan, plus the government’s contributions to TSP. Lifetime salaries are calculated as the sum of the discounted present values of the projected annual salaries of the examined group of workers. CBO used the same discount rate to estimate costs on an accrual basis as it did to estimate the pres-ent value of outlays and revenues on a cash basis for the 75-year horizon.6
The discount rate does not account for the market risk borne by the government. For instance, future earn-ings by federal employees are uncertain. Because those earnings are used to determine pension payments to future retirees, the cost of those benefits to the federal government is also uncertain. In the future, CBO expects to analyze the accrual cost of federal retirement benefits under current law and under the options on a fair-value basis. The fair-value approach reflects the market value of the federal government’s obligations. In those calcula-tions, CBO expects to use a discount rate that is higher
4. The rate of return on 20-year Treasury securities is projected to be 2.7 percent in 2017 and to increase to 5.0 percent by 2046—corresponding to rates of 1.0 percent and 3.0 percent, respectively, after removing the effects of inflation. It is 30 basis points higher than CBO’s long-term projection of the rate of return on 10-year Treasury securities.
5. The CSRDF’s actuaries use a similar concept to determine the percentage of pay that needs to be contributed to the fund in order to fully fund the pension benefits of a given group of employees.
6. CBO’s projections of wage growth, inflation, and interest rates (and discount rates) differ from those of the actuaries of the CSRDF.

38 OptiOns fOr Changing the retirement system fOr federal Civilian WOrkers august 2017
than the rate on 20-year Treasury securities that would include a risk premium to reflect the cost of market risk borne by the government.
How CBO Modeled the Effects of Changing the Pension and TSP on Retirement Income, Recruitment, and RetentionChanges to the Federal Employees Retirement System (FERS) can affect not only the federal budget but also the retirement income of federal employees, and, con-sequently, the government’s ability to attract and retain a qualified workforce. This section describes how CBO analyzed the effect of federal workers’ retirement plans on retirement income, recruitment, and retention under current law and under the options.
Modeling Retirement IncomeTo assess the effects of changes to the federal retirement system on workers’ retirement income, CBO pro-jected such income for the first cohort of workers who would be affected by the options that would change the pension—those workers who would join the federal workforce in 2018. The agency examined how those workers’ retirement income would compare with their earnings before retirement—that is, the replacement rate—both under current law and under the options. CBO expects that the effects of the options on the replacement rates of workers who join the federal work-force later would be of similar magnitude but did not include those calculations in the analysis because that would have required projections beyond the 75-year horizon.
Projecting Retirement Income. CBO projected the income that workers would receive in retirement from the defined benefit and defined contribution plans that they participated in during their federal service. CBO did not include retirement income from Social Security, from private savings, or from retirement plans from other employers in the calculation of retirement income because those data were not available.
CBO projected the monthly pension amount for workers who join the federal workforce in 2018 using informa-tion from OPM on the salaries of recently hired employ-ees. It projected workers’ salaries using wage growth rates based on CBO’s long-term macroeconomic forecast of the economy and rates of merit increases used by the CSRDF Board of Actuaries. CBO projected recipients’ defined benefit amounts using the program rules and applying cost-of-living increases that were consistent
with CBO’s projections of inflation. That information is needed because defined benefit pensions depend on workers’ earnings histories, age, and years of service at retirement.
To project retirement income from the defined contribu-tion plan, CBO projected the TSP balances that work-ers would accumulate and then estimated the annuity streams that workers could purchase with those balances. To project TSP balance accumulations for workers who join the federal workforce in 2018, CBO used data on TSP participants’ behavior from 2008 through 2014. CBO estimated participation rates, employees’ contri-bution rates, and the government’s contribution rates by workers’ age, years of service, and plan type. CBO then used those estimates of annual TSP contributions, together with a projected rate of return that equals the projected return on 20-year Treasury securities, to calculate workers’ account balances at retirement.7 Using that rate of return makes the risk associated with returns on TSP contributions equal to the risk associated with FERS pension benefits, making projected income from the defined benefit and defined contribution plans easily comparable. In projecting retirement income, CBO did not account for the potential effect that TSP loans, hardship withdrawals, or cash-outs upon leaving fed-eral service could have on workers’ balances because of limited data.8
Beginning in August 2010, new federal employees were automatically enrolled in TSP; CBO took that
7. Employees’ and employers’ contributions to TSP are subject to limits set by the Internal Revenue Service. Under current law, those limits are indexed to changes in the consumer price index. According to CBO’s macroeconomic forecast, wages will grow faster than inflation over the examined 75-year period. As a result, the contribution limits under current law would impose significant restrictions on employees’ TSP contributions in the future under Option 4 and Option 5. In order to keep the share of employees whose savings are constrained by the limits constant over time, CBO’s analysis incorporated the assumption that those limits would increase at the rate of growth of wages.
8. In the context of 401(k) plans, hardship withdrawals, loans, and cash-outs upon leaving the employer but before reaching age 59½ are often referred to as leakages. Using data on defined contribution plans in the private sector, some researchers have found that current leakage rates from 401(k) plans reduce aggregate age-60 retirement assets by more than 20 percent. See Alicia Munnell and Anthony Webb, The Impact of Leakages from 401(k)s and IRAs, Working Paper 2015-2 (Center for Retirement Research at Boston College, February 2015), http://tinyurl.com/y9w873aa.

39APPENDIX OptiOns fOr Changing the retirement system fOr federal Civilian WOrkers
into account in its projections.9 Using TSP data, CBO estimated that automatic enrollment considerably affected federal workers’ participation and savings behavior in TSP.10 The share of workers who contribute to their accounts increased after the adoption of auto-matic enrollment, whereas the average contribution rate declined.
Finally, CBO projected the annuity streams that workers could purchase with their TSP balances by calculating an inflation-adjusted annuity that a person could receive at retirement. In the calculation of that annuity stream, CBO used sex and life expectancy and the same rate of return as the projected return on 20-year Treasury securities. The inflation adjustment equals the projected cost-of-living adjustment in FERS at the time of retire-ment. CBO’s analysis captures the approximate value of the retirement income that can be generated from the TSP contributions but does not attempt to incorporate the fees that would stem from purchasing such an annu-ity because few individuals currently purchase annuities using their defined contribution plans.11
Projecting Replacement Rates. To assess the effects of potential changes to the federal retirement system on workers’ income in retirement, CBO estimated a work-er’s retirement income as a share of preretirement earn-ings under current law and under the options examined in this report. That share is known as a replacement rate. The replacement rate provides a different perspective on retired workers’ benefits from the view offered by looking simply at amounts.
Retirees’ replacement rates were calculated at age 62 or at the age of retirement from federal service, whichever would be later. Preretirement earnings were measured
9. As of August 2010, new federal employees have 3 percent of their pay automatically deducted and placed in their TSP accounts. A share of workers’ salary was not automatically contributed to TSP for workers hired before August 2010. Instead, those workers had to make an active decision to contribute.
10. For more information on participants’ outcomes in TSP, see Thrift Savings Plan, “Participant Behavior and Demographics: Analysis of 2010–2014” (2015), https://go.usa.gov/xRkcQ.
11. People may choose not to annuitize their defined contribution balances because of market failures in the private annuity markets or the desire to hold assets to cover future expenses (for instance, health care costs) or to leave bequests. In addition, some people’s resources in retirement are already heavily annuitized because of Social Security and defined benefit plans.
as the workers’ average earnings in the last three years before retirement, adjusted for average growth in economy wide earnings if the worker left federal service before becoming eligible for an immediate pension.12 CBO made no adjustments for income taxes paid before or in retirement.13
The replacement rates estimated in this report do not necessarily reflect all income that federal civilian retirees will have in retirement. CBO did not include income from other sources, such as Social Security, pensions from other employers, and personal savings because those data were not available.
Uncertainty in Projecting Replacement Rates. CBO projected workers’ TSP accumulations using a rate of return that equalizes the risks in the defined benefit and defined contribution plans. In doing so, CBO was able to compare replacement rates under current law and under the options examined here while holding workers’ investment risk constant.
However, the actual investment choices available to par-ticipants in TSP will not generate the rate of return that CBO used to equalize the risks in the defined benefit and defined contribution plans.14 In practice, retirement income from the defined contribution plan is more uncertain than retirement income from the pension. That is because workers’ TSP accumulations face addi-tional uncertainty from their investment choices and from the variability in the rates of returns associated with those choices.
12. For a worker who is eligible for an immediate pension upon leaving federal service, the last three years before retirement are the last three years before he or she left the federal workforce. A worker who is not eligible for an immediate pension was projected to work continuously after leaving the federal workforce, and his or her earnings were projected to increase with average wage growth until age 62. The last three years before retirement for that worker are defined as the last three years before the worker reaches age 62.
13. Because of lack of information about individuals’ tax rates before and after retirement, CBO also did not make projections about workers’ choices between the two tax treatments of TSP—traditional versus Roth.
14. The G-Fund rate is the risk-free investment option available to participants in TSP. The average G-Fund rate between 1988 and 2016 was about 5.1 percent, which was about 40 basis points lower than the rate of return on 20-year Treasury securities over the same period.

40 OptiOns fOr Changing the retirement system fOr federal Civilian WOrkers august 2017
Currently TSP participants can choose from five core funds and several target-date funds. The five core funds are the Government Securities Investment (G) Fund, the Fixed Income Index Investment (F) Fund, the Common Stock Index Investment (C) Fund, the Small Cap Stock Index Investment (S) Fund, and the International Stock Index Investment (I) Fund. The target-date funds, also known as “life-cycle” funds or L Funds, use a profession-ally determined mix of the five core funds that is tailored to meet an optimal balance between expected return and risk based on various time horizons.
On average, federal employees who invest in the full range of options available in TSP, including in the vari-ous stock index funds, can expect to earn returns above the rate of return on 20-year Treasury securities and thus increase their replacement rates over those estimated here. However, they can do so only by bearing market risk.
Market risk is the component of risk that remains even after a portfolio has been diversified as much as possible. It arises because most investments tend to perform rel-atively poorly when the economy is weak and relatively well when it is strong. People value income from invest-ments more when the economy is weak and incomes are relatively low, and so would assign a higher cost to a given loss that occurs during economic downturns than to the same size loss in good economic conditions. The cost of market risk captures those collective assessments of the value of losses in bad times relative to good times. Investors in assets that have market risk expect to earn a greater rate of return on their investments than Treasury securities offer, as compensation for the risk that they bear.
CBO used recent data on TSP balances to analyze par-ticipants’ portfolio allocations. On average, about half of the assets of employees enrolled in FERS are invested in the G fund, about 15 percent are in life-cycle funds, another 15 percent are in the C fund, and the rest are roughly equally distributed among the remaining funds. Portfolio allocations vary by age and years of service—recently hired workers and those who are approaching retirement hold a higher proportion of their assets in the risk-free G fund than workers in midcareer.
To illustrate the trade-off between investment returns and risk, CBO simulated replacement rates, using his-torical rates of return on investments, for workers hired
in 2018 who leave the federal workforce with 15 years of service under two scenarios. CBO used historical information on the annual rate of return of the TSP funds between 1988 and 2016 for each simulation.15 In one scenario, workers invest solely in a risk-free asset (such as the G fund.) In the second scenario, workers hold a balanced portfolio that is invested in the life-cycle fund whose target date is closest to the worker’s expected retirement date. Because of recent design changes in TSP, the second scenario might be more illustrative of future cohorts of workers. Those changes include the adoption of automatic enrollment for workers hired after August 2010 and, in September 2015, the change of the default investment from the G fund to an age-appropriate life-cycle fund.
Under both current law and Option 4 (which would eliminate the pension, increase the government’s auto-matic TSP contributions to 8 percent of salary, and require the government to match up to 7 percent of additional contributions for new employees), the average replacement rate using the risk-free investment strategy is lower than the average replacement rate using the balanced portfolio, according to CBO’s simulations, but it is also less variable (see Figure A-1). That is because riskier portfolios would result in a higher but less certain replacement rate on average. The replacement rate under Option 4 also varies more than the one under current law regardless of investment strategy because under that option workers would receive all of their retirement income from their TSP investments, and income from TSP is less certain than income from the pension.
Modeling Recruitment and RetentionTo analyze the effects of FERS on recruitment and reten-tion and forecast how those effects would change under the options, CBO estimated the value that federal work-ers place on current pay (that is, salary minus retirement contributions) and retirement income, and examined how past changes in those forms of compensation have affected recruitment and retention. The value that work-ers place on retirement income—in particular, defined benefit pensions—depends greatly on the value they
15. Using data from FRTIB on annual returns of the investment funds in the TSP, CBO estimated that between 1988 and 2016 the average rates of return on the TSP funds were 2.9 percent, 9.3 percent, 4.2 percent, 10.6 percent, and 4.8 percent for the G, C, F, S, and I Funds respectively, after removing the effects of inflation. Of those, the most variable were the S, I, and C Funds, in that order.

41APPENDIX OptiOns fOr Changing the retirement system fOr federal Civilian WOrkers
Figure A-1.
Share of Simulations in Which Workers Receive Various Shares of Preretirement Earnings at Age 62 or at Retirement if They Leave Federal Service After 15 Years, Using Historical Returns on InvestmentsUnder current law and under Option 4, the replacement rate is more uncertain when the allocation is a balanced portfolio than when it is a risk-free portfolio.
Average
TSP Allocation Is a Balanced Portfolio
Current Law 4. Eliminate Pension, Increase Government’s TSP Contribution to a Maximum of 15 Percent
TSP Allocation Is a Risk-Free Portfolio
Current Law 4. Eliminate Pension, Increase Government’s TSP Contribution to a Maximum of 15 Percent
Percent
Share of Preretirement Earnings Share of Preretirement Earnings
0
10
20
30
40
10 15 20 25 30 35 400
10
20
30
40
10 15 20 25 30 35 40
0
10
20
30
40
10 15 20 25 30 35 400
10
20
30
40
10 15 20 25 30 35 40
Source: Congressional Budget Office.
Estimates shown are for workers with no prior federal service who are projected to join the federal workforce in 2018 and remain the average length of service, 15 years.
Under current law, employees hired in 2018 will contribute 4.4 percent of their salary to the FERS pension. The government will make an automatic TSP contribution of 1 percent of salary, and match employees’ contributions up to an additional 4 percent.
Option 4 would eliminate the FERS pension, increase the government’s automatic TSP contribution to 8 percent of salary, and require the government to match employees’ contributions up to an additional 7 percent.
Replacement rates were calculated at age 62 or at the age of retirement from federal service, whichever is later. Preretirement earnings were measured as the workers’ average earnings in the last three years before retirement, adjusted for average growth in economywide earnings if they left federal service before becoming eligible for an immediate pension. Retirement income is the pension plus the annuitized value of workers’ TSP account balances at the time of retirement. The projected TSP account balances include the accumulated employers’ and employees’ contributions and the investment returns on those contributions. Retirement income excludes payments from Social Security, other employer-sponsored retirement plans, and personal savings.
The historical average of the risk-free rate of return used in this simulation is higher than the interest rate projected for 20-year Treasury securities.
Bars indicate the share of simulations in which retirement income replaced a particular share of salary. Dotted vertical lines indicate the average outcome. The risk-free portfolio allocation is the G fund. The balanced portfolio allocation is the life-cycle fund whose target date is closest to the worker’s expected retirement date.
FERS = Federal Employees Retirement System; TSP = Thrift Savings Plan.

42 OptiOns fOr Changing the retirement system fOr federal Civilian WOrkers august 2017
place on future income relative to current income. In this analysis, the value of future income is determined by the discount rate workers would use to translate future pen-sion payments into current dollars. That discount rate is estimated to be 7 percent, which is about 2 percentage points higher than the discount rate CBO uses to deter-mine the cost of those pension payments to the federal government. Using a higher discount rate for employee valuations is consistent with OPM data showing that many departing federal employees opt to have their con-tributions refunded and forgo pension payments.16 It is also supported by a recent study that found teachers are willing to pay only a small portion of the cost of fund-ing an increase in their pension benefits.17 At a discount rate of 7 percent, 26-year-old job candidates are likely to value the pension payments they would receive less than the contributions they would have to make, unless they anticipate serving 20 years or more (as shown in Figure 3 on page 17). The threshold falls to about 15 years when using a discount rate that is 1 percentage point lower and rises to about 25 years when using a discount rate that is 1 percentage point higher.
After estimating the values that workers place on current pay and retirement income, CBO examined how changes in those two forms of income affected employee reten-tion in the past. To determine how retention is affected
16. See Office of Personnel Management, Civil Service Retirement and Disability Fund Annual Report, Fiscal Year Ended September 30, 2016 (February 2017), https://go.usa.gov/xRQ56.
17. See “How Much Are Public School Teachers Willing to Pay for Their Retirement Benefits?” American Economic Journal: Economic Policy, vol. 7, no. 4 (November 2015), pp. 165–188, http://dx.doi.org/10.1257/pol.20140087.
by changes in current pay—such as changes in employ-ees’ contributions to the pension plan—CBO examined the changes in retention that accompanied the substan-tial salary increases given to all workers on the General Schedule pay classifications for federal employees in the San Francisco, Los Angeles, and New York City areas in 1991. The retention rates rose far more for those employ-ees than it did for federal employees in other locations.
To determine how retention is affected by changes in the amount of the FERS pension, CBO examined the changes in retention that accompanied the switch from the Civil Service Retirement System to the smaller pen-sions available through FERS. In making its calculations, CBO also weighed the substantial changes in the pen-sion’s value to workers over the course of their careers: retention rates are generally higher when additional service will cause relatively large increases in the value of the pension (as shown in Figure 4 on page 19).18 CBO conducted those analyses using data from OPM that cover the vast majority of federal civilian personnel, with the exception of Postal Service employees.19 The agency concluded that reducing pension benefits would decrease retention among midcareer employees and increase retention among employees who are already eligible to retire.
18. Other researchers have also found that changes in pension values affect when federal employees retire by studying employees in CSRS. See Beth Asch, Steven J. Haider, and Julie Zissimopoulos, “Financial Incentives and Retirement: Evidence From Federal Civil Service Workers,” Journal of Public Economics, vol. 89, no. 2 (February 2005), pp. 427–440, http://tinyurl.com/yd2qh3yy.
19. OPM provided data from the Enterprise Human Resources Integration Data Warehouse Statistical Data Mart.

Definitions
Accrual basis: A system of recording outlays and rev-enues when commitments are made, even though the actual cash transactions are made at a different time. See cash basis.
Annuity: An annuity is a fixed sum of money paid to someone on a regular basis (often every month or year), typically for the rest of his or her life.
Cash basis: A system of recording outlays and revenues when the cash transactions occur, even though com-mitments may have been made at a different time. See accrual basis.
Civil Service Retirement System (CSRS): A retirement plan provided by the federal government for its civilian employees. Most employees hired in 1983 or earlier are enrolled in CSRS; it is not available to employees first hired after 1983. It consists of a pension, jointly funded by the employees and the federal agencies that hire them, and a defined contribution plan. Employees enrolled in CSRS do not receive contributions to their defined contribution accounts from the agencies that employ them. Employees enrolled in CSRS are also generally not covered by Social Security while employed by the federal government. See Federal Employees Retirement System.
Current pay: In this report, workers’ salary minus their required contributions to the pension plan and minus their projected voluntary contributions to the defined contribution plan. Current pay is a before-tax measure of salary; income used to pay individual income taxes, payroll (or social insurance) taxes, and other federal taxes is included.
Defined benefit plan (pension plan): An employer- sponsored retirement plan that typically provides its beneficiary with a stream of regular payments that commence upon the recipient’s retirement and end at the time of his or her death. Payments under such a plan are set on the basis of a formula that typically accounts
for an employee’s earnings, years of service, and age at retirement. They are referred to as an annuity or pension. Federal employees must contribute a portion of their salary to fund the pension plans in CSRS and FERS. See defined contribution plan.
Defined contribution plan: An employer-sponsored retirement plan that typically provides its beneficiary with a tax-preferred savings account. The 401(k) plans provided by private employers are one type of defined contribution plan. Typically workers and their employers contribute a certain amount or percentage of salary to the account. The account is owned by the worker and its balance changes over time with the amounts contributed and with the investment earnings or losses on those con-tributions. See defined benefit plan and Thrift Savings Plan (TSP).
Discount rate: In this report, the interest rate used to determine the present value of a future stream of reve-nues, outlays, or income. See present value.
Federal Employees Retirement System (FERS): A retirement plan provided by the federal government for its civilian employees. Most employees hired in 1984 or later are enrolled in FERS. It consists of a pension, jointly funded by the employees and the federal agen-cies that hire them, and a defined contribution plan. Employees enrolled in FERS receive automatic and matching contributions to their defined contribution accounts from the agencies that employ them. Employ-ees in FERS are covered by Social Security. See Civil Service Retirement System (CSRS).
Present value: A single number that expresses a flow of revenues, outlays, or income over time in terms of an equivalent lump sum received or paid at a specific time. The calculation enables a comparison of the costs of programs or projects that differ in the timing of their cash flows. The present value depends on the discount rate that is used to translate past and future cash flows into current dollars. For example, if $100 is invested on

44 OptiOns fOr Changing the retirement system fOr federal Civilian WOrkers august 2017
January 1 at an annual interest rate of 5 percent, it will grow to $105 by January 1 of the next year. Hence, at an annual 5 percent interest rate, the present value of $105 payable a year from today is $100. See discount rate.
Replacement rate: Annual retirement income as a share of annual earnings prior to retirement. Retirement income is measured at age 62 or the projected age of retirement from the federal service, whichever is later. Earnings are measured as the average of annual earnings in the last three years before retirement. See retirement income.
Retirement income: Estimated income from the defined benefit pension and an annuity stream that could be purchased with a worker’s accumulated TSP balance. CBO did not include income from Social Security, from private savings, or from retirement plans from other employers in retirement income, because those data were not available. See replacement rate.
Thrift Savings Plan (TSP): A defined contribution plan sponsored by the federal government. TSP is similar to the 401(k) plans provided by many employers in the private sector. See defined contribution plan.

List of Figures and Tables
Figures
1. Net Government Outflows for Major Federal Civilian Retirement Programs 22. Average Share of Preretirement Earnings Replaced at Age 62 or at
Retirement for Workers Hired in 2018 Who Leave Federal Service After 15 Years, Under Current Law 14
3. The Net Value of a FERS Pension to a Worker Considering Federal Employment at Age 26, by Years of Service and Anticipated Age of Separation 17
4. Voluntary Separations and Change in Accrued Value of Pension as a Share of Salary 195. Net Accrual Cost to the Government of Retirement Benefits as a Share
of Lifetime Salary for Workers Hired in 2018, Under Current Law and Under Several Options 22
6. Current Pay and Share of Salary Contributed to the Pension Plan and TSP for Workers Hired in 2018, Under Current Law and Under Several Options 23
7. Change in the Government’s Net Outflows for FERS if Employees’ Pension Contributions Were Increased (Option 1) 24
8. Change in the Government’s Net Outflows for FERS if Employees’ Pension Contributions Were Decreased (Option 2) 26
9. Change in the Government’s Net Outflows for FERS if the Pension Formula Was Changed to High 5 (Option 3) 28
10. Change in the Government’s Net Outflows for FERS if the Pension Was Eliminated and the Government’s TSP Contribution Was Increased (Options 4 and 5) 31
11. Average Share of Preretirement Earnings Replaced at Age 62 or at Retirement for Workers Hired in 2018 Who Leave Federal Service After 15 Years Under Current Law, Option 4, and Option 5 33
12. How the Value of the Pension and TSP to an Employee Hired at Age 26 Changes With an Additional Year of Service Under Current Law, Option 4, and Option 5 34
A-1. Share of Simulations in Which Workers Receive Various Shares of Preretirement Earnings at Age 62 or at Retirement if They Leave Federal Service After 15 Years, Using Historical Returns on Investments 41
Tables
1. Estimated Effects of Several Options That Would Change the FERS Pension Plan and Contributions to TSP 3
2. Projected Outlays, Revenues, and Net Outflows for Major Federal Civilian Retirement Programs 12
3. Salary, Performance, and Retention of Newly Hired Employees 154. Separation Rates for Workers Hired in 1984 185. Change in the Government’s Net Outflows for FERS Under Several
Options That Would Change the FERS Pension Plan and Contributions to TSP 21

About This Document
This report was prepared at the request of the Chairman of the House Committee on Oversight and Government Reform. In keeping with the Congressional Budget Office’s mandate to provide objective, impartial analysis, the report makes no recommendations.
Justin Falk and Nadia Karamcheva wrote the report with guidance from Molly Dahl and Joseph Kile. Elizabeth Bass, Jordan Berne, Holly Boras, William Carrington, Michael Falkenheim, Sebastien Gay, Heidi Golding, Jeffrey Holland (formerly of CBO), Wendy Kiska, Jason Levine (formerly of CBO), Amber Marcellino, John McClelland, David Mosher, Daniel Ready, Stephanie Ruiz, Chad Shirley, Carla Tighe Murray, Julie Topoleski, and David Torregrosa pro-vided useful comments on various drafts of the report. In addition, Andrew Biggs of the Ameri-can Enterprise Institute, Alicia Munnell of Boston College, and James Poterba of the Massachu-setts Institute of Technology provided helpful comments. (The assistance of external reviewers implies no responsibility for the final product, which lies solely with CBO.)
Mark Hadley, Jeffrey Kling, and Robert Sunshine reviewed the report; Elizabeth Schwinn edited it; and Casey Labrack designed the cover and prepared the report. This report is available on CBO’s website (www.cbo.gov/publication/53003).
Keith Hall Director August 2017