Optimizing Whole-Page Presentation for Web Searchraywang/pub/TWEB17-whole-page.pdf39 Optimizing...
25
39 Optimizing Whole-Page Presentation for Web Search YUE WANG, University of Michigan, USA DAWEI YIN, Data Science Lab, JD.com, China LUO JIE, Snap Inc., USA PENGYUAN WANG, University of Georgia, USA MAKOTO YAMADA, RIKEN AIP Center, Japan YI CHANG, Huawei Research America, USA QIAOZHU MEI, University of Michigan, USA Modern search engines aggregate results from different verticals: webpages, news, images, video, shopping, knowledge cards, local maps, etc. Unlike “ten blue links”, these search results are heterogeneous in nature and not even arranged in a list on the page. This revolution directly challenges the conventional “ranked list” formulation in ad hoc search. Therefore, finding proper presentation for a gallery of heterogeneous results is critical for modern search engines. We propose a novel framework that learns the optimal page presentation to render heterogeneous results onto search result page (SERP). Page presentation is broadly defined as the strategy to present a set of items on SERP, much more expressive than a ranked list. It can specify item positions, image sizes, text fonts, and any other styles as long as variations are within business and design constraints. The learned presentation is content-aware, i.e. tailored to specific queries and returned results. Simulation experiments show that the framework automatically learns eye-catchy presentations for relevant results. Experiments on real data show that simple instantiations of the framework already outperform leading algorithm in federated search result presentation. It means the framework can learn its own result presentation strategy purely from data, without even knowing the “probability ranking principle”. CCS Concepts: • Information systems → Combination, fusion and federated search; Presentation of retrieval results;• Computing methodologies → Learning to rank; Reinforcement learning; Additional Key Words and Phrases: Whole-page optimization, page presentation, user satisfaction ACM Reference Format: Yue Wang, Dawei Yin, Luo Jie, Pengyuan Wang, Makoto Yamada, Yi Chang, and Qiaozhu Mei. 2017. Optimizing Whole-Page Presentation for Web Search. ACM Trans. Web 9, 4, Article 39 (October 2017), 25 pages. https: //doi.org/0000001.0000001 Authors’ addresses: Yue Wang, University of Michigan, Department of Electrical Engineering and Computer Science, 105 South State St. Ann Arbor, MI, 48109, USA, [email protected]; Dawei Yin, Data Science Lab, JD.com, 8 Beichen West Rd. Beijing, 100105, China, [email protected]; Luo Jie, Snap Inc. 64 Market St. Venice, CA, 90291, USA, [email protected]; Pengyuan Wang, University of Georgia, Department of Marketing, 630 South Lumpkin St. Athens, GA, 30602, USA, [email protected]; Makoto Yamada, RIKEN AIP Center, Mitsui Building, 15th floor, 1-4-1 Nihonbashi, Tokyo, 103-0027, Japan, [email protected]; Yi Chang, Huawei Research America, Santa Clara, CA, USA, [email protected]; Qiaozhu Mei, University of Michigan, School of Information, 105 South State St. Ann Arbor, MI, 48109, USA. Permission to make digital or hard copies of all or part of this work for personal or classroom use is granted without fee provided that copies are not made or distributed for profit or commercial advantage and that copies bear this notice and the full citation on the first page. Copyrights for components of this work owned by others than the author(s) must be honored. Abstracting with credit is permitted. To copy otherwise, or republish, to post on servers or to redistribute to lists, requires prior specific permission and/or a fee. Request permissions from [email protected]. © 2017 Copyright held by the owner/author(s). Publication rights licensed to Association for Computing Machinery. 1559-1131/2017/10-ART39 $15.00 https://doi.org/0000001.0000001 ACM Transactions on the Web, Vol. 9, No. 4, Article 39. Publication date: October 2017.
Transcript of Optimizing Whole-Page Presentation for Web Searchraywang/pub/TWEB17-whole-page.pdf39 Optimizing...

39
Optimizing Whole-Page Presentation for Web Search
YUE WANG, University of Michigan, USA
DAWEI YIN, Data Science Lab, JD.com, China
LUO JIE, Snap Inc., USA
PENGYUAN WANG, University of Georgia, USA
MAKOTO YAMADA, RIKEN AIP Center, Japan
YI CHANG, Huawei Research America, USA
QIAOZHU MEI, University of Michigan, USA
Modern search engines aggregate results from different verticals: webpages, news, images, video, shopping,
knowledge cards, local maps, etc. Unlike “ten blue links”, these search results are heterogeneous in nature
and not even arranged in a list on the page. This revolution directly challenges the conventional “ranked list”
formulation in ad hoc search. Therefore, finding proper presentation for a gallery of heterogeneous results is
critical for modern search engines.
We propose a novel framework that learns the optimal page presentation to render heterogeneous results
onto search result page (SERP). Page presentation is broadly defined as the strategy to present a set of items
on SERP, much more expressive than a ranked list. It can specify item positions, image sizes, text fonts, and
any other styles as long as variations are within business and design constraints. The learned presentation is
content-aware, i.e. tailored to specific queries and returned results. Simulation experiments show that the
framework automatically learns eye-catchy presentations for relevant results. Experiments on real data show
that simple instantiations of the framework already outperform leading algorithm in federated search result
presentation. It means the framework can learn its own result presentation strategy purely from data, without
even knowing the “probability ranking principle”.
CCS Concepts: • Information systems→ Combination, fusion and federated search; Presentation ofretrieval results; • Computing methodologies→ Learning to rank; Reinforcement learning;
Additional Key Words and Phrases: Whole-page optimization, page presentation, user satisfaction
ACM Reference Format:YueWang, Dawei Yin, Luo Jie, PengyuanWang, Makoto Yamada, Yi Chang, and Qiaozhu Mei. 2017. Optimizing
Whole-Page Presentation for Web Search. ACM Trans. Web 9, 4, Article 39 (October 2017), 25 pages. https:
//doi.org/0000001.0000001
Authors’ addresses: Yue Wang, University of Michigan, Department of Electrical Engineering and Computer Science, 105
South State St. Ann Arbor, MI, 48109, USA, [email protected]; Dawei Yin, Data Science Lab, JD.com, 8 Beichen West Rd.
Beijing, 100105, China, [email protected]; Luo Jie, Snap Inc. 64 Market St. Venice, CA, 90291, USA, [email protected];
Pengyuan Wang, University of Georgia, Department of Marketing, 630 South Lumpkin St. Athens, GA, 30602, USA,
[email protected]; Makoto Yamada, RIKEN AIP Center, Mitsui Building, 15th floor, 1-4-1 Nihonbashi, Tokyo, 103-0027,
Japan, [email protected]; Yi Chang, Huawei Research America, Santa Clara, CA, USA, [email protected]; Qiaozhu
Mei, University of Michigan, School of Information, 105 South State St. Ann Arbor, MI, 48109, USA.
Permission to make digital or hard copies of all or part of this work for personal or classroom use is granted without fee
provided that copies are not made or distributed for profit or commercial advantage and that copies bear this notice and the
full citation on the first page. Copyrights for components of this work owned by others than the author(s) must be honored.
Abstracting with credit is permitted. To copy otherwise, or republish, to post on servers or to redistribute to lists, requires
prior specific permission and/or a fee. Request permissions from [email protected].
© 2017 Copyright held by the owner/author(s). Publication rights licensed to Association for Computing Machinery.
1559-1131/2017/10-ART39 $15.00
https://doi.org/0000001.0000001
ACM Transactions on the Web, Vol. 9, No. 4, Article 39. Publication date: October 2017.

39:2 Y. Wang et al.
1 INTRODUCTIONA decade ago, search engines returned “ten blue links”. Result presentation was straightforward:
ranking webpages by estimated relevance. It naturally saves user effort as she scans down the list,
hopefully hitting the desired information at top ranks. This “probability ranking principle” was
long envisioned in the 1970s [54], and later confirmed by eye-tracking studies [27, 28] and search
log analysis [18, 34].
Today’s search engines return far richer results than “ten blue links”. Aside from webpages,
results can also include news, images, video, shopping, structured knowledge, and local business
maps. Each specific corpus is indexed by a vertical search engine; they are federated to serve
the user’s information need. Unlike “ten blue links”, vertical search results have different visual
appearance, layouts and sizes. They span across multiple columns on the page, not restricted in the
mainline list (Figure 1).
Ads
New
sIm
age
Web
Vid
eoK
nowledge card
Ads
Fig. 1. Yahoo search engine result page for the query “obama”. Accessed on July 12, 2015.
Federated search results have been transforming user interaction patterns on search result pages
(SERPs). Human eyeballs are spontaneously attracted by graphical results, causing a significant
attention bias known as the vertical bias [13, 38, 44]. More interestingly, blue links surrounding a
vertical result are also examined with increased probability [13]. In the presence of vertical results,
user satisfaction towards an entire SERP cannot be reliably inferred from preference judgments for
pairs of results [5].
ACM Transactions on the Web, Vol. 9, No. 4, Article 39. Publication date: October 2017.

Optimizing Whole-Page Presentation for Web Search 39:3
These observations indicate that users do not sequentially scan results returned by federated
search. Although the conventional “ranked list” formulation can still be used for federated search
result presentation [3, 4], it is essentially a first-order approximation of the problem.
In this paper, we propose a novel framework that learns the optimal presentation for heteroge-
neous search results on SERP. Page presentation is broadly defined as the strategy to present a set of
heterogeneous items on SERP, much more expressive than a ranked list. It can specify item positions,
image sizes, text fonts, or any other styles as long as changes of these elements are allowed by
business constraints1and page design templates. The goodness of a presentation is measured by
user satisfaction metric: better presentation will make the user happier. The framework first learns
a scoring function that maps search results and their presentation on SERP to user satisfaction
metric. Then, given search results of a new query, the framework computes a presentation that
maximizes user satisfaction.
The framework is quite general. First, practitioners can flexibly define the scope of page presen-
tation. It can encode item positions (both horizontal and vertical) as well as element styles, such as
image sizes and text fonts. It naturally encompasses ranked list as a special case. Second, different
application scenarios can adopt different user satisfaction metric. It is not limited to click-based
metric, but can also take other interactive behaviors into account, such as dwelling time and
time-to-first-click. Lastly, the framework can potentially be instantiated in other interactive search
scenarios, such as presenting search results on mobile and tablet devices, displaying multimedia
feeds in online social networks, and arranging items on retailing websites.
We conduct experiments on both synthetic and real data to demonstrate the potential power of
the proposed framework. Simulation experiments show that the framework can adapt to different
types of attention bias and learn to present relevant results to catch user’s eyeballs. This means
our approach directly targets the new challenge brought by federated search, where users may not
scan the results sequentially, and results are not in a ranked list. In real data experiments, simple
instantiations of the framework outperform the leading algorithm in federated search result ranking.
This is encouraging, because ranking algorithms use the probability ranking principle in its result
presentation, while our framework does not even know the existence of it. Nevertheless, it learnsits own result presentation principle purely from data and is able to deliver the state-of-the-art
performance.
Our main contribution is summarized as follows:
• We formulate a new problem, whole-page presentation optimization, which extends the homo-
geneous document ranking in ad hoc search (Section 2).
• We propose a solution framework that computes the optimal presentation for federated
search results (Section 3 and 4).
• Experiments on synthetic and real data demonstrate that the proposed framework is promising
in solving the new problem (Section 5 and 6).
• We reformulate the problem in reinforcement learning, which provides a unified perspective.
It not only explains the original approach as a special reinforcement learning algorithm, but
also inspires new policy-based approaches that are efficient at runtime (Section 7).
Part of the results were reported in our recent work at WSDM 2016 [64]. For those who have
read the conference version, this extension includes a case study following the real data experiment
(Section 6) and a comprehensive literature review of related topics (Section 8). The reinforcement
learning reformulation and policy learning approach (Section 7) are completely new.
1For example, sponsored results must be placed on the top.
ACM Transactions on the Web, Vol. 9, No. 4, Article 39. Publication date: October 2017.

39:4 Y. Wang et al.
2 PROBLEM FORMULATIONThe problem statement of page presentation optimization is as follows: “given search results to be
displayed on a page, to find the optimal presentation that maximizes user satisfaction”. We assume
the following setting: search engine returns a set of results upon receiving a query, and renders
the items on SERP according to some presentation strategy. As the SERP is shown to the user, she
interacts with it and get certain degree of satisfaction. Now let us define some important concepts
in our setting:
Definition 2.1 (Page Content). Page content is the set of search results to be displayed on a page.
Each search result is an item. Upon receiving user’s query, search engine backend returns a set of
k items. Each item is represented as a vector xi 2. Note that different users and different queries
will produce different sets of items, so xi also encodes information from actual users and queries.
Page content is represented as concatenation of k item vectors: x⊤ = (x⊤1, · · · , x⊤i , · · · , x
⊤k ). The
domain of x is defined by all possible page content returned by the backend, denoted as X.
Definition 2.2 (Page Presentation). Page presentation defines the way in which page content x is
displayed, such as position, vertical type, size, and color. It is encoded as a vector p. The domain
of p is defined by all possible page presentations permitted by business and design constraints,
denoted as P.
Definition 2.3 (Search Result Page (SERP)). When page content x is put on page according to
presentation strategy p, a search result page (SERP) is generated. In other words, content x and
presentation p uniquely determine a SERP. It is represented as a tuple (x, p) ∈ X × P.
Definition 2.4 (User Response). User response includes her actions on SERP, such as number of
clicks, positions of clicks, dwell time of clicks, and time to first click. This information is encoded
in a vector y. The domain of y is defined by all possible user responses, denoted as Y .
Definition 2.5 (User Satisfaction). The user experiences certain degree of satisfaction as she
interacts with the SERP. We assume that user satisfaction can be calibrated as a real value v ∈ R:larger value of v means higher satisfaction.
The user response is a strong indicator for satisfaction. Intuitively, if a user opened the SERP,
clicked on the top result right away, then spent long time dwelling on that result, she was highly
likely to be happy with the result. With definitions above, we formulate our problem:
Page Presentation Optimization is to find the presentation p ∈ P for a given page content
x ∈ X, such that when the SERP (x, p) is presented to the user, her satisfaction scorev is maximized.
If we define a scoring function F : X × P → R that maps a SERP (x, p) to a user satisfaction
score v , then page presentation optimization problem can be formally written as ∀x ∈ X,
max
p∈PF (x, p) . (1)
The problem of page presentation optimization is both new and challenging. It is new because
page presentation can be flexibly defined, which opens up possibility to learn brand-new ways to
display information. Retrieval and recommender systems typically use a ranked list for displaying
homogeneous content. As heterogeneous results are weaved onto webpages, it is critical to present
them in a proper manner to maximize user’s utility. The problem is challenging because it is rather
unclear how to find the scoring function that maps the entire SERP (content and presentation) to
user satisfaction. We propose our solution framework in the next section.
2Throughout the paper we use bold lowercase letters for column vectors.
ACM Transactions on the Web, Vol. 9, No. 4, Article 39. Publication date: October 2017.

Optimizing Whole-Page Presentation for Web Search 39:5
3 PRESENTATION OPTIMIZATION FRAMEWORKIn this section, we propose to solve page presentation optimization using a supervised learning
approach. We set up a general framework, including data collection methodology, design of scoring
function F (·, ·), the learning and optimization stages. In the next section, we describe actual
instantiations of the framework.
3.1 Data Collection Through ExplorationSupervised machine learning needs labelled training data. The caveat in data collection here is that
normal search traffic cannot be used as the training data to learn the scoring function F (x, p). Thisis because in normal search traffic, search engine has a deterministic policy to present page content
x, which is controlled by existing model/rules within the system. In other words, page presentation
p is uniquely determined given page content x. However, we expect the model F to tell us user
satisfaction as we search through different page presentations. Confounding between x and p will
bias the learned model, which will be a serious problem.
To eliminate confounding, we allocate “presentation exploration bucket” to do randomized
experiments. For each request in the bucket, we organize page content with random page presenta-
tion. Here “random” means to uniformly draw presentation strategies within business and design
constraints, such that user experience is not hurt too much. Further, the presentation exploration
traffic is controlled within a very small amount so as not to affect overall quality of the search
service. Data collected in this way allow unbiased estimation of the scoring function.
In cases that showing random exploration results to the users is not desired, it would also be
possible to either hire human annotators to label the page, or collect data from multiple buckets
with different fixed presentation strategy as every Internet company is doing for testing their UI
changes. Since we have already developed a good data collection through exploration framework
in our production system, we choose to take this approach for data collection.
3.2 Learning StageThe core of page presentation optimization is to estimate the scoring function v = F (x, p). We
might consider two approaches:
(I) Direct approach: Collect page-wise user satisfaction ratings and directly model the depen-
dency between SERP and user satisfaction. The dependency path is “(x, p) −v”.(II) Factorized approach: First predict user response y on SERP, then find a function that
measure user satisfaction from these responses. The dependency path is “(x, p) − y −v”.Approach (I) is straightforward. However it is very difficult, particularly at a large scale, to obtain
explicit user rating s towards the entire SERP. To construct such data set, we would have needed
substantial amount of observations and human annotation to overcome training data sparseness.
Approach (II) takes two steps. The first step is to predict user responses on a given page; the second
step is to measure user satisfaction based on her page-wise response. Introducing user response
variable y permits a separation of concerns. On the one hand, user response on a page is a direct
consequence of interacting with the page. On the other hand, user satisfaction is typically estimated
from user responses only, e.g. using total number of clicks, or long dwell time. In Approach (II), the
complex dependency in F (·, ·) is decomposed into two relatively independent factors. Furthermore,
on a practical note, Approach (II) is more realistic for current Web technology because user response
on SERP can be easily collected via Javascript, whereas explicitly asking the users to evaluate the
whole page is very uncommon. Therefore, we adopt the factorized approach.In factorized approach, the first step is to learn a user response model
y = f (x, p), ∀ x ∈ X, p ∈ P .
ACM Transactions on the Web, Vol. 9, No. 4, Article 39. Publication date: October 2017.

39:6 Y. Wang et al.
This is a supervised learning task; the actual form of f (x, p) can be chosen flexibly. We can simply
build one model for each component yi in y, or we can jointly predict all components of y using
structured output prediction [9]. In any case, user’s responses on the page depends on both the
content (whether it is relevant, diverse, or attractive) and the presentation (whether it is close to
the top, around a graphical block, or shown in big size).
The second step is a utility funciton which defines a user satisfaction metric
v = д(y),∀ y ∈ Y .
Finding the right user satisfaction metric based on page-wise user responses is not the focus
of this paper, and can itself be a substantial research topic in interactive information systems
[30, 43, 56]. Indeed, practitioners often heuristically define the metric as aggregation of fine-grained
user responses, such as click-through rates, long-dwell-time clicks, time-to-first-click.
Finally, our scoring function for the entire SERP is
v = F (x, p) = (д ◦ f ) (x, p) = д( f (x, p)).
3.3 Optimization StageWe compute the optimal presentation p∗ given content x by solving the following optimization
problem:
max
p∈Pд( f (x, p)) .
Computational cost of this optimization problem depends on actual form of the objective function
F = д ◦ f and the constraints on presentation p. In the next section we show that for certain instan-
tiations of f and д, p∗ can be computed quite efficiently. In Section 7, we present a reinforcement
learning solution where the optimization stage is replaced by a policy.
4 INSTANTIATIONS OF PRESENTATION OPTIMIZATION FRAMEWORKThis section describes instantiations of the framework, including feature representation, user
satisfaction metric, two user response models and their learning and optimization stages. We
conclude this section by showing that the framework encompasses learning to rank.
4.1 FeaturesBoth content and presentation on a SERP are represented in a feature vector, which will be the
input to user response models.
4.1.1 Content Features. Content features contain information of the query and corresponding
search results, similar to those used in learning to rank. We adopt the same content features as
used in [32] to facilitate direct comparison in experiments (Section 6):
• Global result set features: features derived from all returned results. They indicate the
content availability of each vertical.
• Query features: lexical features such as the query unigrams, bigrams and co-occurrence
statistics. We also use outputs of query classifiers, and historical session based query features,
etc.
• Corpus level features: query-independent features derived for each vertical and web docu-
ment such as historical click-through rates, user preferences, etc.
• Search result features: extracted from each search result. A list of statistical summary
features such as relevance scores and ranking features of individual results. For some verticals,
we also extract some domain specific meta features, such as if the movie is on-screen and
ACM Transactions on the Web, Vol. 9, No. 4, Article 39. Publication date: October 2017.

Optimizing Whole-Page Presentation for Web Search 39:7
if the movie poster is available in the movie vertical, and the number of hits for the news
articles from the news vertical in the last few hours.
4.1.2 Presentation Features. Presentation features encode the way in which search results are
displayed on SERP, which are novel features in our framework. Concrete examples include:
• Binary indicators: whether to show an item on a position. The scheme can encode positions
in a wire-frame, such as a list or multi-column panels. Let there be k positions in the frame,
and k items to be displayed. Let i be the index of items, j be the index of positions, 1 ≤ i, j ≤ k .The presentation of item i , pi , is a 1-of-k binary encoding vector. If document i is placedat position j, then the j-th component of pi is 1 and all others are 0. In this case we denote
the value of pi as pi j = 1. The page presentation p⊤ = (p⊤1, · · · , p⊤k ) consists of k × k binary
indicator variables, essentially encoding the permutation of k objects.
• Categorical features: discrete properties of page items, e.g., multimedia type of an item
(shown as text or image), typeface of a textual item;
• Numerical features: continuous properties of page items, e.g. brightness and contrast of a
graphical item.
• Other features: e.g. certain interactions between page content and presentation may affect
user response, such as “a textual item immediately above a graphical item”.
We use two types of presentation features in real data experiments. We encode positions of items
with binary indicators. For the local search results, we encode presentation size as a categorical
feature (“single” vs. “multiple” entries).
4.2 User Satisfaction MetricWe assume that user satisfaction metric д(y) is in the form of weighted sum of components in y:
д(y) = c⊤y.
In experiments, we use the click-skip metric for k items [32]:
д(y) =k∑i=1
yi ,
where yi = 1 if item i is clicked, and yi = −1 if item i is skipped and some item below is clicked.
A skip often indicates wasted inspection, so we set it to be a unit of negative utility. This metric
strongly prefers adjacent clicks at top positions.
4.3 User Response ModelsWe use two models for predicting page-wise user response. The first model takes as features qua-
dratic interaction between content and presentation. It permits an efficient optimization stage. The
second model uses gradient boosted decision trees to capture more complex, nonlinear interaction
between content and presentation. We expect it to generate improved performance.
4.3.1 Quadratic Feature Model. First, let us consider a simple instantiation of user response
model that has efficient solution in the optimization stage. Since it uses quadratic interaction
features between x and p, we call it Quadratic Feature Model.Assume there are k positions for k items. Page content x is the concatenation of k item vectors;
page presentation is encoded using binary indicators, p ∈ {0, 1}k×k , as defined in Section 4.1. The
model also contains fully interaction between x and p as features. Let vec(A) denote the row vector
containing all elements in matrix A, taken column by column, left to right. The augmented feature
ACM Transactions on the Web, Vol. 9, No. 4, Article 39. Publication date: October 2017.

39:8 Y. Wang et al.
vector ϕ for Quadratic Feature Model is:
ϕ⊤ = (x⊤, p⊤, vec(xp⊤)).
Let y ∈ Rk be the user response vector; each component yi is a user response (e.g. click or skip)
on item i . A linear model fi is used to predict each yi in y:
yi = fi (ϕ) = w⊤i ϕ = u⊤i x + v⊤i p + x
⊤Qip. (2)
ui , vi , and Qi are coefficients for content-only, presentation-only, and content-presentation qua-
dratic interaction features, respectively. The coefficients wi = {ui , vi ,Qi } can be estimated using
regularized linear regression. To avoid overfitting, we regularize the L2 norm of ui and vi , andfurther impose low-rank regularization on Qi to handle the sparsity issue of quadratic features.
In total, we will have k such models, each predicting one yi in y. To group the k models in
notation, let us write coefficients as U = (u1, · · · , uk )⊤,V = (v1, · · · , vk )⊤,Q = diag(Q1, · · · ,Qk ),and “copy” x and p k times to get the matrixX = diag(x⊤, · · · , x⊤) and the vector t⊤ = (p⊤, · · · , p⊤).To clarify dimensionality, if x ∈ Rn , p ∈ Rm , then U ∈ Rk×n , V ∈ Rk×m , X ∈ Rk×nk , Q ∈ Rnk×mk
,
and t ∈ Rmk. The user response model can be written as
y = f (x, p) = Ux + Vp + XQt.
Denote user satisfaction metric as д(y) = c⊤y. Then the scoring function F = д ◦ f is
F (x, p) = д( f (x, p))
= c⊤Ux + c⊤Vp + c⊤XQt
= c⊤Ux + a⊤p (3)
where a = V⊤c +∑k
i=1ciQ⊤i x is a known vector.
To this end, the optimization stage is to find the p that maximizes (3) subject to the constraints
on p. Since page content x is given, the first term in (3) is a constant and can be dropped. The
second term a⊤p is a linear term of p. Since p ∈ {0, 1}k×k encodes a k-permutation, Each component
in a ∈ Rk×k represents the gain of user satisfaction if item i is placed in position j, 1 ≤ i, j ≤ k .Therefore, the optimization problem reduces tomaximum bipartite matching, a special case of linearassignment problem. It can be efficiently solved by Hungarian algorithm [37] with time complexity
O ( |p|3) = O (k6). On a single-core computer with 2GHz CPU, the problem can be solved within 10
milliseconds for k = 50 items.
4.3.2 Gradient Boosted Decision Tree Model. In order to capture more complex, nonlinear
interaction between content x and presentation p, we replace the quadratic feature model fi inprevious section with a gradient boosted decision trees model hGBDTi . Gradient boosted decision
trees (GBDT) is a very effective method for learning nonlinear functions [26].
Our feature vector is
ϕ⊤ = (x⊤, p⊤),and each user response yi in y is predicted by a GBDT model:
yi = hGBDT
i (x, p).
The user satisfaction metric is д(y) = c⊤y =∑k
i=1ciyi .
In optimization stage, since each hi is now a nonparametric model, we cannot get the analytical
form of F (x, p) =∑k
i=1cih
GBDT
i (x, p) in terms of p. That is, the optimization over p is intractable.
Nevertheless, in realistic settings, the search space of p is usually pruned down to tens of possible
values by business and design constraints. We implement parallel enumeration to quickly find the
optimal presentation that maximizes user satisfaction.
ACM Transactions on the Web, Vol. 9, No. 4, Article 39. Publication date: October 2017.
Optimizing Whole-Page Presentation for Web Search 39:9
4.4 Special Case: Learning to RankWhen we restrict page presentation to be a ranked list, and assume that users are more satisfied
if more relevant results are placed at top ranks, then presentation optimization reduces to the
traditional ranking problem. We point out this connection to demonstrate the generality of the
proposed framework.
The instantiation is as follows. We use binary indicators in Section 4.1.2 to represent the ranked
list. Let user response y decompose into k components, each representing the user’s utility of
seeing result i at rank ji . Let user response model f (x, p) decompose into k real-valued component,
each only taking as input xi and its rank ji . So we have
f (x, p) = f (x1, · · · , xk , p1, · · · , pk )
= ( f1 (x1, p1), · · · , fk (xk , pk ))⊤
=(f1 (x1,p1j1 = 1), · · · , fk (xk ,pk jk = 1)
)⊤. (4)
Typically, the ranking function h(xi ) of result i is position-independent. It can also be interpreted
as the score of result i seen on the top rank (ji = 1). That means
h(xi ) = fi (xi ,pi1 = 1).
Furthermore, traditional ranking problem assumes that the utility of a result is discounted by
a factor w j if it is ranked at position j. w j > 0 is a decreasing function of j. E.g. in discounted
cumulative gain (DCG),
w j =1
log2(1 + j )
.
The discounting assumption implies:
fi (xi ,pi j = 1) = w j fi (xi ,pi1 = 1)
= w jh(xi ). (5)
Combining (4) and (5), user response model is realized as
f (x, p) =(w j1h(x1), · · · ,w jkh(xk )
)⊤,
where h(·) is the ranking function. User satisfaction is measured by the quality of ranked list, which
accumulate the gain at each position:
д(y) =k∑i=1
yi =k∑i=1
w jih(xi ).
Clearly, maximum user satisfaction д(y) is always achieved by sorting the results by descendingrelevance scores. This is the default presentation strategy of learning to rank.
5 SIMULATION STUDYWe demonstrate potential capability of presentation optimization framework by simulation. We
use synthetic dataset so that we know the “ground truth” mechanism to maximize user satisfaction,
and we can easily check whether the algorithm can indeed learn the optimal page presentation to
maximize user satisfaction. We have two goals in this study:
(1) We show that the framework enables general definition of page presentation.
(2) We use both position bias and item-specific bias to show that the framework can automatically
adapt to user interaction habits.
ACM Transactions on the Web, Vol. 9, No. 4, Article 39. Publication date: October 2017.

39:10 Y. Wang et al.
5.1 OverviewWe first give a brief overview of simulation workflow. The simulated “presentation exploration
bucket” will generate a page containing a set items with random presentation. Every time a new
page is generated, each item is assigned some amount of reward (e.g. relevant information) drawn
from an underlying distribution. The simulated “user” will have a certain type of attention bias: (1)
position bias, in which more attention is paid to certain region of the page than elsewhere (Figure
2a); (2) vertical bias, or item-specific bias, in which more attention is attracted by a specific type of
item and its surrounding area (Figure 2b).
(a) Position bias [50] (b) Vertical bias [63]
Fig. 2. Different types of user attention bias.
An “interaction” happens when the “presentation exploration bucket” generates a page and
the “user” examines it with attention bias. When the user examines an item, she receives the
corresponding reward. User satisfaction towards the page is the sum of rewards. The page content,
presentation, as well as the examined items and positions (user responses), become data that the
framework learns from. Finally, we test if the framework successfully learned user’s attention bias.
Given a new set of items, we expect to see that the framework will place items with higher rewards
to positions with more concentrated attention to achieve maximum user satisfaction. Therefore,
to visualize the model’s current belief in user attention bias, we can plot the distribution of item
rewards on the page.
5.2 Data Generating ProcessOn the “search engine” side, a page (either 1-D list or 2-D grid) contains k positions. The page
content x = (x1, · · · ,xk )⊤, xi ∼ N (µi ,σ ) represents intrinsic rewards of k items. We set k = 10 for
1-D list and k = 7 × 7 for 2-D grid. µi ’s are random numbers drawn from in [0, 1], σ = 0.1. Thepage presentation p is drawn from length-k permutations uniformly at random. The whole page is
represented as (x, p).On the “user” side, attention bias is simulated as follows:
Position bias: whether to examine position j is a Bernoulli random variable with parameter pj .A real-life example is the top-down position bias, commonly observed when the user interacts with
a ranked list.
Item-specific bias: whether to examine item i is a Bernoulli random variable with parameter
pi . A real-life example is the vertical bias, commonly observed when the user interacts with a page
that contains vertical search results (images, videos, maps, etc).
Then, the “user” will “interact” with the page (x, p): k binary values are drawn from k Bernoulli
distributions, and recorded as a user response vector y ∈ {0, 1}k . if item i is examined, yi = 1, the
user receives a reward xi . The user satisfaction equals the sum of reward of examined items. We
generate 100,000 pages to train the Quadratic Feature Model described in Section 4.3.
ACM Transactions on the Web, Vol. 9, No. 4, Article 39. Publication date: October 2017.

Optimizing Whole-Page Presentation for Web Search 39:11
5.3 Results and DiscussionTo visualize the learned optimal presentation, we pick a random x and compute the corresponding
optimal presentation p∗, then arrange the xi ’s according to p∗. A page is visualized as a heat map
of xi ’s rewards. Ideally, the items with higher reward (“better content”) should be placed onto the
position with higher probability of user attention.
Figure 3, 4, and 5 visualize the presentation results under various position biases. We can see
that the algorithm indeed learns to put “better content” to positions with more user attention.
Because the definition of page presentation is general, it is able to handle both 1-D list and 2-D
grid. Furthermore, it can capture complicated distribution of position bias on a 2-D canvas: the
top-left position bias in Figure 4, and the top-bottom position bias in Figure 5.
1
2
3
4
5
6
7
8
9
(a) Position bias
(b) Ideal
presentation
0.0
0.5
1.0
(c) Learned
presentation
Fig. 3. Top position bias and presentation on 1-D list.
(a) Position bias (b) Ideal
presentation
0.0
0.5
1.0
(c) Learned
presentation
Fig. 4. Top-left position bias and presentation on 2-D canvas.
(a) Position bias (b) Ideal
presentation
0.0
0.5
1.0
(c) Learned
presentation
Fig. 5. Two-end position bias and presentation on 2-D canvas.
Figure 6 visualizes the result under item-specific bias. This is an interesting case where an item
on the page is very eye-catchy, and it also attracts user’s attention to its surrounding items (e.g., an
image attracts user’s eyeballs on itself as well as its caption and description text). Also, suppose
that for items farther away from that eye-catchy item, the user’s attention drops further down.
Then the optimal presentation strategy is to place the item on the center of the page, so that the
whole page delivers the most reward. In Figure 6, we see that user satisfaction value r is highestwhen the item (the dark red region) is centered on the page.
ACM Transactions on the Web, Vol. 9, No. 4, Article 39. Publication date: October 2017.

39:12 Y. Wang et al.
(a) v̂ = 4.07 (b) v̂ = 4.92
0.1
0.5
0.9
(c) v̂ = 5.41
Fig. 6. Item-specific bias. v̂ : estimated user satisfaction by the quadratic feature model. When a specific
item (e.g. image) attracts user attention to not only itself but also its surrounding results, then the page-wise
reward is highest when the vertical is placed at the center of the page.
6 REAL DATA EXPERIMENTSWe demonstrate the effectiveness of page presentation optimization framework by conducting
experiments on the real-world data set collected via a commercial search engine.
6.1 Data CollectionWe use a very small fraction of search traffic as the presentation exploration buckets. The data was
collected through the year 2013. Vertical search results whose presentation are explored include
news, shopping, and local listings. In the exploration buckets, the order of Web results are kept
untouched and verticals are randomly slotted into allowed positions with uniform probability.
Randomly generated SERPs are not influenced by any ranking algorithm in the system. As pointed
out in Section 3.1, this is required to eliminate page content confounding when training models.
The exploration SERP is then presented to the user who interacts with it in a normal fashion. Users
response on the SERP, along with page-wise content information like the query, document features
from backends, are logged.
6.2 MethodsWe use two pointwise ranking models as baseline method. They are trained using the content
features as described in Section 4.1. The first baseline method has been adopted in production
(Logit-Rank) [32]. It estimates a logistic regression model for each vertical result (including web
result):
yi = σ (w⊤i xi ),
where yi is a binary target variable that indicates whether the result is clicked (yi = +1) or skipped
(yi = −1) as described in Section 4.2, and σ (·) is the sigmoid link function rescaled to [−1, 1].
The second baseline method uses gradient boosted decision trees to learn a pointwise ranking
function (Gbdt-Rank). This is essentially replacing the logistic regressor in Logit-Rank with a
GBDT regressor:
yi = hGBDT
i (xi ).
We evaluate the two instantiations of presentation optimization framework described in Section
4.3: the Quadratic Feature Model (Quad-Pres) and the GBDT Model (Gbdt-Pres). They use page-
wise information (x, p) to predict the user response vector, i.e. the vector of clicks and skips.
In implementation, we use Vowpal Wabbit [39] to learn logistic regression models, and XGBoost
[14] to learn the gradient boosted decision tree models. The hyperparameters of the models are
tuned on a small holdout data set.
ACM Transactions on the Web, Vol. 9, No. 4, Article 39. Publication date: October 2017.

Optimizing Whole-Page Presentation for Web Search 39:13
Table 1. Match rate between random exploration presentation p and predicted optimal presentation p∗.“Until Web1 ” means that p and p∗ encode the same presentation above the 1st webpage result.
Until Web1 UntilWeb2 Until Web3
Logit-Rank 68.68% 46.76% 30.85%
Quad-Pres 71.63% 50.68% 33.42%
6.3 EvaluationWe use half of the exploration SERP as training set (January – June), the rest as test set. It contains
hundreds of millions of pageviews and was collected from real search traffic. Compared to standard
supervised learning setup, it is difficult to do an unbiased offline performance evaluation because
of the interactive nature of the task (see Section 4.3 in [32]). This is because the offline data
(x(n), p(n), y(n) ) is collected using a particular logging policy, so we only observe user response
y(n) for a specific page presentation p(n) . In offline evaluation, when the algorithm is given page
content x(n) , it may output a presentation p∗(n) , p(n) , for which we do not observe user response,
hence cannot evaluate its goodness. To address this problem, we use an offline policy evaluation
method proposed by Li et al. [40] for evaluating online recommendation systems. It is simple
to implement and provides an unbiased performance estimate, thanks to data collected through
random exploration. Given a stream of events (x(n), p(n), Pr(p(n) ), y(n) ) collected through random
exploration, where Pr(p(n) ) is the probability for the SERP (x(n), p(n) ) to be generated from uniform
random exploration, the average user satisfaction for N offline events can be computed as
s̄ =1
N
N∑n=1
д(y(n) )1{p∗(n )==p(n ) }Pr(p(n) )
,
where 1{ · } is the indicator function, and д(y(n) ) is user satisfaction towards SERP n. This means
the algorithm is evaluated on those exploration SERPs whose presentation matches what is chosenby the algorithm; otherwise the SERP is discarded in offline evaluation.
As the match goes deeper down the page, the match rate decreases (Table 1). If we require exactmatch between predicted p∗(n) and actual p(n) , a large fraction of test set will be discarded and the
performance estimates tend to have large variance hence unreliable. Our evaluation only focuses on
vertical results shown above the first, second, and third webpage result. Note that the first webpage
result is not always on top rank; the top rank is frequently occupied by the vertical results.
6.4 Results and DiscussionTable 2 shows the average page-wise user satisfaction. It is encouraging to see that whole-page
optimization methods outperform ranking methods, because ranking methods utilize probability
ranking principle to rank results by relevance, which assumes a top-down position bias.Quad-Pres
and Gbdt-Pres do not make this assumption, but learns its own result presentation principle purely
from data. The reason that GBDT models work better than logistic regression models, mainly
because logistic regression assumes linear decision boundary, while GBDT is capable of modeling
nonlinear decision boundary.
Note that in our definition of user satisfaction metric д(y), a skip causes negative utility (yi = −1).
The fact thatQuad-Pres andGbdt-Pres generally work better than the baseline methods is because
they take into consideration the retrieved items, the page presentation, and their interaction on the
entire SERP, not just a single result. The presentation-blind models Logit-Rank and Gbdt-Rank
always want to put on top the results that will most probably gets clicked. However, for certain
queries people might intentionally skip the graphical results (e.g., when shopping ads are shown
ACM Transactions on the Web, Vol. 9, No. 4, Article 39. Publication date: October 2017.

39:14 Y. Wang et al.
Table 2. Average user satisfaction (×10−3).
Until Web1 Until Web2 Until Web3
Logit-Rank -0.25 1.79 1.89
Gbdt-Rank 2.18 3.68 2.22
Quad-Pres 0.62 6.39 5.37
Gbdt-Pres 2.68 6.72 8.24
but the search intent is in fact informational). In such cases, a click tends to happen below the top
rank. In contrast, presentation optimization methods will consider both the result and its position
on the page. That leads to more sensible arrangement of results. We see that Gbdt-Pres attracts
more clicks and has less skips when we evaluate deeper down the SERP.
Table 3. CTR, match untilWeb1
News Shopping S. Local M. Local
Coverage 0.46% 0.02% 0.02% 0.71%
Logit-Rank 21.05% 40.79% 11.58% 30.02%
Gbdt-Rank 23.28% 53.32% 38.26% 52.27%
Quad-Pres 21.97% 49.85% 47.16% 39.93%
Gbdt-Pres 22.34% 46.15% 48.12% 49.18%
Table 4. CTR, match untilWeb2
News Shopping S. Local M. Local
Coverage 2.0% 0.11% 0.03% 2.3%
Logit-Rank 16.44% 23.71% 18.51% 8.92%
Gbdt-Rank 16.31% 30.39% 36.73% 23.11%
Quad-Pres 14.78% 13.57% 23.39% 27.53%
Gbdt-Pres 16.21% 40.83% 33.18% 35.23%
Table 5. CTR, match untilWeb3
News Shopping S. Local M. Local
Coverage 3.8% 0.18% 0.11% 3.4%
Logit-Rank 14.52% 21.48% 13.80% 9.65%
Gbdt-Rank 12.51% 42.96% 24.93% 22.42%
Quad-Pres 11.45% 12.88% 15.47% 24.38%
Gbdt-Pres 14.11% 36.00% 24.72% 30.66%
Table 3, 4, and 5 shows the click-through rate (CTR) above Web1, Web2, and Web3, respectively.
“S. Local” means a single entry of local business result (such as restaurants); “M. Local” means
multiple entries of local business results. They are the same vertical/genre results presented in
different sizes. In terms of CTR, ranking methods have very strong performance because they
are directly optimized for high CTR. However, whole-page optimization methods still achieve
competitive or sometimes better CTR by taking into account page-wise information.
ACM Transactions on the Web, Vol. 9, No. 4, Article 39. Publication date: October 2017.

Optimizing Whole-Page Presentation for Web Search 39:15
It is interesting to see that for News vertical, there is not much help to know about other results
on the SERP, neither their presentation. In contrast, knowing page-wise results helps improve the
CTR of top-ranked local listings by a large margin. A possible explanation is that news, more like
general webpages, contain rich text information and their content relevance can be readily modeled
by standard ranking functions. On the other hand, local listings are in drastically different nature
compared to webpages and news, therefore knowing the complementary information from other
webpage results helps predicting the click/skip patterns. We can also observe small improvements
in CTR of the shopping results. Since the shopping results shown on the top are most likely to be
skipped, the algorithm learns to become extremely conservative in showing shopping verticals on
top. This leads to a much smaller coverage of shopping results in the entire traffic.
As the match goes deeper down the page, the local ranking algorithms show decreased per-
formance in terms of CTR. This is because the local ranking methods tend to greedily put the
high CTR items on top of the page, but ignores the content on the entire page. In contrast, the
page presentation algorithms, especially Gbdt-Pres, still get good CTR on News and Multi-local
verticals, which takes larger coverage. This is attributed to the fact that they model user response
over the entire page.
Figure 7 shows a real case where Gbdt-Pres disagreed with Gbdt-Rank (the algorithm then used
in production) in serving a local search query. In this case, the user was searching for “drinks nearColumbus circle”. At the time of this study, the Yahoo search engine ranked local vertical results
on the top, as shown in the screenshot. Columbus circle is a place in Manhattan, New York. The
two vertical results, however, were not in Manhattan: one is in Brooklyn, New York, and the other
is in the State of Connecticut. Our algorithm Gbdt-Pres recommended to put the webpage result
on top, which was indeed more relevant than the local listings. The page presentation algorithm
made a better decision here because it was able to consider all candidate results on the SERP and
weigh the benefits and risks of putting one on top of others.
recomm
ended by GB
DT-P
RE
S
Fig. 7. Screenshot of the Yahoo search result page for the query “drinks near Columbus circle”. Accessed
early February, 2016. The two local listings did not satisfy the information need. Our algorithm Gbdt-Pres
recommended that the webpage result should be ranked on top of local listings.
ACM Transactions on the Web, Vol. 9, No. 4, Article 39. Publication date: October 2017.

39:16 Y. Wang et al.
7 RUNTIME-EFFICIENT PAGE PRESENTATION POLICYIn this section, we provide a new perspective on the problem of page presentation optimization
through the lens of reinforcement learning. We show that the proposed approach in Section 3
is actually one of several possibilities for solving a reinforcement learning problem. Based on
the new formulation, we provide a policy learning approach that solves the same problem and
enjoys runtime efficiency. Finally, we demonstrate the effectiveness of the new approach through
simulation experiments.
7.1 Reinforcement Learning FormulationWe briefly introduce the general reinforcement learning setup, and then recast page presentation
optimization as a reinforcement learning problem.
In a general reinforcement learning setup, an agent acts in a stochastic environment by
sequentially choosing actions over a sequence of time steps, in order to maximize a cumulative
reward. It is formulated as a Markov decision process (MDP) with the following concepts.
(1) A state space S.(2) An action space A.
(3) An initial state distribution p (s0), and a state transition dynamics distribution p (st+1 |st ,at )satisfying the Markov property p (st+1 |s0,a0, · · · , st ,at ) = p (st+1 |st ,at ).
(4) A reward function r : S × A → R.(5) A policy selects actions in a given state: πθ : S → P (A), where P (A) is the set of probability
measures on A and θ ∈ Rm is a vector ofm parameters. πθ (a |s ) is the probability of taking
actiona in state s . A deterministic policy is a special casewhere an actiona satisfiesπθ (a |s ) = 1
in any state s .(6) The agent uses its policy to interact with the MDP to give a trajectory of states, actions, and
rewards, h0:T = s0,a0, r0, · · · , sT ,aT , rT over S × A × R. The cumulative discounted reward,
or the return, is Rγ =∑∞
t=0γ tr (st ,at ), where the discount factor γ ∈ [0, 1] determines the
present value of future rewards.
(7) The action-value functionQπ (s,a) = E[Rγ |s0 = s,a0 = a;π
]is the expected return of taking
action a in state s and then following policy π . Q∗ (s,a) = maxπ E[Rγ |s0 = s,a0 = a;π
]is
the optimal action-value function.
(8) The agent’s goal is to obtain a policy π which maximizes the expected return, denoted as
J (π ) = E[Rγ |π
].
In page presentation optimization, the agent is the algorithm that determines the presentation
of page content on a SERP for each incoming search query. Referring to the concepts and notations
in Section 2:
(1) The page content x of a query is the state, and the state space is X.
(2) The page presentation p is an action, and the action space is P.
(3) The initial state distribution p (x) is determined by the query distribution. As we do not model
sequential interactions between the search engine and the user, there is no state transition
dynamics.
(4) The reward function is the user satisfaction v on a given SERP, which we estimate by the
scoring function v = F (x, p). Each point in the state-action space X × P is a SERP.
(5) A policy selects a presentation strategy p given page content x. This is the page presentationoptimization problem we formulated in (1).
(6) Since there is no state transition, the return Rγ = v , the discount factor γ = 0, and the
effective time horizon T = 0.
ACM Transactions on the Web, Vol. 9, No. 4, Article 39. Publication date: October 2017.

Optimizing Whole-Page Presentation for Web Search 39:17
(7) Since the policy does not take effect after the initial time step, the action-value function is
equal to the reward function, Qπ (s,a) = F (x, p),∀π . Hence F (x, p) = Q∗ (s,a).(8) The expected return J (π ) = E [v |π ] = Ex∼p (x)
[Ep∼π (p |x) [F (x, p)]
]is the average user satis-
faction that the agent aims to maximize (the measurements in Table 2).
Therefore, the problem of page presentation optimization can be viewed as a reinforcement
learning problem. The approach in Section 3 is in fact a Q-learning method. It first learns the
optimal action-value function (in our case it coincides with the reward function/scoring function)
F (x, p) through supervised learning on exploration data. Then it derives a deterministic policy
by choosing the action that maximizes the optimal action-value function: π (p|x) = 1 if p solves
maxp∈P F (x, p), and π (p|x) = 0 otherwise.
A major drawback of this approach, as we have seen, is that it has to solve a combinatorial
optimization problem for each query at runtime, which could become intractable for complex
functional forms of F (·, ·). Fortunately, recasting the problem in reinforcement learning sheds new
lights on runtime-efficient solutions. Below we describe policy learning as one such solution.
7.2 Policy Learning for Page PresentationWe seek for a new page presentation algorithm that is (1) efficient at runtime, (2) sufficiently
expressive, i.e. capable of capturing sophisticated interactions between items on a page, and (3)
trained offline using data collected through the exploration buckets. These requirements are critical
for Web-scale online applications, because (1) runtime efficiency directly affects user experience,
(2) different items may have dependencies when they are laid out on a SERP, and (3) updating the
search algorithm offline reduces the risk of undesirable exploration behaviors.
A policy-based agent meets all the above requirements. The agent learns a policy πθ (a |s ) ratherthan a value function through experience. At runtime, it samples an action a from πθ (a |s ) givenstate s , without performing optimization in the action space. In reinforcement learning scenarios
where the action space is high-dimensional or continuous, policy-based agent is often employed.
In our problem setting, the agent learns a policy πθ (p|x) from the exploration data. For a search
presentation policy, it is more desirable to be deterministic than stochastic, because search engine
users would prefer the search service to be predictable and reliable. We can write a deterministic
policy as p = πθ (x). At runtime, given page content x, the policy outputs a page presentation pthat renders the content onto the page. To capture complex interactions between page contents,
πθ (·) can take nonlinear functional forms.
Now we describe the design and training of the presentation policy.
7.2.1 Policy function design. The policy πθ takes page content vector as the input and gives a
presentation vector as the output. The output vector should encode a permutation of k items in
x⊤ = (x⊤1, · · · , x⊤k ), along with other categorical and numerical properties (e.g. image sizes, font
types). Instead of asking πθ to directly output a k-permutation as a vector of k ×k binary indicators
(as in Section 4.1.2), we consider functions that implicitly outputs a k-permutation. At least two
approaches can be considered:
(1) Generalized ranking approach: πθ outputs a sorting score for each item, which defines an
order to arrange k items into k positions.
(2) Generalized sequence-to-sequence approach: πθ outputs a matching score for each item-
position pair, which entails a bipartite matching between k items and k positions.
Note that in both approaches, the k positions can take arbitrary layout, not restricted to a one-
dimensional list. Both approaches are viable if πθ jointly considers all items and their dependencies.
ACM Transactions on the Web, Vol. 9, No. 4, Article 39. Publication date: October 2017.
39:18 Y. Wang et al.
In this paper, we consider the generalized ranking approach. We will explore the generalized
sequence-to-sequence approach in our future work.
In the generalized ranking approach, each item i will have a sorting score fθ (̃xi ). The sortingscores are produced by the same function fθ . The feature vector x̃i is different for each item i andcontains the entire page content feature x. This can be achieved by prepending the dimensions
of item i to the front of x and then setting the original dimensions of item i to zero. That is,
x̃⊤i = (x⊤i , x⊤1, · · ·⊤ , x⊤i−1
, 0⊤, x⊤i+1, · · · , x⊤k ), for i = 1, · · · ,k . This allows the function fθ to consider
the entire page content but output a different score for each item. To capture complex interactions
between items, each fθ is a LambdaMART model (i.e. GBDT model) [11].
7.2.2 Policy training. There are multiple ways to train a policy in an offline fashion, including
model-based methods [59] and off-policy actor-critic methods [20, 58]. Here we use a model-based
method, which requires the reward function and the state transition dynamics to be learned first.
In our setting, the reward function is the scoring function F (x, p), and there is no state transition.
So we take two steps to train the policy πθ :
(1) Learn the scoring function F (x, p) from exploration data, as in Section 3.2;
(2) Train the policy πθ by maximizing the expected return J (πθ ) = Ex∼p (x) [F (x,πθ (x))].
Note that neither Step (1) or (2) involves the optimization step maxp∈P F (x, p). This is important as
it allows us to choose complex functional forms for both F and π to capture intricate dependencies
among page items3.
In reinforcement learning literature, the policy is usually trained by following the policy gradient[60]. That is, πθ can be gradually improved by moving θ along ∇θ J . It is non-trivial to compute ∇θ Jfor deterministic policies [58], as is the case in our setting. Below we employ the idea of λ-gradientsin LambdaMART to optimize the policy.
Since our policy πθ generates a permutation by sorting, we can view F (x,πθ (x)) as a type of“listwise objective”. Indeed, x contains k items and p = πθ (x) defines a permutation of them, though
the layout may not be a “list”. The difference between F (x,πθ (x)) and conventional listwise IR
measures, such as NDCG and MAP, is that NDCG and MAP are based on per-item relevance
judgments assigned by humans, while F (x,πθ (x)) is automatically learned from data. Optimizing
J (πθ ) translates to optimizing the listwise objective F (x,πθ (x)). The listwise learning-to-rank
method LambdaMART is well-suited in this scenario as it is empirically proven to optimize a wide
range of IR measures [11, 24].
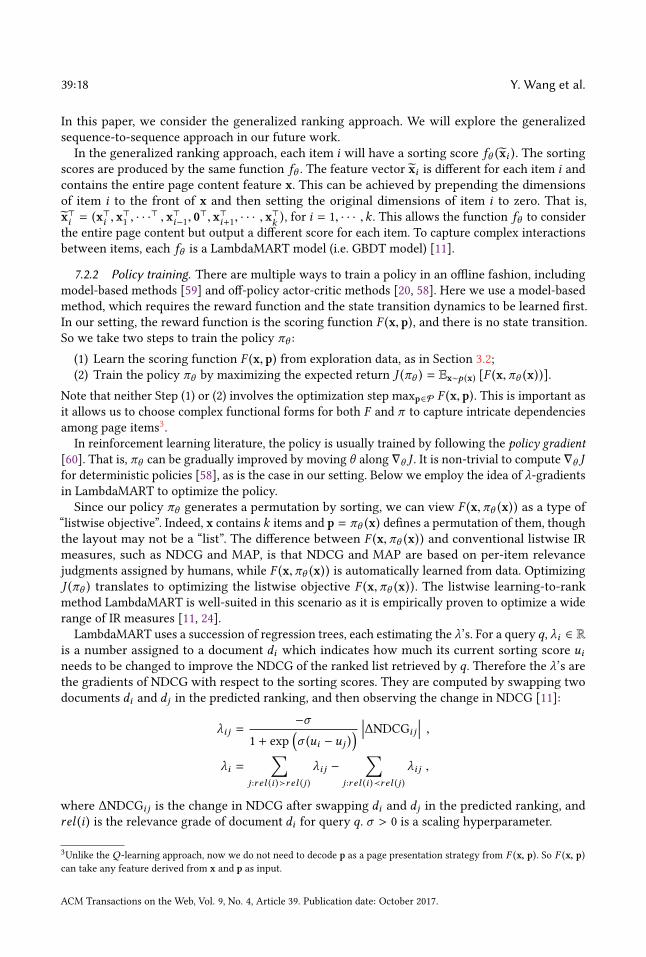
LambdaMART uses a succession of regression trees, each estimating the λ’s. For a query q, λi ∈ Ris a number assigned to a document di which indicates how much its current sorting score uineeds to be changed to improve the NDCG of the ranked list retrieved by q. Therefore the λ’s arethe gradients of NDCG with respect to the sorting scores. They are computed by swapping two
documents di and dj in the predicted ranking, and then observing the change in NDCG [11]:
λi j =−σ
1 + exp
(σ (ui − uj )
) ���∆NDCGi j��� ,
λi =∑
j :r el (i )≻r el (j )
λi j −∑
j :r el (i )≺r el (j )
λi j ,
where ∆NDCGi j is the change in NDCG after swapping di and dj in the predicted ranking, and
rel (i ) is the relevance grade of document di for query q. σ > 0 is a scaling hyperparameter.
3Unlike the Q -learning approach, now we do not need to decode p as a page presentation strategy from F (x, p). So F (x, p)can take any feature derived from x and p as input.
ACM Transactions on the Web, Vol. 9, No. 4, Article 39. Publication date: October 2017.

Optimizing Whole-Page Presentation for Web Search 39:19
In our setting, each SERP is a generalized ranked list. The λ’s can be computed by swapping
random pairs of items in the predicted ranking, and then observing the change in F :
λi j =−σ
1 + exp
(σ (ui − uj )
) ���∆Fi j ��� ,λi =
∑j :∆Fi j<0
λi j −∑
j :∆Fi j>0
λi j ,
where ∆Fi j is the change in F (x,πθ (x)) after swapping item i and j in the predicted permutation
πθ (x), which is determined by the sorting scores ui = fθ (̃xi ), i = 1, · · · ,k .This change generalizes the LambdaMART training algorithm into bandit mode: it does not need
to observe the relevance judgments of individual results, but only the performance metric at the
SERP level. The learning behavior is similar to a contextual bandit algorithm: given page content
(the context), it learns by trying out different permutations of items (the arms) through random
swaps4, getting partial feedback, and gradually adjusting the model parameters in the direction of
higher expected return.
7.3 Simulation experimentsWe implement the above policy-based algorithm in the same simulation setup as Section 5. Our
goal is to show that the policy-based approach can learn both 1-D and 2-D layouts, and it performs
comparably as the original page presentation algorithms (the Q-learning approach).
Table 6 shows the user satisfaction of page presentation algorithms in both 1-D and 2-D scenarios.
As the simulated user satisfaction is stochastic, we report the average and standard deviation of
1,000 runs for each setup.
• The Ideal algorithm acts as in Figure 3(b) and 4(b). It puts the item with i-th highest reward
to the position with i-th highest probability of examination. It gives the performance upper
bound.
• The Q-Learning algorithm is Quad-Pres5. It acts as in Figure 3(c) and 4(c) and is described
in Section 4.3.
• We include two variants of the Policy algorithm introduced in this section. They differ
in the implementation of the scoring function F (cf. Section 3.2). One uses the factorizedapproach, where each item’s reward is estimated with a GBDT model, and the page-wise user
satisfaction is the sum of estimated item rewards, as defined in the simulation procedure. The
other uses the direct approach, where a single GBDT model directly predicts the page-wise
user satisfaction using the entire SERP information (x, p).• The Random algorithm shuffles items to positions at random. It gives the performance lower
bound.
In both scenarios, Q-Learning performs almost as well as Ideal. Policy with factorized Fperforms comparably with Q-Learning in the 1-D case, and slightly worse than Q-Learning in
the 2-D case. This is because we use a policy function πθ (x) to approximate the global optimization
procedure “argmaxp∈PF (x, p)” inQ-Learning. It presents a trade-off between presentation quality
and runtime efficiency.
The scoring function plays an important role in policy-based methods. In the direct approach, Floses the internal structure of the page-wise user satisfaction (the function д in Section 3.2), which
4As a mathematical fact, performing successive swaps starting from one permutation can reach any other permutation of kitems [48].
5Since the performance ofQuad-Pres is already reaching the upper bound, we do not include Gbdt-Pres here, which is
inefficient at runtime.
ACM Transactions on the Web, Vol. 9, No. 4, Article 39. Publication date: October 2017.

39:20 Y. Wang et al.
Table 6. Average user satisfaction of different page presentation algorithms in two simulation scenarios.
Standard deviations are shown in parentheses.
1-D (top position bias) 2-D (top-left position bias)
Ideal 2.20 (0.78) 8.80 (1.63)
Q-Learning 2.18 (0.77) 8.43 (1.55)
Policy (factorized F ) 2.18 (0.76) 7.90 (1.56)
Policy (direct F ) 1.78 (0.56) 6.91 (1.44)
Random 1.41 (0.69) 5.36 (1.39)
is essential to generalizing well to unseen presentations and providing accurate feedback during
policy training. The factorized approach preserves the structure in F = д ◦ f , therefore it trains abetter policy than the direct approach.
8 RELATEDWORKAs a general framework for search result presentation, this work draws on many aspects of modern
IR research. It extends the traditional “ranked list” formulation to the general notion of “page
presentation” as a response to federated search, the defining feature of modern search engines. It
aims to deliver optimal presentation by understanding and learning from interactive search logs.
8.1 Document Ranking in RetrievalDocument ranking has long been the core problem of ad hoc retrieval. In the traditional setup,
given a query, the retrieval system returns a list of homogeneous documents ranked by decreasing
probability of relevance. The presentation is optimal with respect to the user’s effort when she
sequentially and independently examines results from top to bottom [54]. Extensive research efforts
have been dedicated to the design of relevance ranking algorithms, dating from vector space models
[55] and language modeling ranking functions [68] to machine learning ranking [42] and top
document reranking [12, 31, 51]. To evaluate a ranked list, traditional metrics such as mean average
precision (MAP) and normalized discounted cumulative gain (NDCG) rely on human assessments,
i.e. relevance judgments for query-document pairs.
Our framework extends homogeneous document ranking to heterogeneous content presentation.
Document ranking is a special case when presentation is a ranked list. From an algorithmic
perspective, we use all documents on SERP to determine the optimal presentation, which is in
the same spirit of reranking/global ranking [31, 51]. The difference is that our framework allows
much more general notion of presentation than a list. In fact, global ranking algorithms, and more
broadly, structured prediction algorithms in machine learning literature [9], can be readily plugged
into our framework as the user response model.
8.2 Federated SearchFederated search (or aggregated search) refers to searching through a collection of specialized search
engines, or verticals, and aggregating the results on SERP. Usually, contents from different verticals
are heterogeneous and visually rich. Federated search has two sub-tasks: vertical selection and
result presentation [21, 45]. Given a query, the task of vertical selection is to accurately determine
which candidate verticals provide potentially relevant results [6, 7]. After getting results from
candidate verticals, the task of result presentation is to merge vertical results with general webpage
results on the same page [4].
ACM Transactions on the Web, Vol. 9, No. 4, Article 39. Publication date: October 2017.

Optimizing Whole-Page Presentation for Web Search 39:21
Our work is concerned with result presentation. Previous approaches formulate it as a ranking
problem [4, 32, 49]. Specifically, [4, 32] employ pointwise ranking functions to rank results and
blocks, while [4, 49] also construct pairwise preference judgments to train a ranking function.
[15] considers 2-D grid presentation for image and shopping results. Our framework allows more
flexible definition of presentation than ranked list and 2-D grid, e.g. arbitrary frames, image sizes,
and text fonts.
Federated search results significantly change the landscape of SERP, which in turn calls for
changes in evaluation methodology. Bailey et al. [8] propose the notion of whole-page relevance.They argue that the Cranfield-style evaluation is inadequate to quantify user’s holistic experience
on modern SERP, such as overall presentation and coherence. It proposes to evaluate whole-page
relevance by assigning grades to various SERP elements. Whole-page optimization can incorporate
other goals, such as the revenue of a search service provider in sponsored search [22] and online
ads bidding [47]. Our framework is more general and can be applied in these problems by defining
an appropriate user satisfaction metric, i.e. the optimization objective.
8.3 Understanding and Learning from User InteractionUser interaction behaviors on the SERP, such as clicks with long and short dwell time, query
reformulations, and abandonments, often indicates the quality of search results. Understanding
these behaviors is critical for delivering good search experience. Many search engines collect
detailed user interactions on the SERP to evaluate and train relevance ranking algorithms [19].
Eye-tracking experiments [27, 28] and click log analyses [18, 34] observe that users follow
sequential order in browsing blue-link-only SERPs. Lower-ranked results are examined with lower
probability. These results confirm the probability ranking principle, encouraging search engines to
put more relevant results on top. As visually rich, heterogeneous results appear on modern SERPs,
users do not necessarily follow sequential order in browsing search results. Studies observe more
interesting user interaction patterns, notably vertical bias [13, 38, 44] and presentation bias [67],
essentially violating the assumptions of the probability ranking principle (PRP). Our experiments
show that the proposed framework is able to learn the user’s browsing habits without knowing the
PRP.
Search engines collect user behaviors to evaluate the quality of search results. Traditional
evaluation metrics such as MAP and NDCG are based on relevance judgments made by third-
party assessors. When rating the relevance of results given a query, the assessors are out of the
context of the actual user and may not be able to accurately interpret the user’s information need
when performing the search, especially when the query is context-sensitive [10]. In such cases,
user satisfaction are better reflected in their behaviors. Extensive research has been devoted to
developing user satisfaction metrics from their behaviors [16, 25, 29, 36, 65]. Our framework adopts
a generic definition of user satisfaction, which can incorporate a wide range of user behaviors on
the SERP.
Search engines also leverage user behaviors to train the search algorithms. However, due to
position bias, vertical bias, and other factors, clicked results are not always relevant and non-clicked
results may still be relevant albeit ranked at low positions. Therefore, click-through data are noisy
and partial feedback of result relevance [34]. Various approaches have been proposed to leverage
user behaviors to improve ranking algorithms. We can categorize these approaches into three lines.
(1) The first line of approach makes explicit assumption about user behavior patterns and how
they indicate result relevance. User behavior signals are incorporated as additional features
[2] and tasks [61, 70] to train existing rankers, interpreted as preference data to train pairwise
rankers [33, 52]. Various click models are proposed to infer result relevance from observed
ACM Transactions on the Web, Vol. 9, No. 4, Article 39. Publication date: October 2017.

39:22 Y. Wang et al.
user clicks [13, 17, 23]. These approaches derive large amount of relevance information from
search logs in an offline fashion. However, their assumptions may or may not hold as user
interactions on SERP (and the search engine itself) evolve over time.
(2) The second line of approach empowers the search algorithm to perform online learning
and adaptively optimize behavior-based metrics. This include interleaving experiments
[53] and contextual bandit algorithms [40, 57, 66]. Online, interactive algorithms are also
proposed to improve sequence of interactions between a search engine and the user [46, 69].
Online learning approaches can optimize behavior-based metrics without relying on strong
assumptions of user behavior patterns. However, online bucket tests are expensive and
random exploration may run the risk of undesirable results [41].
(3) The third and more recent line of approach combines the strengths of the previous two.
It optimizes behavior-based metrics using already-collected exploration data in an offline
fashion. This is in similar spirit to the off-policy learning scenario in reinforcement learning
[59]. Crucially, it requires the exploration policy to record the probability of actions (e.g.
putting an item in a position). This data will later be used to generate unbiased counterfactual
evaluation of new rankers [1, 41] and seek for better rankers [35, 62].
Our work is in line with the third approach. We first learn an unbiased estimator of the user
satisfaction metric (the scoring function F ) from data collected by presentation exploration buckets,
then optimize page presentation to maximize the metric. The main difference between these studies
and our paper is in the problem formulation: we do not restrict the layout to be a ranked list, but
rather consider the more general notion of page presentation.
9 CONCLUSIONThis paper proposes a new problem in web search: whole-page presentation optimization. Modern
retrieval systems return a collection of heterogeneous results, calling for more flexible presentation
strategies than the conventional ranked list. This paper formulates the problem as a mathematical
optimization problem, and proposes a framework that solves the problem in a data-driven fashion.
This general framework is instantiated to enable more flexible and expressive definition of page
presentation than ranked list. Simple instantiations of the framework are shown to outperform
ranking-based methods in satisfying federated search users.
This study opens up many interesting avenues for the future work. We can instantiate the
general presentation optimization framework properly on other heterogeneous content presentation
scenarios, such as mobile and tablet search, where user’s attention bias may be different from
that on large screens. User response models can be instantiated in more sophisticated ways, e.g.,
modeling cursor position as conditional random fields over the SERP canvas. Finally, defining a
proper quantitative metric for user satisfaction based on SERP-level, fine-grained user behaviors
can be explored in human computer interaction research.
10 ACKNOWLEDGEMENTSWe sincerely thank the anonymous reviewers of the conference version of this article. Their
comments were very constructive; some actually inspired our extended explorations. Yue Wang
would like to thank Lihong Li, Nick Craswell, Jin Young Kim, Milad Shokouhi, and Paul Bennett for
their insightful discussion when he interned at Microsoft Research. This work is partially supported
by the National Science Foundation under grant number IIS-1054199.
REFERENCES[1] Aman Agarwal, Soumya Basu, Tobias Schnabel, and Thorsten Joachims. 2017. Effective Evaluation using Logged
Bandit Feedback from Multiple Loggers. arXiv preprint arXiv:1703.06180 (2017).
ACM Transactions on the Web, Vol. 9, No. 4, Article 39. Publication date: October 2017.

Optimizing Whole-Page Presentation for Web Search 39:23
[2] Eugene Agichtein, Eric Brill, and Susan Dumais. 2006. Improving web search ranking by incorporating user behavior
information. In Proceedings of the 29th annual international ACM SIGIR conference on Research and development ininformation retrieval. ACM, 19–26.
[3] Jaime Arguello and Fernando Diaz. 2013. Vertical Selection and Aggregation. In Relevance Ranking for Vertical SearchEngines, Bo Long and Yi Chang (Eds.). Elsevier.
[4] Jaime Arguello, Fernando Diaz, and Jamie Callan. 2011. Learning to aggregate vertical results into web search results.
In Proceedings of the 20th ACM conference on Information and knowledge management. 201–210.[5] Jaime Arguello, Fernando Diaz, Jamie Callan, and Ben Carterette. 2011. A methodology for evaluating aggregated
search results. In Advances in information retrieval. Springer, 141–152.[6] Jaime Arguello, Fernando Diaz, Jamie Callan, and Jean-Francois Crespo. 2009. Sources of evidence for vertical selection.
In Proceedings of the 32nd ACM SIGIR conference on Research and development in information retrieval. 315–322.[7] Jaime Arguello, Fernando Diaz, and Jean-François Paiement. 2010. Vertical selection in the presence of unlabeled
verticals. In Proceedings of the 33rd ACM SIGIR conference on Research and development in information retrieval. 691–698.[8] Peter Bailey, Nick Craswell, Ryen WWhite, Liwei Chen, Ashwin Satyanarayana, and Seyed MM Tahaghoghi. 2010.
Evaluating whole-page relevance. In Proceedings of the 33rd ACM SIGIR conference on Research and development ininformation retrieval. 767–768.
[9] GH Bakir, T Hofmann, B Schölkopf, AJ Smola, B Taskar, and SVN Vishwanathan. 2007. Predicting Structured Data.
(2007).
[10] Nicholas J Belkin. 2008. Some (what) grand challenges for information retrieval. In ACM SIGIR Forum, Vol. 42. ACM,
47–54.
[11] Christopher JC Burges. 2010. From ranknet to lambdarank to lambdamart: An overview. Learning 11, 23-581 (2010),
81.
[12] Jaime Carbonell and Jade Goldstein. 1998. The use of MMR, diversity-based reranking for reordering documents and
producing summaries. In Proceedings of the 21st ACM SIGIR conference on Research and development in informationretrieval. 335–336.
[13] Danqi Chen, Weizhu Chen, Haixun Wang, Zheng Chen, and Qiang Yang. 2012. Beyond ten blue links: enabling user
click modeling in federated web search. In Proceedings of the fifth ACM conference on Web search and data mining.463–472.
[14] Tianqi Chen. [n. d.]. eXtreme Gradient Boosting Library. https://github.com/dmlc/xgboost. ([n. d.]).
[15] Flavio Chierichetti, Ravi Kumar, and Prabhakar Raghavan. 2011. Optimizing two-dimensional search results presenta-
tion. In Proceedings of the fourth ACM conference on Web search and data mining. 257–266.[16] Aleksandr Chuklin and Maarten de Rijke. 2016. Incorporating clicks, attention and satisfaction into a search engine
result page evaluation model. In Proceedings of the 25th ACM International on Conference on Information and KnowledgeManagement. ACM, 175–184.
[17] Aleksandr Chuklin, Ilya Markov, and Maarten de Rijke. 2015. Click models for web search. Synthesis Lectures onInformation Concepts, Retrieval, and Services 7, 3 (2015), 1–115.
[18] Nick Craswell, Onno Zoeter, Michael Taylor, and Bill Ramsey. 2008. An experimental comparison of click position-bias
models. In Proceedings of the 2008 Conference on Web search and data mining. 87–94.[19] Ovidiu Dan and Brian D Davison. 2016. Measuring and Predicting Search Engine UsersâĂŹ Satisfaction. ACM
Computing Surveys (CSUR) 49, 1 (2016), 18.[20] Thomas Degris, Martha White, and Richard Sutton. 2012. Off-Policy Actor-Critic. In International Conference on
Machine Learning.[21] Thomas Demeester, Dolf Trieschnigg, Dong Nguyen, Ke Zhou, and Djoerd Hiemstra. 2014. Overview of the TREC 2014
federated Web search track. Technical Report. GHENT UNIV (BELGIUM).
[22] Nikhil R Devanur, Zhiyi Huang, Nitish Korula, Vahab S Mirrokni, and Qiqi Yan. 2013. Whole-page optimization and
submodular welfare maximization with online bidders. In Proceedings of the fourteenth ACM conference on Electroniccommerce. 305–322.
[23] Fernando Diaz, RyenWWhite, Georg Buscher, and Dan Liebling. 2013. Robust models of mouse movement on dynamic
web search results pages. In Proceedings of the 22nd ACM conference on information and knowledge management.1451–1460.
[24] Pinar Donmez, Krysta M Svore, and Christopher JC Burges. 2009. On the local optimality of LambdaRank. In Proceedingsof the 32nd international ACM SIGIR conference on Research and development in information retrieval. ACM, 460–467.
[25] Steve Fox, Kuldeep Karnawat, Mark Mydland, Susan Dumais, and Thomas White. 2005. Evaluating implicit measures
to improve web search. ACM Transactions on Information Systems (TOIS) 23, 2 (2005), 147–168.[26] Jerome H Friedman. 2002. Stochastic gradient boosting. Computational Statistics & Data Analysis 38, 4 (2002), 367–378.[27] Hotchkiss Gord. 2007. Eye Tracking On Universal And Personalized Search. http://searchengineland.com/eye-tracking-
on-universal-and-personalized-search-12233. (21 9 2007). Technical report, Enquiro Research.
ACM Transactions on the Web, Vol. 9, No. 4, Article 39. Publication date: October 2017.

39:24 Y. Wang et al.
[28] Laura A Granka, Thorsten Joachims, and Geri Gay. 2004. Eye-tracking analysis of user behavior in WWW search. In
Proceedings of the 27th ACM SIGIR conference on Research and development in information retrieval. 478–479.[29] Ahmed Hassan, Rosie Jones, and Kristina Lisa Klinkner. 2010. Beyond DCG: user behavior as a predictor of a successful
search. In Proceedings of the third ACM international conference on Web search and data mining. ACM, 221–230.
[30] Marti Hearst. 2019. The Evaluation of Search User Interfaces. In Search User Interfaces. Cambridge University Press.
[31] Shihao Ji, Ke Zhou, Ciya Liao, Zhaohui Zheng, Gui-Rong Xue, Olivier Chapelle, Gordon Sun, and Hongyuan Zha. 2009.
Global ranking by exploiting user clicks. In Proceedings of the 32nd ACM SIGIR conference on Research and developmentin information retrieval. 35–42.
[32] Luo Jie, Sudarshan Lamkhede, Rochit Sapra, Evans Hsu, Helen Song, and Yi Chang. 2013. A unified search federation
system based on online user feedback. In Proceedings of the 19th ACM SIGKDD conference on Knowledge discovery anddata mining. ACM, 1195–1203.
[33] Thorsten Joachims. 2002. Optimizing search engines using clickthrough data. In Proceedings of the eighth ACM SIGKDDinternational conference on Knowledge discovery and data mining. ACM, 133–142.
[34] Thorsten Joachims, Laura Granka, Bing Pan, Helene Hembrooke, and Geri Gay. 2005. Accurately interpreting
clickthrough data as implicit feedback. In Proceedings of the 28th ACM SIGIR conference on Research and development ininformation retrieval. 154–161.
[35] Thorsten Joachims, Adith Swaminathan, and Tobias Schnabel. 2017. Unbiased learning-to-rank with biased feedback.
In Proceedings of the Tenth ACM International Conference on Web Search and Data Mining. ACM, 781–789.
[36] Diane Kelly et al. 2009. Methods for evaluating interactive information retrieval systems with users. Foundations andTrends® in Information Retrieval 3, 1–2 (2009), 1–224.
[37] Harold W Kuhn. 1955. The Hungarian method for the assignment problem. Naval Research Logistics Quarterly 2, 1-2
(1955), 83–97.
[38] Dmitry Lagun and Eugene Agichtein. 2014. Effects of task and domain on searcher attention. In Proceedings of the 37thACM SIGIR conference on Research and development in information retrieval. 1087–1090.
[39] John Langford. [n. d.]. Vowpal Wabbit. http://hunch.net/ vw. ([n. d.]).
[40] Lihong Li, Wei Chu, John Langford, and Robert E Schapire. 2010. A contextual-bandit approach to personalized news
article recommendation. In Proceedings of the 19th conference on World Wide Web. 661–670.[41] Lihong Li, Wei Chu, John Langford, and Xuanhui Wang. 2011. Unbiased offline evaluation of contextual-bandit-based
news article recommendation algorithms. In Proceedings of the fourth ACM international conference on Web search anddata mining. ACM, 297–306.
[42] Tie-Yan Liu. 2009. Learning to rank for information retrieval. Foundations and Trends in Information Retrieval 3, 3(2009), 225–331.
[43] Yiqun Liu, Ye Chen, Jinhui Tang, Jiashen Sun, Min Zhang, Shaoping Ma, and Xuan Zhu. 2015. Different Users, Different
Opinions: Predicting Search Satisfaction with Mouse Movement Information. In Proceedings of the 38th ACM SIGIRconference on Research and development in information retrieval.
[44] Zeyang Liu, Yiqun Liu, Ke Zhou, Min Zhang, and Shaoping Ma. 2015. Influence of Vertical Result in Web Search
Examination. In Proceedings of the 38th ACM SIGIR conference on Research and development in information retrieval.[45] Bo Long and Yi Chang. 2014. Relevance Ranking for Vertical Search Engines. Elsevier.[46] Jiyun Luo, Sicong Zhang, and Hui Yang. 2014. Win-win search: Dual-agent stochastic game in session search. In
Proceedings of the 37th international ACM SIGIR conference on Research & development in information retrieval. ACM,
587–596.
[47] Pavel Metrikov, Fernando Diaz, Sébastien Lahaie, and Justin Rao. 2014. Whole page optimization: how page elements
interact with the position auction. In Proceedings of the fifteenth ACM conference on Economics and computation.583–600.
[48] Permutohedron [n. d.]. Permutohedron. https://en.wikipedia.org/wiki/Permutohedron. ([n. d.]).
[49] Ashok Kumar Ponnuswami, Kumaresh Pattabiraman, Qiang Wu, Ran Gilad-Bachrach, and Tapas Kanungo. 2011. On
composition of a federated web search result page: using online users to provide pairwise preference for heterogeneous
verticals. In Proceedings of the fourth ACM conference on Web search and data mining. 715–724.[50] Position bias [n. d.]. Google ads in second position get more attention. http://miratech.com/blog/eye-tracking-
google.html. ([n. d.]).
[51] Tao Qin, Tie-Yan Liu, Xu-Dong Zhang, De-ShengWang, and Hang Li. 2009. Global ranking using continuous conditional
random fields. In Advances in neural information processing systems. 1281–1288.[52] Filip Radlinski and Thorsten Joachims. 2005. Query chains: learning to rank from implicit feedback. In Proceedings of
the eleventh ACM SIGKDD international conference on Knowledge discovery in data mining. ACM, 239–248.
[53] Filip Radlinski and Thorsten Joachims. 2006. Minimally invasive randomization for collecting unbiased preferences
from clickthrough logs. In Proceedings of the National Conference on Artificial Intelligence, Vol. 21. Menlo Park, CA;
Cambridge, MA; London; AAAI Press; MIT Press; 1999, 1406.
ACM Transactions on the Web, Vol. 9, No. 4, Article 39. Publication date: October 2017.

Optimizing Whole-Page Presentation for Web Search 39:25
[54] S. E. Robertson. 1977. The probability ranking principle in IR. In Journal of Documentation. 294–304.[55] Gerard Salton and Christopher Buckley. 1988. Term-weighting approaches in automatic text retrieval. Information
processing & management 24, 5 (1988), 513–523.[56] Anne Schuth, Katja Hofmann, and Filip Radlinski. 2015. Predicting search satisfaction metrics with interleaved
comparisons. In Proceedings of the 38th ACM SIGIR conference on Research and development in information retrieval.[57] Anne Schuth, Harrie Oosterhuis, Shimon Whiteson, and Maarten de Rijke. 2016. Multileave gradient descent for fast
online learning to rank. In Proceedings of the Ninth ACM International Conference on Web Search and Data Mining.ACM, 457–466.
[58] David Silver, Guy Lever, Nicolas Heess, Thomas Degris, Daan Wierstra, and Martin Riedmiller. 2014. Deterministic
policy gradient algorithms. In Proceedings of the 31st International Conference on Machine Learning (ICML-14). 387–395.[59] Richard S Sutton and Andrew G Barto. 1998. Reinforcement learning: An introduction. MIT press Cambridges, Chapter
5. Monte Carlo Methods and 9. Planning and Learning.
[60] Richard S Sutton, David A McAllester, Satinder P Singh, and Yishay Mansour. 2000. Policy gradient methods for
reinforcement learning with function approximation. In Advances in neural information processing systems. 1057–1063.[61] Krysta M Svore, Maksims N Volkovs, and Christopher JC Burges. 2011. Learning to rank with multiple objective
functions. In Proceedings of the 20th international conference on World wide web. ACM, 367–376.
[62] Adith Swaminathan and Thorsten Joachims. 2015. Counterfactual risk minimization: Learning from logged bandit
feedback. In International Conference on Machine Learning. 814–823.[63] Vertical bias [n. d.]. Eye Tracking Study: Google Results with Videos. https://www.looktracker.com/blog/eye-tracking-
case-study/google-results-with-videos-eye-tracking-study. ([n. d.]).
[64] Yue Wang, Dawei Yin, Luo Jie, Pengyuan Wang, Makoto Yamada, Yi Chang, and Qiaozhu Mei. 2016. Beyond ranking:
Optimizing whole-page presentation. In Proceedings of the Ninth ACM International Conference on Web Search andData Mining. ACM, 103–112.
[65] Emine Yilmaz, Milad Shokouhi, Nick Craswell, and Stephen Robertson. 2010. Expected browsing utility for web search
evaluation. In Proceedings of the 19th ACM international conference on Information and knowledge management. ACM,
1561–1564.
[66] Yisong Yue and Thorsten Joachims. 2009. Interactively optimizing information retrieval systems as a dueling bandits
problem. In Proceedings of the 26th Annual International Conference on Machine Learning. ACM, 1201–1208.
[67] Yisong Yue, Rajan Patel, and Hein Roehrig. 2010. Beyond position bias: Examining result attractiveness as a source of
presentation bias in clickthrough data. In Proceedings of the 19th conference on World Wide Web. 1011–1018.[68] Chengxiang Zhai and John Lafferty. 2001. A study of smoothing methods for language models applied to ad hoc
information retrieval. In Proceedings of the 24th ACM SIGIR conference on Research and development in informationretrieval. 334–342.
[69] Yinan Zhang and Chengxiang Zhai. 2015. Information retrieval as card playing: A formal model for optimizing
interactive retrieval interface. In Proceedings of the 38th International ACM SIGIR Conference on Research and Developmentin Information Retrieval. ACM, 685–694.
[70] Masrour Zoghi, Tomáš Tunys, Lihong Li, Damien Jose, Junyan Chen, Chun Ming Chin, and Maarten de Rijke. 2016.
Click-based hot fixes for underperforming torso queries. In Proceedings of the 39th International ACM SIGIR conferenceon Research and Development in Information Retrieval. ACM, 195–204.
Received October 2017; revised March 2009; accepted June 2009
ACM Transactions on the Web, Vol. 9, No. 4, Article 39. Publication date: October 2017.