Optimizing Vehicle NVH Characteristics for Driveline ... - · PDF fileOptimizing Vehicle NVH...
15
1 Optimizing Vehicle NVH Characteristics for Driveline Integration ABSTRACT The automotive marketplace has seen a steady increase in customer demands for quiet and more comfortable vehicles. A customer’s expectations for NVH refinement often contradicts the constraints for lightweight vehicle designs and the need for a powertrain with increased fuel efficiency. The driveline of a vehicle can be a substantial cause of NVH issues. Variants in the driveline architecture (front wheel, rear wheel and four-wheel/all-wheel drive, automatic-, manual-, automatic-shifted manual transmission, etc.) combined with an overall increase in the complexity of the modern driveline systems can make the task of integrating them very challenging. Development of a well refined vehicle requires the understanding and control of several driveline-related noise and vibration problems within different frequency ranges, due to the multitude of driveline components and their potential excitation sources.. A key aspect of the driveline integration process is the realization that a design modification can have an impact on numerous NVH phenomena. . INTRODUCTION A vehicle’s NVH characteristics are closely related to how it is seen in terms of quality. The configuration of the driveline can result in a variety of NVH concerns across a broad frequency range. Quick changes in the vehicle’s load (e.g., pedal tip-in/out) can result in an objectionable vehicle shuffle response, which is connected to the first natural frequency of the driveline and is usually in the 2 Hz – 8 Hz frequency range (depending on the selected gear) [1,2]. On the opposite end of the frequency range, driveline dynamics can influence the dynamic mesh forces of a rear axle [3], resulting in axle whine, which is typically between 300 Hz – 1 kHz, while transmission whine can extend out to the 3 kHz - 4 kHz range. These examples illustrate the wide frequency range and extremely different NVH concerns that have to be considered in the driveline integration process. A list of the most commonly encountered driveline NVH phenomena and their usual frequency range is shown in Figure 1. Figure 1: Typical Frequency Range of Various Driveline NVH Issues The primary cause of these NVH issues can be traced back to various driveline components or subsystems. Driveline related NVH issues and the corresponding primary sources are shown in Figure 2. This figure only provides an indication of the primary sources of noise/vibration for the NVH phenomena that is listed. Additional driveline-, engine- and vehicle parameters, which are not specifically shown in the figure, can also have a significant impact on the particular NVH phenomena. Driveline shuffle and clunk, as an example, that occurs during a pedal tip-in maneuver can be influenced by the torque rise rate and can be controlled by the appropriate engine torque management strategies.
Transcript of Optimizing Vehicle NVH Characteristics for Driveline ... - · PDF fileOptimizing Vehicle NVH...
1
Optimizing Vehicle NVH Characteristics for Driveline Integration
ABSTRACT
The automotive marketplace has seen a steady increase in customer demands for quiet and more comfortable vehicles. A customer’s expectations for NVH refinement often contradicts the constraints for lightweight vehicle designs and the need for a powertrain with increased fuel efficiency. The driveline of a vehicle can be a substantial cause of NVH issues. Variants in the driveline architecture (front wheel, rear wheel and four-wheel/all-wheel drive, automatic-, manual-, automatic-shifted manual transmission, etc.) combined with an overall increase in the complexity of the modern driveline systems can make the task of integrating them very challenging.
Development of a well refined vehicle requires the understanding and control of several driveline-related noise and vibration problems within different frequency ranges, due to the multitude of driveline components and their potential excitation sources.. A key aspect of the driveline integration process is the realization that a design modification can have an impact on numerous NVH phenomena.
.
INTRODUCTION
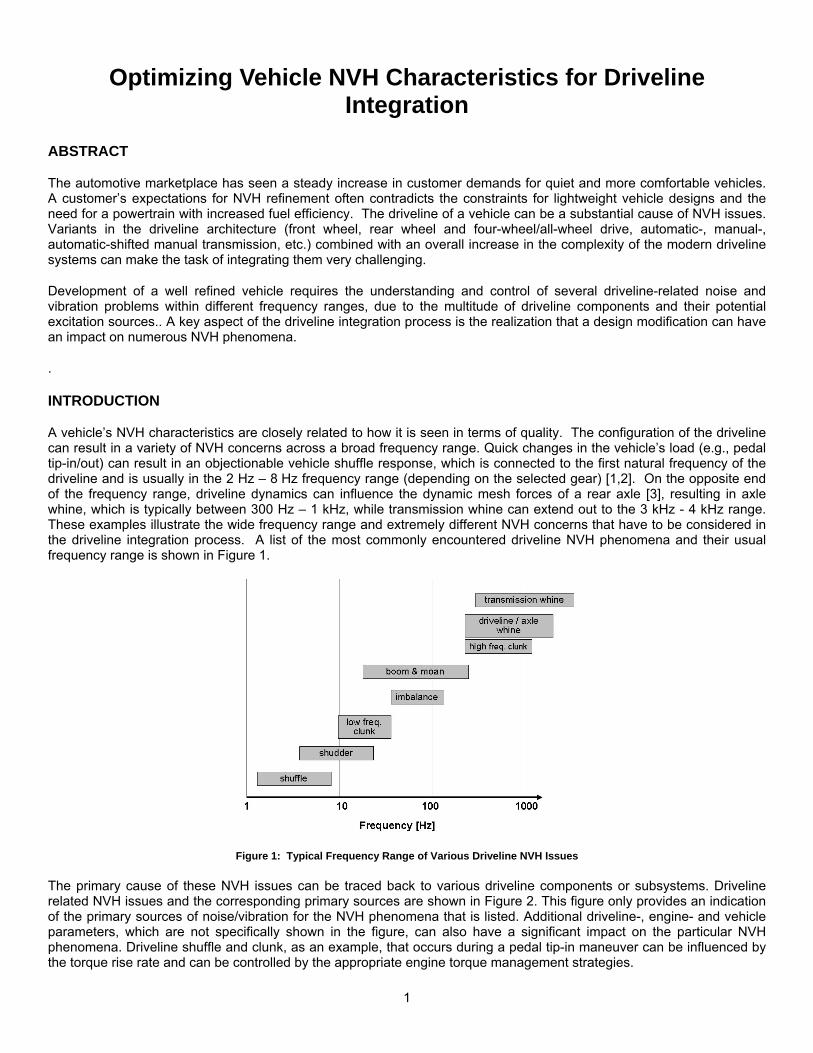
A vehicle’s NVH characteristics are closely related to how it is seen in terms of quality. The configuration of the driveline can result in a variety of NVH concerns across a broad frequency range. Quick changes in the vehicle’s load (e.g., pedal tip-in/out) can result in an objectionable vehicle shuffle response, which is connected to the first natural frequency of the driveline and is usually in the 2 Hz – 8 Hz frequency range (depending on the selected gear) [1,2]. On the opposite end of the frequency range, driveline dynamics can influence the dynamic mesh forces of a rear axle [3], resulting in axle whine, which is typically between 300 Hz – 1 kHz, while transmission whine can extend out to the 3 kHz - 4 kHz range. These examples illustrate the wide frequency range and extremely different NVH concerns that have to be considered in the driveline integration process. A list of the most commonly encountered driveline NVH phenomena and their usual frequency range is shown in Figure 1.
Figure 1: Typical Frequency Range of Various Driveline NVH Issues
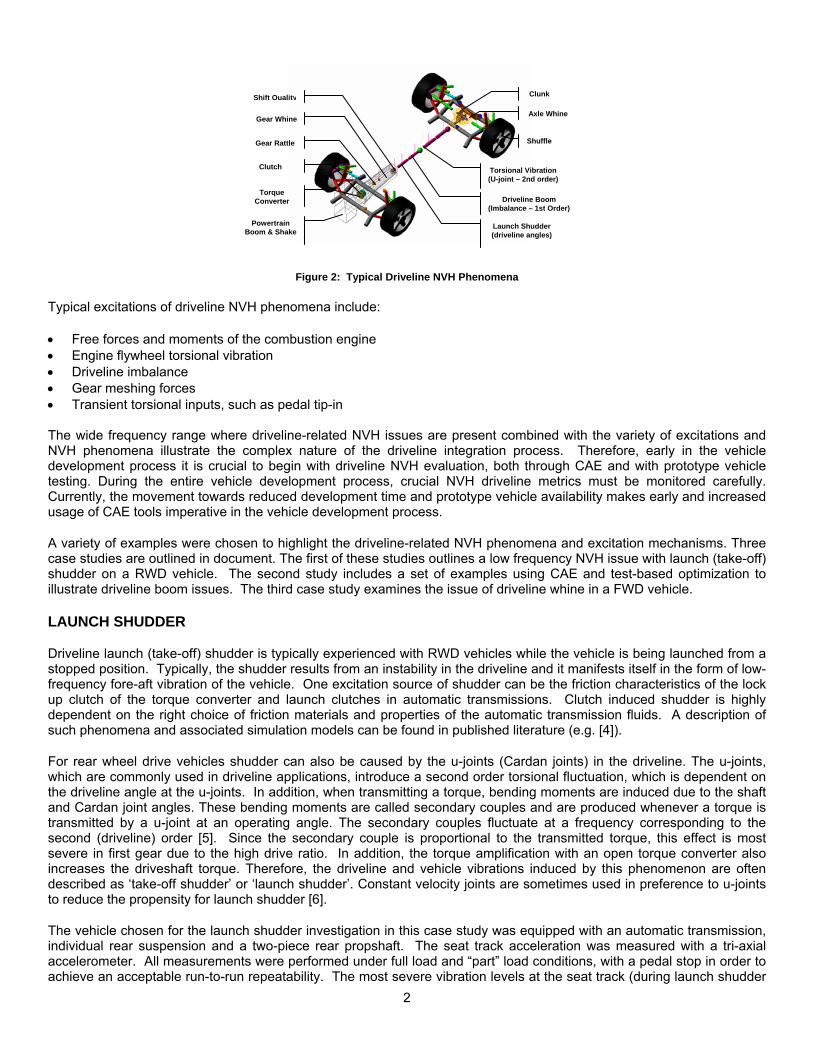
The primary cause of these NVH issues can be traced back to various driveline components or subsystems. Driveline related NVH issues and the corresponding primary sources are shown in Figure 2. This figure only provides an indication of the primary sources of noise/vibration for the NVH phenomena that is listed. Additional driveline-, engine- and vehicle parameters, which are not specifically shown in the figure, can also have a significant impact on the particular NVH phenomena. Driveline shuffle and clunk, as an example, that occurs during a pedal tip-in maneuver can be influenced by the torque rise rate and can be controlled by the appropriate engine torque management strategies.
2
Figure 2: Typical Driveline NVH Phenomena
Typical excitations of driveline NVH phenomena include:
• Free forces and moments of the combustion engine • Engine flywheel torsional vibration • Driveline imbalance • Gear meshing forces • Transient torsional inputs, such as pedal tip-in The wide frequency range where driveline-related NVH issues are present combined with the variety of excitations and NVH phenomena illustrate the complex nature of the driveline integration process. Therefore, early in the vehicle development process it is crucial to begin with driveline NVH evaluation, both through CAE and with prototype vehicle testing. During the entire vehicle development process, crucial NVH driveline metrics must be monitored carefully. Currently, the movement towards reduced development time and prototype vehicle availability makes early and increased usage of CAE tools imperative in the vehicle development process.
A variety of examples were chosen to highlight the driveline-related NVH phenomena and excitation mechanisms. Three case studies are outlined in document. The first of these studies outlines a low frequency NVH issue with launch (take-off) shudder on a RWD vehicle. The second study includes a set of examples using CAE and test-based optimization to illustrate driveline boom issues. The third case study examines the issue of driveline whine in a FWD vehicle.
LAUNCH SHUDDER
Driveline launch (take-off) shudder is typically experienced with RWD vehicles while the vehicle is being launched from a stopped position. Typically, the shudder results from an instability in the driveline and it manifests itself in the form of low-frequency fore-aft vibration of the vehicle. One excitation source of shudder can be the friction characteristics of the lock up clutch of the torque converter and launch clutches in automatic transmissions. Clutch induced shudder is highly dependent on the right choice of friction materials and properties of the automatic transmission fluids. A description of such phenomena and associated simulation models can be found in published literature (e.g. [4]).
For rear wheel drive vehicles shudder can also be caused by the u-joints (Cardan joints) in the driveline. The u-joints, which are commonly used in driveline applications, introduce a second order torsional fluctuation, which is dependent on the driveline angle at the u-joints. In addition, when transmitting a torque, bending moments are induced due to the shaft and Cardan joint angles. These bending moments are called secondary couples and are produced whenever a torque is transmitted by a u-joint at an operating angle. The secondary couples fluctuate at a frequency corresponding to the second (driveline) order [5]. Since the secondary couple is proportional to the transmitted torque, this effect is most severe in first gear due to the high drive ratio. In addition, the torque amplification with an open torque converter also increases the driveshaft torque. Therefore, the driveline and vehicle vibrations induced by this phenomenon are often described as ‘take-off shudder’ or ‘launch shudder’. Constant velocity joints are sometimes used in preference to u-joints to reduce the propensity for launch shudder [6].
The vehicle chosen for the launch shudder investigation in this case study was equipped with an automatic transmission, individual rear suspension and a two-piece rear propshaft. The seat track acceleration was measured with a tri-axial accelerometer. All measurements were performed under full load and “part” load conditions, with a pedal stop in order to achieve an acceptable run-to-run repeatability. The most severe vibration levels at the seat track (during launch shudder
Shift Quality
Gear Whine
Gear Rattle
Clutch
Torque Converter
Powertrain Boom & Shake
Launch Shudder (driveline angles)
Driveline Boom (Imbalance – 1st Order)
Torsional Vibration (U-joint – 2nd order)
Shuffle
Axle Whine
Clunk
3
excitation) were found in axial and vertical directions. Specifically, three frequency ranges were identified as critical in the seat track vibration, 10 Hz, 15 Hz, and 22 Hz. The identified vibration peaks were all excited by the 2nd propshaft order.
At the same time, vibration at the transmission end point, center bearing and differential were measured with tri-axial accelerometers. The vibration levels at 10 Hz and 15 Hz were noted clearly in the transmission endpoint acceleration measurements. The vibration peak at 22 Hz was noted to be present at the center bearing in vertical (and lateral) direction and could also be identified in the differential housing vibration measurements.
In order to get a better understanding of the root cause of these frequency peaks, an Operation Deflection Shape (ODS) analysis of the powertrain and driveline was performed. The ODS analyses at 10 Hz and 15 Hz revealed that the powertrain was forced by 2nd order driveline excitation into a ‘rotational’ movement around its longitudinal axis. The propshaft exhibited similar rotational motion at the center bearing bushing location. The ODS analysis at 22 Hz indicated significant rotational motion of the propshaft at the center bearing, with little motion of the powertrain. At 22 Hz, the rear axle showed fore-aft motion, which was likely to be forced response through the propshaft.
Since the stiffness of the center bearing bushing is typically low in order to achieve reasonable isolation for driveline imbalance excitations, the center bearing frequency (driveshaft bounce) is normally in a range of 10 Hz – 30 Hz. The driveline sensitivity to the secondary couple is typically rather high in this frequency range. In the given case study the driveshaft bounce mode was identified at 22 Hz, which correlates to a 2nd order excitation at about 660 rpm (propshaft speed).
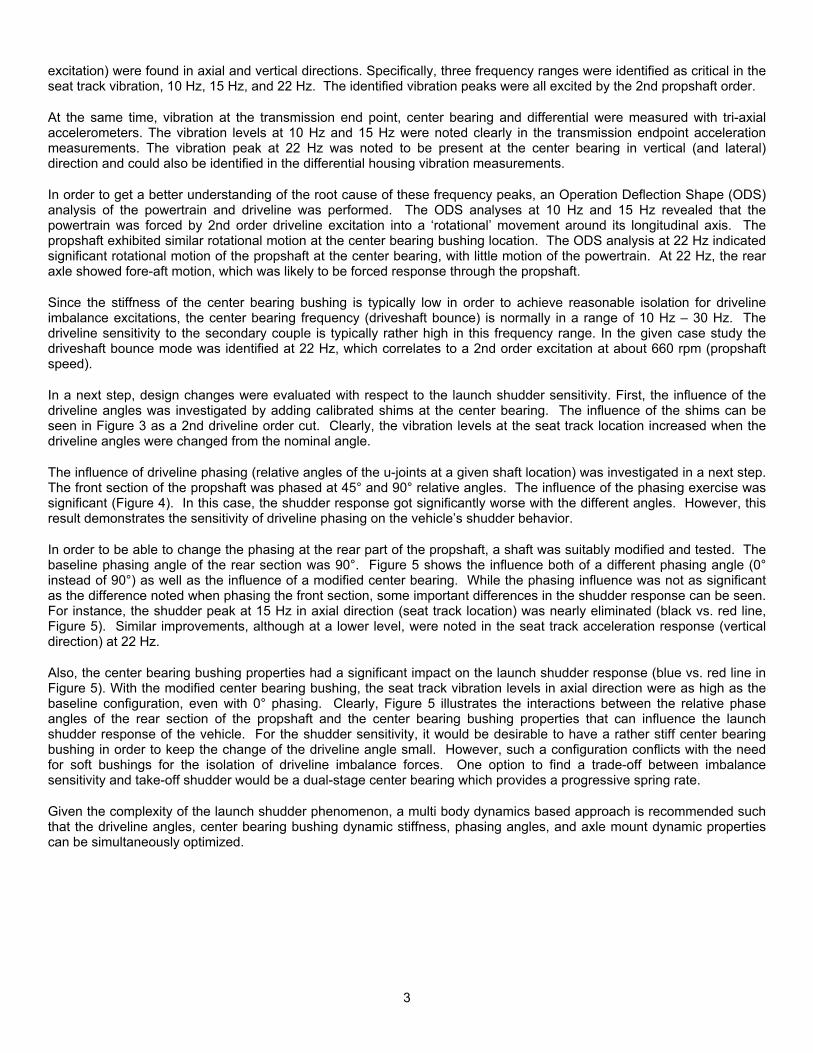
In a next step, design changes were evaluated with respect to the launch shudder sensitivity. First, the influence of the driveline angles was investigated by adding calibrated shims at the center bearing. The influence of the shims can be seen in Figure 3 as a 2nd driveline order cut. Clearly, the vibration levels at the seat track location increased when the driveline angles were changed from the nominal angle.
The influence of driveline phasing (relative angles of the u-joints at a given shaft location) was investigated in a next step. The front section of the propshaft was phased at 45° and 90° relative angles. The influence of the phasing exercise was significant (Figure 4). In this case, the shudder response got significantly worse with the different angles. However, this result demonstrates the sensitivity of driveline phasing on the vehicle’s shudder behavior.
In order to be able to change the phasing at the rear part of the propshaft, a shaft was suitably modified and tested. The baseline phasing angle of the rear section was 90°. Figure 5 shows the influence both of a different phasing angle (0° instead of 90°) as well as the influence of a modified center bearing. While the phasing influence was not as significant as the difference noted when phasing the front section, some important differences in the shudder response can be seen. For instance, the shudder peak at 15 Hz in axial direction (seat track location) was nearly eliminated (black vs. red line, Figure 5). Similar improvements, although at a lower level, were noted in the seat track acceleration response (vertical direction) at 22 Hz.
Also, the center bearing bushing properties had a significant impact on the launch shudder response (blue vs. red line in Figure 5). With the modified center bearing bushing, the seat track vibration levels in axial direction were as high as the baseline configuration, even with 0° phasing. Clearly, Figure 5 illustrates the interactions between the relative phase angles of the rear section of the propshaft and the center bearing bushing properties that can influence the launch shudder response of the vehicle. For the shudder sensitivity, it would be desirable to have a rather stiff center bearing bushing in order to keep the change of the driveline angle small. However, such a configuration conflicts with the need for soft bushings for the isolation of driveline imbalance forces. One option to find a trade-off between imbalance sensitivity and take-off shudder would be a dual-stage center bearing which provides a progressive spring rate.
Given the complexity of the launch shudder phenomenon, a multi body dynamics based approach is recommended such that the driveline angles, center bearing bushing dynamic stiffness, phasing angles, and axle mount dynamic properties can be simultaneously optimized.
4
Figure 3: Influence of Driveline Angles
Figure 4: Influence of Phasing Angle at the Front Section of the Propshaft
Figure 5: Influence of Center Bearing Bushing and Phasing Angle at the Rear Section of the Propshaft
DRIVELINE BOOM
Boom is an objectionable low frequency noise in the vehicle compartment, which can dominate the overall noise level. Often, a boom noise is caused by driveline resonances, which get excited by the main engine orders. This can be the firing order and its harmonics as well as engine mass forces and moments. In order to understand the root cause of driveline-induced boom, both the driveline dynamics as well as the excitation mechanisms need to be understood. This can be done using CAE methods, testing or using a hybrid approach. Examples of driveline torsional models and associated model correlation can be found in published literature (e.g., [8]).
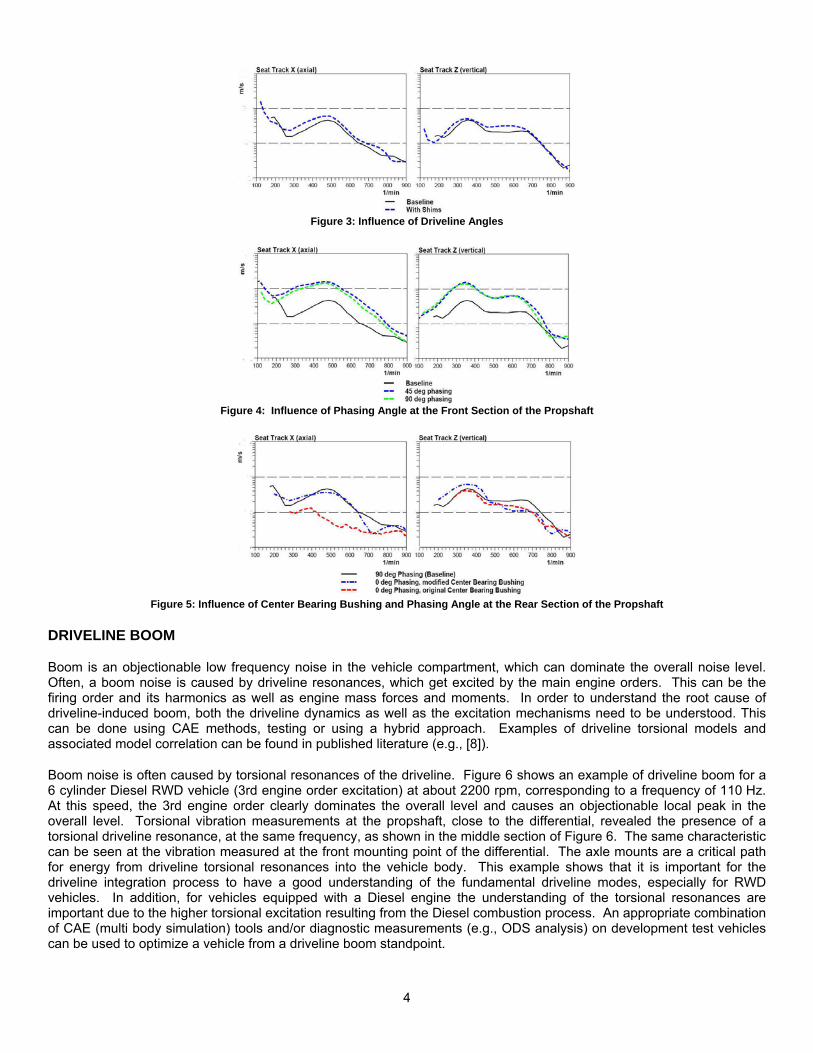
Boom noise is often caused by torsional resonances of the driveline. Figure 6 shows an example of driveline boom for a 6 cylinder Diesel RWD vehicle (3rd engine order excitation) at about 2200 rpm, corresponding to a frequency of 110 Hz. At this speed, the 3rd engine order clearly dominates the overall level and causes an objectionable local peak in the overall level. Torsional vibration measurements at the propshaft, close to the differential, revealed the presence of a torsional driveline resonance, at the same frequency, as shown in the middle section of Figure 6. The same characteristic can be seen at the vibration measured at the front mounting point of the differential. The axle mounts are a critical path for energy from driveline torsional resonances into the vehicle body. This example shows that it is important for the driveline integration process to have a good understanding of the fundamental driveline modes, especially for RWD vehicles. In addition, for vehicles equipped with a Diesel engine the understanding of the torsional resonances are important due to the higher torsional excitation resulting from the Diesel combustion process. An appropriate combination of CAE (multi body simulation) tools and/or diagnostic measurements (e.g., ODS analysis) on development test vehicles can be used to optimize a vehicle from a driveline boom standpoint.
5
Figure 6: 3rd Engine Order, Interior Noise, Propshaft Torsional Vibration and Differential Mounting Point Vibration
DRIVELINE CAE STUDY
In the following case study example on driveline-induced boom, the use of a full vehicle model allowed for determination of the mount forces at the connecting points to the body. The mount forces were combined with a time-domain based transfer path synthesis approach to simulate the interior noise behavior so that appropriate countermeasures for the boom noise could be developed. The details of the CAE approach are provided in the following sections.
Driveline Model
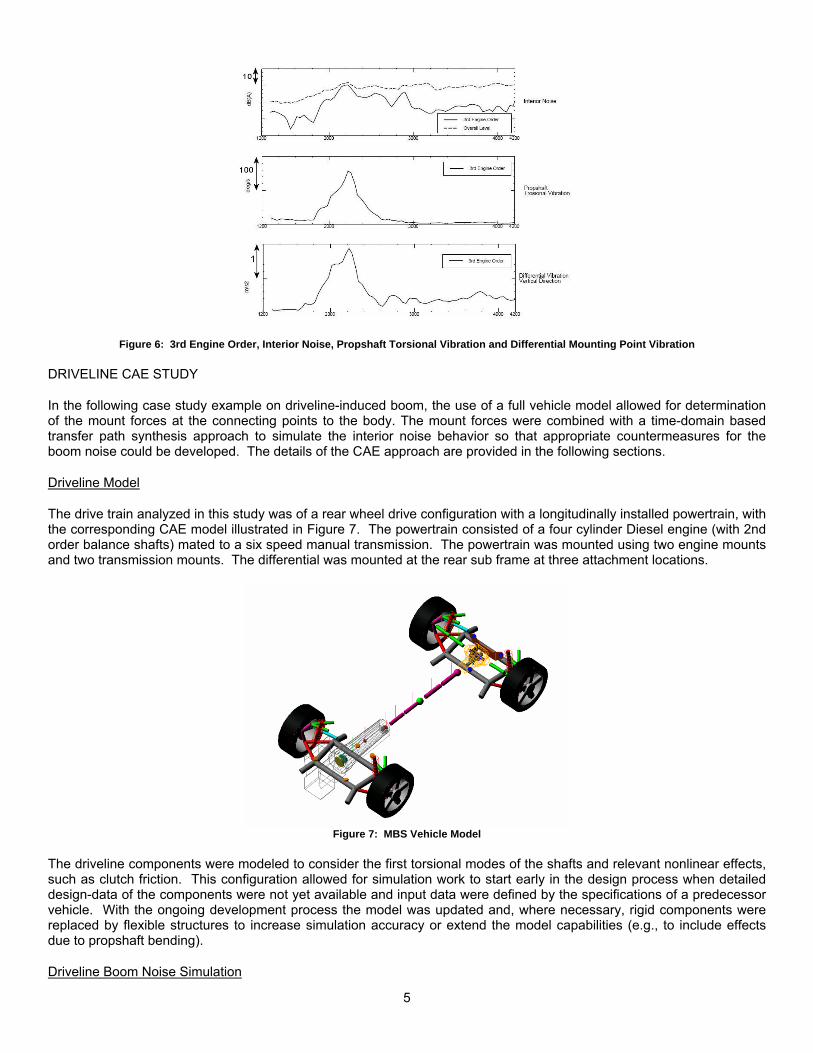
The drive train analyzed in this study was of a rear wheel drive configuration with a longitudinally installed powertrain, with the corresponding CAE model illustrated in Figure 7. The powertrain consisted of a four cylinder Diesel engine (with 2nd order balance shafts) mated to a six speed manual transmission. The powertrain was mounted using two engine mounts and two transmission mounts. The differential was mounted at the rear sub frame at three attachment locations.
Figure 7: MBS Vehicle Model
The driveline components were modeled to consider the first torsional modes of the shafts and relevant nonlinear effects, such as clutch friction. This configuration allowed for simulation work to start early in the design process when detailed design-data of the components were not yet available and input data were defined by the specifications of a predecessor vehicle. With the ongoing development process the model was updated and, where necessary, rigid components were replaced by flexible structures to increase simulation accuracy or extend the model capabilities (e.g., to include effects due to propshaft bending).
Driveline Boom Noise Simulation
6
In rear wheel driven vehicles driveline-induced boom noise is frequently caused by high torsional irregularities at the rear differential, causing the differential (axle) to pitch and roll, leading to high dynamic forces at the differential mounts. These forces excite the vehicle body, either directly or via the sub-frame, depending on the installation of the differential. The frequency range for this phenomenon lies between approximately 40 Hz to 120 Hz.
The 2nd order speed irregularity at the rear propshaft was plotted versus engine speed. The baseline drivetrain configuration showed a resonance at 1580 rpm (engine speed) corresponding to a frequency of 53 Hz. High speed irregularities appear at this engine speed due to the high 2nd order excitation of the Diesel engine.
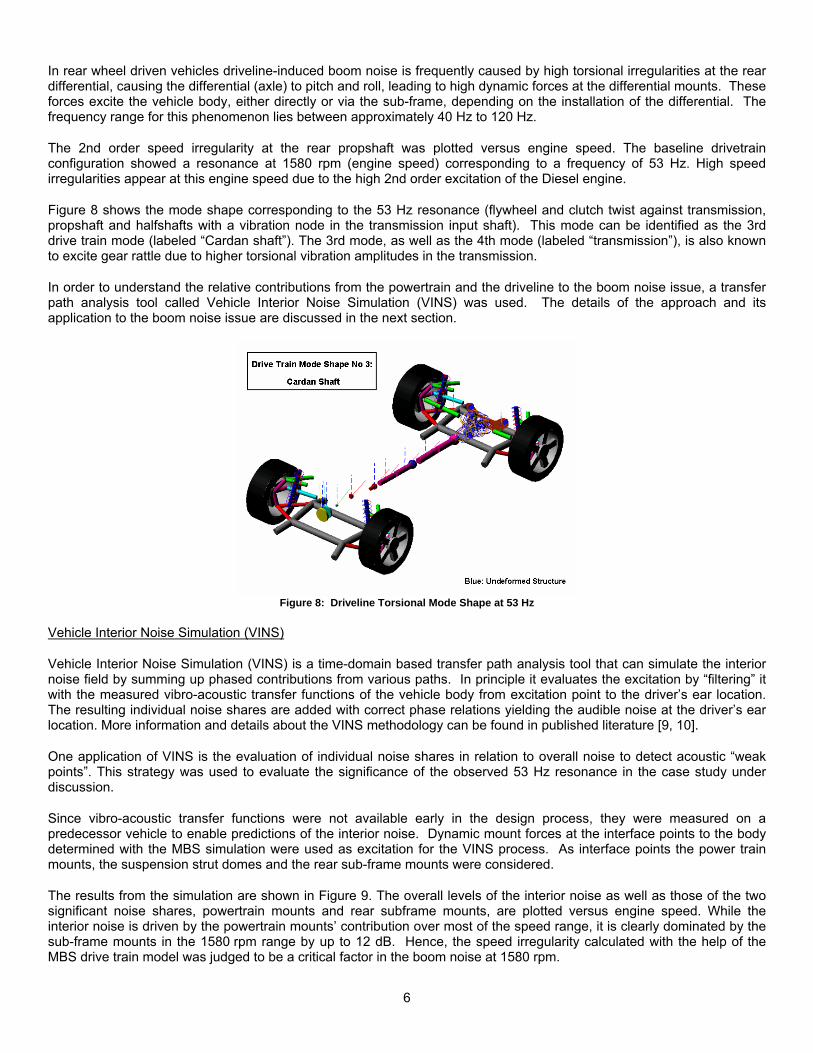
Figure 8 shows the mode shape corresponding to the 53 Hz resonance (flywheel and clutch twist against transmission, propshaft and halfshafts with a vibration node in the transmission input shaft). This mode can be identified as the 3rd drive train mode (labeled “Cardan shaft”). The 3rd mode, as well as the 4th mode (labeled “transmission”), is also known to excite gear rattle due to higher torsional vibration amplitudes in the transmission.
In order to understand the relative contributions from the powertrain and the driveline to the boom noise issue, a transfer path analysis tool called Vehicle Interior Noise Simulation (VINS) was used. The details of the approach and its application to the boom noise issue are discussed in the next section.
Figure 8: Driveline Torsional Mode Shape at 53 Hz
Vehicle Interior Noise Simulation (VINS)
Vehicle Interior Noise Simulation (VINS) is a time-domain based transfer path analysis tool that can simulate the interior noise field by summing up phased contributions from various paths. In principle it evaluates the excitation by “filtering” it with the measured vibro-acoustic transfer functions of the vehicle body from excitation point to the driver’s ear location. The resulting individual noise shares are added with correct phase relations yielding the audible noise at the driver’s ear location. More information and details about the VINS methodology can be found in published literature [9, 10].
One application of VINS is the evaluation of individual noise shares in relation to overall noise to detect acoustic “weak points”. This strategy was used to evaluate the significance of the observed 53 Hz resonance in the case study under discussion.
Since vibro-acoustic transfer functions were not available early in the design process, they were measured on a predecessor vehicle to enable predictions of the interior noise. Dynamic mount forces at the interface points to the body determined with the MBS simulation were used as excitation for the VINS process. As interface points the power train mounts, the suspension strut domes and the rear sub-frame mounts were considered.
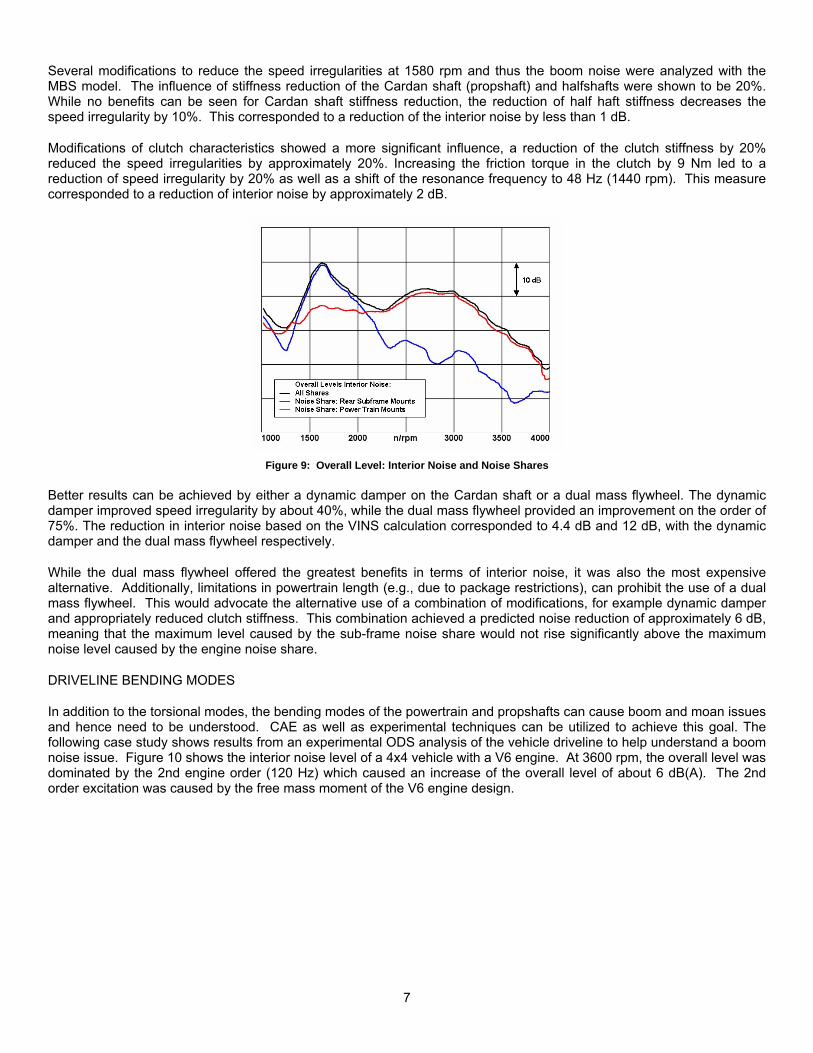
The results from the simulation are shown in Figure 9. The overall levels of the interior noise as well as those of the two significant noise shares, powertrain mounts and rear subframe mounts, are plotted versus engine speed. While the interior noise is driven by the powertrain mounts’ contribution over most of the speed range, it is clearly dominated by the sub-frame mounts in the 1580 rpm range by up to 12 dB. Hence, the speed irregularity calculated with the help of the MBS drive train model was judged to be a critical factor in the boom noise at 1580 rpm.
7
Several modifications to reduce the speed irregularities at 1580 rpm and thus the boom noise were analyzed with the MBS model. The influence of stiffness reduction of the Cardan shaft (propshaft) and halfshafts were shown to be 20%. While no benefits can be seen for Cardan shaft stiffness reduction, the reduction of half haft stiffness decreases the speed irregularity by 10%. This corresponded to a reduction of the interior noise by less than 1 dB.
Modifications of clutch characteristics showed a more significant influence, a reduction of the clutch stiffness by 20% reduced the speed irregularities by approximately 20%. Increasing the friction torque in the clutch by 9 Nm led to a reduction of speed irregularity by 20% as well as a shift of the resonance frequency to 48 Hz (1440 rpm). This measure corresponded to a reduction of interior noise by approximately 2 dB.
Figure 9: Overall Level: Interior Noise and Noise Shares
Better results can be achieved by either a dynamic damper on the Cardan shaft or a dual mass flywheel. The dynamic damper improved speed irregularity by about 40%, while the dual mass flywheel provided an improvement on the order of 75%. The reduction in interior noise based on the VINS calculation corresponded to 4.4 dB and 12 dB, with the dynamic damper and the dual mass flywheel respectively.
While the dual mass flywheel offered the greatest benefits in terms of interior noise, it was also the most expensive alternative. Additionally, limitations in powertrain length (e.g., due to package restrictions), can prohibit the use of a dual mass flywheel. This would advocate the alternative use of a combination of modifications, for example dynamic damper and appropriately reduced clutch stiffness. This combination achieved a predicted noise reduction of approximately 6 dB, meaning that the maximum level caused by the sub-frame noise share would not rise significantly above the maximum noise level caused by the engine noise share.
DRIVELINE BENDING MODES
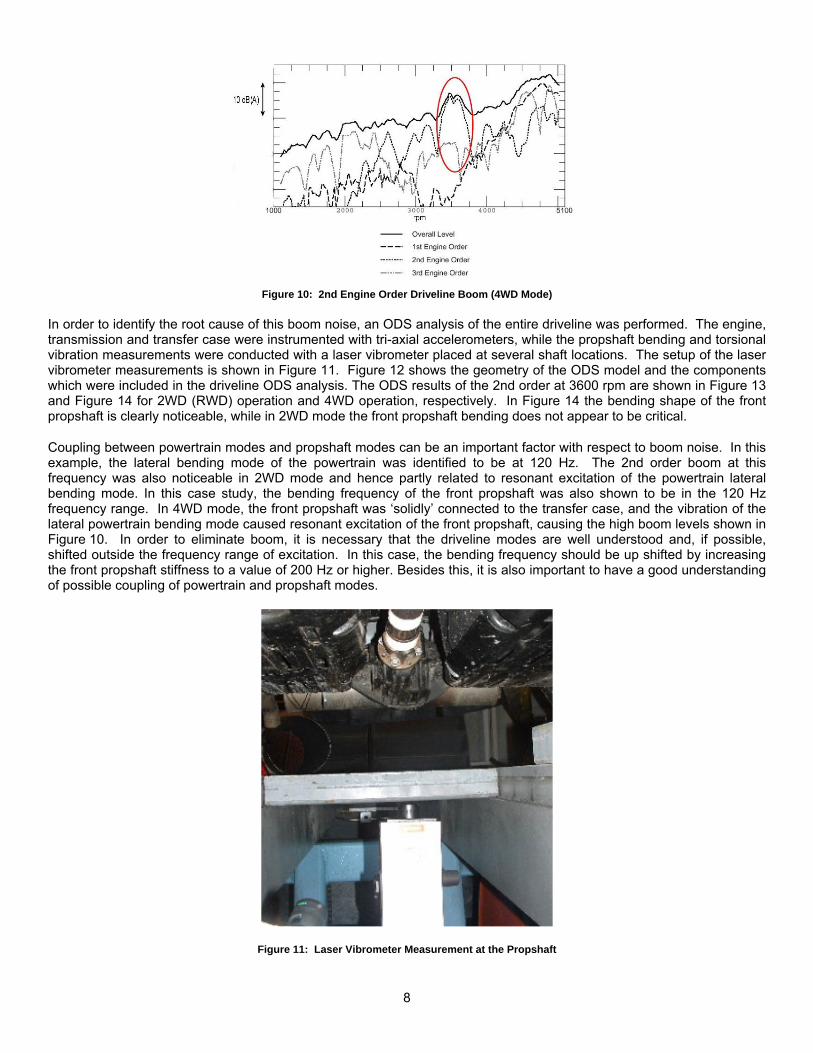
In addition to the torsional modes, the bending modes of the powertrain and propshafts can cause boom and moan issues and hence need to be understood. CAE as well as experimental techniques can be utilized to achieve this goal. The following case study shows results from an experimental ODS analysis of the vehicle driveline to help understand a boom noise issue. Figure 10 shows the interior noise level of a 4x4 vehicle with a V6 engine. At 3600 rpm, the overall level was dominated by the 2nd engine order (120 Hz) which caused an increase of the overall level of about 6 dB(A). The 2nd order excitation was caused by the free mass moment of the V6 engine design.
8
Figure 10: 2nd Engine Order Driveline Boom (4WD Mode)
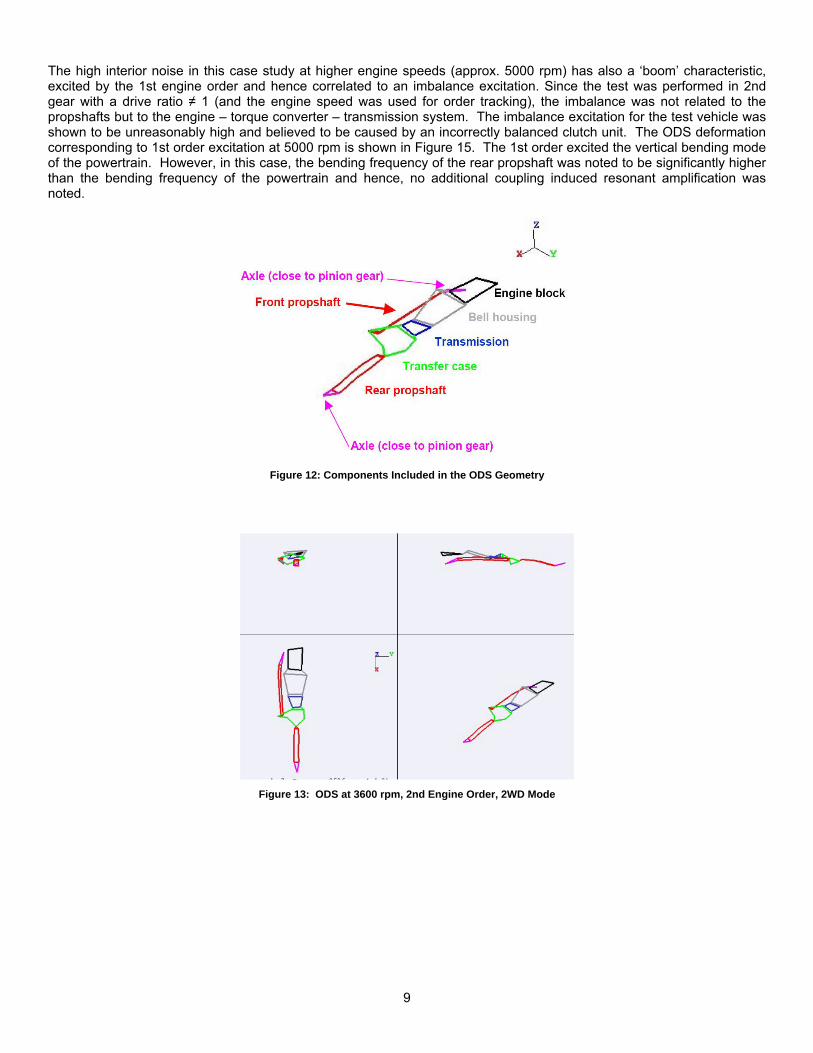
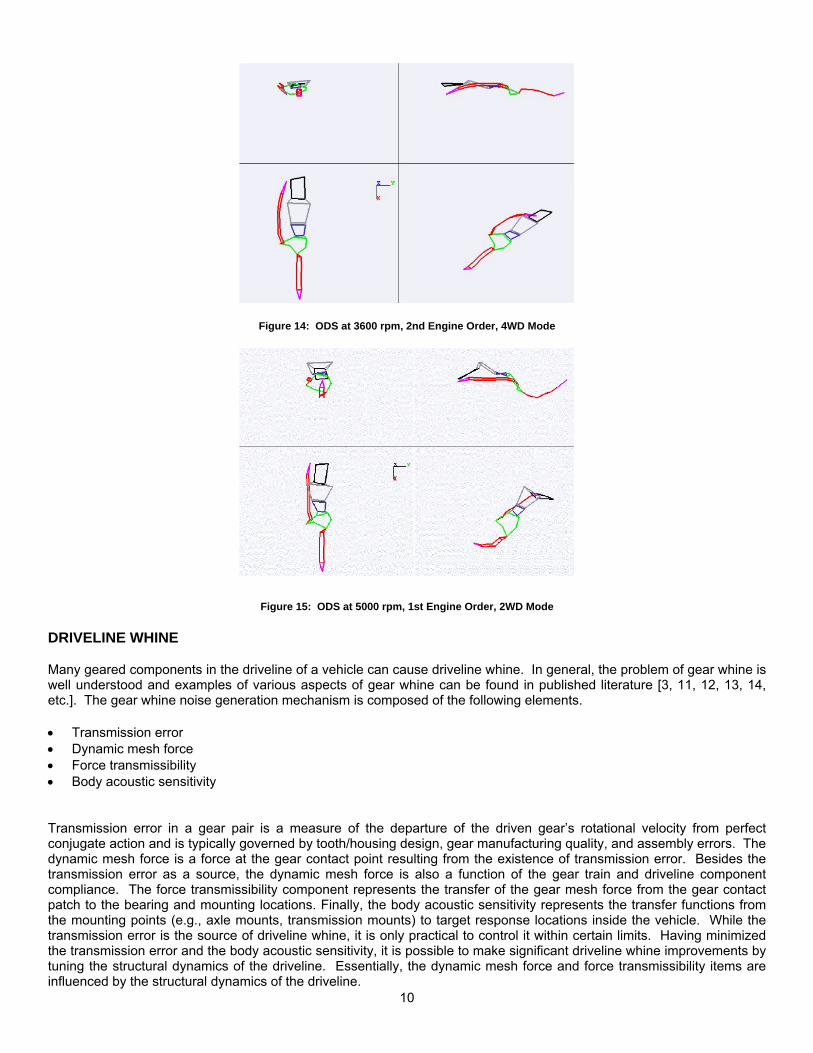
In order to identify the root cause of this boom noise, an ODS analysis of the entire driveline was performed. The engine, transmission and transfer case were instrumented with tri-axial accelerometers, while the propshaft bending and torsional vibration measurements were conducted with a laser vibrometer placed at several shaft locations. The setup of the laser vibrometer measurements is shown in Figure 11. Figure 12 shows the geometry of the ODS model and the components which were included in the driveline ODS analysis. The ODS results of the 2nd order at 3600 rpm are shown in Figure 13 and Figure 14 for 2WD (RWD) operation and 4WD operation, respectively. In Figure 14 the bending shape of the front propshaft is clearly noticeable, while in 2WD mode the front propshaft bending does not appear to be critical.
Coupling between powertrain modes and propshaft modes can be an important factor with respect to boom noise. In this example, the lateral bending mode of the powertrain was identified to be at 120 Hz. The 2nd order boom at this frequency was also noticeable in 2WD mode and hence partly related to resonant excitation of the powertrain lateral bending mode. In this case study, the bending frequency of the front propshaft was also shown to be in the 120 Hz frequency range. In 4WD mode, the front propshaft was ‘solidly’ connected to the transfer case, and the vibration of the lateral powertrain bending mode caused resonant excitation of the front propshaft, causing the high boom levels shown in Figure 10. In order to eliminate boom, it is necessary that the driveline modes are well understood and, if possible, shifted outside the frequency range of excitation. In this case, the bending frequency should be up shifted by increasing the front propshaft stiffness to a value of 200 Hz or higher. Besides this, it is also important to have a good understanding of possible coupling of powertrain and propshaft modes.
Figure 11: Laser Vibrometer Measurement at the Propshaft
9
The high interior noise in this case study at higher engine speeds (approx. 5000 rpm) has also a ‘boom’ characteristic, excited by the 1st engine order and hence correlated to an imbalance excitation. Since the test was performed in 2nd gear with a drive ratio ≠ 1 (and the engine speed was used for order tracking), the imbalance was not related to the propshafts but to the engine – torque converter – transmission system. The imbalance excitation for the test vehicle was shown to be unreasonably high and believed to be caused by an incorrectly balanced clutch unit. The ODS deformation corresponding to 1st order excitation at 5000 rpm is shown in Figure 15. The 1st order excited the vertical bending mode of the powertrain. However, in this case, the bending frequency of the rear propshaft was noted to be significantly higher than the bending frequency of the powertrain and hence, no additional coupling induced resonant amplification was noted.
Figure 12: Components Included in the ODS Geometry
Figure 13: ODS at 3600 rpm, 2nd Engine Order, 2WD Mode
10
Figure 14: ODS at 3600 rpm, 2nd Engine Order, 4WD Mode
Figure 15: ODS at 5000 rpm, 1st Engine Order, 2WD Mode
DRIVELINE WHINE
Many geared components in the driveline of a vehicle can cause driveline whine. In general, the problem of gear whine is well understood and examples of various aspects of gear whine can be found in published literature [3, 11, 12, 13, 14, etc.]. The gear whine noise generation mechanism is composed of the following elements.
• Transmission error • Dynamic mesh force • Force transmissibility • Body acoustic sensitivity
Transmission error in a gear pair is a measure of the departure of the driven gear’s rotational velocity from perfect conjugate action and is typically governed by tooth/housing design, gear manufacturing quality, and assembly errors. The dynamic mesh force is a force at the gear contact point resulting from the existence of transmission error. Besides the transmission error as a source, the dynamic mesh force is also a function of the gear train and driveline component compliance. The force transmissibility component represents the transfer of the gear mesh force from the gear contact patch to the bearing and mounting locations. Finally, the body acoustic sensitivity represents the transfer functions from the mounting points (e.g., axle mounts, transmission mounts) to target response locations inside the vehicle. While the transmission error is the source of driveline whine, it is only practical to control it within certain limits. Having minimized the transmission error and the body acoustic sensitivity, it is possible to make significant driveline whine improvements by tuning the structural dynamics of the driveline. Essentially, the dynamic mesh force and force transmissibility items are influenced by the structural dynamics of the driveline.
11
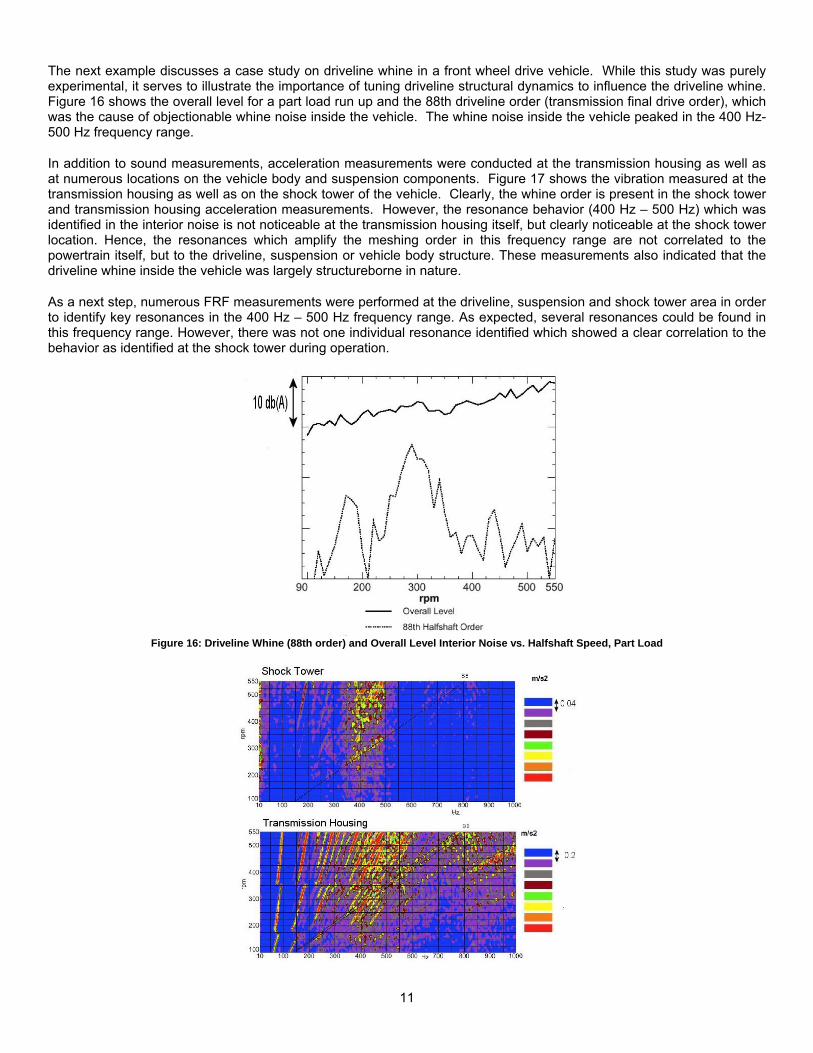
The next example discusses a case study on driveline whine in a front wheel drive vehicle. While this study was purely experimental, it serves to illustrate the importance of tuning driveline structural dynamics to influence the driveline whine. Figure 16 shows the overall level for a part load run up and the 88th driveline order (transmission final drive order), which was the cause of objectionable whine noise inside the vehicle. The whine noise inside the vehicle peaked in the 400 Hz- 500 Hz frequency range.
In addition to sound measurements, acceleration measurements were conducted at the transmission housing as well as at numerous locations on the vehicle body and suspension components. Figure 17 shows the vibration measured at the transmission housing as well as on the shock tower of the vehicle. Clearly, the whine order is present in the shock tower and transmission housing acceleration measurements. However, the resonance behavior (400 Hz – 500 Hz) which was identified in the interior noise is not noticeable at the transmission housing itself, but clearly noticeable at the shock tower location. Hence, the resonances which amplify the meshing order in this frequency range are not correlated to the powertrain itself, but to the driveline, suspension or vehicle body structure. These measurements also indicated that the driveline whine inside the vehicle was largely structureborne in nature.
As a next step, numerous FRF measurements were performed at the driveline, suspension and shock tower area in order to identify key resonances in the 400 Hz – 500 Hz frequency range. As expected, several resonances could be found in this frequency range. However, there was not one individual resonance identified which showed a clear correlation to the behavior as identified at the shock tower during operation.
Figure 16: Driveline Whine (88th order) and Overall Level Interior Noise vs. Halfshaft Speed, Part Load
12
Figure 17: Vibration Measurements at the Shock Tower and Transmission Housing
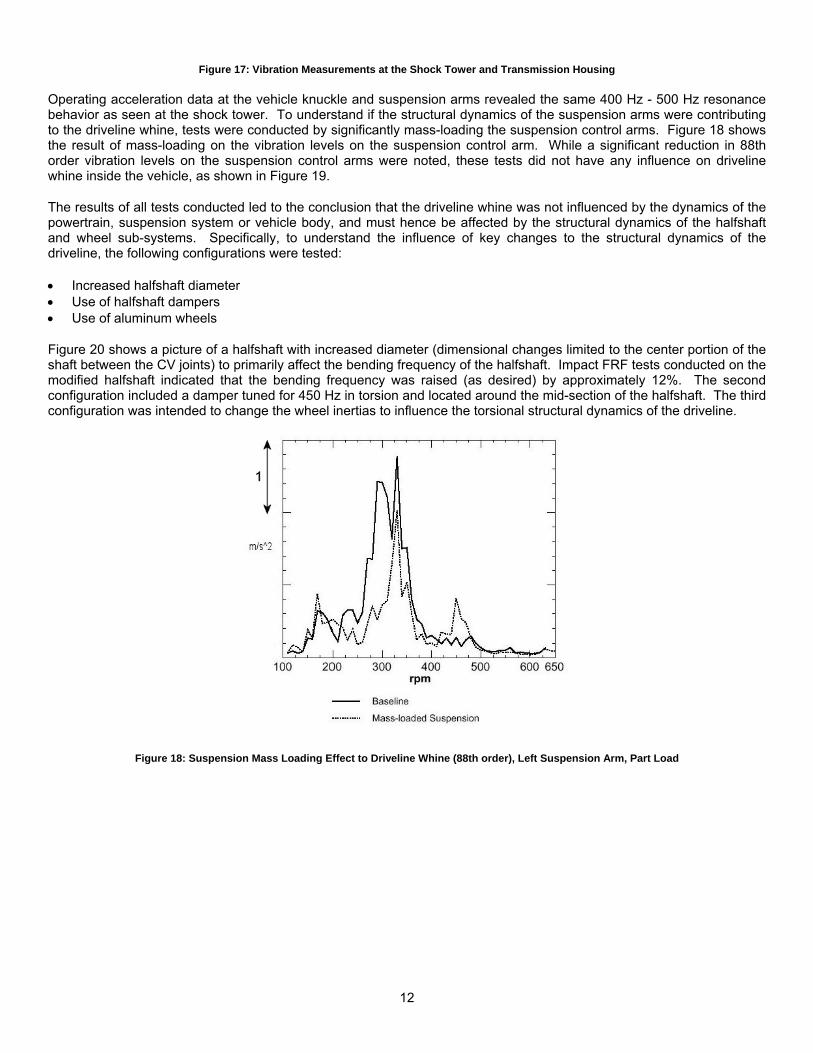
Operating acceleration data at the vehicle knuckle and suspension arms revealed the same 400 Hz - 500 Hz resonance behavior as seen at the shock tower. To understand if the structural dynamics of the suspension arms were contributing to the driveline whine, tests were conducted by significantly mass-loading the suspension control arms. Figure 18 shows the result of mass-loading on the vibration levels on the suspension control arm. While a significant reduction in 88th order vibration levels on the suspension control arms were noted, these tests did not have any influence on driveline whine inside the vehicle, as shown in Figure 19.
The results of all tests conducted led to the conclusion that the driveline whine was not influenced by the dynamics of the powertrain, suspension system or vehicle body, and must hence be affected by the structural dynamics of the halfshaft and wheel sub-systems. Specifically, to understand the influence of key changes to the structural dynamics of the driveline, the following configurations were tested:
• Increased halfshaft diameter • Use of halfshaft dampers • Use of aluminum wheels
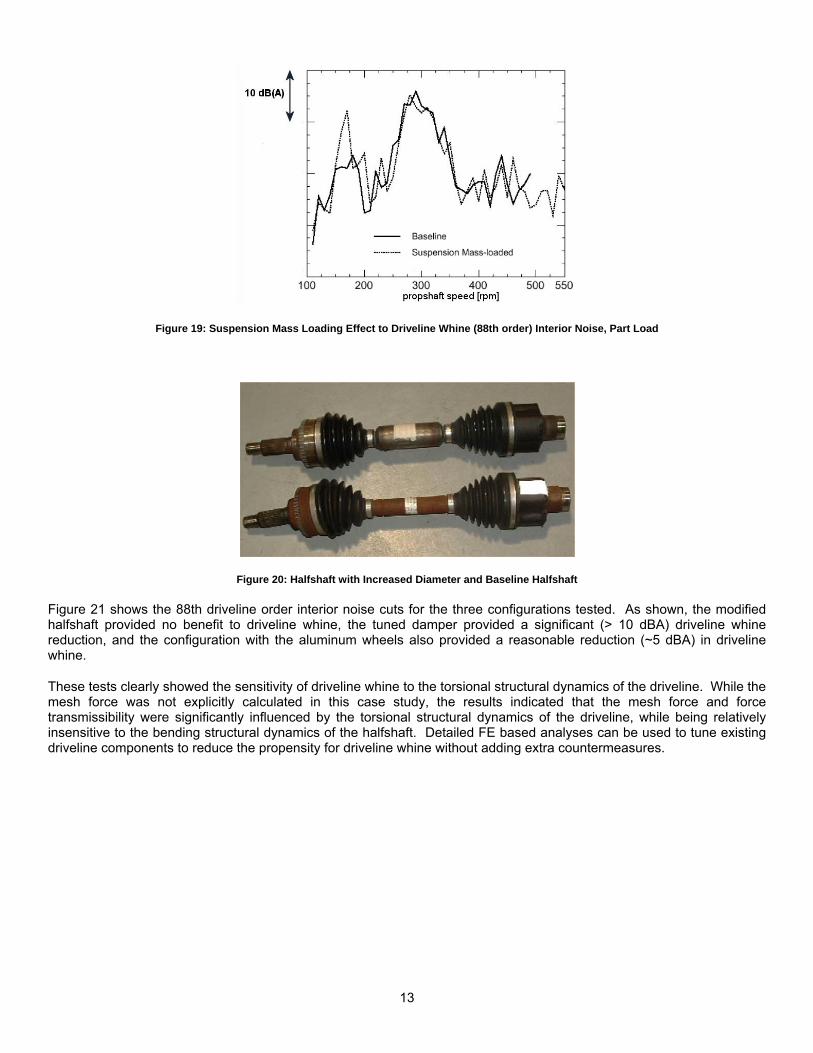
Figure 20 shows a picture of a halfshaft with increased diameter (dimensional changes limited to the center portion of the shaft between the CV joints) to primarily affect the bending frequency of the halfshaft. Impact FRF tests conducted on the modified halfshaft indicated that the bending frequency was raised (as desired) by approximately 12%. The second configuration included a damper tuned for 450 Hz in torsion and located around the mid-section of the halfshaft. The third configuration was intended to change the wheel inertias to influence the torsional structural dynamics of the driveline.
Figure 18: Suspension Mass Loading Effect to Driveline Whine (88th order), Left Suspension Arm, Part Load
13
Figure 19: Suspension Mass Loading Effect to Driveline Whine (88th order) Interior Noise, Part Load
Figure 20: Halfshaft with Increased Diameter and Baseline Halfshaft
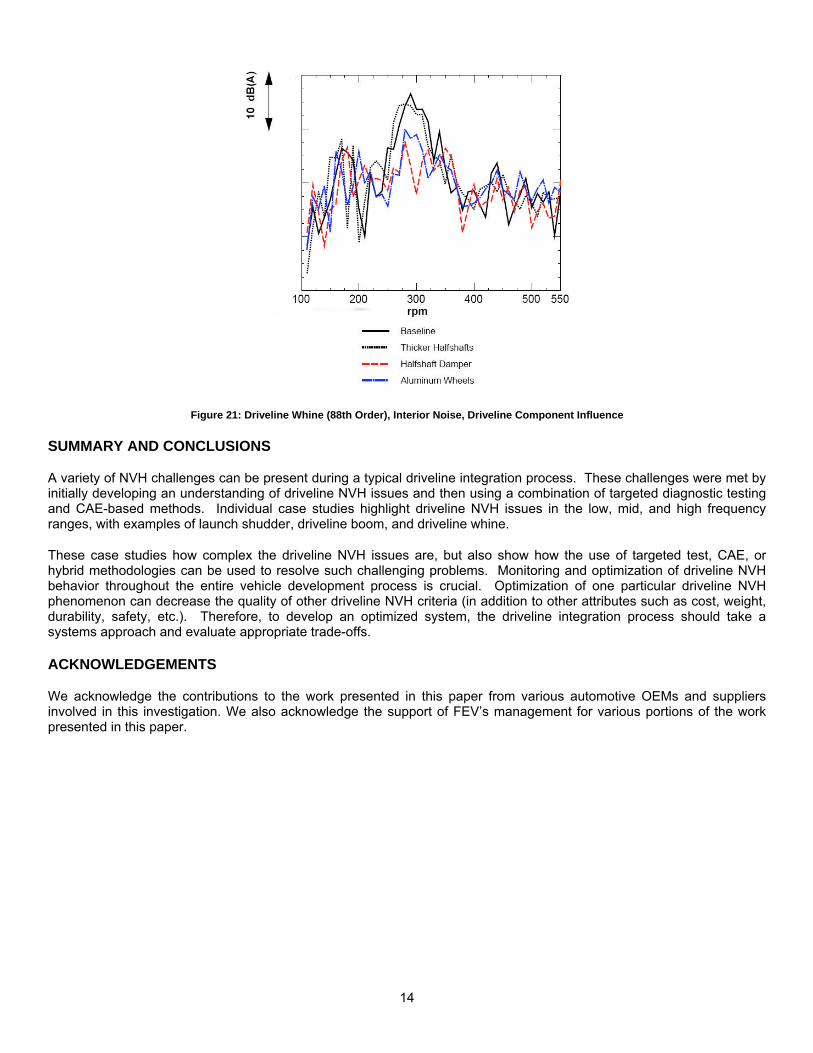
Figure 21 shows the 88th driveline order interior noise cuts for the three configurations tested. As shown, the modified halfshaft provided no benefit to driveline whine, the tuned damper provided a significant (> 10 dBA) driveline whine reduction, and the configuration with the aluminum wheels also provided a reasonable reduction (~5 dBA) in driveline whine.
These tests clearly showed the sensitivity of driveline whine to the torsional structural dynamics of the driveline. While the mesh force was not explicitly calculated in this case study, the results indicated that the mesh force and force transmissibility were significantly influenced by the torsional structural dynamics of the driveline, while being relatively insensitive to the bending structural dynamics of the halfshaft. Detailed FE based analyses can be used to tune existing driveline components to reduce the propensity for driveline whine without adding extra countermeasures.
14
Figure 21: Driveline Whine (88th Order), Interior Noise, Driveline Component Influence
SUMMARY AND CONCLUSIONS
A variety of NVH challenges can be present during a typical driveline integration process. These challenges were met by initially developing an understanding of driveline NVH issues and then using a combination of targeted diagnostic testing and CAE-based methods. Individual case studies highlight driveline NVH issues in the low, mid, and high frequency ranges, with examples of launch shudder, driveline boom, and driveline whine.
These case studies how complex the driveline NVH issues are, but also show how the use of targeted test, CAE, or hybrid methodologies can be used to resolve such challenging problems. Monitoring and optimization of driveline NVH behavior throughout the entire vehicle development process is crucial. Optimization of one particular driveline NVH phenomenon can decrease the quality of other driveline NVH criteria (in addition to other attributes such as cost, weight, durability, safety, etc.). Therefore, to develop an optimized system, the driveline integration process should take a systems approach and evaluate appropriate trade-offs.
ACKNOWLEDGEMENTS
We acknowledge the contributions to the work presented in this paper from various automotive OEMs and suppliers involved in this investigation. We also acknowledge the support of FEV’s management for various portions of the work presented in this paper.
15
REFERENCES:
1. Hagerodt, B., Untersuchungen zu Lastwechsel-reaktionen frontgetriebener Personenkraftwagen, Dissertation, RWTH Aachen, 1998
2. Bencker, R: Simulationstechnische und experimentelle Untersuchung von Lastwechselphänomenen an Fahrzeugen mit Standardantrieb, Dissertation, TU Dresden, 1998
3. Sun, Z; Steyer, G.C.; Ranek, M., FEA studies on axle system dynamics, SAE 2002-01-1190
4. Tohyama, M.; Ohmori, T.; Ueda, F., Anti-shudder mechanism of ATF additives at slip-controlled lock-up clutch, SAE 1999-01-3616
5. N.N, Universal joint and driveshaft design manual, SAE, Advances in Engineering series (AE) No. 7, Second Printing, 1991
6. Exner, W.: NVH phenomena in light truck drivelines, SAE 952641
7. Ries, R.: Der Antriebsstrang des Porsche Cayenne – Konzeptauslegung und schwingungstechnische Optimierung zur Erweiterung des Grenzbereichs von Offroadfähigkeit und Hochgeschwindigkeit, VDI Berichte Nr. 1749, 2003
8. Lückmann, T; Kücükay, F.: Simulation von Antriebsstrangschwingungen und des daraus entstehenden Innengeräuschs, Systemanalyse in der Kfz-Antriebstechnik II, 2003
9. Alt, N.; Wiehagen, N.; Schlitzer, M.: Interior Noise Simulation for Improved Vehicle Sound, SAE 2001-01-1539
10. Eisele, G.; Wolf, K.; Alt, N.; Hüser, M.: Application of Vehicle Interior Noise Simulation (VINS) for NVH Analysis of a Passenger Car, SAE 2005-01-2514
11. Donley, M.G.; Lim, T.C.; Steyer, G.C.: Dynamic analysis of automotive gearing systems, SAE 920762
12. Donley, M.G.; Stokes, W.; Neriya, S.; Monkaba, V.; Li, Y.: Modeling of a driveline system using a building block approach, SAE 1999-01-1762
13. Steyer, G.; Lim, T.: System dynamics in quiet gear design, Proceedings of the 9th international modal analysis conference, 1991
14. Sun, Z; Steyer, G; Ranek, M: FEA Studies on Axle System Dynamics, SAE 2002-01-1190