
WSO2Con USA 2015: Optimizing Service Platforms with SOA Governance
Upload
doankhuongCategory
view
212download
0
Optimizing Unity Games
for Mobile Platforms Angelo Theodorou
Software Engineer
Brains Eden, 28th June 2013

2
Agenda
Introduction
The author
ARM Ltd.
What do you need to have
What do you need to know
Identify the bottleneck
CPU
Vertex processing
Fragment processing
Bandwidth
The Unity Profiler (Pro only)
Example application overview
Geometry, LOD, Particles, Texture, Overdraw, Lights scenes

3
The Author
Angelo Theodorou
Software Engineer
Media Processing Division, ARM® Ltd.
Mali Ecosystem Use-Cases team
B.Sc. In Computer Science
Studied at Università degli Studi di Napoli “Federico II”, Italy
In my previous company I have worked on From Cheese
Website: http://www.fromcheese.com
Grand Prize winner at the Samsung Smart App Challenge 2012
Made with Unity 3.5
Responsible for SPen integration and additional programming

4
ARM Ltd.
Founded at the end of 1990, 13 engineers and a CEO
Main goal was to design low power embedded 32bit
processors, but to never build them
Now more than 2500 employees
More than 1000 in Cambridge, the headquarters
Hundreds of partners, a fundamental part of our business
The business model is based on licenses and royalties
ARM technology is everywhere: mobile, embedded,
enterprise, home

5
ARM – Cortex™ CPUs
Cortex-A
High performance application processors
Cortex-A50 series enables 64bit processing
Cortex-R
Real-time embedded processors
Cortex-M
Embedded processors for deterministic microcontroller applications
SecurCore™
Specialist processors utilized within the security markets
6
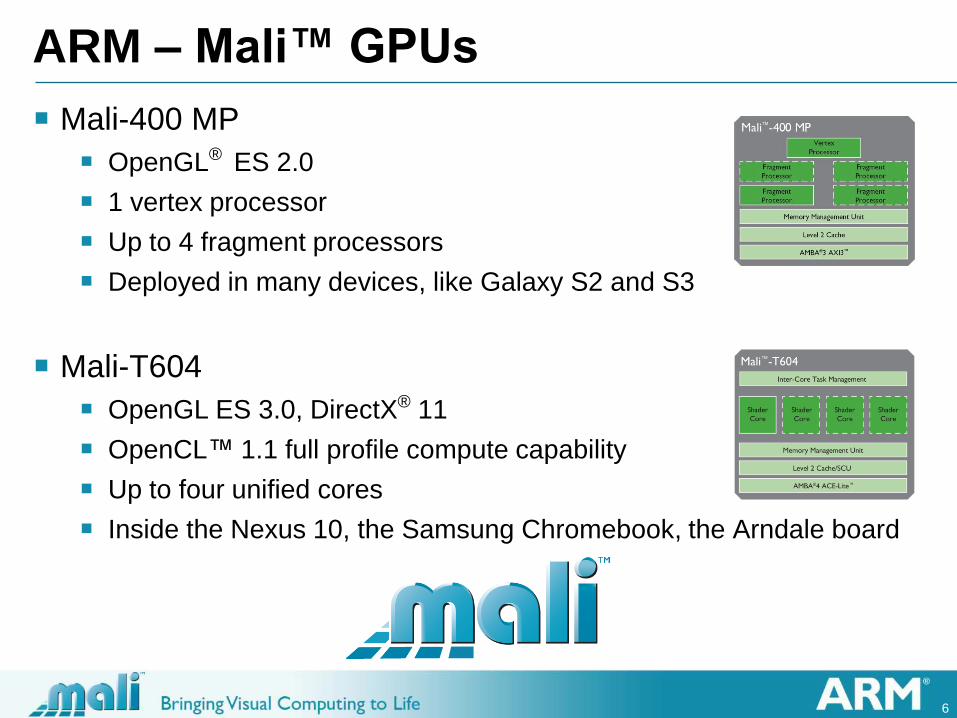
ARM – Mali™ GPUs
Mali-400 MP
OpenGL® ES 2.0
1 vertex processor
Up to 4 fragment processors
Deployed in many devices, like Galaxy S2 and S3
Mali-T604
OpenGL ES 3.0, DirectX® 11
OpenCL™ 1.1 full profile compute capability
Up to four unified cores
Inside the Nexus 10, the Samsung Chromebook, the Arndale board
7
What do you need to have
A computer with:
Java SE Development Kit (JDK)
Android SDK
ADB drivers (u20gt_adb.zip)
Unity Pro
An Android device connected to the computer via ADB
The example application APK

8
Android SDK
Website: http://developer.android.com/sdk
You don’t need Eclipse + ADT for Unity
1. Click on “Use an Existing IDE”
2. Click on “Download the SDK Tools for Windows”
3. Run the “Android SDK Manager” as Administrator
4. Install the Android SDK platform and build tools
5. Install at least one SDK Platform (API16 if you want to match the
Android version on the Cube U18GT-S tablet)
Unity supports r22 only since version 4.1.4

9
ADB Driver
The Android Debug Bridge (ADB) consists of a server
running on the device and a client accessed through a CLI
Add the platform-tools directory of the SDK to your path
Extract the u20gt_adb.zip archive
1. Enable USB debugging on the device (Settings -> Developer
options -> USB debugging)
2. Copy the “.android” directory in your home directory
3. Go to the Windows Device Manager
4. Locate the U18GT-S in “Other devices”
5. Install the driver for it pointing to the “usb_driver” subdirectory
6. After a correct installation you would see an “Android Composite
ADB Interface” in “Android Device”
7. Restart ADB and check the connection (adb kill-server and adb devices from the command line)

10
Unity Pro
Unity is a cross-platform game engine
You can deploy on PC, consoles, mobile devices, web browsers
Scripting based on Mono, supported languages:
JavaScript-like, Boo, C#
Pro version has support for:
Profiler
Level of Detail
Occlusion Culling
Light Probes
Static Batching
Latest version: 4.1.5 (June 2013)
Website: http://unity3d.com/

11
Android Device
Cube U18GT-S (http://www.51cube.com/en)
Rockchip RK3066
Dual-core Cortex™-A9 at 1.6GHz
Quad-core Mali™-400 at 250MHz
1GB DDR3 RAM
8GB Internal Storage
1024x600 7” 5-points capacitive screen
HDMI 1.4 interface
Android™ Jelly Bean 4.1.1

12
What do you need to know
What is a draw call
A call to a function of the underlying API (e.g. OpenGL ES) to draw
something on the screen
What is a fragment
A candidate pixel, it may or may not end up on screen for different
reasons (e.g. being discarded, being overwritten, etc.)
Differences between opaque and transparent render queue
Objects in the first queue are rendered in a front to back order to
minimize the overdraw thanks to the depth test, transparent ones are
rendered afterwards and in a back to front order
What does batching mean
Group similar draw calls in a single one operating on the whole data
Why mobile platforms are different
Immediate vs deferred rendering

13
Why mobile platforms are different
Desktop platforms
Immediate mode: graphics commands are executed when issued
Huge amount of bandwidth available between GPU and dedicated
video memory (>100 GB/s)
No strict limits in size, power consumption or heat generation
Mobile platforms
Deferred mode: graphics commands are collected by the driver and
issued later
Tile based: rendering occurs in a small on-chip buffer before being
written to memory
Bandwidth is severely reduced (~5 GB/s) and transferring data needs
a great amount of power
Memory is unified and shared between CPU and GPU
14
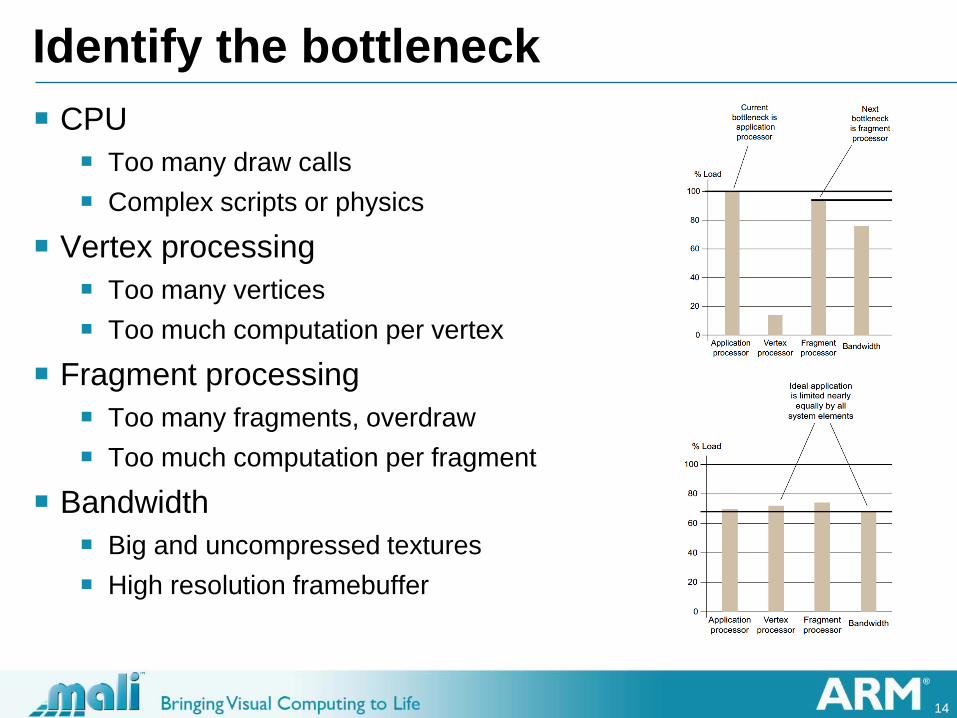
Identify the bottleneck
CPU
Too many draw calls
Complex scripts or physics
Vertex processing
Too many vertices
Too much computation per vertex
Fragment processing
Too many fragments, overdraw
Too much computation per fragment
Bandwidth
Big and uncompressed textures
High resolution framebuffer
15
CPU Bound
Too many draw calls
Static batching (Unity Pro only)
Dynamic batching (automatic)
Frustum culling (automatic)
Occlusion culling (Unity Pro only)
Complex scripts
Component caching
Pool of objects
Reduce Unity GUI calls
Complex physics
Compound colliders instead of mesh ones

16
CPU Bound – Batching and Culling
Make an object static to enable static batching (Unity Pro)
Occlusion culling (Unity Pro only)

17
CPU Bound – Compound colliders
Use compound colliders instead of mesh colliders if possible

18
Vertex Bound
Too many vertices in geometry
Remove unnecessary vertices
Use LOD switching through LODGroup (Unity Pro only)
Frustum culling (automatic)
Occlusion culling (Unity Pro only)
Too much computation per vertex
Use the mobile version of Unity shaders whenever you can

19
Vertex Bound – Level of Detail
Use LODGroup to limit vertex count when geometric detail is
not strictly needed (very far or small objects)

20
Fragment Bound
Overdraw
When you are drawing to each pixel on the screen more than once
Drawing your objects front to back instead of back to front reduces
overdraw, thanks to depth testing
Limit the amount of transparency in the scene (beware of particles!)
Unity has a render mode to show the amount of overdraw per pixel
Too much computation per fragment
Bake as much as you can (lightmaps, light probes, etc.)
Contain the number of per-pixel lights
Limit real-time shadows (only high end mobile devices, Unity 4 Pro)
Try to avoid full screen post-processing
Use the mobile version of Unity shaders whenever you can

21
Fragment Bound – Overdraw
Use the specific render mode to check the overdraw amount

22
Fragment Bound – Bake to textures
Try to bake dynamic effects in textures
23
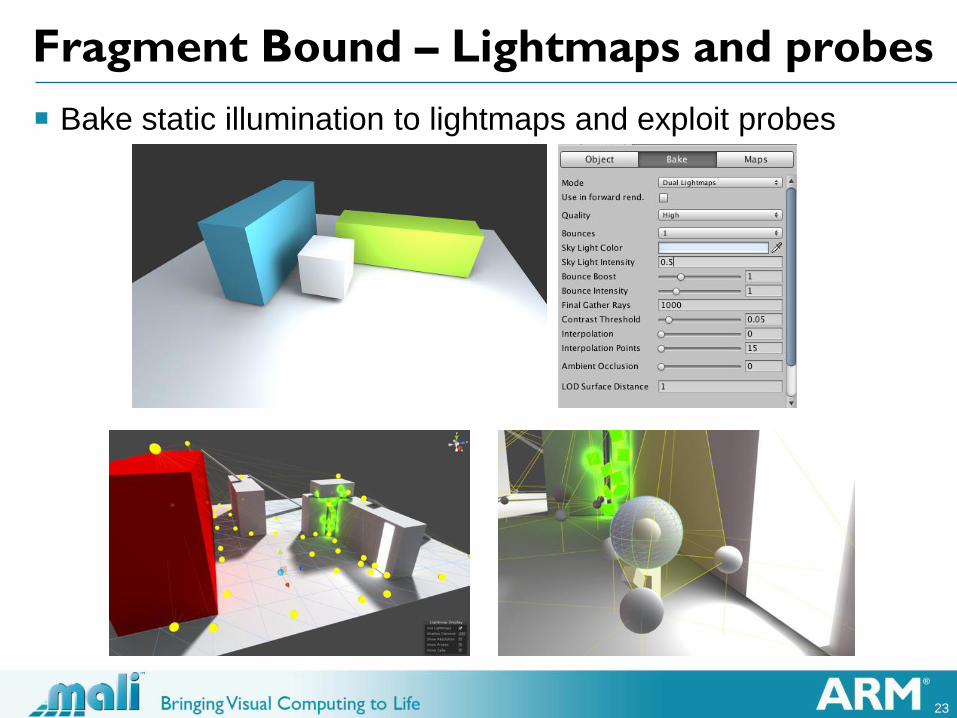
Fragment Bound – Lightmaps and probes
Bake static illumination to lightmaps and exploit probes

24
Bandwidth Bound
Use texture compression
ETC is the standard compressed format that comes with OpenGL ES
ASTC is the new Khronos standard soon to be supported by Unity
Use MIP maps
More memory but improved image quality (less aliasing artefacts)
Optimized memory bandwidth (when sampling from smaller maps)
Use trilinear and anisotropic filtering in moderation
Use Level of Detail techniques for geometry
25
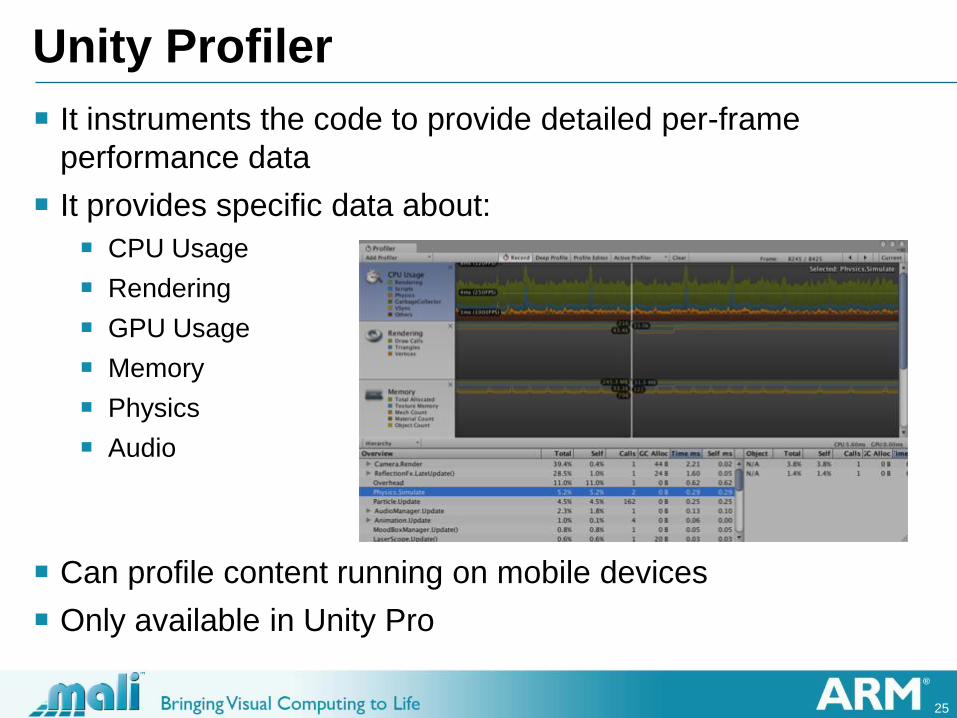
Unity Profiler
It instruments the code to provide detailed per-frame
performance data
It provides specific data about:
CPU Usage
Rendering
GPU Usage
Memory
Physics
Audio
Can profile content running on mobile devices
Only available in Unity Pro
26
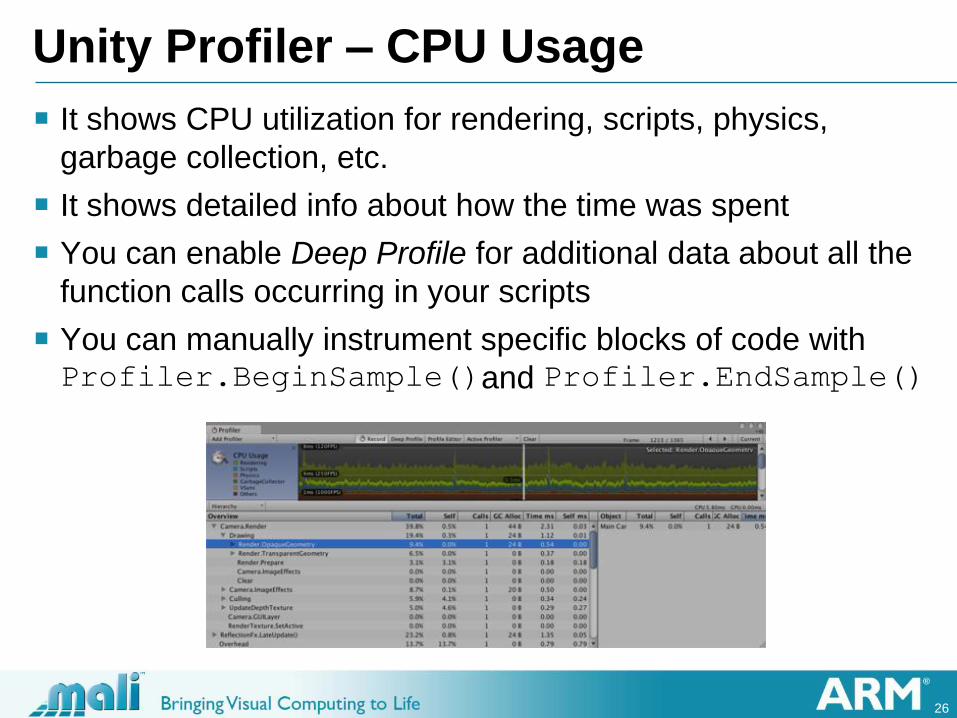
Unity Profiler – CPU Usage
It shows CPU utilization for rendering, scripts, physics,
garbage collection, etc.
It shows detailed info about how the time was spent
You can enable Deep Profile for additional data about all the
function calls occurring in your scripts
You can manually instrument specific blocks of code with Profiler.BeginSample()and Profiler.EndSample()

27
Unity Profiler – Rendering
Statistics about the rendering subsystem
Draw calls
Triangles
Vertices
The lower pane shows data similar to the rendering statistics
window of the editor

28
Unity Profiler – Memory
It shows memory used/reserved on a higher level
Unity native allocations
Garbage collected Mono managed allocations
Graphics and audio total used memory estimation
Memory used by the profiler data itself
It also shows memory used by assets/objects
Textures
Meshes
Materials
Animation clips
Audio clips

29
Unity Profiler – GPU Usage
It shows a contribution breakdown similar to the CPU profiler
Rendering of opaque objects
Rendering of transparent objects
Shadows
Deferred shading passes
Post processing
Not yet available on mobile platforms
30
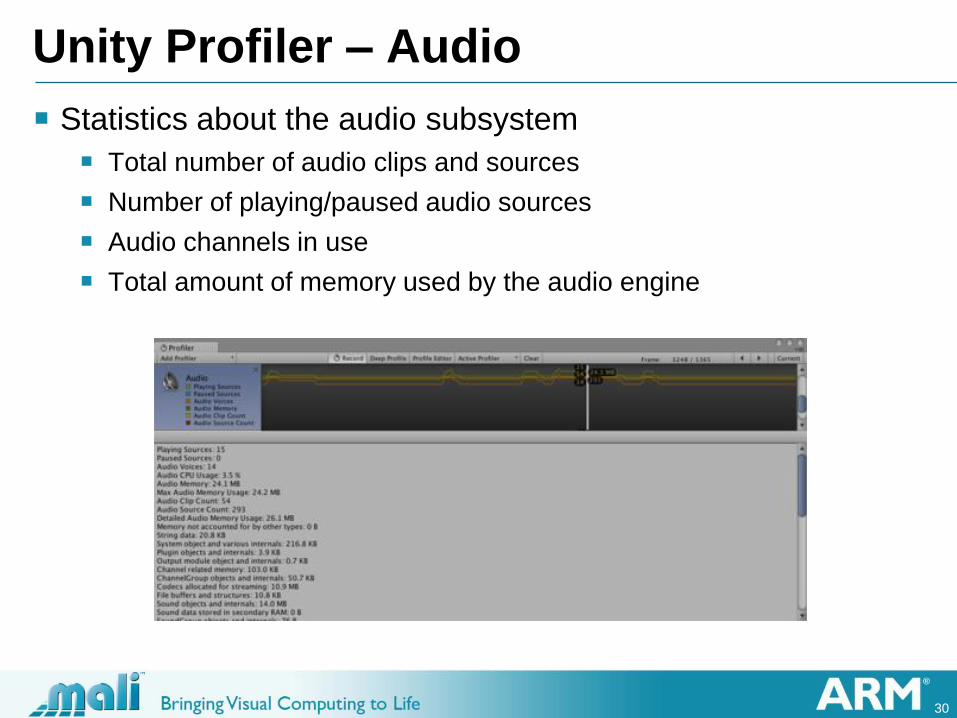
Unity Profiler – Audio
Statistics about the audio subsystem
Total number of audio clips and sources
Number of playing/paused audio sources
Audio channels in use
Total amount of memory used by the audio engine

31
Unity Profiler – Physics
Statistics about the physics simulation
Active rigid bodies (moving)
Sleeping rigid bodies (not processed by the physics engine)
Points of contact between all colliders
Number of static colliders
Number of dynamic colliders (attached to rigid bodies)
32
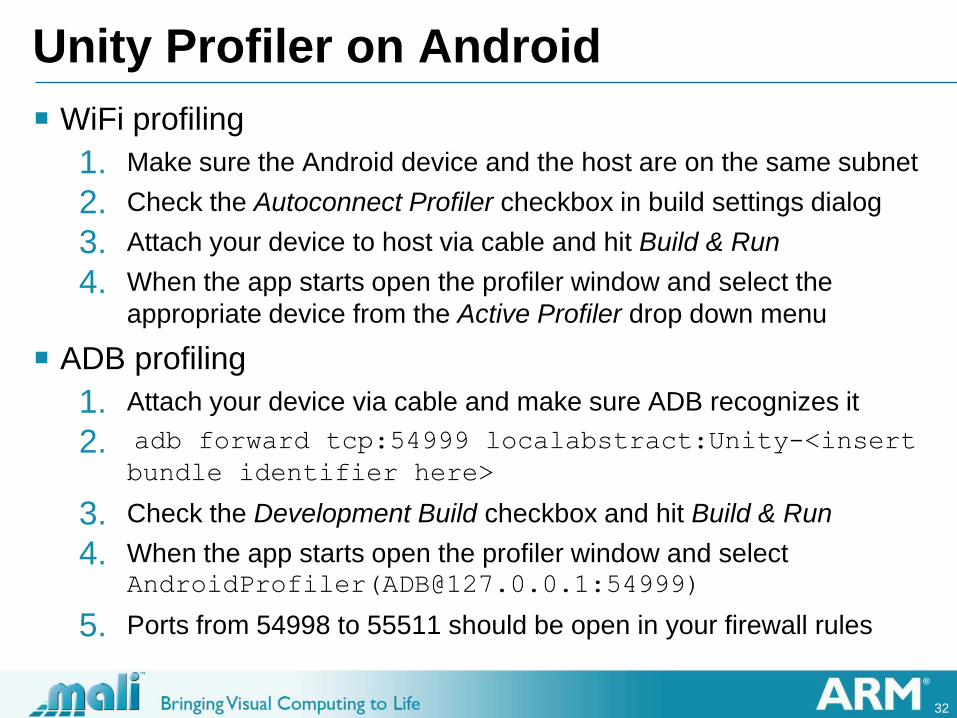
Unity Profiler on Android
WiFi profiling
1. Make sure the Android device and the host are on the same subnet
2. Check the Autoconnect Profiler checkbox in build settings dialog
3. Attach your device to host via cable and hit Build & Run
4. When the app starts open the profiler window and select the
appropriate device from the Active Profiler drop down menu
ADB profiling
1. Attach your device via cable and make sure ADB recognizes it
2. adb forward tcp:54999 localabstract:Unity-<insert
bundle identifier here>
3. Check the Development Build checkbox and hit Build & Run
4. When the app starts open the profiler window and select AndroidProfiler([email protected]:54999)
5. Ports from 54998 to 55511 should be open in your firewall rules

33
Example application overview
Made up of six different scenes
Geometry (high vertex count, frustum culling)
LOD (using level of detail through LODGroup)
Particles (transparent rendering)
Texture (MIP mapping and compression)
Overdraw (alpha blending and alpha test)
Lights (vertex and pixel lighting)
Most of them are based on a Prefab and Instantiate()
All instances are created at once in the beginning and deactivated
Number of active instances can adapt to maintain a target FPS value
Instantiation is made in screen space and based on camera aspect

34
Geometry Scene
Stressing the vertex units with lots of high poly objects
You can set the amount of visible objects or a target FPS value
It is possible to rotate and translate the camera to show
frustum culling in action (and lack of occlusion culling)

35
LOD Scene
LODGroup with three different levels
Triangles and vertices spikes match LOD level switch, draw
calls are dependent on frustum culling
Switching LOD

36
Particles Scene
All the rendering is done in the “Transparent Queue”
Perfect case of geometry batching (one draw call per emitter)
Geometry Scene Particles Scene

37
Texture Scene
Compressed texture with MIP maps (right) takes less
memory and looks better than uncompressed one (left)
Uncompressed, bilinear filtering ETC compressed, trilinear filtering, MIP mapped
38
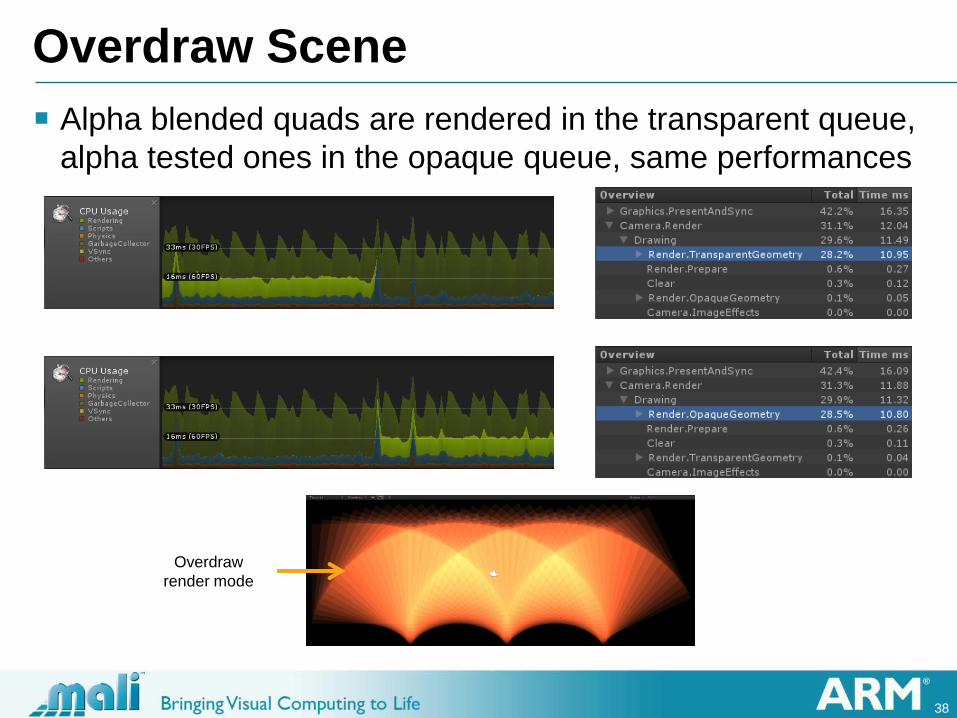
Overdraw Scene
Alpha blended quads are rendered in the transparent queue,
alpha tested ones in the opaque queue, same performances
Overdraw
render mode

39
Lights Scene (1/2)
Per-pixel lighting uses a draw call per light (forward
rendering)
Per-vertex lighting uses one geometric pass per object,
lighting information is a vertex attribute
4 lights, adding
more objects
4x250
lights, 1198
draw calls
3x250
lights, 966
draw calls
2x250
lights, 734
draw calls
250 lights,
502 draw
calls
No lights, 39
draw calls (232
batched)
Per-pixel: 4x250 lights, 1198 draw calls
Per-vertex: 4x250 lights, 270 draw calls

40
Lights Scene (2/2)
MeshRenderer.Render takes 5 times the amount of ms
when performing per-pixel lighting (one pass per light)
Per-pixel lighting
Per-vertex lighting

41
Links
Practical Guide to Optimization for Mobiles (Unity Manual)
Optimizing Graphics Performance (Unity Manual)
Profiler (Unity Manual)
ShadowGun: Optimizing for Mobile Sample Level (Unity Blog)
“Fast Mobile Shaders” talk at SIGGRAPH 2011 (Unity Blog)
ASTC Texture Compression: ARM Pushes the Envelope in Graphics
Technology (ARM Blogs)

42
The End
Any questions?