![Leonardo Da Vinci - Maurice W[1]. Brockwell](https://static.fdocuments.in/doc/165x107/577d33ba1a28ab3a6b8b93b5/leonardo-da-vinci-maurice-w1-brockwell.jpg)
Optimizing The Value Of Integrated DSD · but a 2005 G rocery Manufacturers Association DSD...
24
GMA DIRECT STORE DELIVERY COMMITTEE Optimizing The Value Of Integrated DSD
Transcript of Optimizing The Value Of Integrated DSD · but a 2005 G rocery Manufacturers Association DSD...

GMA DIRECT STORE DELIVERY COMMITTEE
Optimizing The Value Of Integrated DSD

Based in Washington, D.C., the Grocery Manufacturers Association (GMA) is the voice of more than 300 leading food, beverage and consumer product companies that sustain and enhance the quality of life for hundreds of millions of people in the United States and around the globe.
Founded in 1908, GMA is an active, vocal advocate for its member companies and a trusted source of information about the industry and the products consumers rely on and enjoy every day. The association and its member companies are committed to meeting the needs of consumers through product innovation, responsible business practices and effective public policy solutions developed through a genuine partnership with policymakers and other stakeholders.
In keeping with its founding principles, GMA helps its members produce safe products through a strong and ongoing commitment to scientific research, testing and evaluation and to providing consumers with the products, tools and information they need to achieve a healthy diet and an active lifestyle.
The food, beverage and consumer packaged goods industry in the United States generates sales of $2.1 trillion annually,employs 14 million workers and contributes $1 trillion in added value to the economy every year. For more information,please visit www.gmaonline.org.
About the GMA Direct Store Delivery CommitteeComprised of leaders who deliver their products leveraging direct store delivery (DSD), the GMA Direct Store DeliveryCommittee focuses on emerging opportunities to drive growth, profitability and productivity for CPG companies and their retail partners through the use of the DSD distribution system.
Established in 1976, Willard Bishop is recognized within the grocery industry as food retail experts and thought leaders.Willard Bishop’s long-term relationships with and knowledge of premier retailers allows the company to create a unique setof value-added products and services for its clients. Willard Bishop is a nationally renowned provider of business intelligenceconsulting solutions, tools and processes, and information products that help retailer and CPG supplier clients solve businessproblems and drive profitable growth.
© 2011 by the Grocery Manufacturers Association (GMA). All rights reserved.No part of this publication may be reprinted or reproduced in any way without written consent from GMA.

i Optimizing the Value of Integrated DSD
CONTENTS CHAPTER IIntroduction . . . . . . . . . . . . . . . . . . . . . . . . . . . . . . . . . . . . . . 1
CHAPTER IIAcknowledgements . . . . . . . . . . . . . . . . . . . . . . . . . . . . . . . . 4
CHAPTER IIIAbout the Study . . . . . . . . . . . . . . . . . . . . . . . . . . . . . . . . . . . 6
Executive Summary . . . . . . . . . . . . . . . . . . . . . . . . . . . . . . . . 8
The Path Forward — Working Together . . . . . . . . . . . . . . 19
CONTENTS

1 Optimizing the Value of Integrated DSD
INTRODUCTION
F ood retailers and manufacturers search continuously for ways to better serve shop-pers as the surest way to increase sales and profits. This has been more challengingover the last few years as shoppers aggressively look for greater value.
One proven way to deliver more value in this difficult economy is collaboration toimprove the shopping experience by having the products that shoppers want, when theywant them; i.e. maintaining high levels of in-stock and offering assortments that reflectthe sales demand for individual stores. This depends on strong store execution, which isalways challenging, but can be elevated to best-in-class through collaboration with fullyintegrated direct store delivery (DSD) suppliers.
Fully Integrated DSD: While the acronym DSD is used broadly, the meaning can vary.For some it is an umbrella term covering all the product arriving at a store that didn’tcome through the retailer’s own warehouse or primary wholesaler. This ranges from spe-cialty foods which are typically handled by a specialized distributor to greeting cards thatarrive via overnight shipping services.
Fully Integrated DSD gets its additional power by combining four key elements of thesupply chain:
• Ordering
• Warehousing and Delivery
• Merchandising
• Coordinating
Benefits: This fully integrated system maintains a laser-like focus on sensing and servingstore specific demand and delivers a better shopping experience with high in-stock lev-els and high “speed to shelf ” for new products. It provides retailers with an almostturnkey solution for products that otherwise may create handling challenges when theseproducts move through the retailer’s warehouse. This supply chain is tailored to efficiently handle the unique product requirements associated primarily with highvelocity categories like soft drinks, salty snacks, cookies, baked goods, frozen pizza andice cream.
When all of the elements of the system are operating together, consumers are better servedand retailer resources are engaged only with receiving and checkout. This reduced involve-ment translates to significant labor savings; i.e. Fully Integrated DSD typically frees upnearly 17,000 hours per year in a typical large format store.1
Four Functions: When all of these functions are operating together seamlessly, shoppersfind the products they are looking for every time they shop.
1. Ordering: Fully Integrated DSD drives the supply chain with a unique capabilityto sense and respond to shopper demands in each store. The cornerstone for thisis the category expertise of the DSD team. Their knowledge is used broadly andis built into the systems and procedures used to manage demand. The effective-ness of this ordering can be further enhanced by POS data sharing.
CHAPTER I:INTRODUCTION
1 Driving DSD Supply Chain Efficiency and Profitability, Willard Bishop research for GMA 2005.
INTRODUCTION
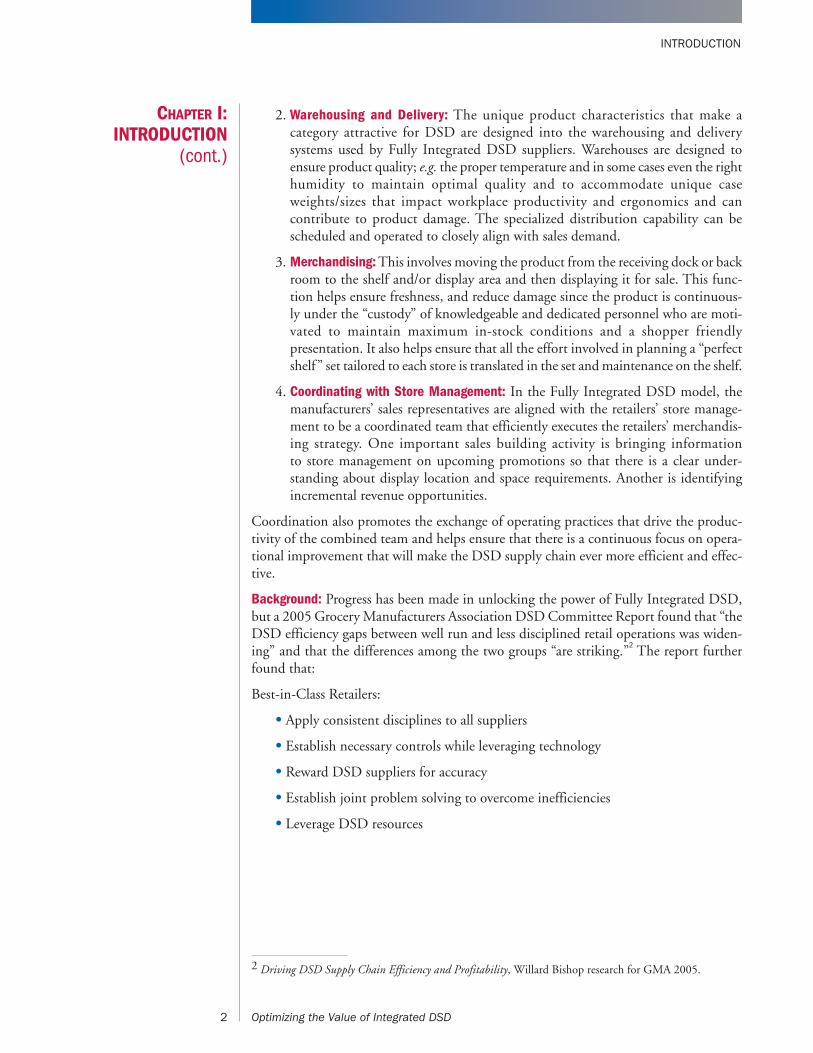
2. Warehousing and Delivery: The unique product characteristics that make a category attractive for DSD are designed into the warehousing and delivery systems used by Fully Integrated DSD suppliers. Warehouses are designed toensure product quality; e.g. the proper temperature and in some cases even the righthumidity to maintain optimal quality and to accommodate unique caseweights/sizes that impact workplace productivity and ergonomics and can contribute to product damage. The specialized distribution capability can bescheduled and operated to closely align with sales demand.
3. Merchandising: This involves moving the product from the receiving dock or backroom to the shelf and/or display area and then displaying it for sale. This func-tion helps ensure freshness, and reduce damage since the product is continuous-ly under the “custody” of knowledgeable and dedicated personnel who are moti-vated to maintain maximum in-stock conditions and a shopper friendlypresentation. It also helps ensure that all the effort involved in planning a “perfectshelf” set tailored to each store is translated in the set and maintenance on the shelf.
4. Coordinating with Store Management: In the Fully Integrated DSD model, themanufacturers’ sales representatives are aligned with the retailers’ store manage-ment to be a coordinated team that efficiently executes the retailers’ merchandis-ing strategy. One important sales building activity is bringing information to store management on upcoming promotions so that there is a clear under-standing about display location and space requirements. Another is identifyingincremental revenue opportunities.
Coordination also promotes the exchange of operating practices that drive the produc-tivity of the combined team and helps ensure that there is a continuous focus on opera-tional improvement that will make the DSD supply chain ever more efficient and effec-tive.
Background: Progress has been made in unlocking the power of Fully Integrated DSD,but a 2005 Grocery Manufacturers Association DSD Committee Report found that “theDSD efficiency gaps between well run and less disciplined retail operations was widen-ing” and that the differences among the two groups “are striking.”2 The report furtherfound that:
Best-in-Class Retailers:
• Apply consistent disciplines to all suppliers
• Establish necessary controls while leveraging technology
• Reward DSD suppliers for accuracy
• Establish joint problem solving to overcome inefficiencies
• Leverage DSD resources
CHAPTER I:INTRODUCTION
(cont.)
2 Optimizing the Value of Integrated DSD
2 Driving DSD Supply Chain Efficiency and Profitability, Willard Bishop research for GMA 2005.
INTRODUCTION
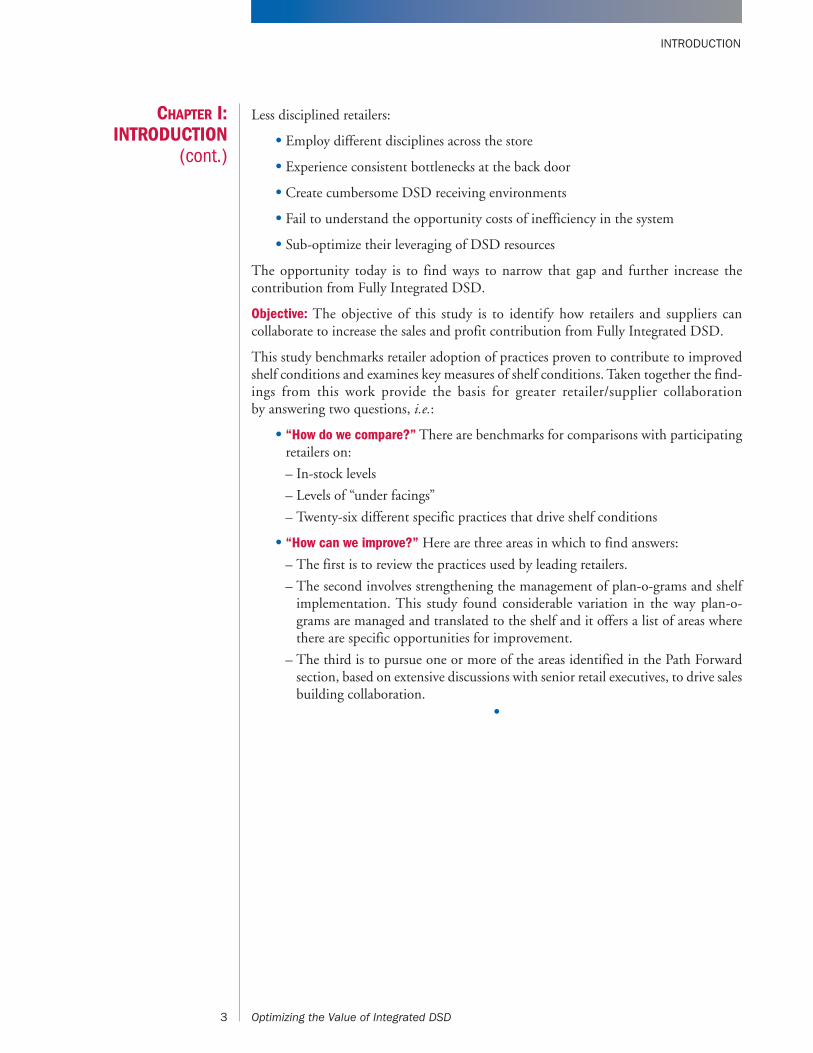
Less disciplined retailers:
• Employ different disciplines across the store
• Experience consistent bottlenecks at the back door
• Create cumbersome DSD receiving environments
• Fail to understand the opportunity costs of inefficiency in the system
• Sub-optimize their leveraging of DSD resources
The opportunity today is to find ways to narrow that gap and further increase the contribution from Fully Integrated DSD.
Objective: The objective of this study is to identify how retailers and suppliers can collaborate to increase the sales and profit contribution from Fully Integrated DSD.
This study benchmarks retailer adoption of practices proven to contribute to improvedshelf conditions and examines key measures of shelf conditions. Taken together the find-ings from this work provide the basis for greater retailer/supplier collaboration by answering two questions, i.e.:
• “How do we compare?” There are benchmarks for comparisons with participatingretailers on:
– In-stock levels
– Levels of “under facings”
– Twenty-six different specific practices that drive shelf conditions
• “How can we improve?” Here are three areas in which to find answers:
– The first is to review the practices used by leading retailers.
– The second involves strengthening the management of plan-o-grams and shelfimplementation. This study found considerable variation in the way plan-o-grams are managed and translated to the shelf and it offers a list of areas wherethere are specific opportunities for improvement.
– The third is to pursue one or more of the areas identified in the Path Forwardsection, based on extensive discussions with senior retail executives, to drive salesbuilding collaboration.
•
CHAPTER I:INTRODUCTION
(cont.)
3 Optimizing the Value of Integrated DSD
ACKNOWLEDGEMENTS
The Grocery Manufacturers Association (GMA) would like to thank the followingcompanies and individuals that participated in and contributed to the successful com-pletion of this study.
Participating Retailers
Special thanks to the seven food retailers who opened their stores for our field work,worked with the study team to secure plan-o-grams, and took part in Executive Interviews.
• Cub Foods • SaveMart Supermarkets
• Hannaford Bros. • Wegmans Food Markets
• The Kroger Co. • Winn-Dixie Stores
• Safeway Inc.
Together, these companies provide a solid geographic representation of the country.
GMA Direct Store Delivery Committee
Thanks to the following individuals for their continuing commitment to increasing thecontribution of DSD to the success of their customers:
Kraig B. AdamsCoca-Cola Refreshments
Dale Brockwell (Retired) Kraft Foods, Inc.
Glenn Bogle Schwan’s Consumer Brands
Clay Broussard PepsiCo, Inc.
Bob Brown Tasty Baking Company
Michael Browne Kellogg Company
David S. Campbell (Retired) The Coca-Cola Company
Bradley Caplan Snyder’s–Lance, Inc.
Mark Carter Snyder’s–Lance, Inc.
Bob Chernoff Bimbo Bakeries USA
CHAPTER II:ACKNOWLEDGEMENTS
4 Optimizing the Value of Integrated DSD
Greg Cooper Dean Foods Company
Michael J. Corby Nestlé Direct Store Delivery
Company
Ann Dozier Dean Foods Company
Lee Falk Dean Foods Company
Steve Frerking Hallmark Cards, Inc.
John S. Phillips PepsiCo, Inc.
Patrick PlunkettCoca-Cola Refreshments
Vyto F. RazminasFlowers Foods, Inc.
Bill RaySnyder’s–Lance, Inc.
Mike SchonbergPepsi Beverages Company
Brent SherwinSchwan’s Consumer Brands
John ShreveNestlé Direct Store Delivery
Company
Brian SilverClemmy’s LLC
Herb SmithE. & J. Gallo Winery
Kurt SpechtKellogg Company
Ronald Woolsey Pepperidge Farm, Inc.

ACKNOWLEDGEMENTS
Project Sponsors
Thanks to the following GMA member companies for financially supporting this project.
Project Team
Thanks to the project team from Willard Bishop LLC, led by Bill Bishop, along with Faye Sinnott, who provided the project management and conducted most of the surveys. The core project team also included Mike Spindler and Cyndi Metallo of ShelfSnap™ who provided their expertise as well as the supporting product recog nition and analysis technology.
The field work was carried out by ATA Retail Services.
The project would not have been possible without the generous sharing of intellectualproperty by:
CHAPTER II:ACKNOWLEDGEMENTS
(cont.)
5 Optimizing the Value of Integrated DSD
Innovative in store merchandisingaudit service which transforms pic-tures into exceptions to your plan interms of products, positions, facingsand conditions. The only source ofindisputable clarity about your prod-ucts on shelf
Forty years we’ve been deliveringproduct content to those who needit so manufacturers don’t have to.Currently 98% of the top 200 retail-ers use Kwikee to get product content. The marketplace is morecomplicated than it’s ever been, butthe distribution process of contentdoesn’t have to be that way. Kwikee manages the chaos.
We’re the only retail organization that focuses solely on impulsemerchandising. That makes ATA Retail Services unique. Our teamof experienced and professional impulse merchandisers spansthe nation and each of them is actually an ATA Retail Serviceemployee. This distinguishes us from the rest of the retail supportin the impulse merchandising industry.
Gladson provides accurate, complete and stan-dards-compliant product information to con-sumer packaged goods manufacturers, retailers,wholesalers and brokers. Gladson databasesand services are widely used in category man-agement, global data synchronization, advertis-ing, e-commerce and nutrition programs.

ABOUT THE STUDY
The study findings are based on three separate sets of data collected in cooperation withthe participating retailers each providing four study stores, bringing the total number ofstores to 28.
Shelf Analysis: This element of the study focused on two measures of shelf conditions:level of in-stock and the percentage of authorized SKUs with less facings than called forin the category plan-o-gram.
Level of In-Stock: This is a measure of how well the shelf was satisfying shopper demand.It was defined as the number of holes found on the shelf (where there was no product available over shelf tag) as a percentage of the total number of products onthe shelf.
Percent of Under Faced Authorized Items: This measure provided an indication of howoften the shelf was not carrying the required days of supply, which is an indicator of thelikelihood of out-of-stocks.
These measures were developed using the product recognition and analytical capa bilitiesof ShelfSnap™, which translates digital photos of the shelf into products, positions, facings and conditions; i.e. a snap-o-gram that can be compared with the plan-o-gram to provide these and other measures of shelf conditions.
This phase of the work involved:
• Sending personnel into each of the study stores to take photographs of the shelfsections in six major DSD categories; i.e. bread, cookies & crackers, frozen pizza,ice cream, snacks and soft drinks.
This typically involved approximately 2,500 items per store and took the ATA retail serv-ice personnel about 30 minutes per store to photograph the shelves.
• Collecting:
– The current plan-o-grams from each of the retailers.
– Reference data (product image, dimensions, etc.) needed to drive the productrecognition system from retailers, DSD suppliers and from two major industryproviders of product information (Gladson and Kwikee).
CHAPTER III:ABOUT THE STUDY
6 Optimizing the Value of Integrated DSD

ABOUT THE STUDY
• Developing the statistical representation of the shelf and comparing that with theplan-o-gram which was carried out by the ShelfSnap™ staff.
Manufacturers Sales Representatives (MSRs) Experience: Information was collected onthe experience of the manufacturers sales representatives (MSRs) of the major DSD sup-pliers serving the stores in the study. This was done by creating an online survey and theninviting these personnel to report their experience on that survey. A total of 128 respons-es were received; i.e. from 12 minimum to 26 maximum responses per retailer.
Senior Executive Perspective: The final source of information was telephone interviewswith one or more senior executives from each of the participating retailers. These inter-views were designed to capture the senior retailers’ perspectives on DSD and their inputon the extent to which their chain had adopted each of the 26 practices identified in anearlier study to be effective in improving shelf conditions.3 A total of 10 senior execu-tives were interviewed.
How to Use the Study: Each of the four study findings offers interested retailers theopportunity to compare their operation with a composite experience of the partici patingretailers as well as to get specific guidance, if desired, on ways to improve their perform-ance.
Here’s a way to get the most value from each of the findings.
• Finding I — Plan-O-Gram Management: The study found that there were differencesin the way participating retailers managed plan-o-grams and that those retailers whowere more actively engaged were more likely to enjoy a strong alignment betweenplan-o-gram and shelf.
– To compare, determine how involved your company is in managing plan-o-grams.
– To improve, identify the ways to increase your involvement in that process.
• Findings II & III — In-Stock Level and Percent of Under faced Authorized Items: Eachof these findings provides:
– Benchmarks retailers can use to compare their performance with the study com-posite
– A number of specific actions that can be taken to improve performance if there’san opportunity to do so
• Finding IV — Adoption of Practices: This finding presents benchmarks on the extentof adoption by participating retailers of each of 26 different operating and mer-chandising practices. Improvements can be made by adopting practices not in use.Most of these practices are self-explanatory, but additional information on themcan be found in the 2005 DSD study “Driving DSD Supply Chain Efficiency andProfitability” which is available on the GMA website: www.gmaonline.org
At the end of the section detailing this finding, there are also three tables that show howwell participating retailers are doing in collaborating with suppliers to provide access toauthorized lists, share POS data and reduce distractions that divert MSRs from “work-ing the shelf.”
•
CHAPTER III:ABOUT THE STUDY
(cont.)
7 Optimizing the Value of Integrated DSD
3 Driving DSD Supply Chain Efficiency and Profitability, Willard Bishop research for GMA 2005.

EXECUTIVE SUMMARY
The goal of this study is to identify collaborative opportunities to improve in-stocklevels.
The extensive analysis of the data captured in the study along with market observations,surveys, and interviews led to the following key findings:
1. Challenges in managing plan-o-grams are an important reason why shelf conditions don’t always deliver the optimum shopping experience.
2. The in-stock level for DSD averaged 98.2 percent, which compares well with the94.0 percent found in other ShelfSnap™4 studies for both DSD and warehouse-delivered products.
3. The incidents of “under facings” in this study average 13.1 percent, which is significantly lower than the 30.0 percent found in other ShelfSnap™4 studies.
4. There are significant differences in retailer adoption of DSD practices, whichcreates untapped potential for improving performance.
Each of these findings is explained later in this report along with benchmarks and poten-tial opportunities for retailers to improve in-stock levels. The report also provides aroadmap to help unleash the full potential of DSD and a recommended list of follow-up actions.
1. Challenges in managing plan-o-grams are an importantreason why shelf conditions don’t always deliver theoptimum shopping experience.
These challenges involve implementing and maintaining plan-o-grams that reflect mean-ingful shopper insights, establish the necessary holding power to limit out-of-stocks, andare tailored to the unique needs of each store.
Exhibit IManufacturers SalesRepresentatives’ Confidence in the Accuracy of the Initial Shelf Set (Percent of Responses)
Responses: 128
EXECUTIVESUMMARY
8 Optimizing the Value of Integrated DSD
4 ShelfSnap™ has done more than 100 other projects over the last two years involving more than 50retailers and covering more than 30 different warehouse-delivered and DSD categories across the store.

EXECUTIVE SUMMARY
The key to making progress in this area begins with accurately implementing plan-o-grams. The research found that only about 80 percent of the MSRs were confident thatthe initial shelf set was accurate, based on their experience right after the reset.
Turning to shelf maintenance, there were challenges related to both manufacturer repre-sentatives having access to the retailer’s authorized plan-o-grams and clarity on who wasprimarily responsible for maintaining the set.
Exhibit IIAccess to Plan-O-Gram(Percent of Responses)
Responses: 128
While a best practice outlined in the GMA DSD 2005 Report calls for MSRs to haveaccess to store-specific plan-o-grams, less than 60 percent of those surveyed reported thatplan-o-grams were available. This raises the question of whether MSRs have the neces-sary tools to maintain shelf alignment.
Effectively Managing Plan-o-Grams
Collecting plan-o-grams for this project proved to be surprisingly difficult. This opens the question of who actually manages the plan-o-gram and the impact of the process on shelf conditions.
The research revealed five questions that are key to the management of the plan-o-grams.Every retailer interested in making sure that shelf conditions reflect their authorized plan-o-grams will want to ask each of these questions, for both DSD and warehouse products,to see if current practices are delivering the intended results.
1. Who has custody of the authorized plan-o-gram? Some retailers maintain custodyof the plan-o-grams, others delegate it to key suppliers. Some of these plan-o-gramsdelegated to suppliers are still under the direct supervision of the retailer while oth-ers appear to be only under the retailer’s general guidance. There was some indi-cation that plan-o-grams that received only the retailer’s general guidance don’talways reflect the retailer’s strategy.
2. Do you have an easy way to connect specific plan-o-grams to individual stores?While some retailers clearly connect plan-o-grams to specific stores, the connec-tion is less clear in other retailers. Without this clear connection, it’s difficult toachieve and assess compliance. For store specific plan-o-grams, this just requirescareful record keeping, but for cluster level plan-o-grams, the record keeping needsto also provide accessibility to all approved parties of the key dimensions of theplan.
EXECUTIVESUMMARY
(cont.)
9 Optimizing the Value of Integrated DSD
10
EXECUTIVE SUMMARY
3. Are the plan-o-grams for a specific store up-to-date and do they go beyond the cor-porate set to accurately reflect the store size, layout, and fixturing? While mostplan-o-grams are generally up-to-date, there are some opportunities. In a numberof instances, the plan-o-grams did not reflect the actual store layout or specific fix-ture configurations. Some of the issues are due to a lag between product accept-ance and the availability of a store level plan-o-gram. There is a need to regularlyconfirm that plan-o-grams are up-to-date and reflect the actual layout of the store.
4. Are there instances where only some of the products in a category are plan-o-grammed or where entire categories have no plan-o-grams? The research indicatesthat one or both types of voids exist in a number of retailers. Regularly check thecompleteness of your plan-o-grams and be sure any voids in coverage are inten-tional.
5. Are the “authorized plan-o-grams” being implemented without modification? Theresearch indicates that the answer to this question can vary among retailers andeven among suppliers serving the same retailer. There is an opportunity to createa regular audit process that is done, at a minimum after each category reset.
The research then focused on maintaining in-stock levels, a top retailer priority based onprevious studies.
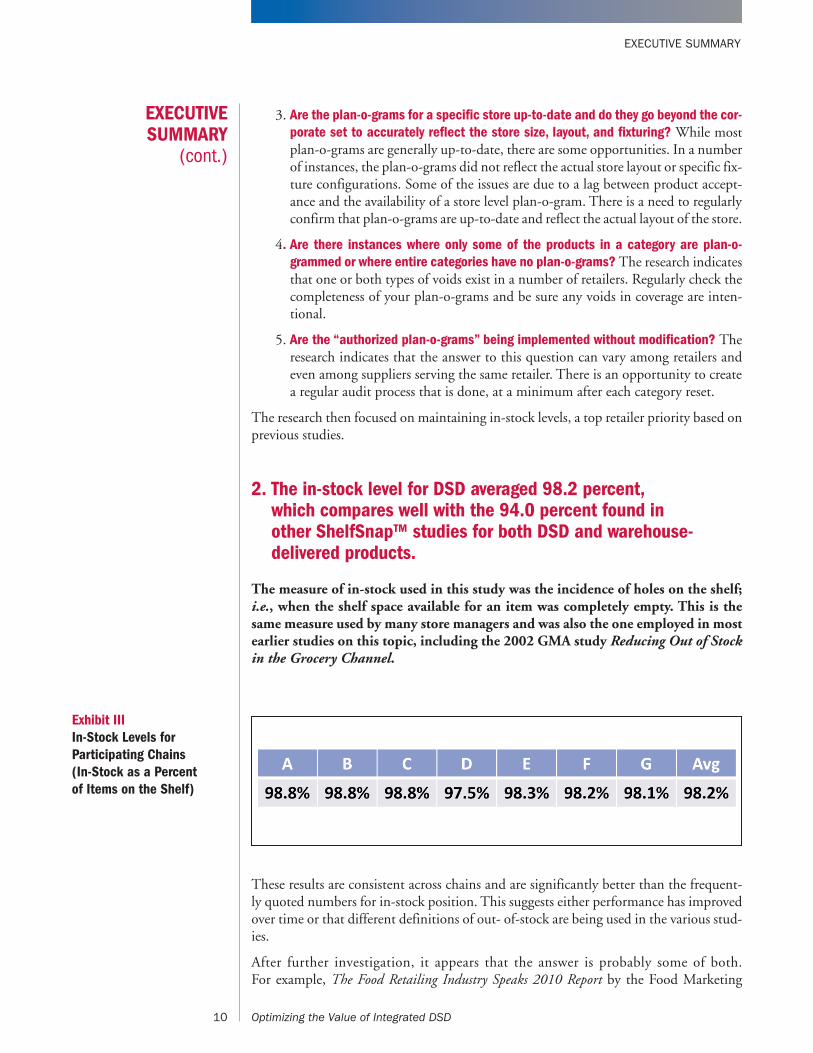
2. The in-stock level for DSD averaged 98.2 percent, which compares well with the 94.0 percent found in other ShelfSnap™ studies for both DSD and warehouse-delivered products.
The measure of in-stock used in this study was the incidence of holes on the shelf;i.e., when the shelf space available for an item was completely empty. This is thesame measure used by many store managers and was also the one employed in mostearlier studies on this topic, including the 2002 GMA study Reducing Out of Stockin the Grocery Channel.
Exhibit IIIIn-Stock Levels forParticipating Chains(In-Stock as a Percentof Items on the Shelf)
These results are consistent across chains and are significantly better than the frequent-ly quoted numbers for in-stock position. This suggests either performance has improvedover time or that different definitions of out- of-stock are being used in the various stud-ies.
After further investigation, it appears that the answer is probably some of both. For example, The Food Retailing Industry Speaks 2010 Report by the Food Marketing
EXECUTIVESUMMARY
(cont.)
10 Optimizing the Value of Integrated DSD
EXECUTIVE SUMMARY
Institute shows a 4.3 percent level of out-of-stock in 2009; i.e., an in-stock level of 95.7percent. Regardless of the cause of the differences in out-of-stock levels over time, theDSD in-stock performance is strong as an absolute measure and relative to the performance for a mix of warehouse and DSD categories previously studied by ShelfSnap™.
This performance demonstrates the strong executional capability of DSD. At leastpart of this is due to several natural advantages. The GMA study A ComprehensiveGuide to Retail Out-of-Stock Reduction in the Fast Moving Consumer Goods Industrypoints out seven root causes of out-of-stock and in three of these, integrated DSDhas inherent advantages. These include:
• The Accuracy of Product Data. Manufacturers and retailers have made major stridesin synchronizing their data, and DSD’s chain of custody increases data accuracy.
• Ordering and Inventory Accuracy. DSD has focused and dedicated resources that are eager to work with retailers to continuously improve shelf and sales performance.
• Store and Shelf Replenishment Disciplines. DSD route personnel have experienceand specialized training to bring to retailers.
While there is no clear relationship found between any individual practice and the in-stock level, three factors were found to be related to higher levels of out-of-stock:
• Shelf Crowding — Shelf pack-out did not provide adequate days-of-supply for fastermoving items.
• No Correction Process — Absence of procedures to make shelf adjustments for prod-ucts that are frequently out-of-stock.
• Restocking Treasure Hunt — Inadequately stocked or disorganized backroom inven-tory and interpretation policy on backroom inventory.
Improving In-Stock Levels
Based on the MSRs survey, some recommendations for improving in-stock levels include:
• Increase Collaboration With DSD Suppliers On Shelf Allocation and Back-Stock —Several of the MSRs saw an opportunity for closer collaboration on developing theinitial plan-o-grams, to ensure enough shelf stock for the faster moving items.Another benefit of collaboration is ensuring enough back-stock for fast selling pro-motional items.
• Do More Sharing of Sales Information and Merchandizing Plans — MSRs knowthat access to POS data will improve their ordering accuracy and see this in stores that share that information. There are also opportunities to share merchandizing and promotion plans on a timelier basis. Longer notifica-tion lead time would also help with discontinued items.
EXECUTIVESUMMARY
(cont.)
11 Optimizing the Value of Integrated DSD

EXECUTIVE SUMMARY
• Schedule Regular Meetings to Make Necessary Plan-O-Gram Adjustments, e.g.,Quarterly, and Maintain a Log Book for Questions/Responses Between Meetings— MSRs are eager to develop more efficient ways of communicating with storemanagement. They recognize that schedules don’t always coincide and suggestedposting information on a board or log book accessible to MSRs. Another sugges-tion for improving communication involves having a distribution list for vendorsand automatically adding them when relevant communications are sent to storelevel.
• Establish Agreement for “Off Hour” Restocking of DSD Products — Almost everychain indicated they had procedures for store personnel to fill in stock, “whereverit’s needed” during evening hours and weekends, but based on MSRs’ feedback,follow-through remains a challenge.
• Increase Collaboration on Backroom Organization — MSRs see the opportunity formore consistent interpretation across stores of backroom inventory policy.
Inadequate shelf holding power is one of the key causes of lower in-stock levels, sothere was also an analysis of the incidents of “under facing” versus what was calledfor in the plan.
3. The incidents of “under facings”, in this study, averaged13.1 percent, which is significantly lower than the 30.0percent found in other ShelfSnap™ studies.
Under facings occur when the actual facings on the shelf are lower than the number calledfor in the plan-o-gram. When this happens, the “days-of-supply” on the shelf will not beadequate to maintain the desired in-stock position.
Exhibit IVIncidence of Under Facings forParticipating Chains(Percent of AuthorizedSKU’s on the Shelf)
This performance compares favorably with the same metric for all other studies done byShelfSnap™5, which is 30.0 percent.
EXECUTIVESUMMARY
(cont.)
12 Optimizing the Value of Integrated DSD
5 ShelfSnap™ has done more than 100 other projects over the last two years involving more than 50retailers and covering more than 30 different warehouse-delivered and DSD categories across the store.
EXECUTIVE SUMMARY
Minimizing Occurrence of Under FacingsHere are several practices that help ensure that there will be an adequate number of fac-ings, for each item in the plan-o-gram, to deliver high in-stock levels:
• Use syndicated market data and POS data to objectively guide the number of fac-ings assigned to both branded and private label products.
• Determine the necessary “days of supply” for the top fast moving items and try toprovide the necessary shelf holding power.
• Establish a disciplined process that combines input from suppliers with guidanceby the retail category manager that includes the following:
1) The retail category manager provides strategy and guidance
2) Supplier develops the plan-o-gram based on their category expertise
3) The category manager reviews the plan-o-gram to ensure that it reflects the guid-ance given and approves the authorized version for implementation in the stores.
To ensure the facings in the plan-o-gram continue to be updated to reflect the reality ofthe shelf, including new items and changes in shopping patterns, consider developing aregular schedule that includes:
• Meetings to discuss recommended changes to the plan-o-grams
• Updates to the authorized plan-o-gram.
• Times for implementing approved adjustments to the shelf.
• Audits
4. There are significant differences in retailer adoption of DSD practices which creates untapped potential forimproving performance.
Past GMA DSD Committee reports have documented successful practices that lead to increased sales and profits. All of the practices covered in this report are taken fromthe GMA 2005 report Unleash the Power of DSD, which identified opportunities toimprove DSD and documented more than 25 practices that benefit both retailers andsuppliers. The surveys done in this project provide specific benchmarks that a retailer canuse to compare their own progress with industry norms.
The research gathered through the self-assessment of model practice adoption for eachof the participating chains has also provided some additional insights. Senior retail exec-utives reported the degree to which each of the practices has been implemented in their chain:
• Full Adoption — 80 percent or more of the stores
• Partial Adoption — Plus or minus 50 percent of the stores
• Limited/No Adoption — Less than 25 percent of the stores
EXECUTIVESUMMARY
(cont.)
13 Optimizing the Value of Integrated DSD

EXECUTIVE SUMMARY
Exhibit VPractices to Reduce Wait Time / Improve Product Flow(Percent ofParticipating Chains)
Some documented best practices that have helped to reduce wait time include:
• Providing for weekend receiving hours, as well as emergency weekend deliveries,helps DSD suppliers to meet the growing volume sold on weekends. Both prac-tices have been adopted by a strong majority of the retailers participating in thisstudy.
• Maintaining receiving hours of six hours or more, Monday to Friday, is a practiceadopted by the majority of retailers. The two remaining survey participants don’tschedule receiving hours on Wednesday.
• Some of the retailers have also implemented “drop-and-go” programs with select-ed DSD suppliers. This practice effectively extends receiving hours, and at the sametime reduces backdoor congestion and wait time.
Leading retailers continue to adopt new practices that expedite receiving.
Exhibit VIReceiving Scheduling Practices(Percent ofParticipating Chains)
14 Optimizing the Value of Integrated DSD

EXECUTIVE SUMMARY
Another way that retailers have found to speed up receiving is to temporarily expand thecapacity for receiving, and in some cases, offer special check-in procedures for certain typesof deliveries.
Two practices that peer retailers are using to expand their receiving capacity include:
• Allowing two or more suppliers to stage orders for receiving so that the receivercan move quickly from one delivery to the next. The majority of retailers in thestudy have adopted this practice.
• Scheduling more than one receiver at peak times. Only one of the retailers in thestudy follows this practice.
The other practices related to expanding DSD receiving capacity fall into two categories:
• Express check-in for direct exchange (DEX), network exchange (NEX), andadvanced shipping notices (ASNs) across all DSD categories. Additionally, scan-based trading (SBT) is used in some categories like baked goods and ice cream.These practices reward suppliers who have invested in advanced technology toenable quicker receiving.
• Special receiving hours for large complex orders is another practice. Fewer than 60percent of the retailers have fully adopted this practice.
Exhibit VIIAutomated DataExchange(Percent of Participating Chains)
More than half of the retailers in the study have fully adopted the practice of auto maticallyexchanging product and price data with suppliers.
EXECUTIVESUMMARY
(cont.)
15 Optimizing the Value of Integrated DSD

EXECUTIVE SUMMARY
Exhibit VIIIBackroom Layout and Access Practices(Percent of Participating Chains)
The proper layout of the backroom and access to it helps the MSRs more effectively main-tain in-stock positions on the shelf and to support promotions. A majority of retailers inthe study have fully adopted these practices.
Exhibit IXAvailability of POGs and Authorization Lists(Percent of Participating Chains)
MSRs are more effective in maintaining shelf conditions when they have easy access toretailer plan-o-grams and authorized item lists for the store:
There was a mix of responses related to providing store-specific plan-o-grams:
• 44 percent of the participating chains provided them at store level
• 28 percent of the participating chains provided access only at headquarters
• The remaining 28 percent limited access to either category captains or only to thoseinvolved in resets
A majority of participating chains maintain and provide access to store-specific author-ized lists in store. Another 28 percent provide access only at headquarters.
16 Optimizing the Value of Integrated DSD

EXECUTIVE SUMMARY
Exhibit XMerchandising andData Sharing Practices(Percent ofParticipating Chains)
No retailer in the study indicated that they had a company-wide policy to share POSscan data with the MSRs for ordering and inventory management. Some retailers, how-ever, allow the store to share POS data when it’s requested and if personnel are availableto provide it. However, many retailers share POS data from headquarter to headquarterands suppliers then share this data with their MSRs.
The survey of MSRs serving each of the stores in the study provides more overall insightas well as some retailer-specific information highlighting specific opportunities forimprovement.
Exhibit XIAccess to Authorized Item Lists(Percent of Responses)
17 Optimizing the Value of Integrated DSD
EXECUTIVE SUMMARY
While about 40 percent of those surveyed indicate that they have consistent access to up-to-date authorized item lists, there were additional insights:
• About 30 percent only have occasional access
• Almost 20 percent have no access, with another 10 percent noting the lists theyhave access to are not always up-to-date
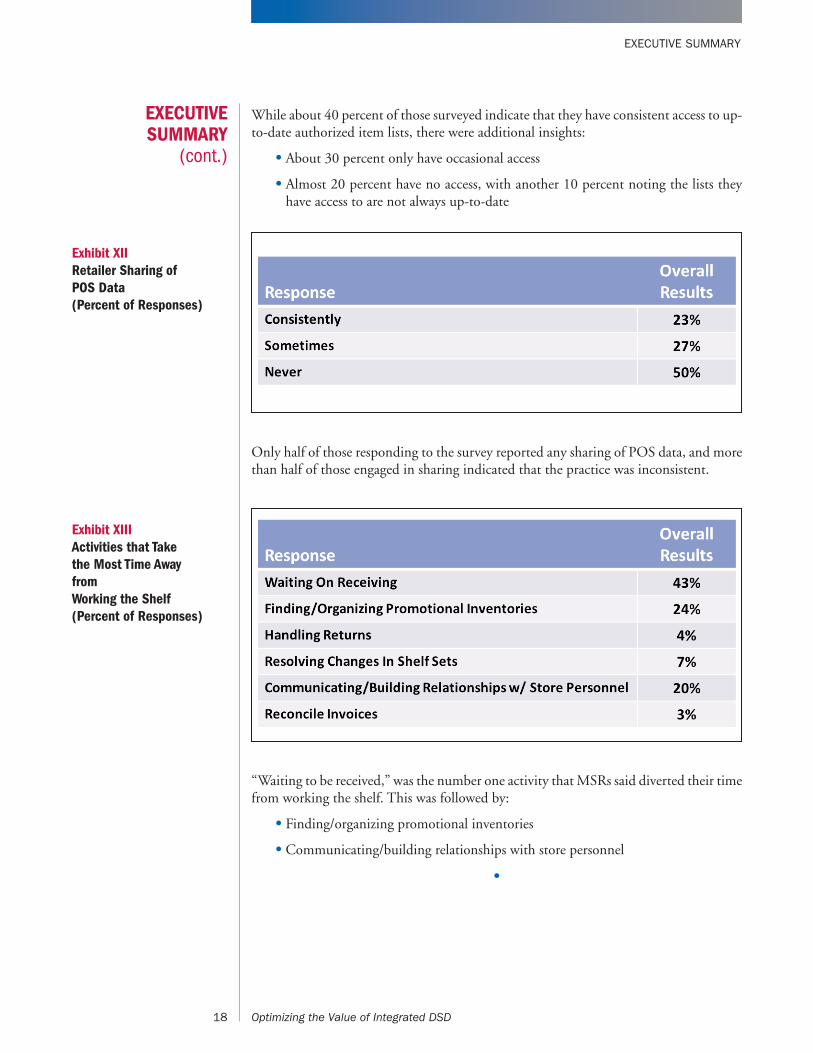
Exhibit XIIRetailer Sharing ofPOS Data (Percent of Responses)
Only half of those responding to the survey reported any sharing of POS data, and morethan half of those engaged in sharing indicated that the practice was inconsistent.
Exhibit XIIIActivities that Take the Most Time Awayfrom Working the Shelf(Percent of Responses)
“Waiting to be received,” was the number one activity that MSRs said diverted their timefrom working the shelf. This was followed by:
• Finding/organizing promotional inventories
• Communicating/building relationships with store personnel
•
EXECUTIVESUMMARY
(cont.)
18 Optimizing the Value of Integrated DSD
THE PATH FORWARD — WORKING TOGETHER
The extensive conversations that were conducted with Senior Retail Executives in thestudy have helped us to develop a roadmap to unleash the full potential of DSD andcollaborate more effectively as trading partners. These insights also identified the
opportunity to expand our mutual understanding of the impact of DSD on the retail-ers’ business and identifies several high-priority opportunities to improve in-stock posi-tion and increase sales.
Senior retail executives understand the important contributions of DSD and also see areaswhere there are opportunities for improvement.
Contributions of DSD
Here are the four main areas where retailers see that DSD contributes positively to busi-ness performance:
• Ability to drive a strong in-stock position. This is a top priority at retail and was themost frequently mentioned contribution. DSD labor and delivery frequency areseen as integral to it.
• Capability to effectively serve local conditions. Retailers are moving beyond clus-ters to tailor merchandising to local needs with the ultimate goal of store-specificplans. DSD is seen as a way to execute against this goal.
• Range of product to support varying assortment requirements. DSD provides retail-ers with the ability to offer the products needed to serve local preferences and toquickly respond to seasonal changes in demand.
• Execution to maintain shelf conditions. DSD’s strong execution at the shelf is important in maintaining shelf conditions. DSD also speeds new products tothe shelf, which is essential to “maintaining the reputation for being ahead of themarketplace.”
Areas of Joint Opportunity
Four areas offer the greatest opportunity for collaboration between retailers and manu-facturers. Joint business planning around each of these should produce significant ben-efits:
• Increasing communications/collaboration at store level.
• “We want our stores engaged in presale planning and encourage these con-versations.” Source: Retail Merchandising Executive
• While there was consistent emphasis on the need to understand and apply BestPractices at store level, a number of retailers also see value in collaborating toachieve greater coordination of store-level activities.
• Improving Shelf Conditions.
• “We are focusing on upgrading shelf conditions and need to make sure it hap-pens in DSD as well as the rest of the store.” Source: Senior V.P. of Operations
• The primary goal of improving shelf conditions is to reduce out-of-stocks. One way to do this is to align merchandizing support with the sales of fast mov-
THE PATH FORWARD— WORKING
TOGETHER
19 Optimizing the Value of Integrated DSD

THE PATH FORWARD — WORKING TOGETHER
ing products. Most retailers also want to be sure that category plans are implementedall the way to the shelf and that new items are “cut in” as soon as possible. Further,there is an opportunity to work together to better execute store-by-store assort-ments.
• Optimizing Backroom Inventory.
• “We want to continuously improve our labor productivity.” Source: Senior Operations Executive
• One key to improving shelf conditions involves ensuring that there is adequatebackroom inventory for the store’s fast moving products and that the back-stockof slower moving products is held to a minimum, since pockets of excess inven-tory can reduce labor productivity and increase shrink.
• Increasing Alignment of Activities at Retail.
••“We need to work more closely in order to successfully execute our ‘go-to-market’ strategies.” Source: Retail Senior V.P.
• A common theme among retailers is that there is opportunity to increase align-ment with their DSD suppliers.
• DSD’s strong execution capability at store level gives retailers a way to support saleswith fewer labor hours. Retailers see opportunity for increased collaborationthrough accelerated receiving practices and increased data sharing in order to helpensure that these DSD capabilities are focused on top priority tasks and are as pro-ductive as possible for both retailers and DSD suppliers.
• Some of the retailers participating in the study stress the need for communicationson marketing and promotions with district and store management. Their experi-ence is that implementation is better when store-level personnel and MSRs col-laborate to optimize in-store demand.
Closing Thoughts—Where Do We Go from Here?
First, we hope the data and insights we have provided in this report will point the wayto how manufacturers and food retailers can collaborate more closely at both headquar-ters and store level to fully leverage the power of DSD. This report is one more step onthe journey to improve the shopper experience, increase sales, and continue to drive effi-ciency and effectiveness at store level.
Please take a look at the GMA DSD reports from 2005 and 2008 for more detailed infor-mation on DSD practices and consider scheduling a “one-on-one” meeting with any oneof the study sponsors to discuss the findings and opportunities.
•
THE PATH FORWARD— WORKING
TOGETHER(cont.)
20 Optimizing the Value of Integrated DSD

GROCERY MANUFACTURERS ASSOCIATION1350 I Street, NW :: Suite 300 :: Washington, DC 20005 :: ph 202-639-5900 :: fx 202-639-5932 :: www.gmaonline.org
www.facebook.com/GroceryManufacturersAssociation :: www.gmaonline.org/blog :: @GroceryMakers
©2011