Optimizing the Truckload / Less Than Truckload...
64
1 ASQ Team Excellence Competition Optimizing the Truckload / Less Than Truckload (TL/LTL) Decision for Bayer MaterialScience Optimizing the Truckload / Less Than Truckload (TL/LTL) Decision for Bayer MaterialScience ASQ 2008 Team Excellence Competition
Transcript of Optimizing the Truckload / Less Than Truckload...

1
ASQ Team Excellence Competition
Optimizing the Truckload / Less Than Truckload (TL/LTL) Decision for Bayer MaterialScienceOptimizing the Truckload / Less Than Truckload (TL/LTL) Decision for Bayer MaterialScience
ASQ 2008 Team Excellence Competition
2
BMS • 6 May 2008 • Page # 2
ASQ Team Excellence Competition
Bayer MaterialScience Global Business UnitsBayer MaterialScience Global Business Units
Polyurethanes
Coatings, Adhesives,Specialties
Polycarbonates
InorganicBasic Chemicals
52 %52 %Euro10.4 billion
27 %
15%15%
4%4%2%2%
ThermoplasticPolyurethanes
Sean
Good Morning, I’m Sean Ritchie …
Bayer MaterialScience is a global manufacturer of polymers used as raw materials for products ranging from compact disks to automotive finishes to furniture. Bayer MaterialScience ships billions of pounds of material each year to thousands of customers.
3
BMS • 6 May 2008 • Page # 3
ASQ Team Excellence Competition
Transportation reps assign packaged shipments to carriers • Larger shipments are assigned to full Truckload Carriers (TL)• Smaller shipments to what are known as Less Than Truckload Carriers (LTL)
Carrier choice in the 16,000 to 25,000 pound range is a grey zone • Optimal shipping cost depends on several factors
One transportation rep suspected this grey zone was causing problems • He took a sample of recent shipments in that weight range and compared the cost
of each with the cost if optimal carrier choices had been made• He found 83% of the shipments among his sample were sub-optimal
Bayer MaterialScience could be overspending by more than $1 million!• But … was the extrapolation valid? • And … if it was, what were the root causes of failure in the shipping process?
A team of experts and a disciplined method was needed to investigate this potential opportunity….
Bayer MaterialScience Ships a Large Volume of Packaged GoodsBayer MaterialScience Ships a Large Volume of Packaged Goods
Sean
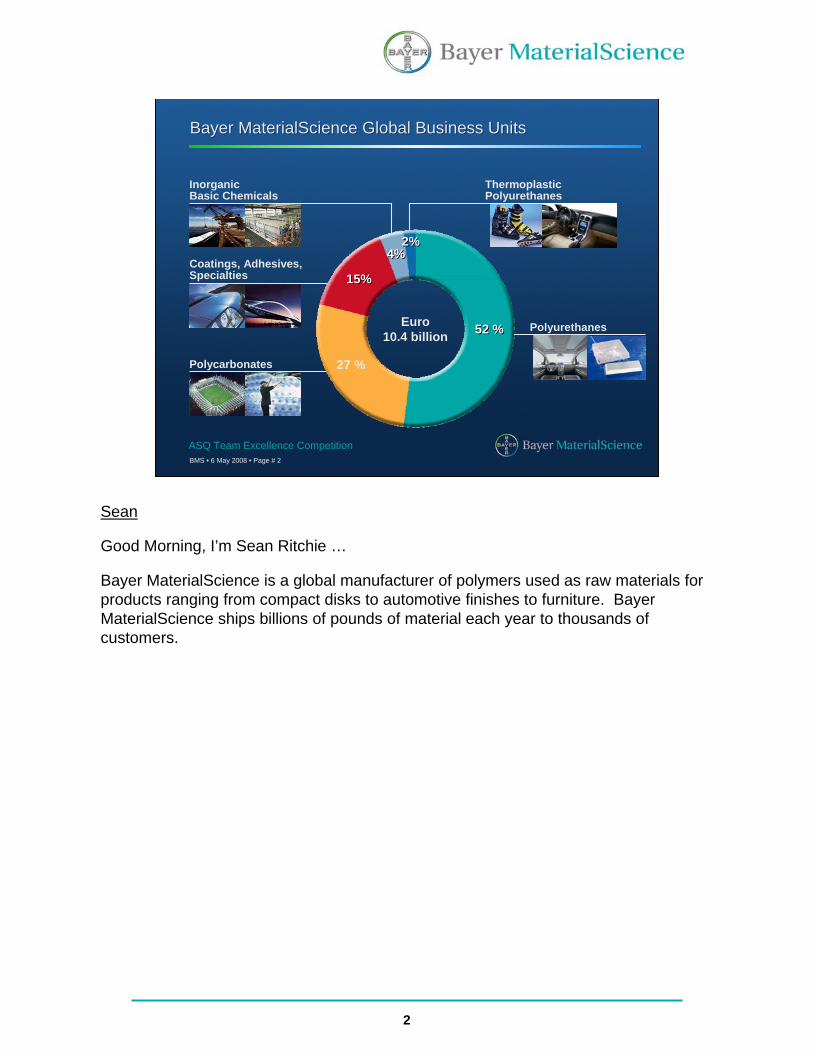
Shipping costs are a significant component to the Cost of Goods Sold.
In July, 2005 one of our transportation representatives identified a potential problem with the way we choose carriers. While examining a sample of shipment data for truck shipments in the 16,000 to 25,000 lb range he observed that 83% were shipped “sub-optimally”, hence more costly.
Extrapolating this rate of sub-optimal shipping implied over $1 Million could be saved by shipping correctly.
But … was his extrapolation valid? And … if so, what were the root causes of failure in the shipping process?
4
BMS • 6 May 2008 • Page # 4
ASQ Team Excellence Competition
Introducing the TeamIntroducing the Team
Sean Ritchie Team Leader
Kristen Hermick Customer Master Data
Laurie Colao Business Intelligence
Sam Phipps Finance
Marko Dodig Technology Services
Ron Gadzinski Logistics
Amy Prevade Freight Payment & Audit
Sean Ritchie Team Leader
Kristen Hermick Customer Master Data
Laurie Colao Business Intelligence
Sam Phipps Finance
Marko Dodig Technology Services
Ron Gadzinski Logistics
Amy Prevade Freight Payment & Audit
Sean
5
BMS • 6 May 2008 • Page # 5
ASQ Team Excellence Competition
Section 1: Project Selection & PurposeSection 1: Project Selection & Purpose
Sean
Project Selection and Purpose
6
BMS • 6 May 2008 • Page # 6
ASQ Team Excellence Competition
HighLow
Medium
Medium
High
LowMedium LowHigh
Feasibility
ROI
Alignment
Alignment with Overarching Goals
Feasibility
Return on Investment (ROI)
Preliminary Assessment of Truckload versus Less
than Truckload Project• Strong Alignment• High ROI• Highly Feasible
1A.a Types of Data and Tools Used to Select the Project and Why1A.a Types of Data and Tools Used to Select the Project and Why
Sean
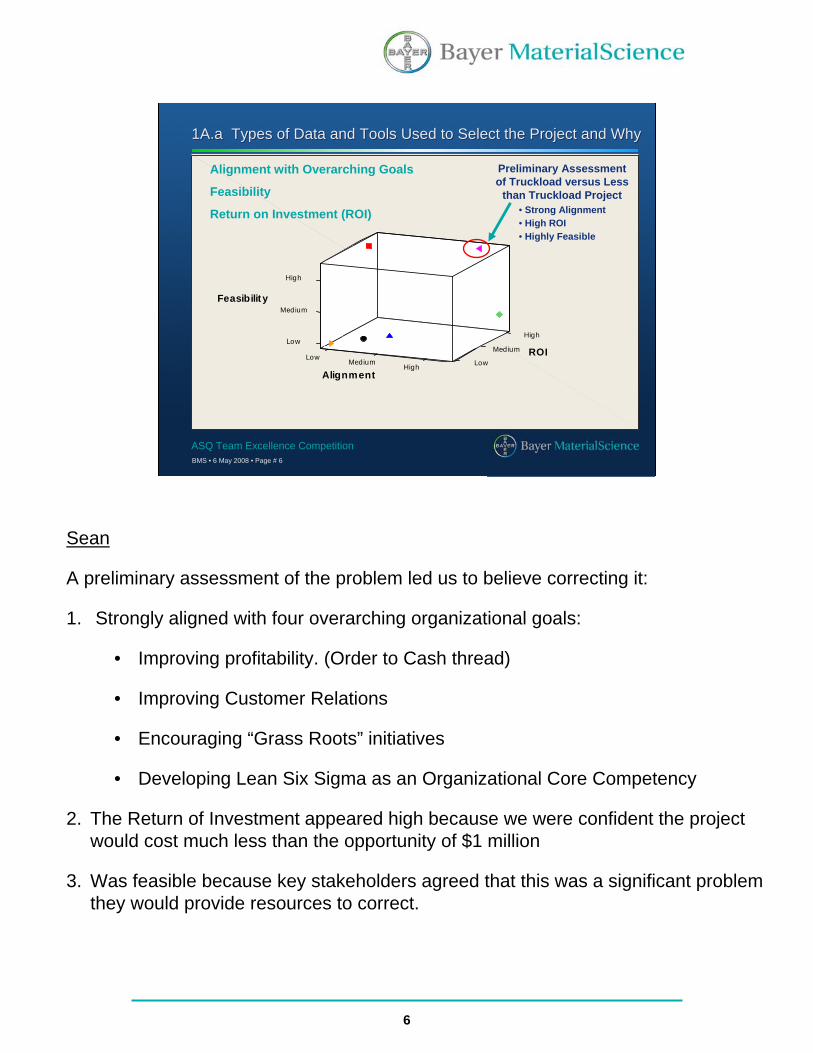
A preliminary assessment of the problem led us to believe correcting it:
1. Strongly aligned with four overarching organizational goals:
• Improving profitability. (Order to Cash thread)
• Improving Customer Relations
• Encouraging “Grass Roots” initiatives
• Developing Lean Six Sigma as an Organizational Core Competency
2. The Return of Investment appeared high because we were confident the project would cost much less than the opportunity of $1 million
3. Was feasible because key stakeholders agreed that this was a significant problem they would provide resources to correct.
7
BMS • 6 May 2008 • Page # 7
ASQ Team Excellence Competition
1A.a Types of Data and Tools Used to Select the Project and Why1A.a Types of Data and Tools Used to Select the Project and Why
Sample
Sam
ple
Mea
n
JanDecNovOctSepAugJul
0.060
0.055
0.050
__X=0.05624
UCL=0.06209
LCL=0.05039
Sample
Sam
ple
Ran
ge
JanDecNovOctSepAugJul
0.275
0.250
0.225
0.200
Xbar-R Chart of Cost / LbsJuly 2005 to January 2006
Perc
ent
of T
OTS
HIP
WGT
TYPEWeight Bracket
LTLTL123123
70
60
50
40
30
20
10
0
Percent within levels of TYPE.
Mode of Shipment versus Weight BracketsJuly 2005 to January 2006
1 = 14 to 16K 2 = 16 to 20K 3 = 20 to 25K
TL LTL Process.igx
Revised 5/19/2006
Cus
tom
erR
egio
nal S
ervi
ce C
ente
r
Cust
omer
Ser
vice
Logi
stic
s
Logi
stic
s S
trate
gyLo
gist
ics
Ope
ratio
ns
Plan
t / W
hse
CTL
Order Preparation Phase
Order Preparation Phase
Shipment Preparation Phase
Shipment Preparation Phase
Start 1
Create SAP Delivery
4
Carrier Bid Results
26
Select open TR, review
requirements / notes
6
Transportat ion Request sent to TM3 f rom SAP
5
Tender TL Load to preferred carrier
9
Carrier Accept load?
10
O rder Q uantity
31
Update PVD Tables
29
Prepare PVD update
spreadsheet
27
Select TL carrier and tender load
25
No
Load Carrier
11
G enerate BOL
13
Enter PGI
14
Daily File? to CTL
15
Carrier Freight Bill
24
Network Optimizat ion
Results
2
BMS Carrier rates (TL by lane, LTL general
discount only)
28
Place O rder
30Material Type
32Delivery
Date
33Ship to Location
34Special
Inst ructions
35
Plant Schedules Pickup with LTL Carrier
41
Receive Shipment
42
Preferred Carrier from
PVD
43
Transport Query YTO4
45
Send Shipment Unit to Plant /
Whse
46
KNMT Customer Material Record
47
Consolidate Shipments TL / LTL
50 Yes
Ship asTL or LTL
51
O verride Preferred TL Carrier
53
No
No
Yes
Yes
Missing Data - Transport Rep does not see rates!
59
Ship as TL
60
Ship as LTL
61O verride Preferred
LTL Carrier
62
No
Yes
End22
Tender LTL Load to
preferred carrier
63
Carrier Accept load?
64
No
Yes
Select LTL carrier and tender load
65
TL
LTL
Yes
Missing Data - TM3 does not show
consolidat ions in an easy format
66
How is the choice made to consolidate on TL or LTL . How is master bill of lading generated - load nose or tail? How does
system pull PVD for consolidation
67
Trend Analysis Voice of the Customer Voice of the Business Baseline Statistics
SIPOC
Project Charter
Process Mapping Discovery Kaizen
Gantt ChartStakeholder Mapping
Sean
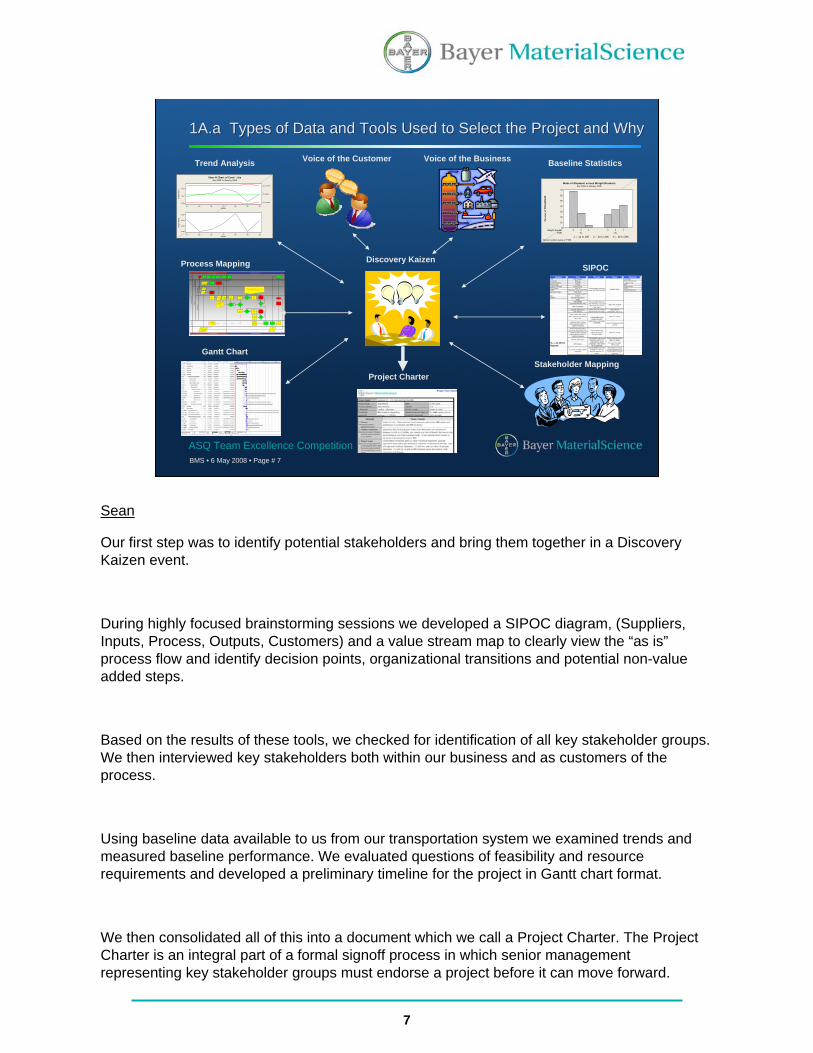
Our first step was to identify potential stakeholders and bring them together in a Discovery Kaizen event.
During highly focused brainstorming sessions we developed a SIPOC diagram, (Suppliers, Inputs, Process, Outputs, Customers) and a value stream map to clearly view the “as is”process flow and identify decision points, organizational transitions and potential non-value added steps.
Based on the results of these tools, we checked for identification of all key stakeholder groups. We then interviewed key stakeholders both within our business and as customers of the process.
Using baseline data available to us from our transportation system we examined trends and measured baseline performance. We evaluated questions of feasibility and resource requirements and developed a preliminary timeline for the project in Gantt chart format.
We then consolidated all of this into a document which we call a Project Charter. The Project Charter is an integral part of a formal signoff process in which senior management representing key stakeholder groups must endorse a project before it can move forward.
8
BMS • 6 May 2008 • Page # 8
ASQ Team Excellence Competition
Stakeholder MappingVoice of the CustomerVoice of the BusinessData Supporting Case for ChangeHigh Level Process Map (SIPOC Diagram)Cross Functional Process MappingDiscovery KaizenProject Charter
DEFINEDEFINE MEASUREMEASURE ANALYZEANALYZE IMPROVEIMPROVE CONTROLCONTROL
The Bayer MaterialScience Lean Six Sigma Process
Alignment
Feasibility
Return on Investment
A Compelling Case for Change?
1A.a Types of Data and Tools Used to Select the Project and Why1A.a Types of Data and Tools Used to Select the Project and Why
Sean
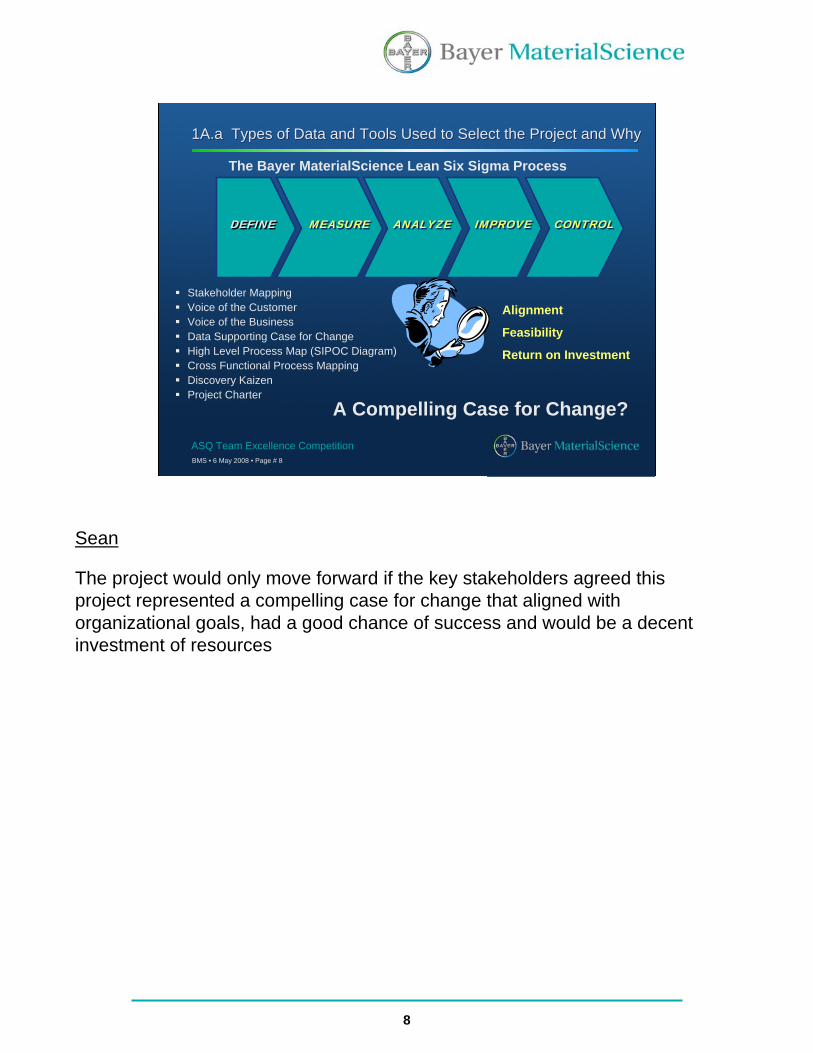
The project would only move forward if the key stakeholders agreed this project represented a compelling case for change that aligned with organizational goals, had a good chance of success and would be a decent investment of resources
9
BMS • 6 May 2008 • Page # 9
ASQ Team Excellence Competition
Sample
Sam
ple
Mea
n
JanDecNovOctSepAugJul
0.060
0.055
0.050
__X=0.05624
UCL=0.06209
LCL=0.05039
Sample
Sam
ple
Ran
ge
JanDecNovOctSepAugJul
0.275
0.250
0.225
0.200
Xbar-R Chart of Cost / LbsJuly 2005 to January 2006
Perc
ent
of T
OTS
HIP
WGT
TYPEWeight Bracket
LTLTL123123
70
60
50
40
30
20
10
0
Percent w ithin levels of TYPE.
Mode of Shipment versus Weight BracketsJuly 2005 to January 2006
1 = 14 to 16K 2 = 16 to 20K 3 = 20 to 25K
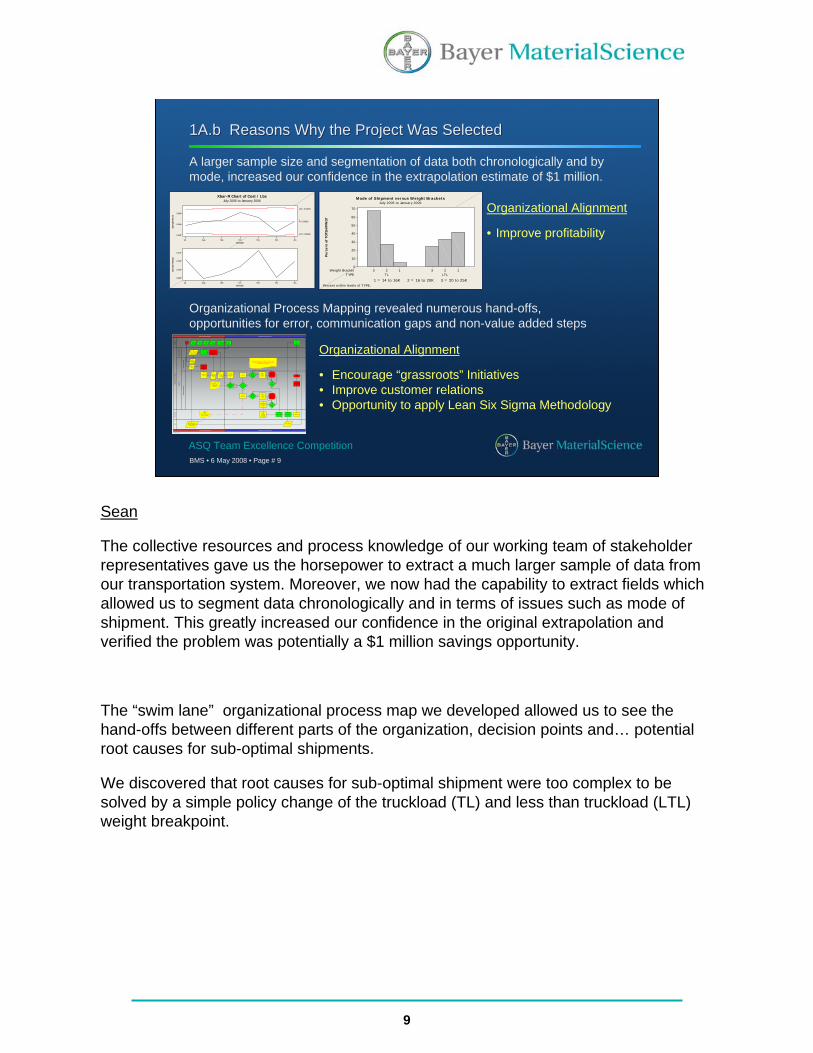
A larger sample size and segmentation of data both chronologically and by mode, increased our confidence in the extrapolation estimate of $1 million.
TL LTL Process.igx
Revised 5/19/2006
Cus
tom
erRe
gion
al S
ervi
ce C
ente
r
Cus
tom
er S
ervi
ceLo
gist
ics
Logi
stic
s S
trat
egy
Logi
stic
s O
pera
tions
Plan
t / W
hse
CTL
Order Preparation Phase
Order Preparation Phase
Shipment Preparation Phase
Shipment Preparation Phase
Start 1
Create SAP Delivery
4
Carrier Bid Results
26
Select open TR, review
requirements / notes
6
Transportation Request sent to TM3 from SAP
5
Tender TL Load to
preferred carrier
9
Carrier Accept
load?
10
Order Quant ity
31
Update PVD Tables
29
Prepare PVD update
spreadsheet
27
Select TL carrier and tender load
25
No
Load Carrier
11
Generate BOL
13
Enter PGI
14
Daily File? to CTL
15
Carrier Freight Bill
24
Network Optimization
Results
2
BMS Carrier rates (TL by lane, LTL general
discount only)
28
Place Order
30Material Type
32Delivery
Date
33Ship to
Locat ion
34Special
Instructions
35
Plant Schedules Pickup with LTL Carrier
41
Receive Shipment
42
Preferred Carrier f rom
PVD
43
Transport Query YTO4
45
Send Shipment Unit to Plant /
Whse
46
KNMT Customer Material Record
47
Consolidate Shipments TL / LTL
50 Yes
Ship asTL or LTL
51
Override Preferred TL Carrier
53
No
No
Yes
Yes
Missing Data - Transport Rep
does not see rates!
59
Ship as TL
60
Ship as LTL
61Override Preferred
LTL Carrier
62
No
Yes
End22
Tender LTL Load to
preferred carrier
63
Carrier Accept
load?
64
No
Yes
Select LTL carrier and tender load
65
TL
LTL
Yes
Missing Data - TM3 does not show
consolidations in an easy format
66
How is the choice made to consolidate on TL or LTL . How is master bill of lading generated - load nose or tail? How does
system pull PVD for consolidat ion
67
Organizational Process Mapping revealed numerous hand-offs, opportunities for error, communication gaps and non-value added steps
Organizational Alignment
• Improve profitability
Organizational Alignment
• Encourage “grassroots” Initiatives• Improve customer relations• Opportunity to apply Lean Six Sigma Methodology
1A.b Reasons Why the Project Was Selected1A.b Reasons Why the Project Was Selected
Sean
The collective resources and process knowledge of our working team of stakeholder representatives gave us the horsepower to extract a much larger sample of data from our transportation system. Moreover, we now had the capability to extract fields which allowed us to segment data chronologically and in terms of issues such as mode of shipment. This greatly increased our confidence in the original extrapolation and verified the problem was potentially a $1 million savings opportunity.
The “swim lane” organizational process map we developed allowed us to see the hand-offs between different parts of the organization, decision points and… potential root causes for sub-optimal shipments.
We discovered that root causes for sub-optimal shipment were too complex to be solved by a simple policy change of the truckload (TL) and less than truckload (LTL) weight breakpoint.
10
BMS • 6 May 2008 • Page # 10
ASQ Team Excellence Competition
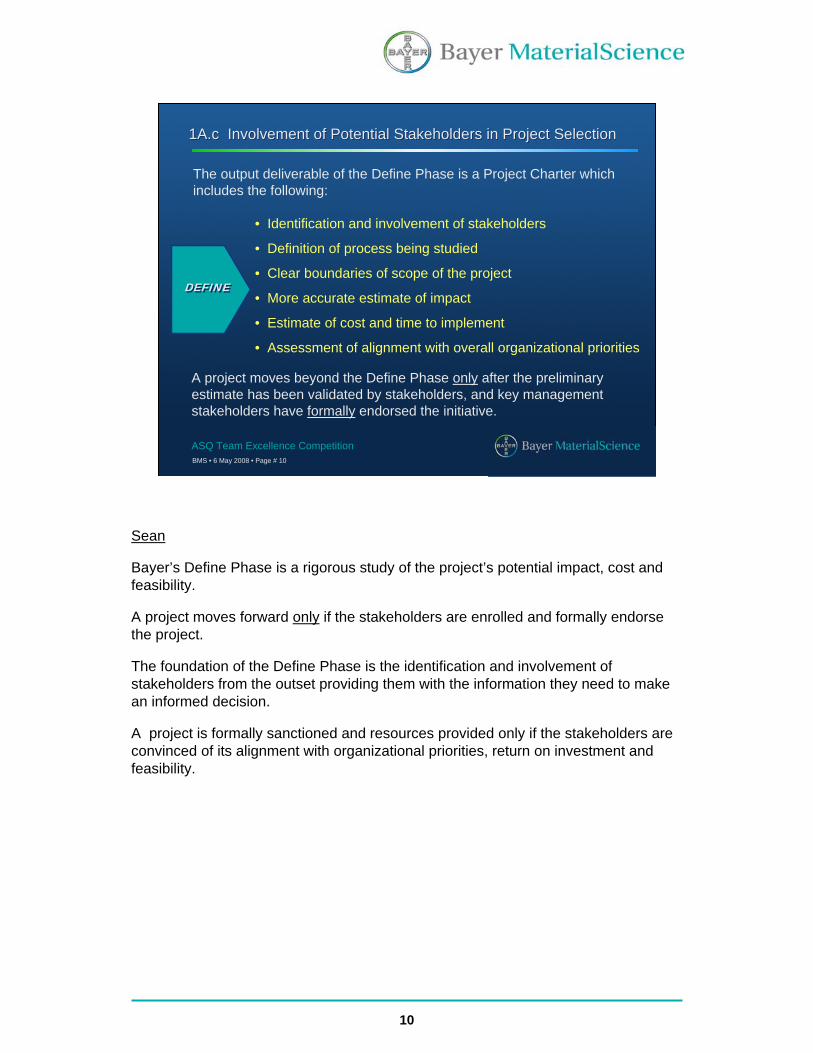
• Identification and involvement of stakeholders
• Definition of process being studied
• Clear boundaries of scope of the project
• More accurate estimate of impact
• Estimate of cost and time to implement
• Assessment of alignment with overall organizational priorities
DEFINEDEFINE
The output deliverable of the Define Phase is a Project Charter which includes the following:
A project moves beyond the Define Phase only after the preliminary estimate has been validated by stakeholders, and key management stakeholders have formally endorsed the initiative.
1A.c Involvement of Potential Stakeholders in Project Selection1A.c Involvement of Potential Stakeholders in Project Selection
Sean
Bayer’s Define Phase is a rigorous study of the project’s potential impact, cost and feasibility.
A project moves forward only if the stakeholders are enrolled and formally endorse the project.
The foundation of the Define Phase is the identification and involvement of stakeholders from the outset providing them with the information they need to make an informed decision.
A project is formally sanctioned and resources provided only if the stakeholders are convinced of its alignment with organizational priorities, return on investment and feasibility.
11
BMS • 6 May 2008 • Page # 11
ASQ Team Excellence Competition
Senior Management Champions & SponsorsProcess Owner Sponsor
Business Excellence ChampionFinance
Business ExcellenceTransportation Operations Logistics Strategy &
Procurement
Customer Master Data Material Master Data
Core Team of Stakeholder
RepresentativesBusiness Intelligence Financial
Bayer Technology
ServicesCustomer Service
1A.c Involvement of Potential Stakeholders in Project Selection1A.c Involvement of Potential Stakeholders in Project Selection
Sean
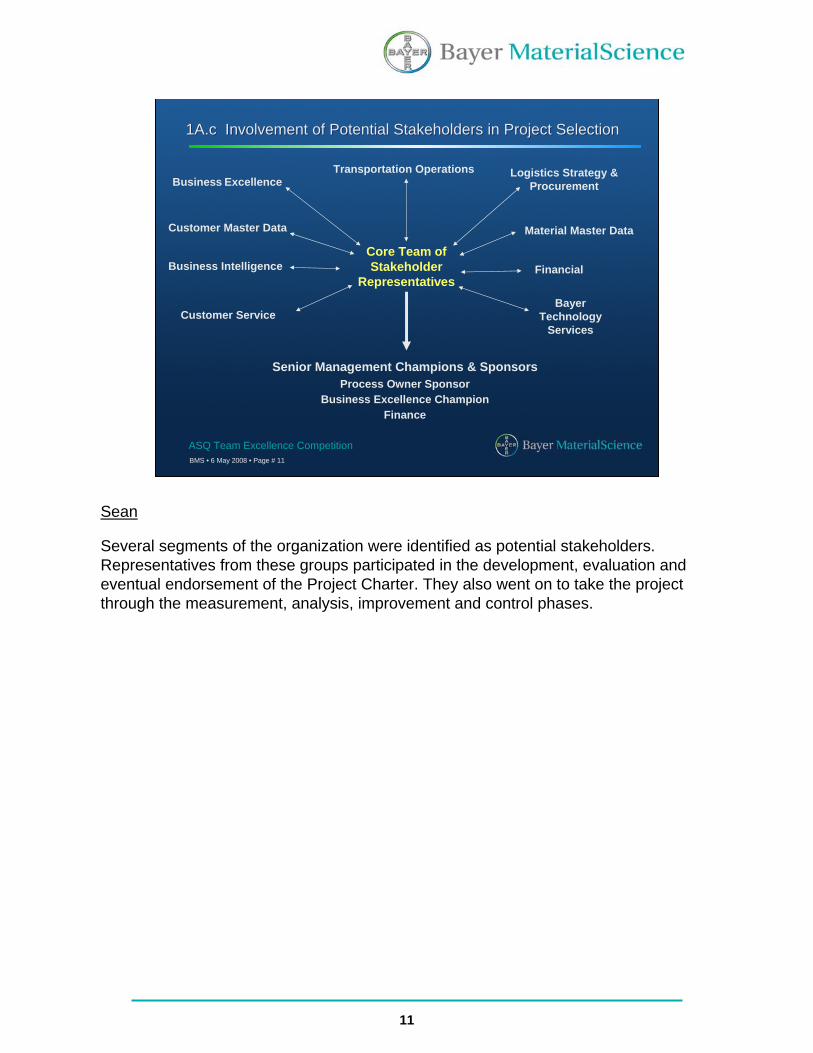
Several segments of the organization were identified as potential stakeholders. Representatives from these groups participated in the development, evaluation and eventual endorsement of the Project Charter. They also went on to take the project through the measurement, analysis, improvement and control phases.
12
BMS • 6 May 2008 • Page # 12
ASQ Team Excellence Competition
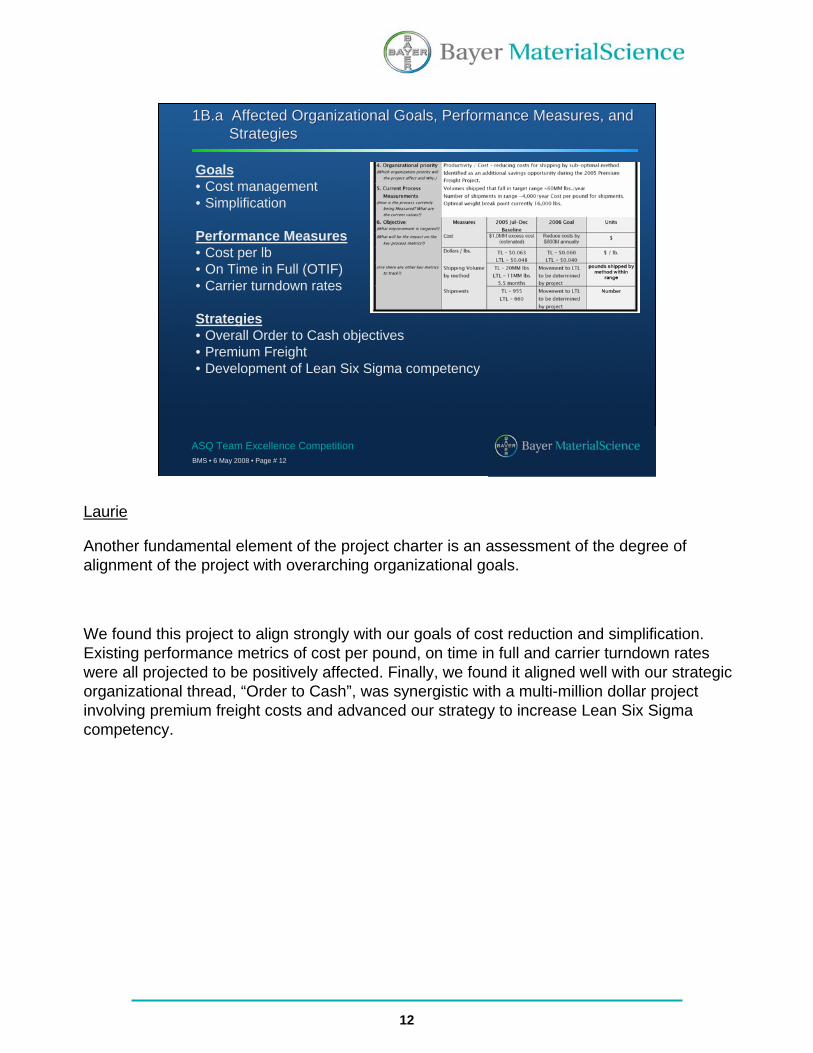
1B.a Affected Organizational Goals, Performance Measures, and Strategies
1B.a Affected Organizational Goals, Performance Measures, and Strategies
Goals• Cost management• Simplification
Performance Measures• Cost per lb• On Time in Full (OTIF)• Carrier turndown rates
Strategies• Overall Order to Cash objectives• Premium Freight• Development of Lean Six Sigma competency
Laurie
Another fundamental element of the project charter is an assessment of the degree of alignment of the project with overarching organizational goals.
We found this project to align strongly with our goals of cost reduction and simplification. Existing performance metrics of cost per pound, on time in full and carrier turndown rates were all projected to be positively affected. Finally, we found it aligned well with our strategic organizational thread, “Order to Cash”, was synergistic with a multi-million dollar project involving premium freight costs and advanced our strategy to increase Lean Six Sigma competency.
13
BMS • 6 May 2008 • Page # 13
ASQ Team Excellence Competition
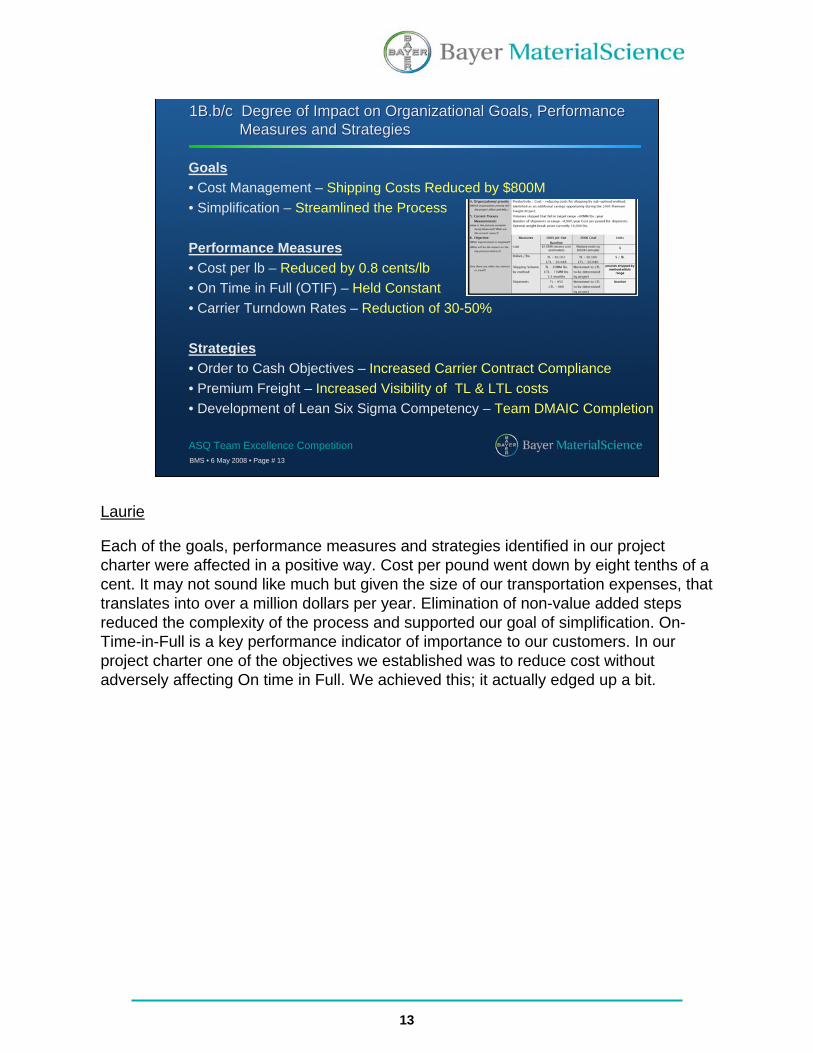
1B.b/c Degree of Impact on Organizational Goals, Performance Measures and Strategies
1B.b/c Degree of Impact on Organizational Goals, Performance Measures and Strategies
Goals• Cost Management – Shipping Costs Reduced by $800M• Simplification – Streamlined the Process
Performance Measures• Cost per lb – Reduced by 0.8 cents/lb• On Time in Full (OTIF) – Held Constant• Carrier Turndown Rates – Reduction of 30-50%
Strategies• Order to Cash Objectives – Increased Carrier Contract Compliance• Premium Freight – Increased Visibility of TL & LTL costs• Development of Lean Six Sigma Competency – Team DMAIC Completion
Laurie
Each of the goals, performance measures and strategies identified in our project charter were affected in a positive way. Cost per pound went down by eight tenths of a cent. It may not sound like much but given the size of our transportation expenses, that translates into over a million dollars per year. Elimination of non-value added steps reduced the complexity of the process and supported our goal of simplification. On-Time-in-Full is a key performance indicator of importance to our customers. In our project charter one of the objectives we established was to reduce cost without adversely affecting On time in Full. We achieved this; it actually edged up a bit.
14
BMS • 6 May 2008 • Page # 14
ASQ Team Excellence Competition
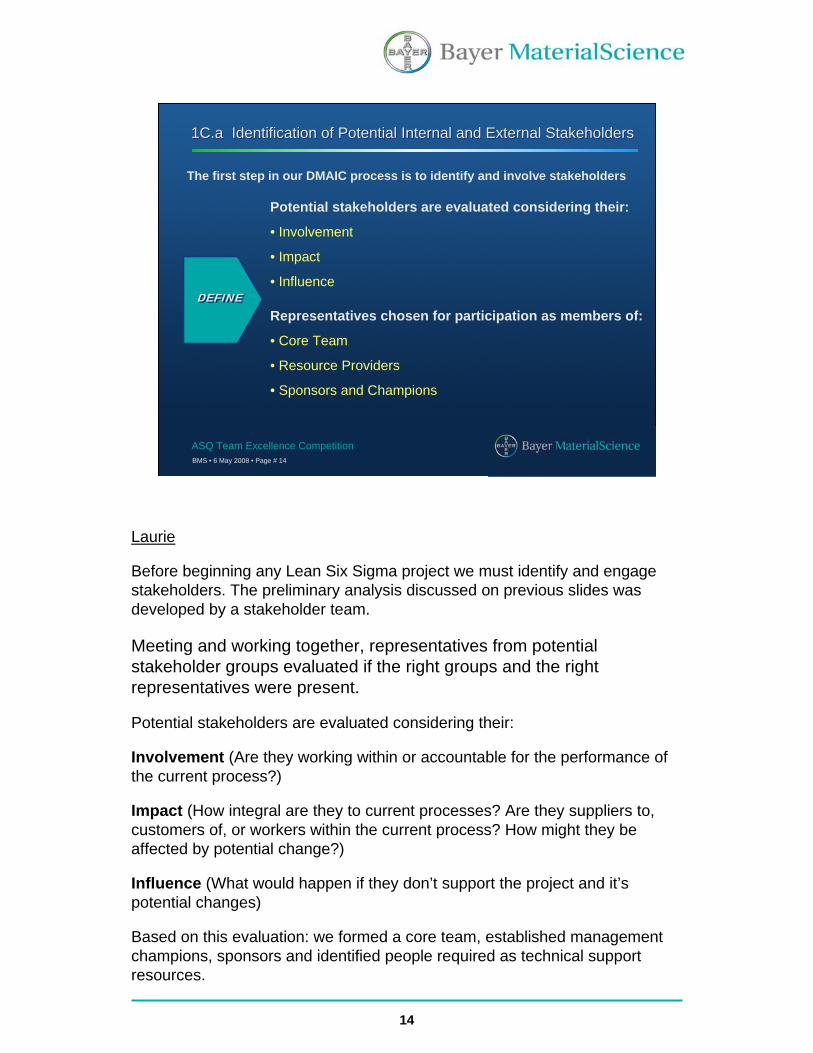
1C.a Identification of Potential Internal and External Stakeholders1C.a Identification of Potential Internal and External Stakeholders
Representatives chosen for participation as members of:
• Core Team
• Resource Providers
• Sponsors and Champions
DEFINEDEFINE
The first step in our DMAIC process is to identify and involve stakeholders
Potential stakeholders are evaluated considering their:
• Involvement
• Impact
• Influence
Laurie
Before beginning any Lean Six Sigma project we must identify and engage stakeholders. The preliminary analysis discussed on previous slides was developed by a stakeholder team.
Meeting and working together, representatives from potential stakeholder groups evaluated if the right groups and the right representatives were present.
Potential stakeholders are evaluated considering their:
Involvement (Are they working within or accountable for the performance of the current process?)
Impact (How integral are they to current processes? Are they suppliers to, customers of, or workers within the current process? How might they be affected by potential change?)
Influence (What would happen if they don’t support the project and it’s potential changes)
Based on this evaluation: we formed a core team, established management champions, sponsors and identified people required as technical support resources.
15
BMS • 6 May 2008 • Page # 15
ASQ Team Excellence Competition
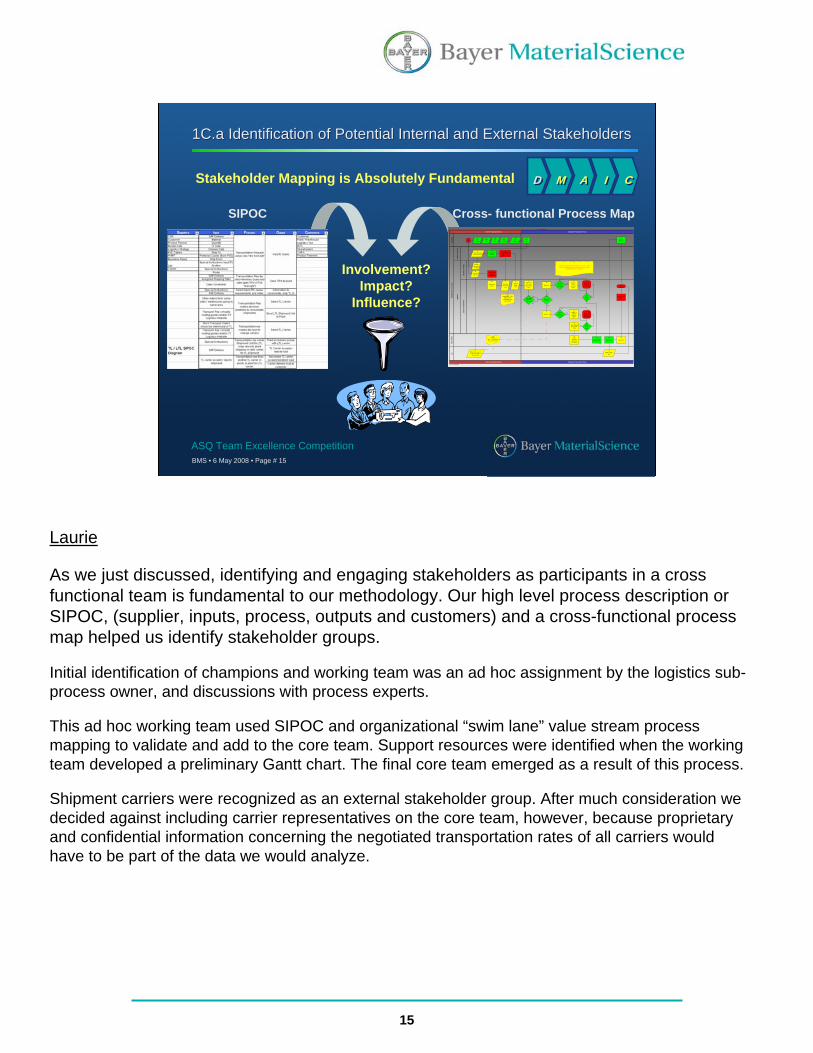
1C.a Identification of Potential Internal and External Stakeholders1C.a Identification of Potential Internal and External Stakeholders
SIPOC Cross- functional Process Map
Involvement? Impact?
Influence?
Stakeholder Mapping is Absolutely Fundamental DD MM AA II CC
TL LTL Process.igx
Revised 5/19/2006
Cus
tom
erR
egio
nal S
ervi
ce C
ente
r
Cus
tom
er S
ervi
ceLo
gist
ics
Logi
stic
s S
trat
egy
Logi
stic
s O
pera
tions
Pla
nt /
Whs
eC
TL
Order Preparation Phase
Order Preparation Phase
Shipment Preparation Phase
Shipment Preparation Phase
Start 1
Create SAP Delivery
4
Carrier Bid Results
26
Select open TR, review
requirements / notes
6
Transportation Request sent to TM3 from SAP
5
Tender TL Load to
preferred carrier
9
Carrier Accept load?
10
Order Quantity
31
Update PVD Tables
29
Prepare PVD update
spreadsheet
27
Select TL carrier and tender load
25
No
Load Carrier
11
Generate BOL
13
Enter PGI
14
Daily File? to CTL
15
Carrier Freight Bill
24
Network Optimization
Results
2
BMS Carrier rates (TL by lane, LTL general
discount only)
28
Place Order
30Material Type
32Delivery
Date
33Ship to
Location
34Special
Instructions
35
Plant Schedules Pickup with LTL Carrier
41
Receive Shipment
42
Preferred Carrier from
PVD
43
Transport Query YTO4
45
Send Shipment Unit to Plant /
Whse
46
KNMT Customer Material Record
47
Consolidate Shipments TL / LTL
50 Yes
Ship asTL or LTL
51
Override Preferred TL Carrier
53
No
No
Yes
Yes
Missing Data - Transport Rep does not see rates!
59
Ship as TL
60
Ship as LTL
61Override Preferred
LTL Carrier
62
No
Yes
End22
Tender LTL Load to
preferred carrier
63
Carrier Accept load?
64
No
Yes
Select LTL carrier and tender load
65
TL
LTL
Yes
Missing Data - TM3 does not show
consolidations in an easy format
66
How is the choice made to consolidate on TL or LTL . How is master bill of lading generated - load nose or tail? How does
system pull PVD for consolidation
67
Laurie
As we just discussed, identifying and engaging stakeholders as participants in a cross functional team is fundamental to our methodology. Our high level process description or SIPOC, (supplier, inputs, process, outputs and customers) and a cross-functional process map helped us identify stakeholder groups.
Initial identification of champions and working team was an ad hoc assignment by the logistics sub-process owner, and discussions with process experts.
This ad hoc working team used SIPOC and organizational “swim lane” value stream process mapping to validate and add to the core team. Support resources were identified when the working team developed a preliminary Gantt chart. The final core team emerged as a result of this process.
Shipment carriers were recognized as an external stakeholder group. After much consideration we decided against including carrier representatives on the core team, however, because proprietary and confidential information concerning the negotiated transportation rates of all carriers would have to be part of the data we would analyze.
16
BMS • 6 May 2008 • Page # 16
ASQ Team Excellence Competition
1C.b Degrees of Potential Impact to Stakeholders1C.b Degrees of Potential Impact to Stakeholders
Perc
ent
of T
OTS
HIP
WGT
TYPEWeight Bracket
LTLTL123123
70
60
50
40
30
20
10
0
Percent within levels of TYPE.
Mode of Shipment versus Weight BracketsJuly 2005 to January 2006
1 = 14 to 16K 2 = 16 to 20K 3 = 20 to 25K
TL LTL Process.igx
Revised 5/19/2006
Cust
omer
Reg
iona
l Ser
vice
Cen
ter
Cus
tom
er S
ervi
ceLo
gist
ics
Logi
stic
s S
trat
egy
Logi
stic
s O
pera
tions
Pla
nt /
Whs
eCT
L
Order Preparation Phase
Order Preparation Phase
Shipment Preparation Phase
Shipment Preparation Phase
Start 1
Create SAP Delivery
4
Carrier Bid Results
26
Select open TR, review
requirements / notes
6
Transportation Request sent to TM3 from SAP
5
Tender TL Load to
preferred carr ier
9
Carrier Accept load?
10
Order Quant ity
31
Update PVD Tables
29
Prepare PVD update
spreadsheet
27
Select TL carrier and tender load
25
No
Load Carrier
11
Generate BOL
13
Enter PGI
14
Daily F ile? to CTL
15
Carrier Freight Bill
24
Network Optimizat ion
Results
2
BMS Carrier rates (TL by lane, LTL general
discount only)
28
Place Order
30Material Type
32Delivery
Date
33Ship to
Location
34Special
Instructions
35
Plant Schedules Pickup with LTL Carrier
41
Receive Shipment
42
Preferred Carrier from
PVD
43
T ransport Query YTO4
45
Send Shipment Unit to Plant /
Whse
46
KNMT Customer Material Record
47
Consolidate Shipments TL / LT L
50 Yes
Ship asTL or LTL
51
Override Preferred T L Carrier
53
No
No
Yes
Yes
Missing Data - Transport Rep does not see rates!
59
Ship as TL
60
Ship as LTL
61Override Preferred
LTL Carrier
62
No
Yes
End22
Tender LTL Load to
pref erred carrier
63
Carrier Accept load?
64
No
Yes
Select LTL carrier and tender load
65
TL
LTL
Yes
Missing Data - TM3 does not show
consolidations in an easy format
66
How is the choice made to consolidate on TL or LTL . How is master bill of lading generated - load nose or tail? How does
system pull PVD for consolidat ion
67
Sample
Sam
ple
Me
an
JanDecNovOctSepAugJul
0.060
0.055
0.050
__X=0.05624
UCL=0.06209
LCL=0.05039
Sample
Sam
ple
Ra
nge
JanDecNovOctSepAugJul
0.275
0.250
0.225
0.200
Xbar-R Chart of Cost / LbsJuly 2005 to January 2006
Cause and Effect Value Stream Mapping Data Segmentation and Performance KPIs (OTIF)
Subjective Tools Objective Tools
Assessment of Impact on Each Stakeholder Group
Positives
• High
• Medium
• Low
Negatives
• High
• Medium
• Low
Laurie
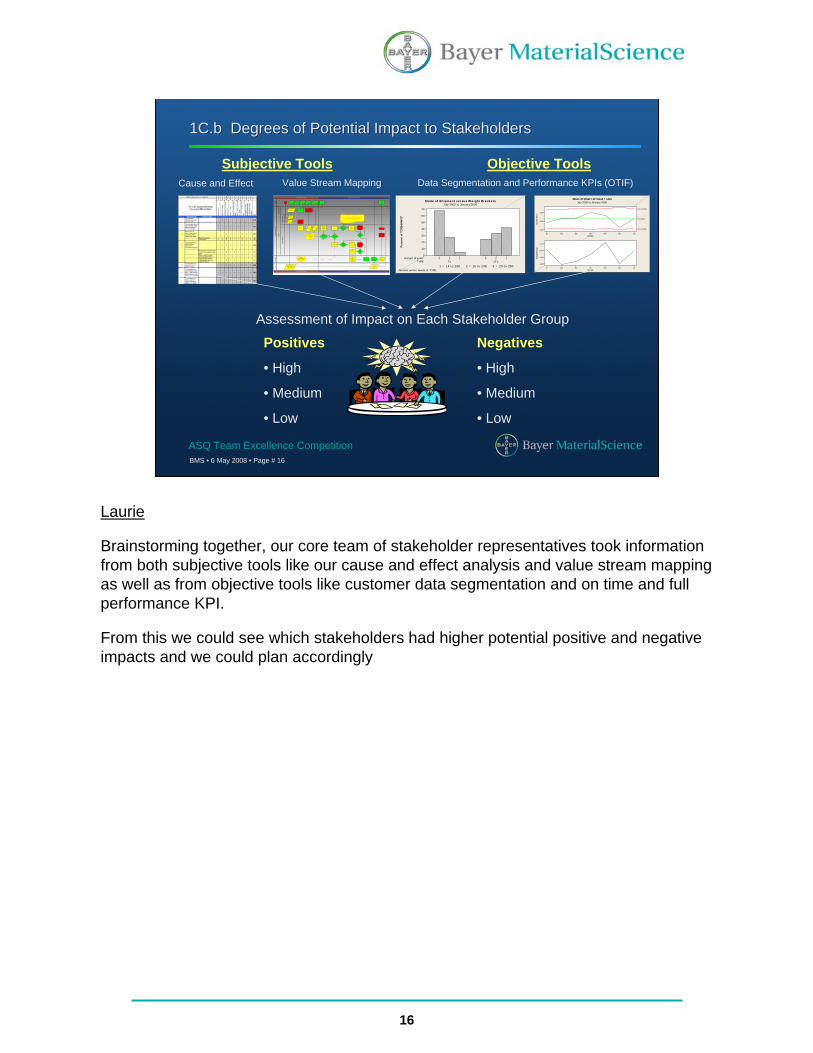
Brainstorming together, our core team of stakeholder representatives took information from both subjective tools like our cause and effect analysis and value stream mapping as well as from objective tools like customer data segmentation and on time and full performance KPI.
From this we could see which stakeholders had higher potential positive and negative impacts and we could plan accordingly
17
BMS • 6 May 2008 • Page # 17
ASQ Team Excellence Competition
1C.c Types of Potential Impact to Stakeholders1C.c Types of Potential Impact to Stakeholders
Carrier damages from cross-docking more LTLBetter customer service from BMS Better OTIFCustomers
Project Failure would damage LSS CredibilityIncreasing Organizational LSS CompetencyBusiness Excellence
Carrier damages from cross-docking more LTLBetter performance against KPI, OTIFLogistics
Loss of some revenueContract compliance, More businessCarriers
New KPI’s to create and monitorParticipation in a project that improves profitabilityFinance
Conflict with existing workloadCould make their job easier
Material Master Data
Loss of decision making power over carriersSimplified decision making processTransportation Operations
Conflict with existing workload to obtain data for team useIncreased project competencyBusiness Intelligence
Conflict with existing workload, Could cause confusionCould make their job easierCustomer Master Data
Potential Negative ImpactPotential Positive ImpactStakeholder
Laurie
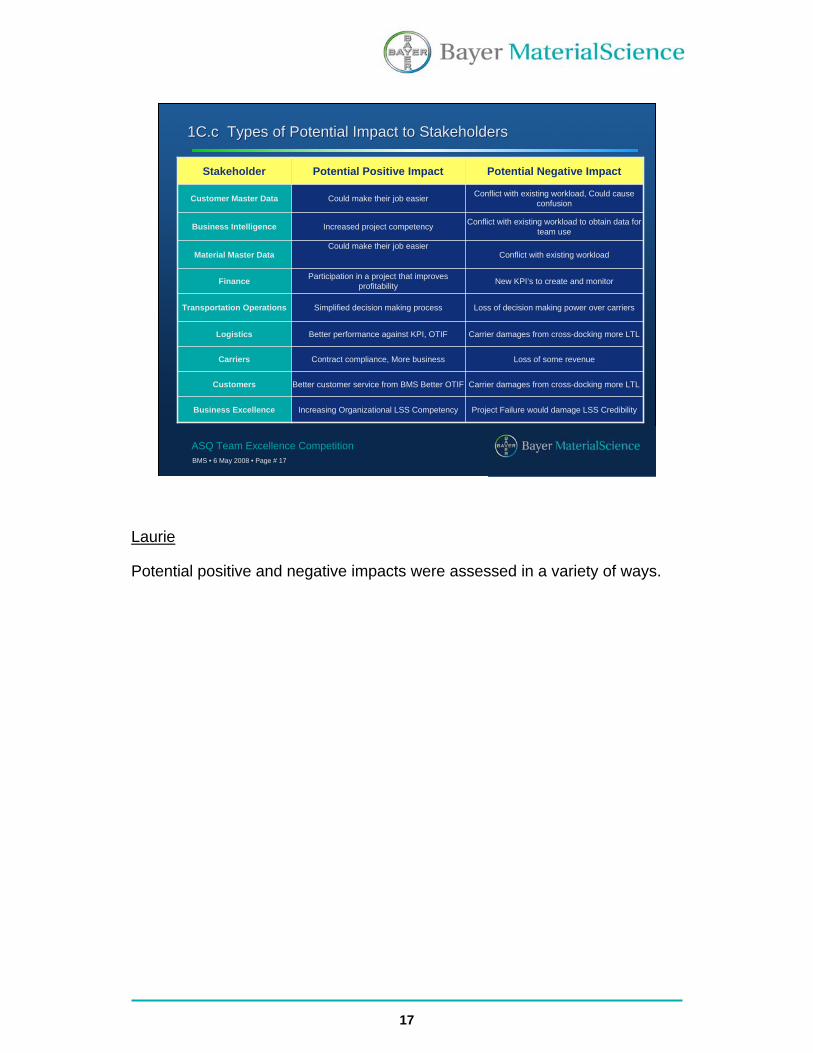
Potential positive and negative impacts were assessed in a variety of ways.
18
BMS • 6 May 2008 • Page # 18
ASQ Team Excellence Competition
Section 2: Current Situation AnalysisSection 2: Current Situation Analysis
Sean
Current Situation Analysis
19
BMS • 6 May 2008 • Page # 19
ASQ Team Excellence Competition
2A.a Methods and Tools to Identify Root Causes and Opportunities2A.a Methods and Tools to Identify Root Causes and Opportunities
Identifying the critical X’s begins with verifying the integrity of data
DEFINEDEFINE MEASUREMEASURE
Shipping Cost (Y) = f (x1,x2,x3 …)
Measurement Systems Analysis• Data segmentation strategy• Data extraction strategy• Data integrity challenge
Cause & Effect MatrixProcess Variables Map
Sean
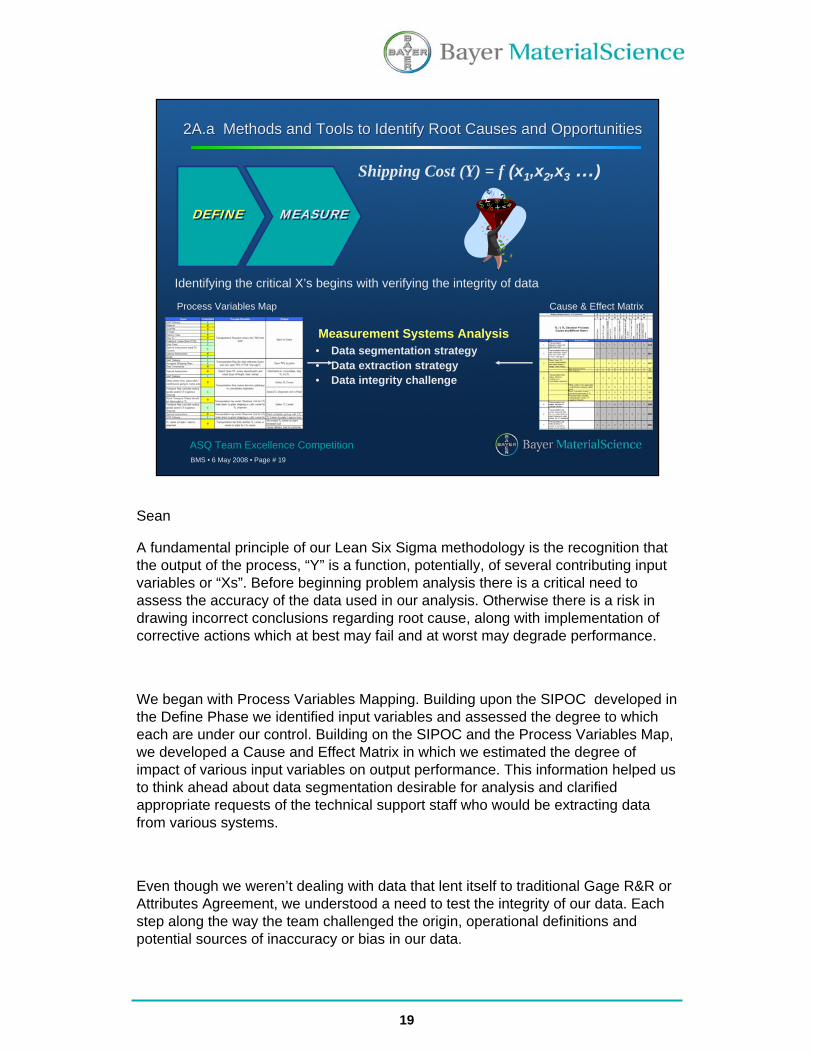
A fundamental principle of our Lean Six Sigma methodology is the recognition that the output of the process, “Y” is a function, potentially, of several contributing input variables or “Xs”. Before beginning problem analysis there is a critical need to assess the accuracy of the data used in our analysis. Otherwise there is a risk in drawing incorrect conclusions regarding root cause, along with implementation of corrective actions which at best may fail and at worst may degrade performance.
We began with Process Variables Mapping. Building upon the SIPOC developed in the Define Phase we identified input variables and assessed the degree to which each are under our control. Building on the SIPOC and the Process Variables Map, we developed a Cause and Effect Matrix in which we estimated the degree of impact of various input variables on output performance. This information helped us to think ahead about data segmentation desirable for analysis and clarified appropriate requests of the technical support staff who would be extracting data from various systems.
Even though we weren’t dealing with data that lent itself to traditional Gage R&R or Attributes Agreement, we understood a need to test the integrity of our data. Each step along the way the team challenged the origin, operational definitions and potential sources of inaccuracy or bias in our data.
20
BMS • 6 May 2008 • Page # 20
ASQ Team Excellence Competition
Process Variables Map
Process Variables Map
2A.a Methods and Tools to Identify Root Causes and Opportunities2A.a Methods and Tools to Identify Root Causes and Opportunities
DD MM AA II CC
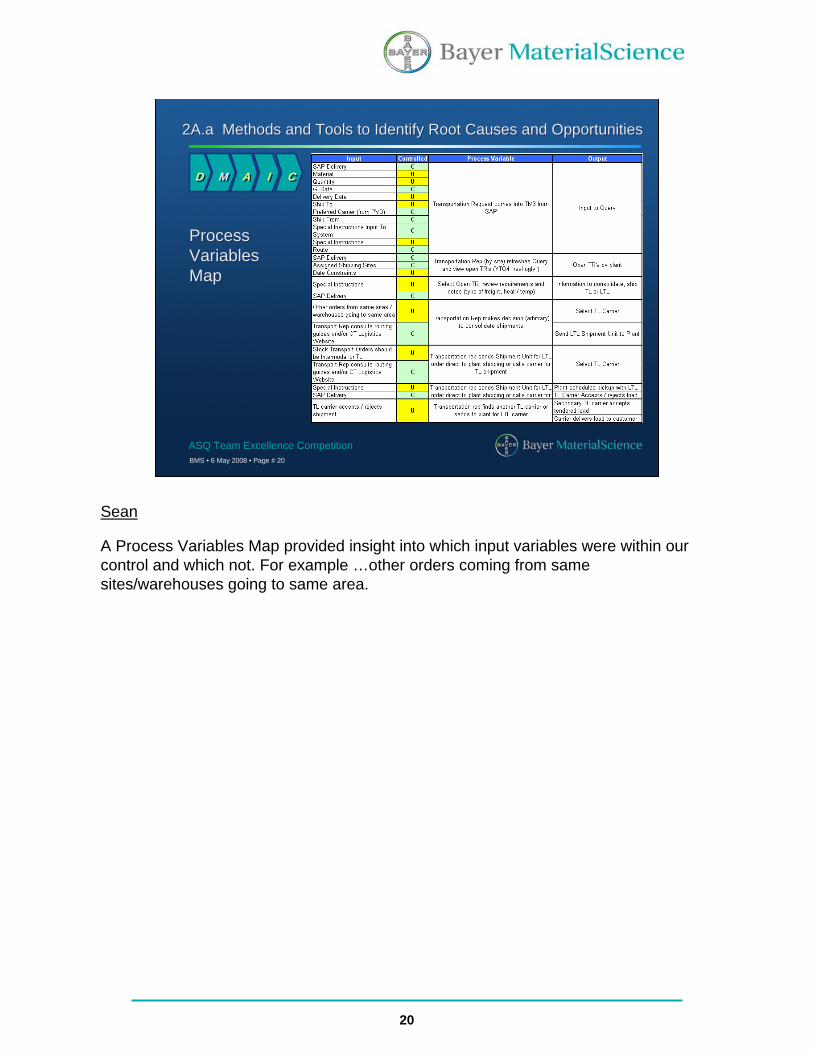
Sean
A Process Variables Map provided insight into which input variables were within our control and which not. For example …other orders coming from same sites/warehouses going to same area.
21
BMS • 6 May 2008 • Page # 21
ASQ Team Excellence Competition
Cause&
EffectsMatrix
Cause&
EffectsMatrix
2A.a Methods and Tools to Identify Root Causes and Opportunities2A.a Methods and Tools to Identify Root Causes and Opportunities
DD MM AA II CC
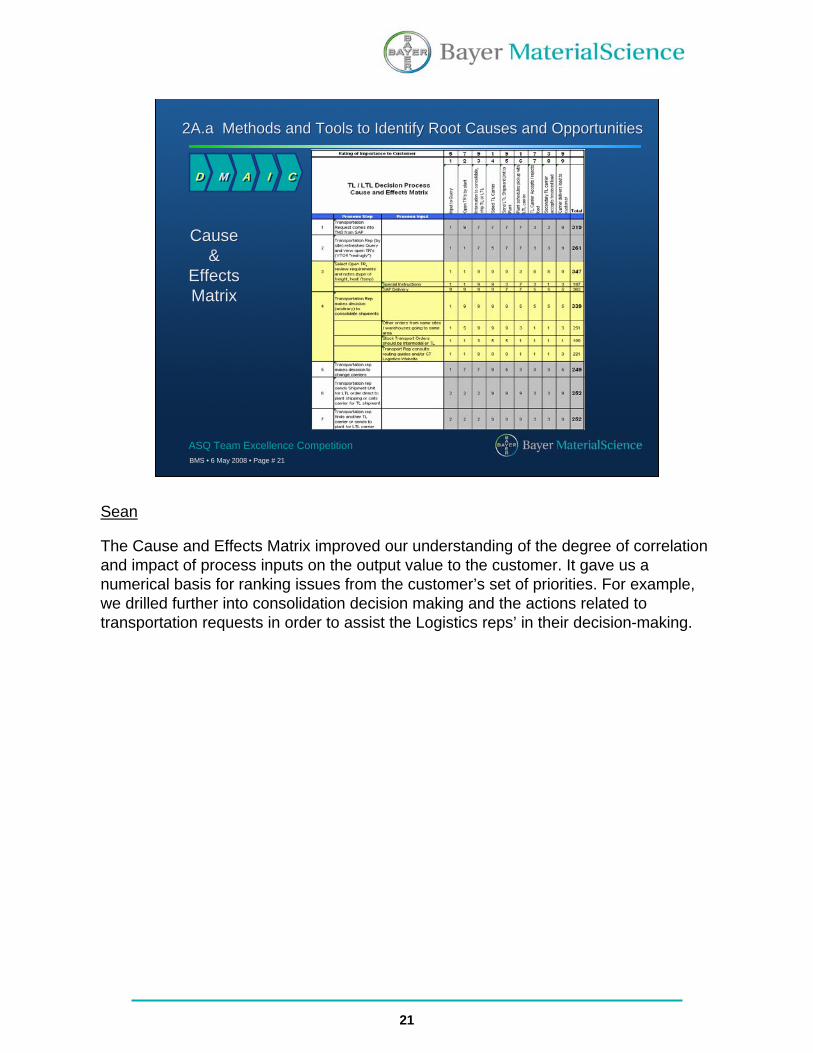
Sean
The Cause and Effects Matrix improved our understanding of the degree of correlation and impact of process inputs on the output value to the customer. It gave us a numerical basis for ranking issues from the customer’s set of priorities. For example, we drilled further into consolidation decision making and the actions related to transportation requests in order to assist the Logistics reps’ in their decision-making.
22
BMS • 6 May 2008 • Page # 22
ASQ Team Excellence Competition
DEFINEDEFINE MEASUREMEASURE ANALYZEANALYZE
Failure Modes and Effects Analysis (FMEA)
Data segmentation
Statistical analysis
Shipping Cost (Y) = f (x1,x2,x3 …)
2A.a Methods and Tools to Identify Root Causes and Opportunities2A.a Methods and Tools to Identify Root Causes and Opportunities
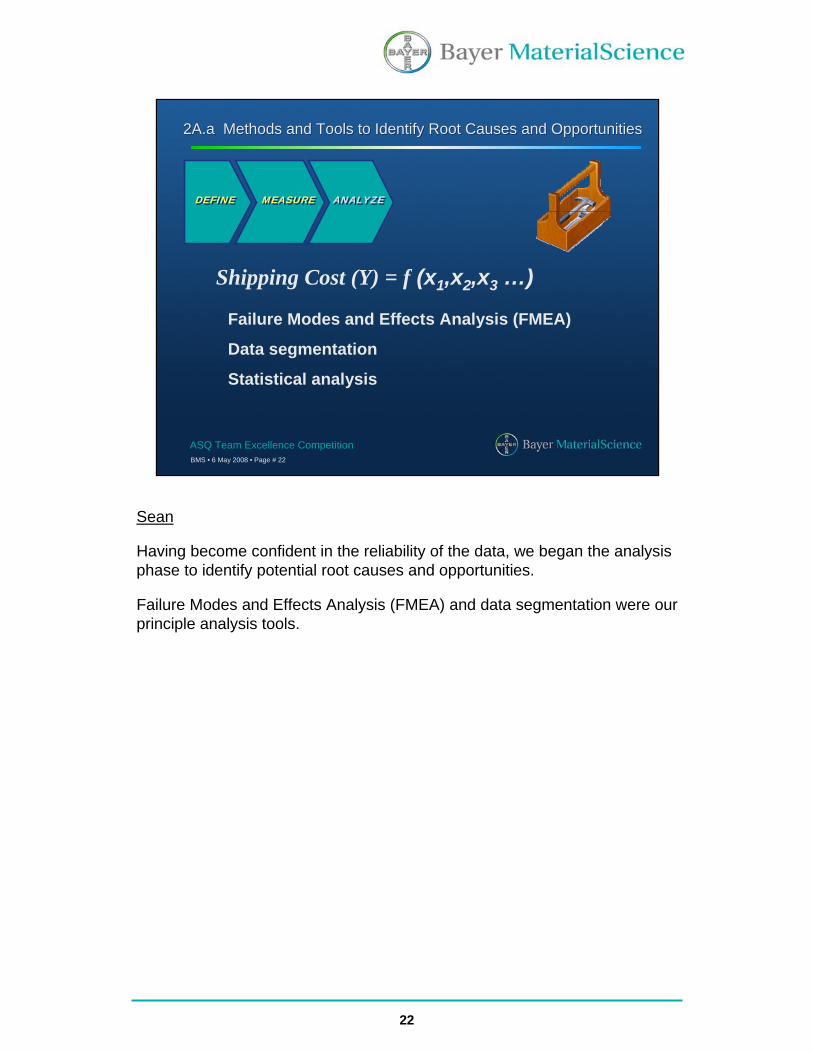
Sean
Having become confident in the reliability of the data, we began the analysis phase to identify potential root causes and opportunities.
Failure Modes and Effects Analysis (FMEA) and data segmentation were our principle analysis tools.
23
BMS • 6 May 2008 • Page # 23
ASQ Team Excellence Competition
Process Variables Map Cause & Effects Matrix
Failure Modes and Effects Analysis
Multiplying
• Severity of occurrence
• Probability of occurrence
• Ability to detect
Yielded
50 potential failure modes ranked by their Risk Probability Number (RPN)
What went in• Process input • Potential failure mode• Potential failure cause• Potential failure effect
2A.b Analysis of Data to Identify Possible Root Causes and Opportunities
2A.b Analysis of Data to Identify Possible Root Causes and Opportunities
DD MM AA II CC
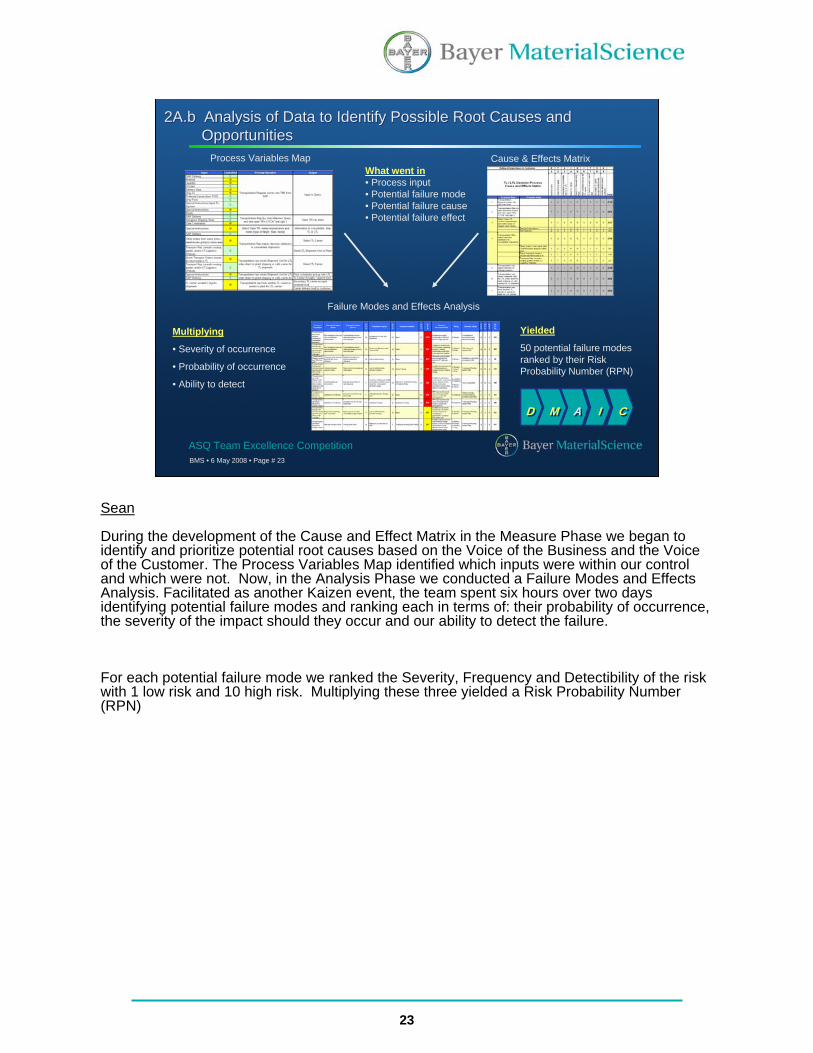
Sean
During the development of the Cause and Effect Matrix in the Measure Phase we began to identify and prioritize potential root causes based on the Voice of the Business and the Voice of the Customer. The Process Variables Map identified which inputs were within our control and which were not. Now, in the Analysis Phase we conducted a Failure Modes and Effects Analysis. Facilitated as another Kaizen event, the team spent six hours over two days identifying potential failure modes and ranking each in terms of: their probability of occurrence, the severity of the impact should they occur and our ability to detect the failure.
For each potential failure mode we ranked the Severity, Frequency and Detectibility of the risk with 1 low risk and 10 high risk. Multiplying these three yielded a Risk Probability Number (RPN)
24
BMS • 6 May 2008 • Page # 24
ASQ Team Excellence Competition
Perc
ent
of T
OTS
HIP
WGT
TYPEWeight Bracket
LTLTL123123
70
60
50
40
30
20
10
0
Percent within levels of TYPE.
Mode of Shipment versus Weight BracketsJuly 2005 to January 2006
1 = 14 to 16K 2 = 16 to 20K 3 = 20 to 25K
2A.b Analysis of Data to Identify Possible Root Causes and Opportunities
2A.b Analysis of Data to Identify Possible Root Causes and Opportunities
Data stratification example Data segmentation example
Data stratification and segmentation
$/Lb. (Y) = f (origin, destination, carrier, customer, product, mode, date…)
AugJulJunMayAprMarFebJanDecNovOctSepAugJul
0.7
0.6
0.5
0.4
0.3
0.2
Month
Perc
ent
Ship
ped
TL I
nste
ad o
f LT
L
_P=0.4368
UCL=0.5596
LCL=0.3141
1
1
1
P Chart of Shipments in 16 -20 K Weight Range Defect Defined As a TL Shipment as Opposed to an LTL Shipment
1 Sigma
2 Sigma
Note: Sigma Levels Assume a Goal of Zero TL in This Weight Range
DD MM AA II CC
Sean
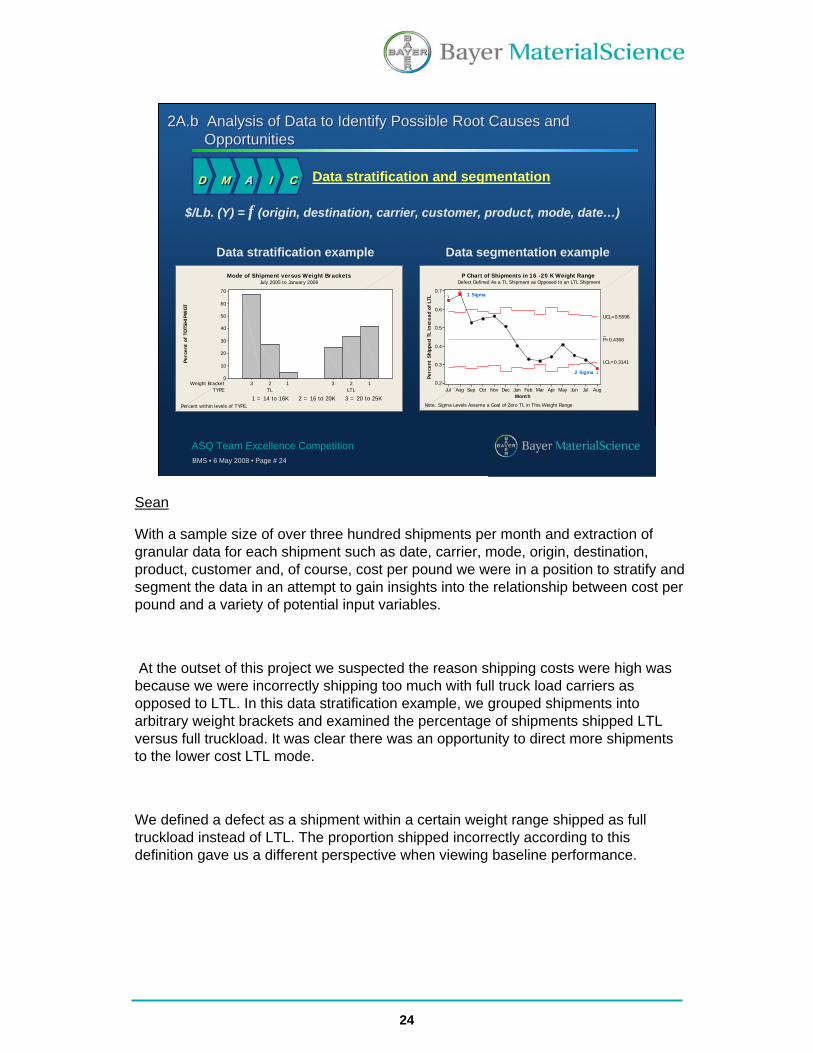
With a sample size of over three hundred shipments per month and extraction of granular data for each shipment such as date, carrier, mode, origin, destination, product, customer and, of course, cost per pound we were in a position to stratify and segment the data in an attempt to gain insights into the relationship between cost per pound and a variety of potential input variables.
At the outset of this project we suspected the reason shipping costs were high was because we were incorrectly shipping too much with full truck load carriers as opposed to LTL. In this data stratification example, we grouped shipments into arbitrary weight brackets and examined the percentage of shipments shipped LTL versus full truckload. It was clear there was an opportunity to direct more shipments to the lower cost LTL mode.
We defined a defect as a shipment within a certain weight range shipped as full truckload instead of LTL. The proportion shipped incorrectly according to this definition gave us a different perspective when viewing baseline performance.
25
BMS • 6 May 2008 • Page # 25
ASQ Team Excellence Competition
Senior Management Champions & SponsorsProcess Owner Sponsor
Business Excellence ChampionFinance
Business ExcellenceTransportation Operations Logistics Strategy and
Procurement
Customer Master Data Material Master DataCore Team of Stakeholder
RepresentativesBusiness Intelligence Financial
Bayer Technology
ServicesCustomer Service
2A.c How Stakeholders were Involved in Identifying Root Causes and Opportunities2A.c How Stakeholders were Involved in Identifying Root Causes and Opportunities
Sean
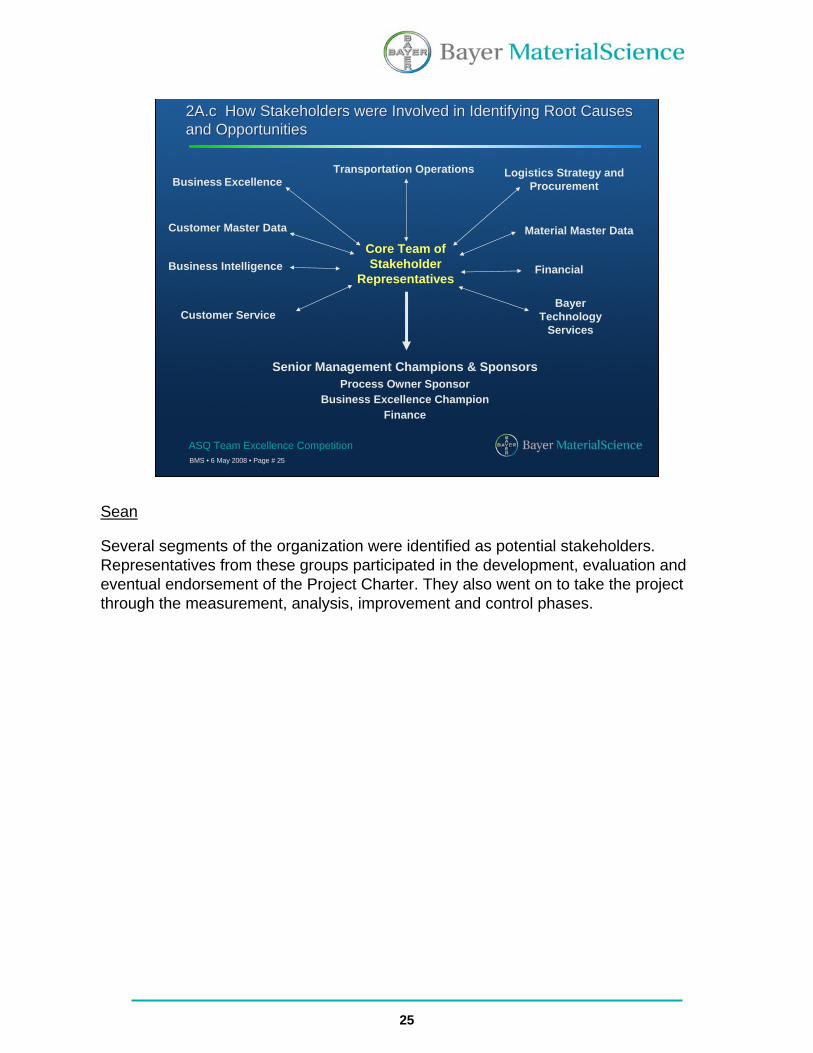
Several segments of the organization were identified as potential stakeholders. Representatives from these groups participated in the development, evaluation and eventual endorsement of the Project Charter. They also went on to take the project through the measurement, analysis, improvement and control phases.
26
BMS • 6 May 2008 • Page # 26
ASQ Team Excellence Competition
2B.a Analysis of Data to Select Final Root Causes and Opportunities2B.a Analysis of Data to Select Final Root Causes and Opportunities
(FMEA: page 1 of 5 ranked by RPN)
Sean
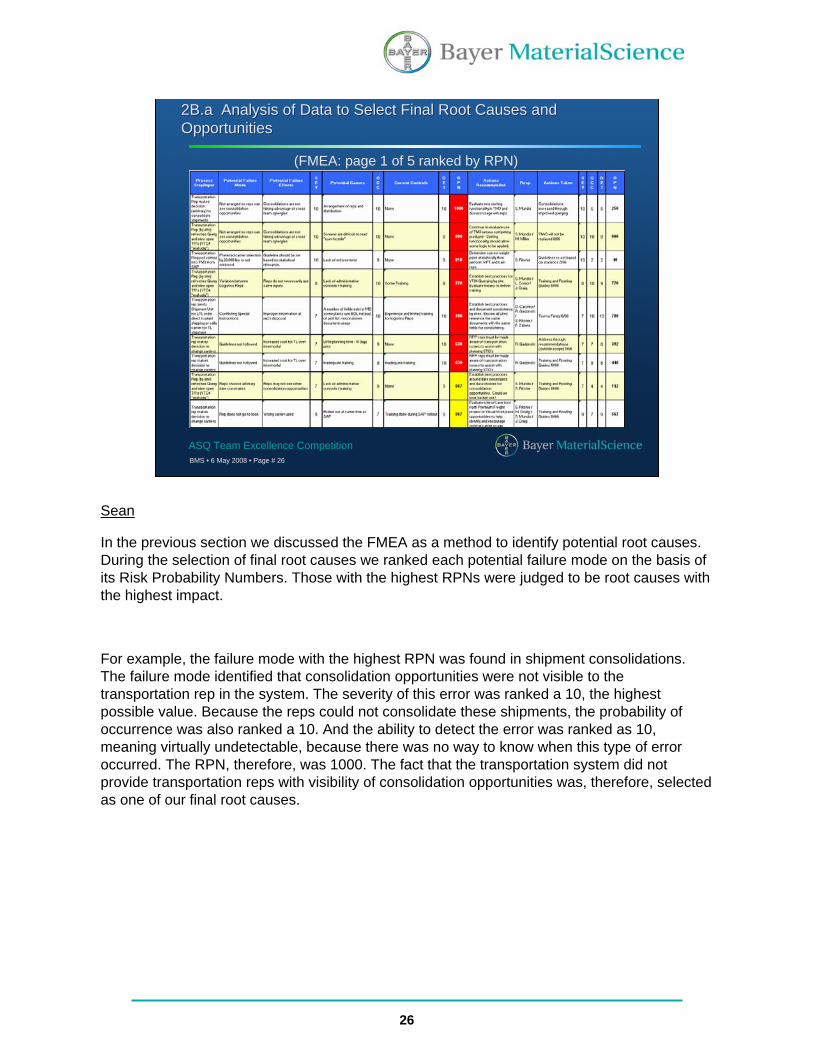
In the previous section we discussed the FMEA as a method to identify potential root causes. During the selection of final root causes we ranked each potential failure mode on the basis of its Risk Probability Numbers. Those with the highest RPNs were judged to be root causes with the highest impact.
For example, the failure mode with the highest RPN was found in shipment consolidations. The failure mode identified that consolidation opportunities were not visible to the transportation rep in the system. The severity of this error was ranked a 10, the highest possible value. Because the reps could not consolidate these shipments, the probability of occurrence was also ranked a 10. And the ability to detect the error was ranked as 10, meaning virtually undetectable, because there was no way to know when this type of error occurred. The RPN, therefore, was 1000. The fact that the transportation system did not provide transportation reps with visibility of consolidation opportunities was, therefore, selected as one of our final root causes.
27
BMS • 6 May 2008 • Page # 27
ASQ Team Excellence Competition
2B.b Analysis of Data to Select Final Root Causes/Improvement Opportunities
2B.b Analysis of Data to Select Final Root Causes/Improvement Opportunities
Using data to eliminate potential confounding factors
Shipping Cost (Y) = f (x1,x2,x3 …)
$/Lb. = f (origin, destination, carrier, customer, product, mode, date…)
• Some Xs are not significant contributing factors.• Some Xs are not significant by themselves but interactions with other Xs
may be.• Changes in Xs over time may bias your perception of root
cause/improvements.• Activities of concurrent improvement efforts may bias your perception• Knowledge of stability or instability in shipping patterns is essential.
DD MM AA II CC
Sean
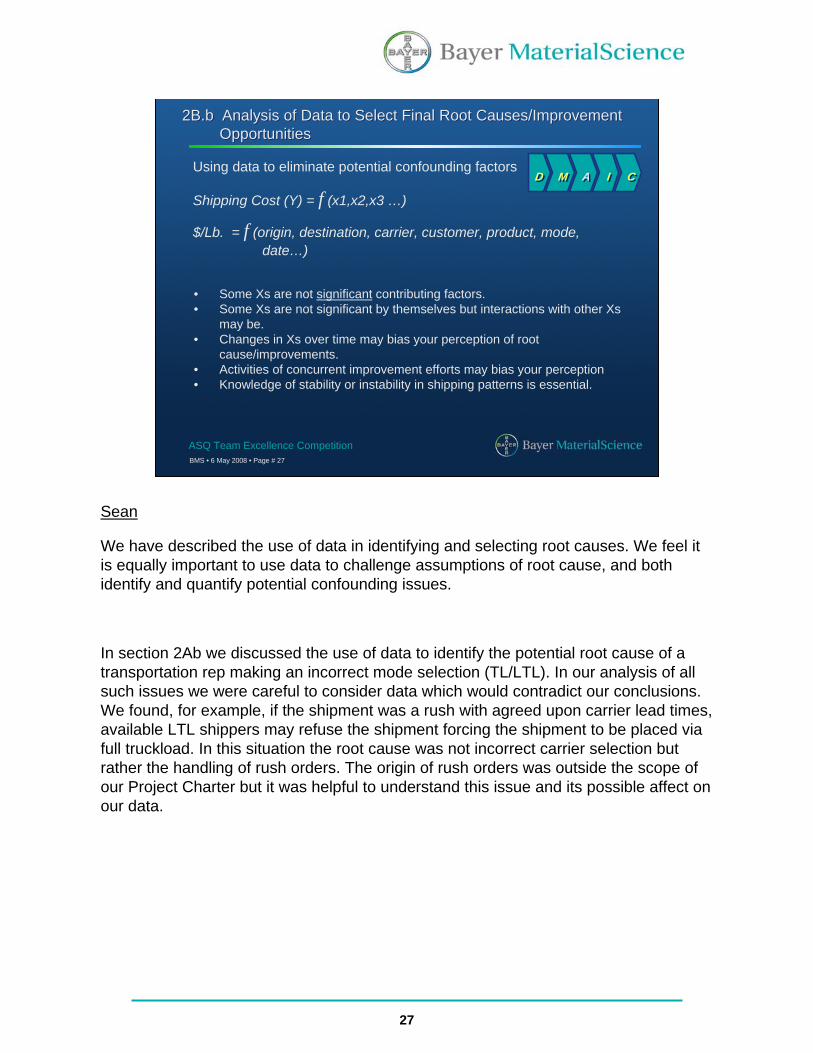
We have described the use of data in identifying and selecting root causes. We feel it is equally important to use data to challenge assumptions of root cause, and both identify and quantify potential confounding issues.
In section 2Ab we discussed the use of data to identify the potential root cause of a transportation rep making an incorrect mode selection (TL/LTL). In our analysis of all such issues we were careful to consider data which would contradict our conclusions. We found, for example, if the shipment was a rush with agreed upon carrier lead times, available LTL shippers may refuse the shipment forcing the shipment to be placed via full truckload. In this situation the root cause was not incorrect carrier selection but rather the handling of rush orders. The origin of rush orders was outside the scope of our Project Charter but it was helpful to understand this issue and its possible affect on our data.
28
BMS • 6 May 2008 • Page # 28
ASQ Team Excellence Competition
TL LTL Process.igx
Revised 5/19/2006
Cus
tom
erRe
gion
al S
ervi
ce C
ente
r
Cust
omer
Ser
vice
Logi
stic
s
Logi
stic
s S
trate
gyLo
gist
ics
Ope
ratio
ns
Pla
nt /
Whs
eC
TL
Order Preparation Phase
Order Preparation Phase
Shipment Preparation Phase
Shipment Preparation Phase
Start 1
Create SAP Delivery
4
Carrier Bid Results
26
Select open TR, review
requirements / notes
6
Transportation Request sent to TM3 from SAP
5
Tender TL Load to
preferred carrier
9
Carrier Accept load?
10
Order Quantity
31
Update PVD Tables
29
Prepare PVD update
spreadsheet
27
Select TL carrier and tender load
25
No
Load Carrier
11
Generate BOL
13
Enter PGI
14
Daily File? to CTL
15
Carrier Freight Bill
24
Network Optimization
Results
2
BMS Carrier rates (TL by lane, LTL general
discount only)
28
Place Order
30Material Type
32Delivery
Date
33Ship to
Location
34Special
Instructions
35
Plant Schedules Pickup with LTL Carrier
41
Receive Shipment
42
Preferred Carrier from
PVD
43
Transport Query YTO4
45
Send Shipment Unit to Plant /
Whse
46
KNMT Customer Material Record
47
Consolidate Shipments TL / LTL
50 Yes
Ship asTL or LTL
51
Override Preferred TL Carrier
53
No
No
Yes
Yes
Missing Data - Transport Rep does not see rates!
59
Ship as TL
60
Ship as LTL
61Override Preferred
LTL Carrier
62
No
Yes
End22
Tender LTL Load to
preferred carrier
63
Carrier Accept load?
64
No
Yes
Select LTL carrier and tender load
65
TL
LTL
Yes
Missing Data - TM3 does not show
consolidations in an easy format
66
How is the choice made to consolidate on TL or LTL . How is master bill of lading generated - load nose or tail? How does
system pull PVD for consolidation
67
2B.b Analysis of Data to Select Final Root Causes/Improvement Opportunities
2B.b Analysis of Data to Select Final Root Causes/Improvement Opportunities
Sean
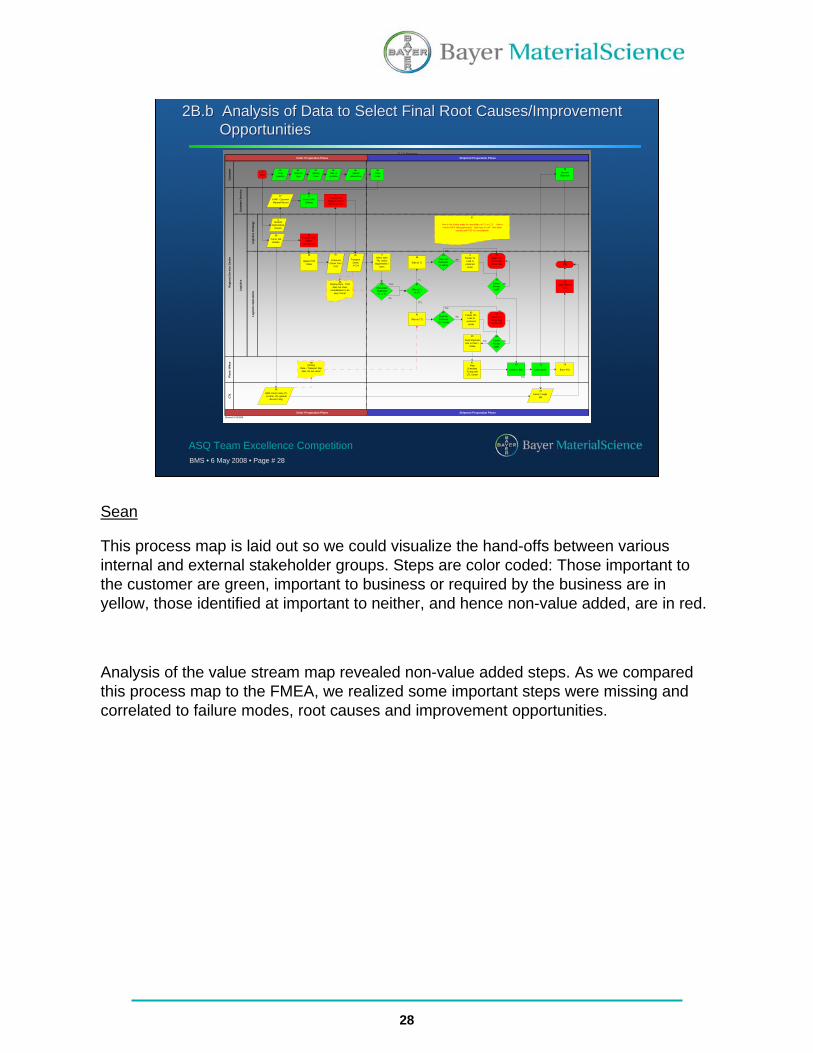
This process map is laid out so we could visualize the hand-offs between various internal and external stakeholder groups. Steps are color coded: Those important to the customer are green, important to business or required by the business are in yellow, those identified at important to neither, and hence non-value added, are in red.
Analysis of the value stream map revealed non-value added steps. As we compared this process map to the FMEA, we realized some important steps were missing and correlated to failure modes, root causes and improvement opportunities.
29
BMS • 6 May 2008 • Page # 29
ASQ Team Excellence Competition
2B.c Identification and Validation of Final Root Cause2B.c Identification and Validation of Final Root Cause
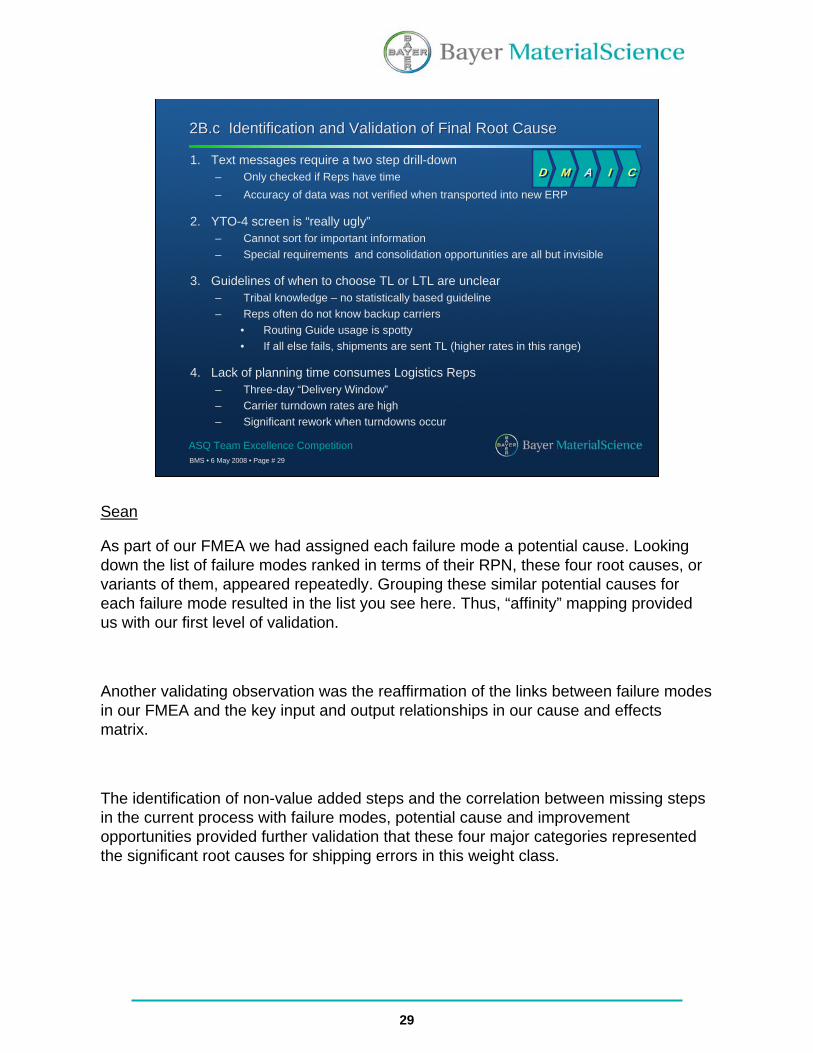
1. Text messages require a two step drill-down– Only checked if Reps have time– Accuracy of data was not verified when transported into new ERP
2. YTO-4 screen is “really ugly”– Cannot sort for important information– Special requirements and consolidation opportunities are all but invisible
3. Guidelines of when to choose TL or LTL are unclear– Tribal knowledge – no statistically based guideline– Reps often do not know backup carriers
• Routing Guide usage is spotty• If all else fails, shipments are sent TL (higher rates in this range)
4. Lack of planning time consumes Logistics Reps– Three-day “Delivery Window”– Carrier turndown rates are high– Significant rework when turndowns occur
DD MM AA II CC
Sean
As part of our FMEA we had assigned each failure mode a potential cause. Looking down the list of failure modes ranked in terms of their RPN, these four root causes, or variants of them, appeared repeatedly. Grouping these similar potential causes for each failure mode resulted in the list you see here. Thus, “affinity” mapping provided us with our first level of validation.
Another validating observation was the reaffirmation of the links between failure modes in our FMEA and the key input and output relationships in our cause and effects matrix.
The identification of non-value added steps and the correlation between missing steps in the current process with failure modes, potential cause and improvement opportunities provided further validation that these four major categories represented the significant root causes for shipping errors in this weight class.
30
BMS • 6 May 2008 • Page # 30
ASQ Team Excellence Competition
Section 3: Solution Development
Marko
Solution Development
31
BMS • 6 May 2008 • Page # 31
ASQ Team Excellence Competition
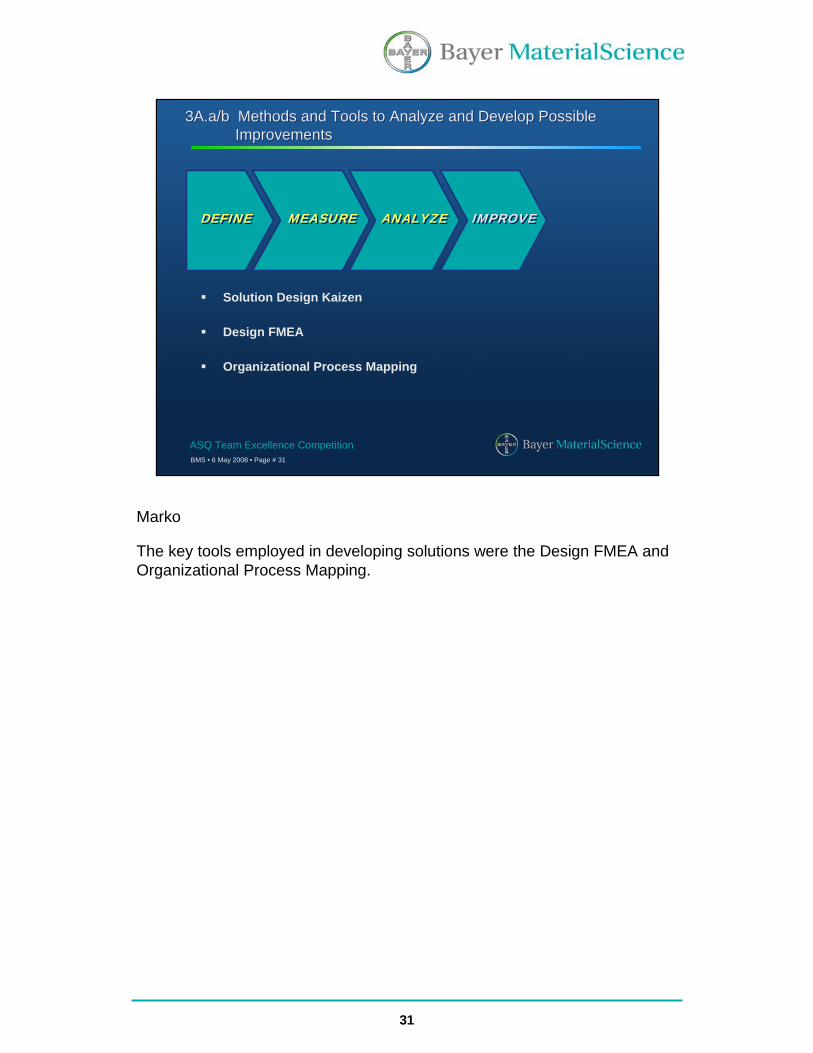
Solution Design Kaizen
Design FMEA
Organizational Process Mapping
DEFINEDEFINE MEASUREMEASURE ANALYZEANALYZE IMPROVEIMPROVE
3A.a/b Methods and Tools to Analyze and Develop Possible Improvements
3A.a/b Methods and Tools to Analyze and Develop Possible Improvements
Marko
The key tools employed in developing solutions were the Design FMEA and Organizational Process Mapping.
32
BMS • 6 May 2008 • Page # 32
ASQ Team Excellence Competition
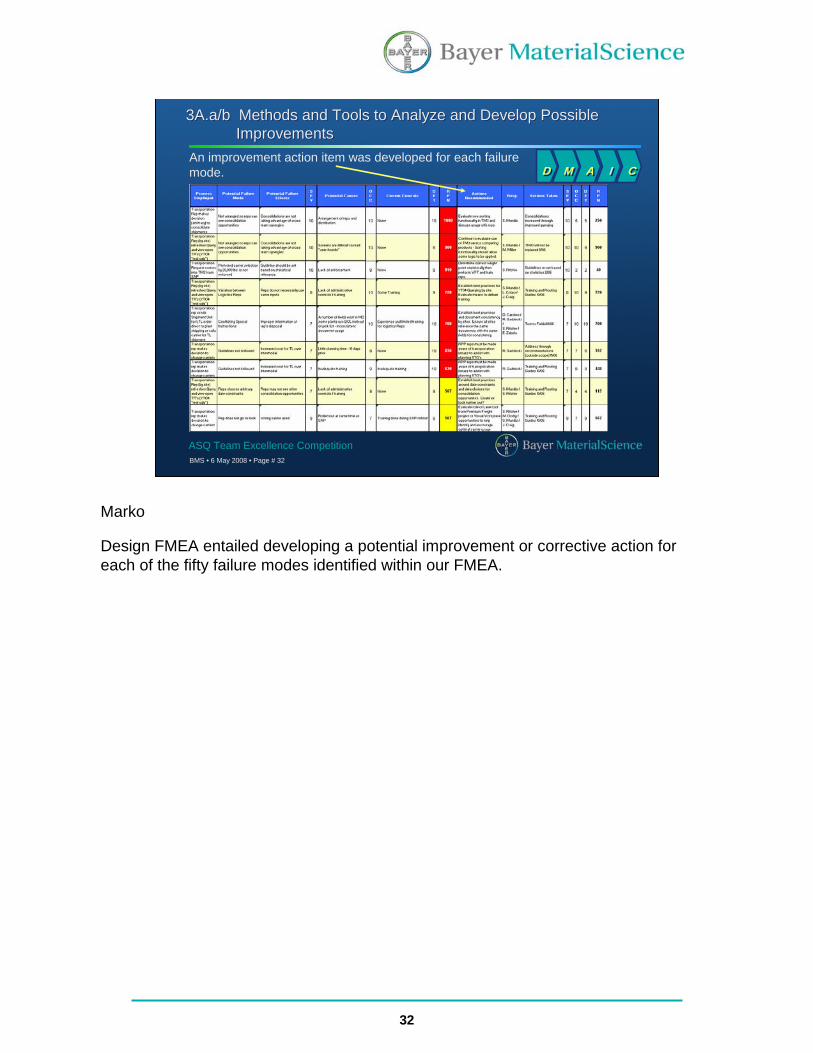
An improvement action item was developed for each failure mode.
3A.a/b Methods and Tools to Analyze and Develop Possible Improvements
3A.a/b Methods and Tools to Analyze and Develop Possible Improvements
DD MM AA II CC
Marko
Design FMEA entailed developing a potential improvement or corrective action for each of the fifty failure modes identified within our FMEA.
33
BMS • 6 May 2008 • Page # 33
ASQ Team Excellence Competition
TL LTL Process revised 101306.igx
Revised 10/24/2006
Cus
tom
erR
egio
nal S
ervi
ce C
ente
r
Cus
tom
er S
ervi
ceLo
gist
ics
Logi
stic
s S
trat
egy
Logi
stic
s O
pera
tions
Pla
nt /
Whs
eC
TL
Order Preparation Phase
Order Preparation Phase
Shipment Preparation Phase
Shipment Preparation Phase
Start 1
Create SAP Delivery
4
Carrier Bid Results
26
Select open TR, review
requirements / notes
6
Transportation Request sent to TM3 from SAP
5
Tender TL Load to
preferred carrier
9
Carrier Accept load?
10
Order Quantity
31
Update PVD Tables
(As needed & Quarterly)
29
Prepare PVD update
spreadsheet
27
Load Carrier
11
Generate BOL
13
Enter PGI
14
Carrier Freight Bill
24
Network Optimization
Results
2
BMS Carrier rates (TL by lane, LTL general
discount only)
28
Place Order
30Material Type
32Delivery
Date
33Ship to Location
34Special
Instructions
35
Plant Schedules
Pickup with LTL Carrier
41
Receive Shipment
42
Preferred Carrier from
PVD
43
Transport Query YTO4
45
Send Shipment Unit to Plant /
Whse
46
KNMT Customer Material Record
47
Consolidate Shipments
50
Ship asTL or LTL
51
Accept Preferred TL Carrier
53
No
No
YesShip as TL
60
Ship as LTL
61Accept
Preferred LTL Carrier
62
No
End22
TL
LTL
Sort for consolidation opportunities
67
Consult routing Guides for
Carrier Selection
68
Prepare Routing Guides
69
Yes
Yes
LTL
TLSelect carrier &
Tender load
71
Decline
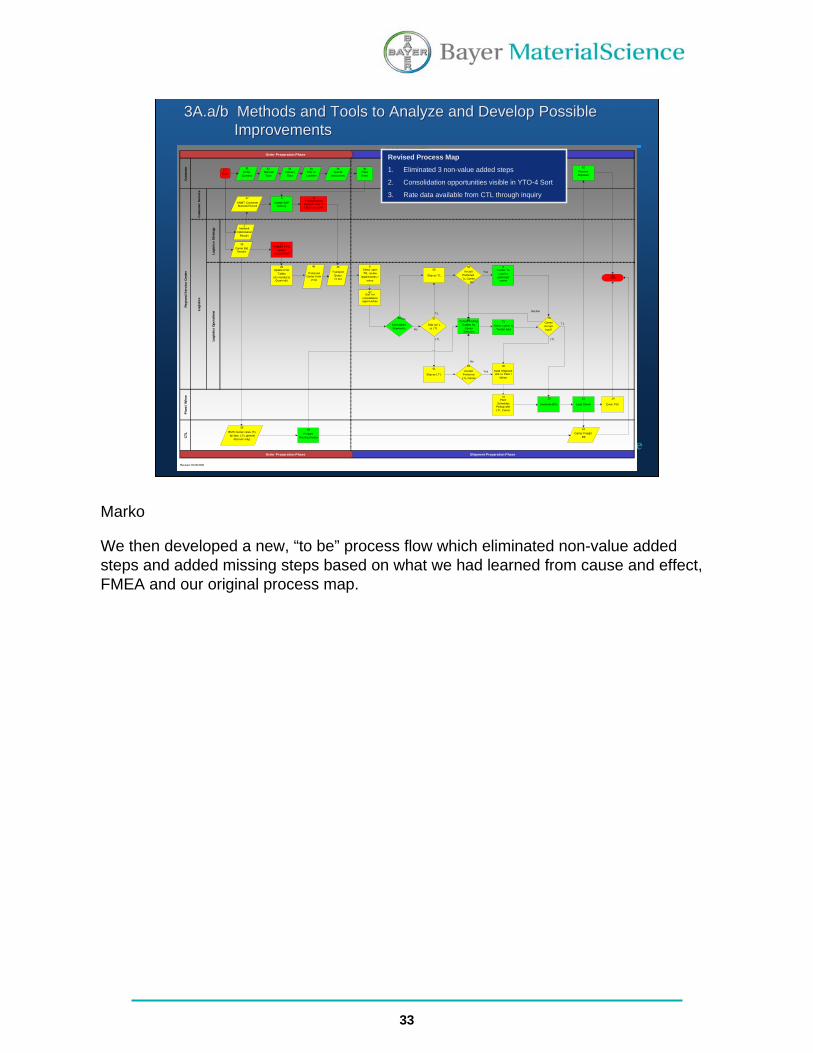
Revised Process Map
1. Eliminated 3 non-value added steps
2. Consolidation opportunities visible in YTO-4 Sort
3. Rate data available from CTL through inquiry
3A.a/b Methods and Tools to Analyze and Develop Possible Improvements
3A.a/b Methods and Tools to Analyze and Develop Possible Improvements
Marko
We then developed a new, “to be” process flow which eliminated non-value added steps and added missing steps based on what we had learned from cause and effect, FMEA and our original process map.
34
BMS • 6 May 2008 • Page # 34
ASQ Team Excellence Competition
0
1
2
3
4
5
6
7
8
9
10
Severity Occurrence Detection RPNAverage
FMEA Results
BeforeAfter
Reduced frequency of occurrence and improved
detection
Reduced frequency of occurrence and improved
detection
3A.c Criteria Used to Select Final Improvement Actions3A.c Criteria Used to Select Final Improvement Actions
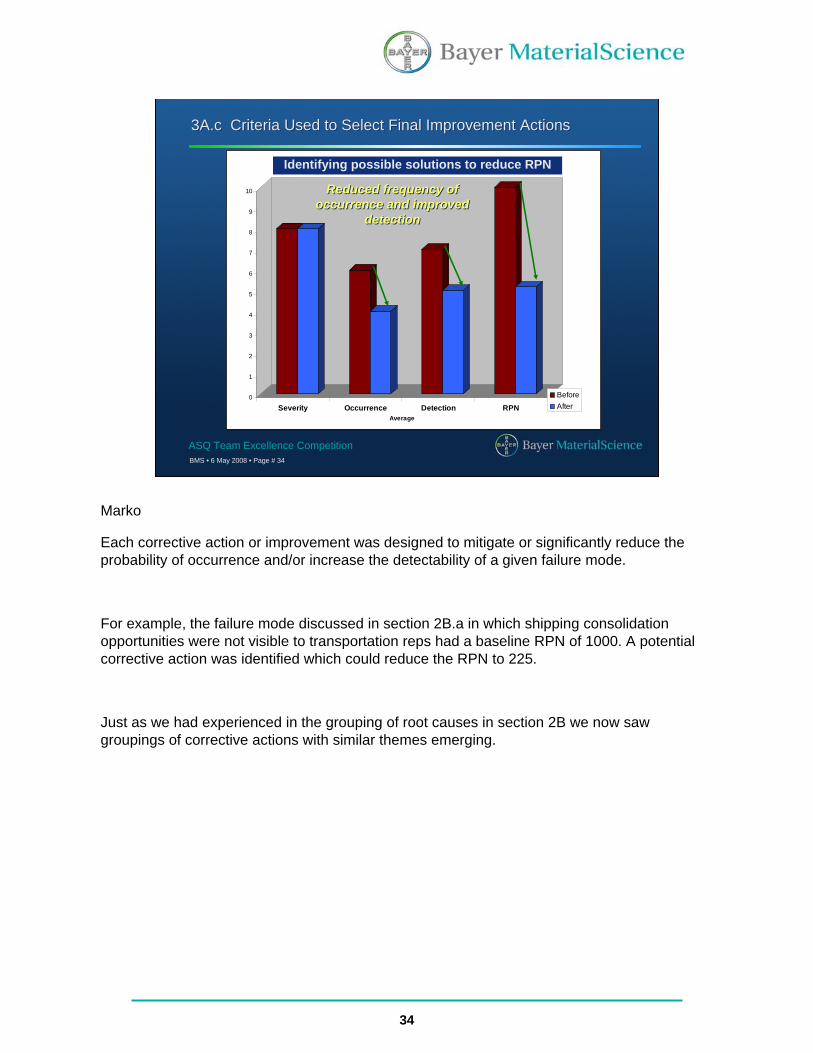
Identifying possible solutions to reduce RPN
Marko
Each corrective action or improvement was designed to mitigate or significantly reduce the probability of occurrence and/or increase the detectability of a given failure mode.
For example, the failure mode discussed in section 2B.a in which shipping consolidation opportunities were not visible to transportation reps had a baseline RPN of 1000. A potential corrective action was identified which could reduce the RPN to 225.
Just as we had experienced in the grouping of root causes in section 2B we now saw groupings of corrective actions with similar themes emerging.
35
BMS • 6 May 2008 • Page # 35
ASQ Team Excellence Competition
Feasibility
RPN
High
Low High
Increase TL/LTL
Breakpoint
Improve YT0-4 Sorting
Update carrier data
Enable Routing Guides
Code carrier selection
“tiers” into system
Move Text Messages toMaster Data
Simplify Transportation Mgt Software
Retrain logistics reps on “contiguous routing”
Quick Hits
Specific Measurable Achievable Responsible Time-Bound
Encourage timely notification on
“rush” shipments
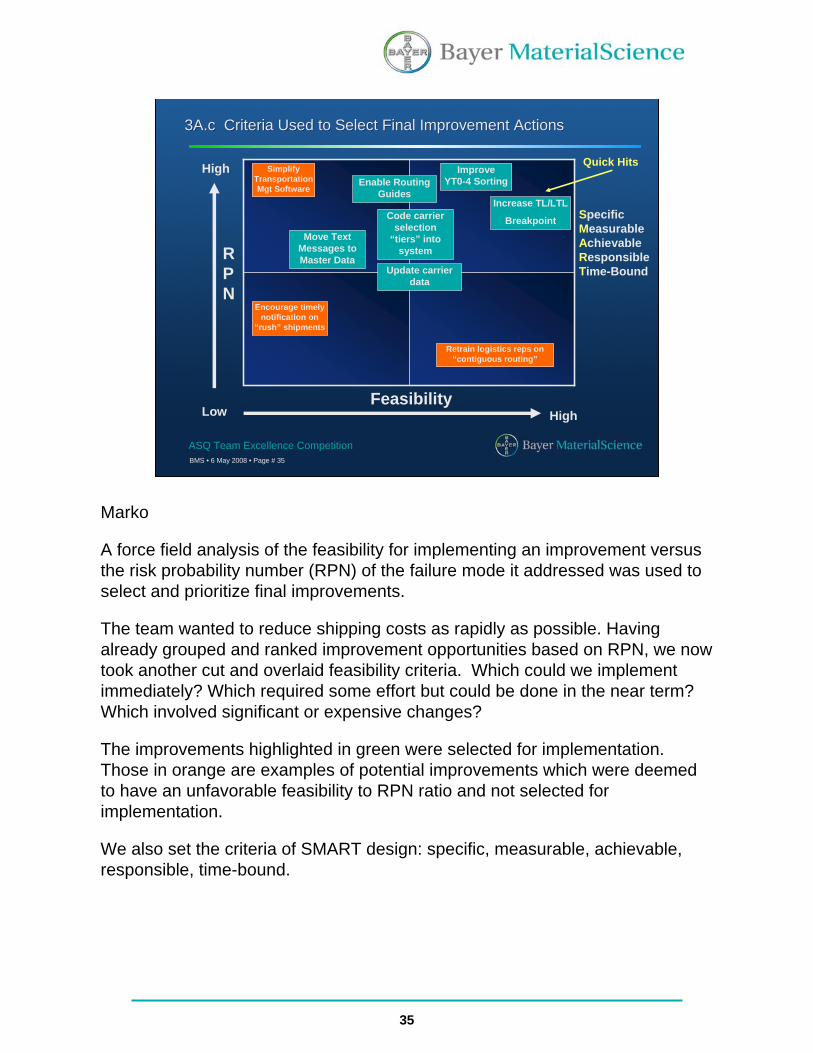
3A.c Criteria Used to Select Final Improvement Actions3A.c Criteria Used to Select Final Improvement Actions
Marko
A force field analysis of the feasibility for implementing an improvement versus the risk probability number (RPN) of the failure mode it addressed was used to select and prioritize final improvements.
The team wanted to reduce shipping costs as rapidly as possible. Having already grouped and ranked improvement opportunities based on RPN, we now took another cut and overlaid feasibility criteria. Which could we implement immediately? Which required some effort but could be done in the near term? Which involved significant or expensive changes?
The improvements highlighted in green were selected for implementation. Those in orange are examples of potential improvements which were deemed to have an unfavorable feasibility to RPN ratio and not selected for implementation.
We also set the criteria of SMART design: specific, measurable, achievable, responsible, time-bound.
36
BMS • 6 May 2008 • Page # 36
ASQ Team Excellence Competition
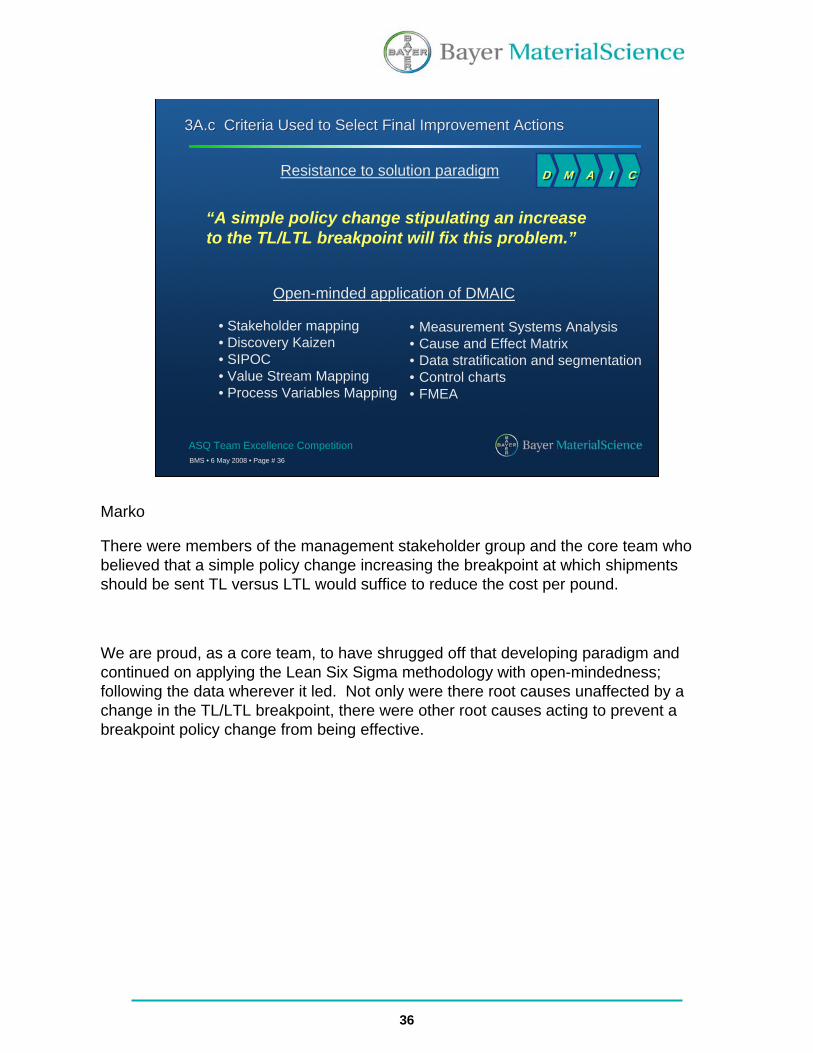
Resistance to solution paradigm
“A simple policy change stipulating an increase to the TL/LTL breakpoint will fix this problem.”
• Stakeholder mapping• Discovery Kaizen• SIPOC• Value Stream Mapping • Process Variables Mapping
• Measurement Systems Analysis• Cause and Effect Matrix• Data stratification and segmentation• Control charts• FMEA
Open-minded application of DMAIC
3A.c Criteria Used to Select Final Improvement Actions3A.c Criteria Used to Select Final Improvement Actions
DD MM AA II CC
Marko
There were members of the management stakeholder group and the core team who believed that a simple policy change increasing the breakpoint at which shipments should be sent TL versus LTL would suffice to reduce the cost per pound.
We are proud, as a core team, to have shrugged off that developing paradigm and continued on applying the Lean Six Sigma methodology with open-mindedness; following the data wherever it led. Not only were there root causes unaffected by a change in the TL/LTL breakpoint, there were other root causes acting to prevent a breakpoint policy change from being effective.
37
BMS • 6 May 2008 • Page # 37
ASQ Team Excellence Competition
3B.b Analysis of Data to Select Final Improvements3B.b Analysis of Data to Select Final Improvements
TL LTL Process revised 101306.igx
Revised 10/24/2006
Cus
tom
erRe
gion
al S
ervi
ce C
ente
r
Cus
tom
er S
ervi
ceLo
gist
ics
Logi
stic
s St
rate
gyLo
gist
ics
Oper
atio
ns
Pla
nt /
Whs
eCT
L
Order Preparation Phase
Order Preparation Phase
Shipment Preparation Phase
Shipment Preparation Phase
Start 1
Create SAP Delivery
4
Carrier Bid Results
26
Select open TR, review
requirements / notes
6
Transportat ion Request sent to TM3 f rom SAP
5
Tender TL Load to
preferred carrier
9
Carrier Accept load?
10
Order Quant ity
31
Update PVD Tables
(As needed & Quarterly)
29
Prepare PVD update
spreadsheet
27
Load Carrier
11
Generate BOL
13
Enter PGI
14
Carrier Freight Bill
24
Network Optimization
Results
2
BMS Carrier rates (TL by lane, LTL general
discount only)
28
Place Order
30Material Type
32Delivery
Date
33Ship to Locat ion
34Special
Instructions
35
Plant Schedules
Pickup with LTL Carrier
41
Receive Shipment
42
Preferred Carrier from
PVD
43
Transport Query YTO4
45
Send Shipment Unit to Plant /
Whse
46
KNMT Customer Material Record
47
Consolidate Shipments
50
Ship asTL or LTL
51
Accept Preferred TL Carrier
53
No
No
YesShip as TL
60
Ship as LTL
61Accept
Preferred LTL Carrier
62
No
End22
TL
LTL
Sort for consolidation opportunities
67
Consult rout ing Guides for
Carrier Select ion
68
Prepare Routing Guides
69
Yes
Yes
LTL
TLSelect carrier &
Tender load
71
Decline
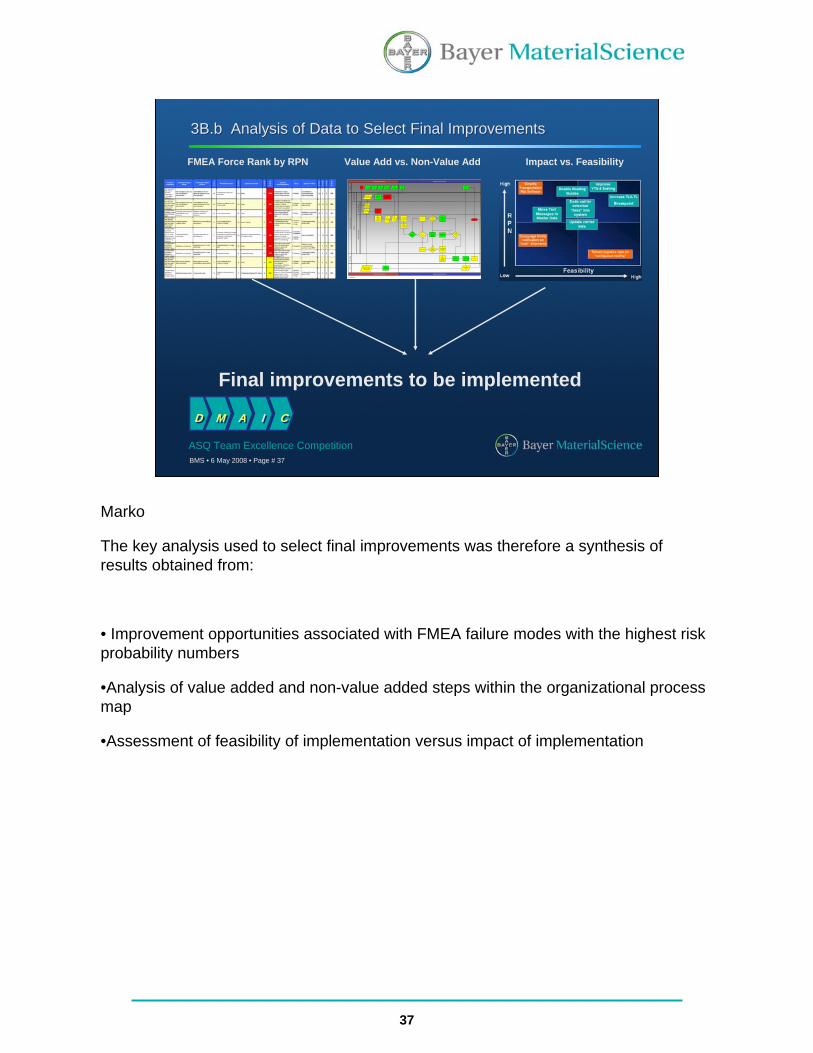
FMEA Force Rank by RPN Value Add vs. Non-Value Add Impact vs. Feasibility
Final improvements to be implemented
DD MM AA II CC
Marko
The key analysis used to select final improvements was therefore a synthesis of results obtained from:
• Improvement opportunities associated with FMEA failure modes with the highest risk probability numbers
•Analysis of value added and non-value added steps within the organizational process map
•Assessment of feasibility of implementation versus impact of implementation
38
BMS • 6 May 2008 • Page # 38
ASQ Team Excellence Competition
3B.c Stakeholder Involvement in Selection of Final Improvements3B.c Stakeholder Involvement in Selection of Final Improvements
InformedInformedInformedInformedInformedCustomer Service
InformedConsultedConsultedConsultedConsultedBayer
Technology Service
AccountableInformedConsultedInformedConsultedFinance
InformedAccountableConsultedAccountableConsultedMaterial Master Data
ConsultedConsultedAccountableConsultedAccountableLogistics
AccountableAccountableResponsibleAccountableResponsibleTransportation Operations
InformedInformedConsultedInformedConsultedBusiness Intelligence
AccountableAccountableConsultedAccountableConsultedCustomer Master Data
ResponsibleResponsibleAccountableResponsibleAccountableBusiness Excellence
Improvement Implementation
Final Improvement
Potential ImprovementFinal CausePotential CauseStakeholder
Group
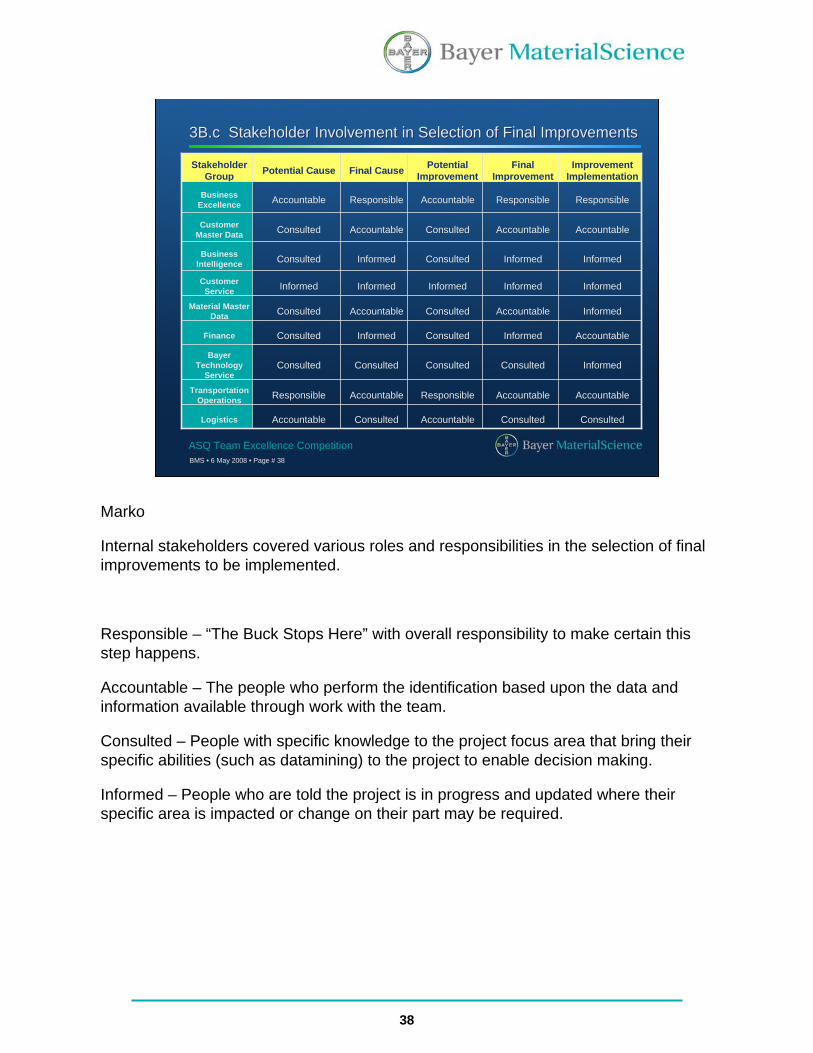
Marko
Internal stakeholders covered various roles and responsibilities in the selection of final improvements to be implemented.
Responsible – “The Buck Stops Here” with overall responsibility to make certain this step happens.
Accountable – The people who perform the identification based upon the data and information available through work with the team.
Consulted – People with specific knowledge to the project focus area that bring their specific abilities (such as datamining) to the project to enable decision making.
Informed – People who are told the project is in progress and updated where their specific area is impacted or change on their part may be required.
39
BMS • 6 May 2008 • Page # 39
ASQ Team Excellence Competition
3C.a Final Improvement Actions and Validation3C.a Final Improvement Actions and Validation
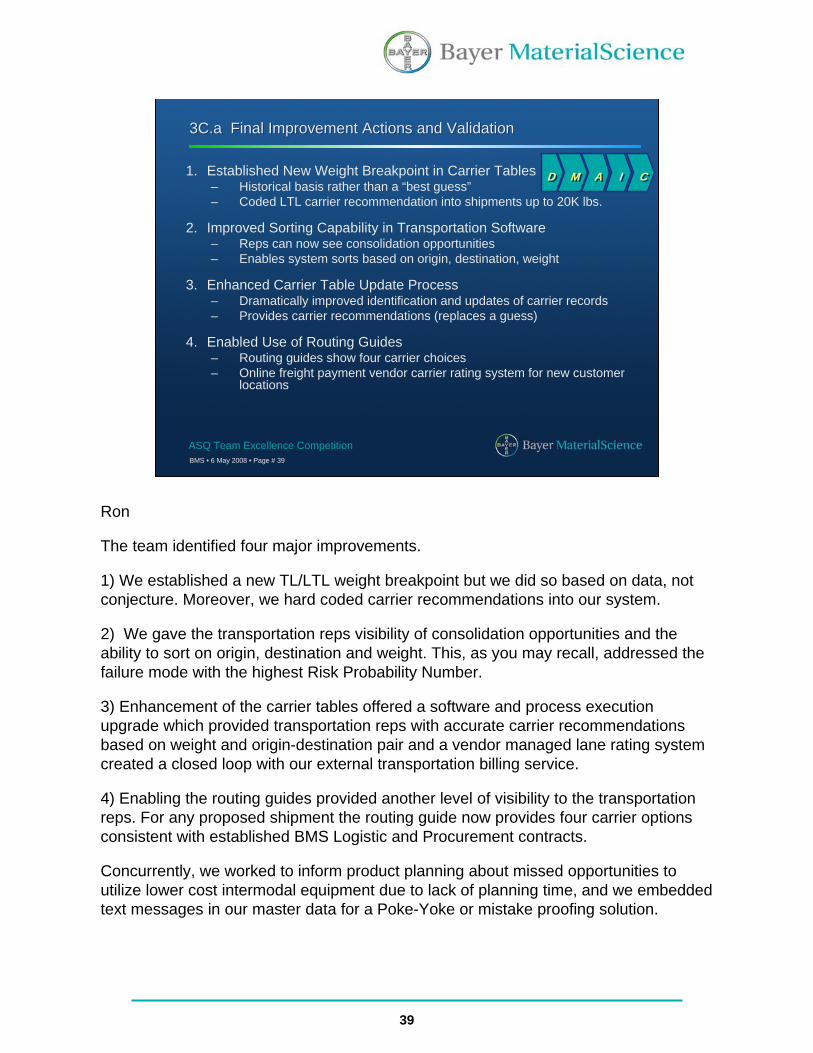
1. Established New Weight Breakpoint in Carrier Tables– Historical basis rather than a “best guess”– Coded LTL carrier recommendation into shipments up to 20K lbs.
2. Improved Sorting Capability in Transportation Software– Reps can now see consolidation opportunities– Enables system sorts based on origin, destination, weight
3. Enhanced Carrier Table Update Process– Dramatically improved identification and updates of carrier records– Provides carrier recommendations (replaces a guess)
4. Enabled Use of Routing Guides– Routing guides show four carrier choices– Online freight payment vendor carrier rating system for new customer
locations
DD MM AA II CC
Ron
The team identified four major improvements.
1) We established a new TL/LTL weight breakpoint but we did so based on data, not conjecture. Moreover, we hard coded carrier recommendations into our system.
2) We gave the transportation reps visibility of consolidation opportunities and the ability to sort on origin, destination and weight. This, as you may recall, addressed the failure mode with the highest Risk Probability Number.
3) Enhancement of the carrier tables offered a software and process execution upgrade which provided transportation reps with accurate carrier recommendations based on weight and origin-destination pair and a vendor managed lane rating system created a closed loop with our external transportation billing service.
4) Enabling the routing guides provided another level of visibility to the transportation reps. For any proposed shipment the routing guide now provides four carrier options consistent with established BMS Logistic and Procurement contracts.
Concurrently, we worked to inform product planning about missed opportunities to utilize lower cost intermodal equipment due to lack of planning time, and we embedded text messages in our master data for a Poke-Yoke or mistake proofing solution.
40
BMS • 6 May 2008 • Page # 40
ASQ Team Excellence Competition
3C.b Tangible Benefits3C.b Tangible Benefits
Project Projected Cost Savings: $590,000
2006 Savings: $505,000
2007 Savings: $804,000
$41,889
$98,284
$76,397
$52,226 $49,670$56,236
$83,376
$74,498
$55,526
$62,489
$58,725
$94,508
$-
$20,000
$40,000
$60,000
$80,000
$100,000
$120,000
J-07 F-07 M-07 A-07 M-07 J-07 J-07 A-07 S-07 O-07 N-07 D-070.000
0.010
0.020
0.030
0.040
0.050
0.060
Savings Current Cost / Lb Baseline Cost / Lb
New/Old Cost/LbDollar Savings
DD MM AA II CC
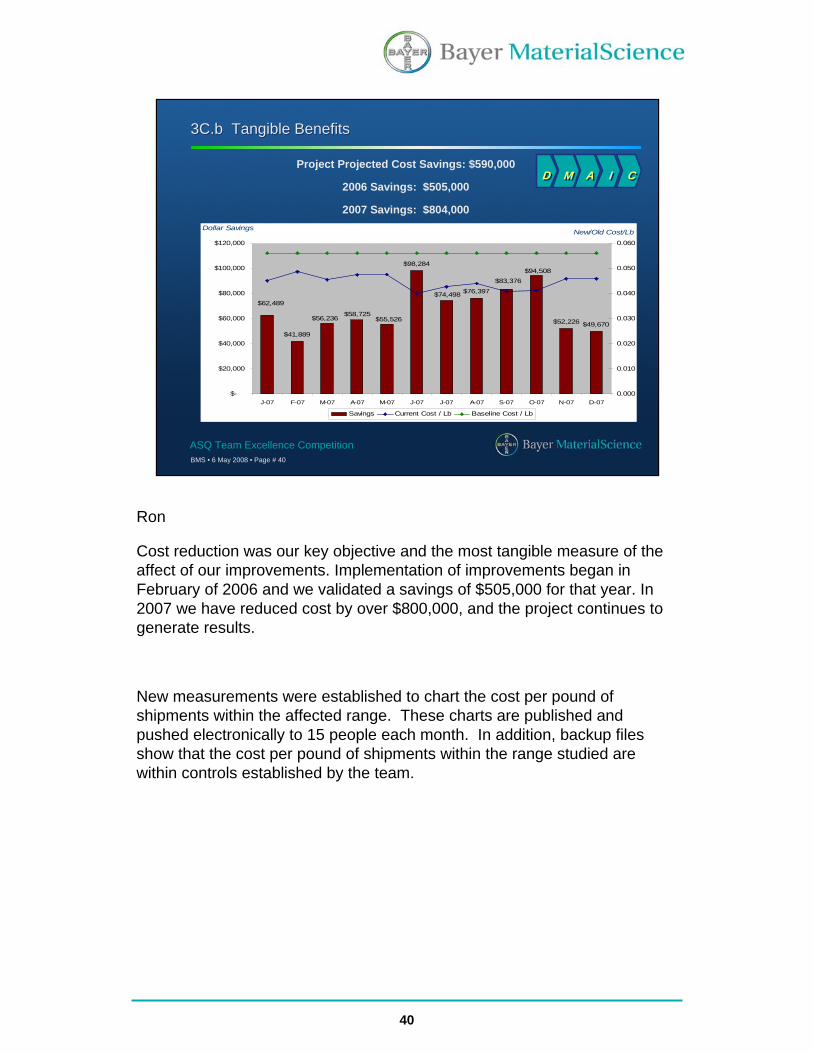
Ron
Cost reduction was our key objective and the most tangible measure of the affect of our improvements. Implementation of improvements began in February of 2006 and we validated a savings of $505,000 for that year. In 2007 we have reduced cost by over $800,000, and the project continues to generate results.
New measurements were established to chart the cost per pound ofshipments within the affected range. These charts are published and pushed electronically to 15 people each month. In addition, backup files show that the cost per pound of shipments within the range studied are within controls established by the team.
41
BMS • 6 May 2008 • Page # 41
ASQ Team Excellence Competition
3C.b Tangible Benefits3C.b Tangible Benefits
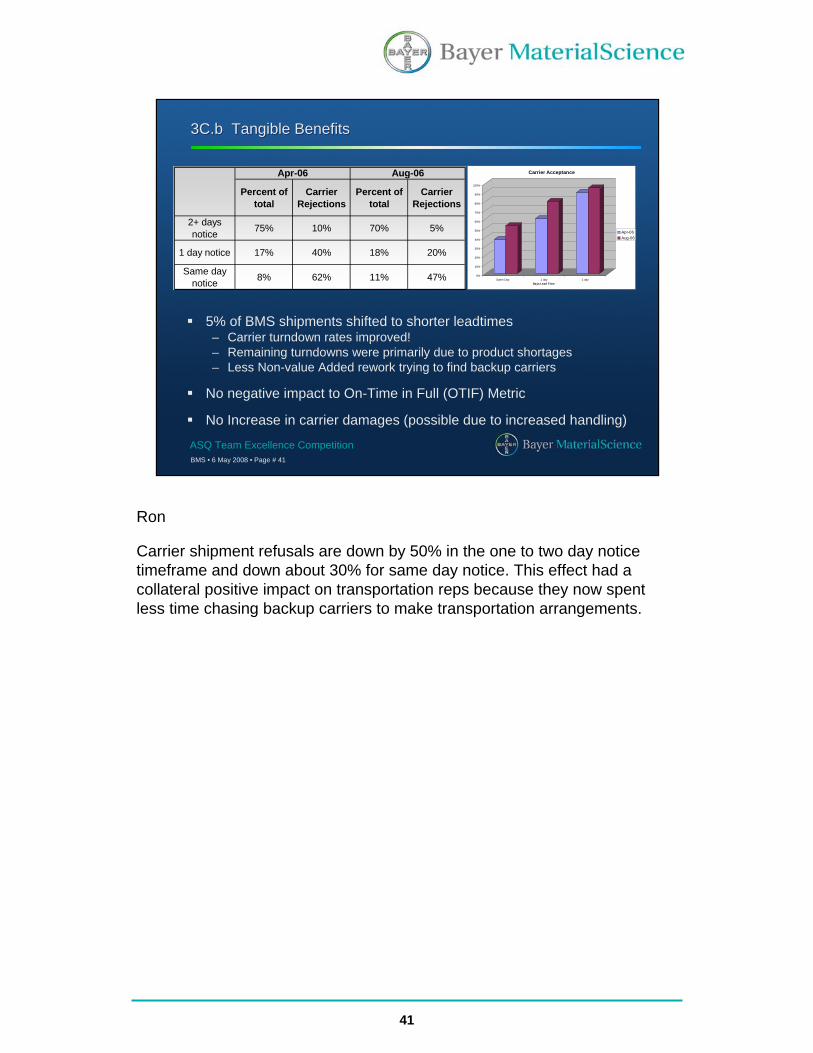
5% of BMS shipments shifted to shorter leadtimes– Carrier turndown rates improved! – Remaining turndowns were primarily due to product shortages– Less Non-value Added rework trying to find backup carriers
No negative impact to On-Time in Full (OTIF) Metric
No Increase in carrier damages (possible due to increased handling)
Percent of total
Carrier Rejections
Percent of total
Carrier Rejections
2+ days notice 75% 10% 70% 5%
1 day notice 17% 40% 18% 20%
Same day notice 8% 62% 11% 47%
Apr-06 Aug-06
0%
10%
20%
30%
40%
50%
60%
70%
80%
90%
100%
Same Day 1 day 2 dayDays Lead Time
Carrier Acceptance
Apr-06Aug-06
Ron
Carrier shipment refusals are down by 50% in the one to two day notice timeframe and down about 30% for same day notice. This effect had a collateral positive impact on transportation reps because they now spent less time chasing backup carriers to make transportation arrangements.
42
BMS • 6 May 2008 • Page # 42
ASQ Team Excellence Competition
3C.b Intangible Benefits3C.b Intangible Benefits
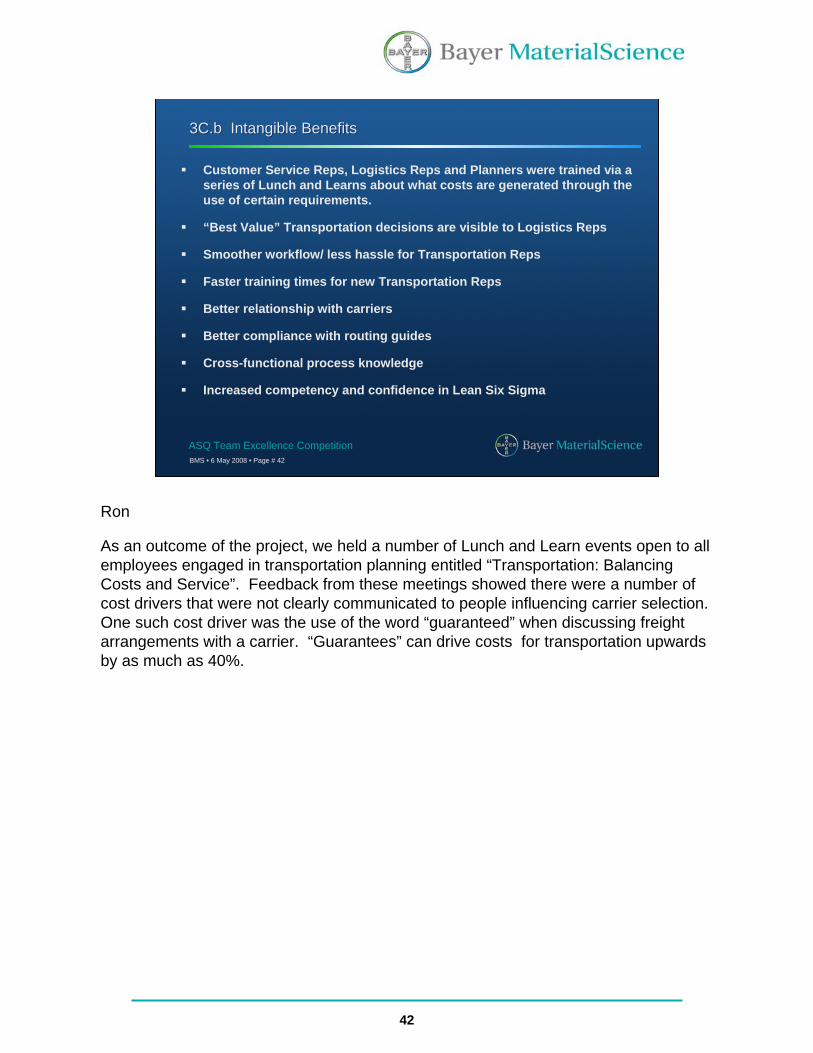
Customer Service Reps, Logistics Reps and Planners were trained via a series of Lunch and Learns about what costs are generated through the use of certain requirements.
“Best Value” Transportation decisions are visible to Logistics Reps
Smoother workflow/ less hassle for Transportation Reps
Faster training times for new Transportation Reps
Better relationship with carriers
Better compliance with routing guides
Cross-functional process knowledge
Increased competency and confidence in Lean Six Sigma
Ron
As an outcome of the project, we held a number of Lunch and Learn events open to all employees engaged in transportation planning entitled “Transportation: Balancing Costs and Service”. Feedback from these meetings showed there were a number of cost drivers that were not clearly communicated to people influencing carrier selection. One such cost driver was the use of the word “guaranteed” when discussing freight arrangements with a carrier. “Guarantees” can drive costs for transportation upwards by as much as 40%.
43
BMS • 6 May 2008 • Page # 43
ASQ Team Excellence Competition
3C.c Final Improvement Validation3C.c Final Improvement Validation
Month
Sam
ple
Mea
n
AugJulJunMayAprMarFebJanDecNovOctSepAugJul
0.060
0.055
0.050
0.045
__X=0.04821
UCL=0.05255
LCL=0.04388
1 2 3 4
Month
Sam
ple
StD
ev
AugJulJunMayAprMarFebJanDecNovOctSepAugJul
0.040
0.035
0.030
_S=0.03200
UCL=0.03507
LCL=0.02894
1 2 3 4
1
Xbar-S Chart of Cost / Lbs by PeriodBaseline and Improvement Stages July 2005 through Aug 2006
X-Bar S charts - $/Lb. segmented by improvement implementation phases DD MM AA II CC
Marko
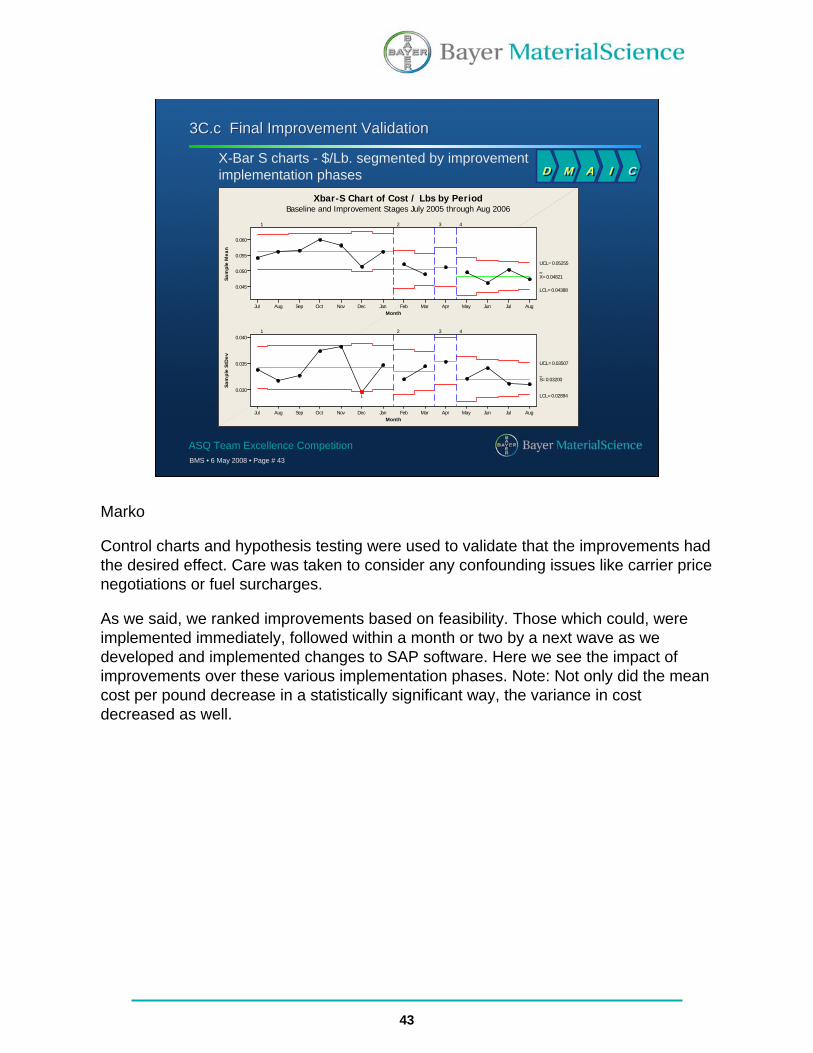
Control charts and hypothesis testing were used to validate that the improvements had the desired effect. Care was taken to consider any confounding issues like carrier price negotiations or fuel surcharges.
As we said, we ranked improvements based on feasibility. Those which could, were implemented immediately, followed within a month or two by a next wave as we developed and implemented changes to SAP software. Here we see the impact of improvements over these various implementation phases. Note: Not only did the mean cost per pound decrease in a statistically significant way, the variance in cost decreased as well.
44
BMS • 6 May 2008 • Page # 44
ASQ Team Excellence Competition
3C.c Final Improvement Validation3C.c Final Improvement Validation
AugJulJunMayAprMarFebJanDecNovOctSepAugJul
0.7
0.6
0.5
0.4
0.3
0.2
Month
Perc
ent
Ship
ped
TL I
nste
ad o
f LT
L
_P=0.4368
UCL=0.5596
LCL=0.3141
1
1
1
P Chart of Shipments in 16 -20 K Weight Range Defect Defined As a TL Shipment as Opposed to an LTL Shipment
1 Sigma
2 Sigma
Note: Sigma Levels Assume a Goal of Zero TL in This Weight Range
DD MM AA II CC
Marko
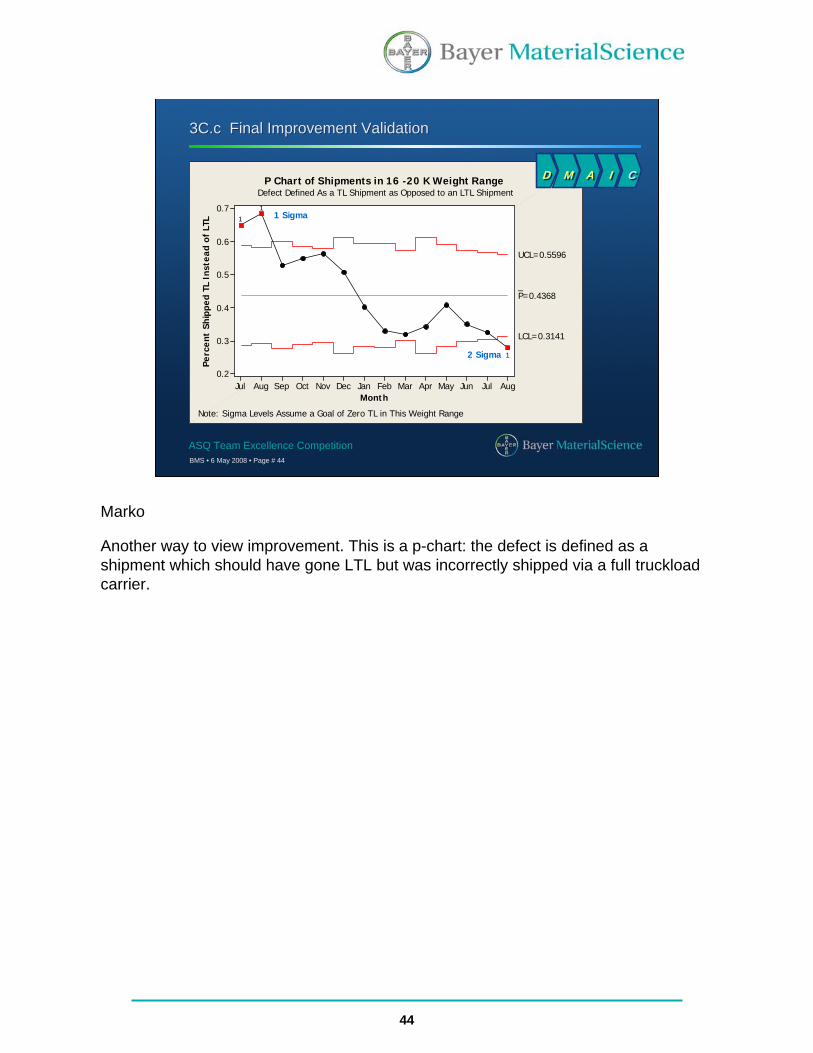
Another way to view improvement. This is a p-chart: the defect is defined as a shipment which should have gone LTL but was incorrectly shipped via a full truckload carrier.
45
BMS • 6 May 2008 • Page # 45
ASQ Team Excellence Competition
Hypothesis Testing 2-Sample T-Test ResultsHypothesis Testing 2-Sample T-Test Results
Two-Sample T-Test and CI: Cost / Lb, Period Period N Mean StDev SE Mean
1 2111 0.0562 0.0342 0.00075
4 1495 0.0482 0.0320 0.00083
Difference = mu (1) - mu (4)
Estimate for difference: 0.008026
95% CI for difference: (0.005841, 0.010211)
T-Test of difference = 0 (vs not =): T-Value = 7.20 P-Value = 0.000 DF = 3341
Minimum difference is $0.006/lb. Mean is $0.008/lb.
Over 74,000,000 lbs in this weight range annually
Annual Cost savings at $0.008/lb. = $590,000
3C.c Final Improvement Validation3C.c Final Improvement Validation
DD MM AA II CC
Marko
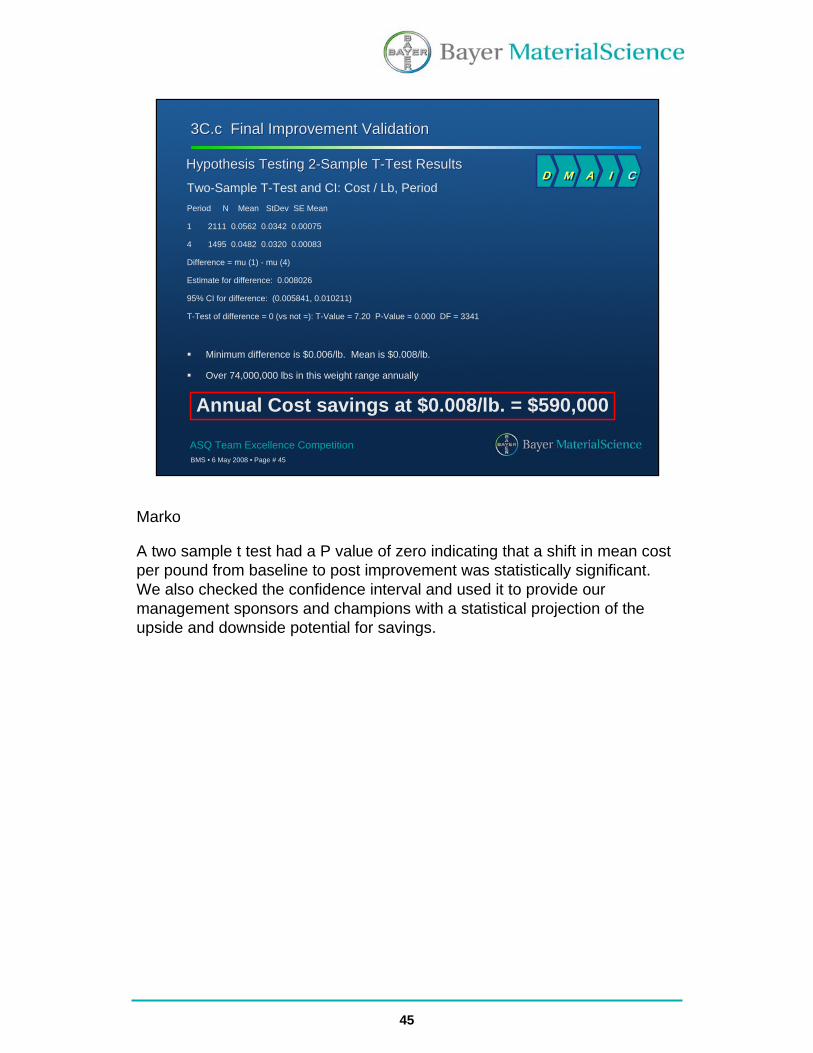
A two sample t test had a P value of zero indicating that a shift in mean cost per pound from baseline to post improvement was statistically significant. We also checked the confidence interval and used it to provide our management sponsors and champions with a statistical projection of the upside and downside potential for savings.
46
BMS • 6 May 2008 • Page # 46
ASQ Team Excellence Competition
Section 4: Improvement ImplementationSection 4: Improvement Implementation
Kristen
47
BMS • 6 May 2008 • Page # 47
ASQ Team Excellence Competition
4A.a Involvement of internal and external stakeholders in implementation
4A.a Involvement of internal and external stakeholders in implementation
InformedInformedCustomer Service
InformedConsultedBayer
Technology Service
AccountableInformedFinance
InformedAccountableMaterial Master Data
ConsultedConsultedLogistics
AccountableAccountableTransport Ops
InformedInformedBusiness Intelligence
AccountableAccountableCustomer Master Data
ResponsibleResponsibleBusiness Excellence
Improvement Implementation
Final Improvement
Stakeholder Group
Consolidated Action Plan
DD MM AA II CC
Kristen
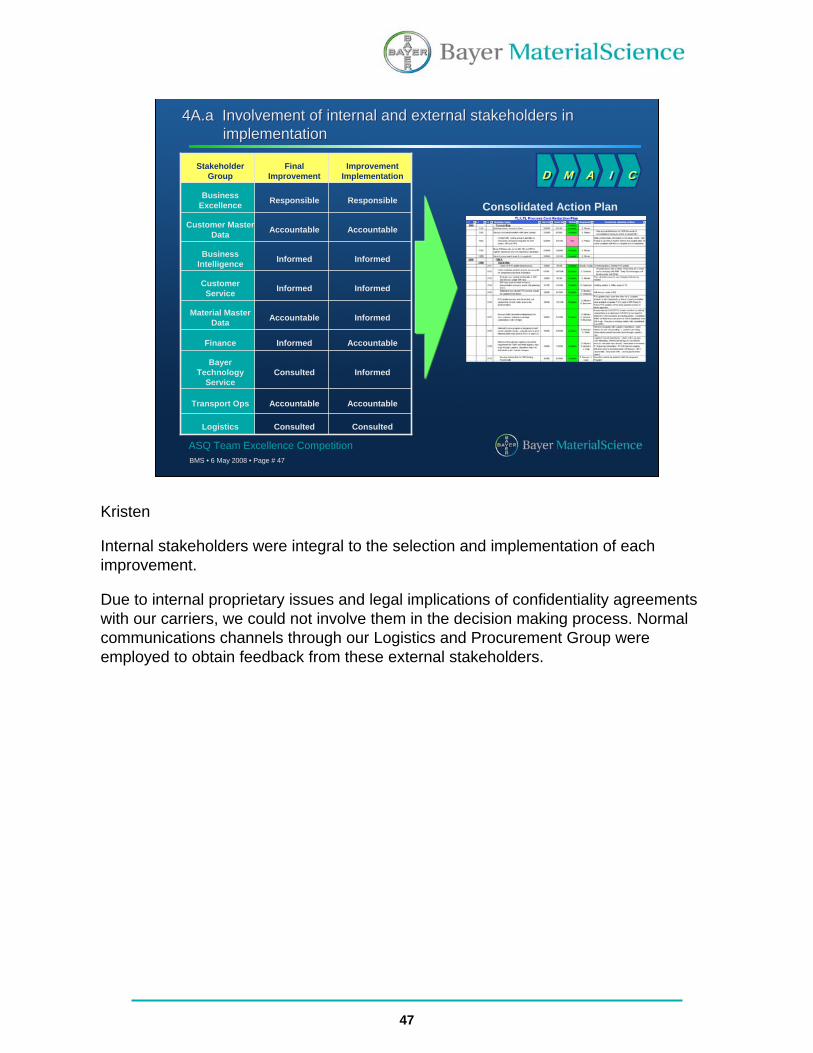
Internal stakeholders were integral to the selection and implementation of each improvement.
Due to internal proprietary issues and legal implications of confidentiality agreements with our carriers, we could not involve them in the decision making process. Normal communications channels through our Logistics and Procurement Group were employed to obtain feedback from these external stakeholders.
48
BMS • 6 May 2008 • Page # 48
ASQ Team Excellence Competition
4A.b How resistance to change was identified and addressed4A.b How resistance to change was identified and addressed
4. Have core team members actively communicate and solicit feedback from the groups they represent.
New roleNeed to analyze results and impact of changeFinance
3. Include core team members in identification of root cause and corrective action plan development
Time required vs. benefit
Need to transfer material data to fieldsMaterial Master Data
5. Proactive communication of core team decisions.
Decline in service to customer
Communications with Transport opsCustomer Service
7. Demonstrate consistent or improved resultsDamages / carrier rejectionsConsiderations for bidsLogistics Strategy
6. Proactive meetings such as Lunch and Learn to communicate impending changes.
Training on new procedures
Procedures and Methods for carrier decisionsTransport Ops
2. Obtain respected members of each key stakeholder group to serve on the core team.New roleNeed to track resultsBusiness
Intelligence
1. Identify the key stakeholder groupsTime required vs. benefitNeed to map text messagesCustomer Master
Data
Strategy to Identify and Defuse Resistance
Potential ResistanceChange RequiredStakeholder
Group
Kristen
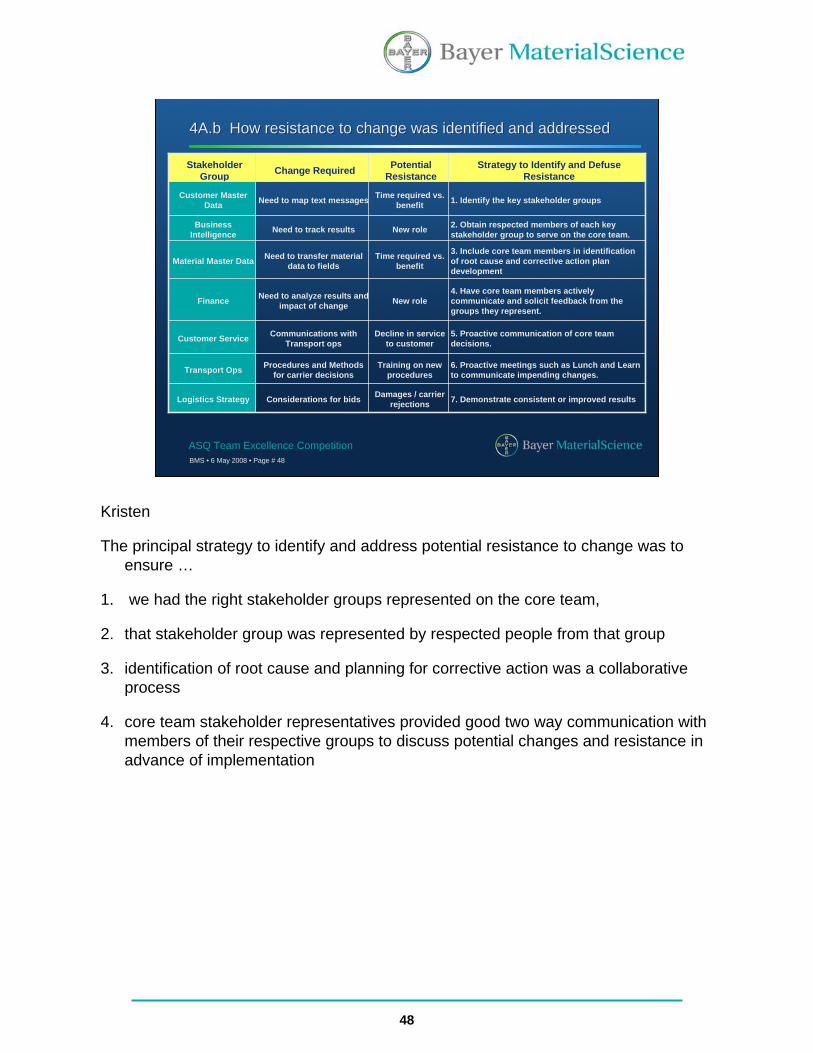
The principal strategy to identify and address potential resistance to change was to ensure …
1. we had the right stakeholder groups represented on the core team,
2. that stakeholder group was represented by respected people from that group
3. identification of root cause and planning for corrective action was a collaborative process
4. core team stakeholder representatives provided good two way communication with members of their respective groups to discuss potential changes and resistance in advance of implementation
49
BMS • 6 May 2008 • Page # 49
ASQ Team Excellence Competition
4A.c How stakeholder buy-in was assured4A.c How stakeholder buy-in was assured
Consensus of core team
Two-way communication of core team members with functional colleagues
Implementation involvement of core team
On-going, formal updates to sponsor group
Project completion signoff by key stakeholders
DD MM AA II CC
Kristen
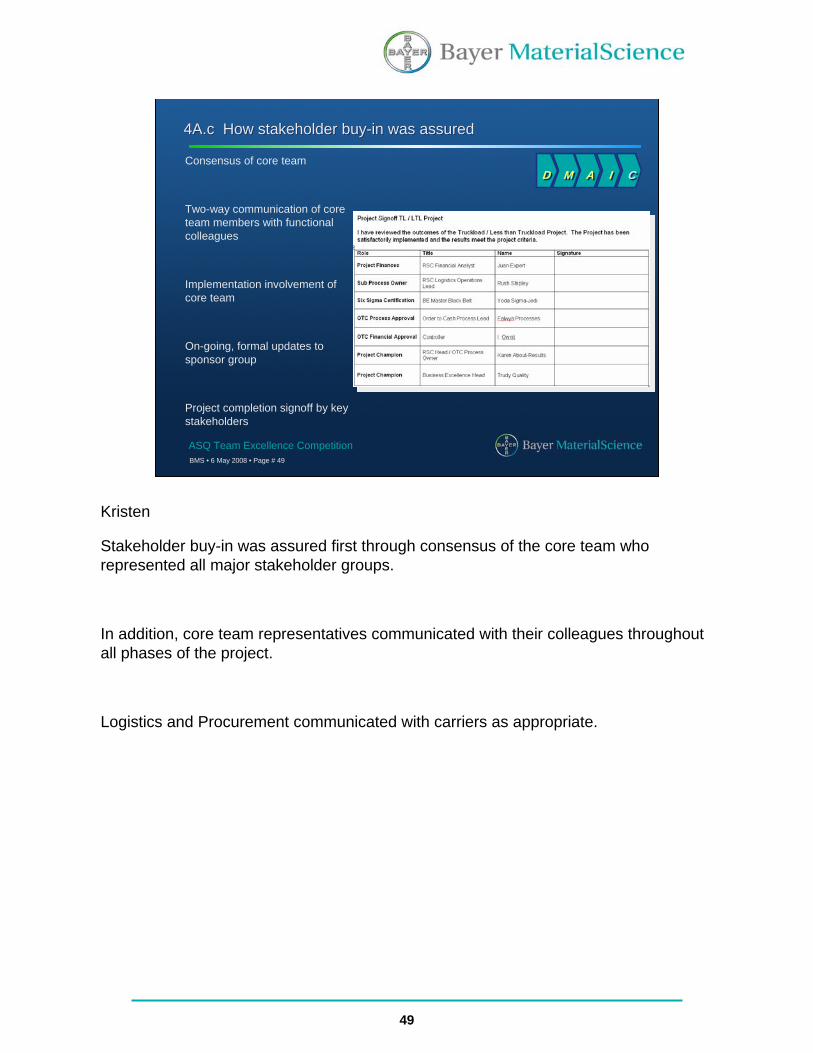
Stakeholder buy-in was assured first through consensus of the core team who represented all major stakeholder groups.
In addition, core team representatives communicated with their colleagues throughout all phases of the project.
Logistics and Procurement communicated with carriers as appropriate.
50
BMS • 6 May 2008 • Page # 50
ASQ Team Excellence Competition
4B.a Plan Developed to Implement Solutions - Consolidated Work Plan (Sample)
4B.a Plan Developed to Implement Solutions - Consolidated Work Plan (Sample)
MS Project Web Access Plan
Consolidated Action Items Plan
Kristen
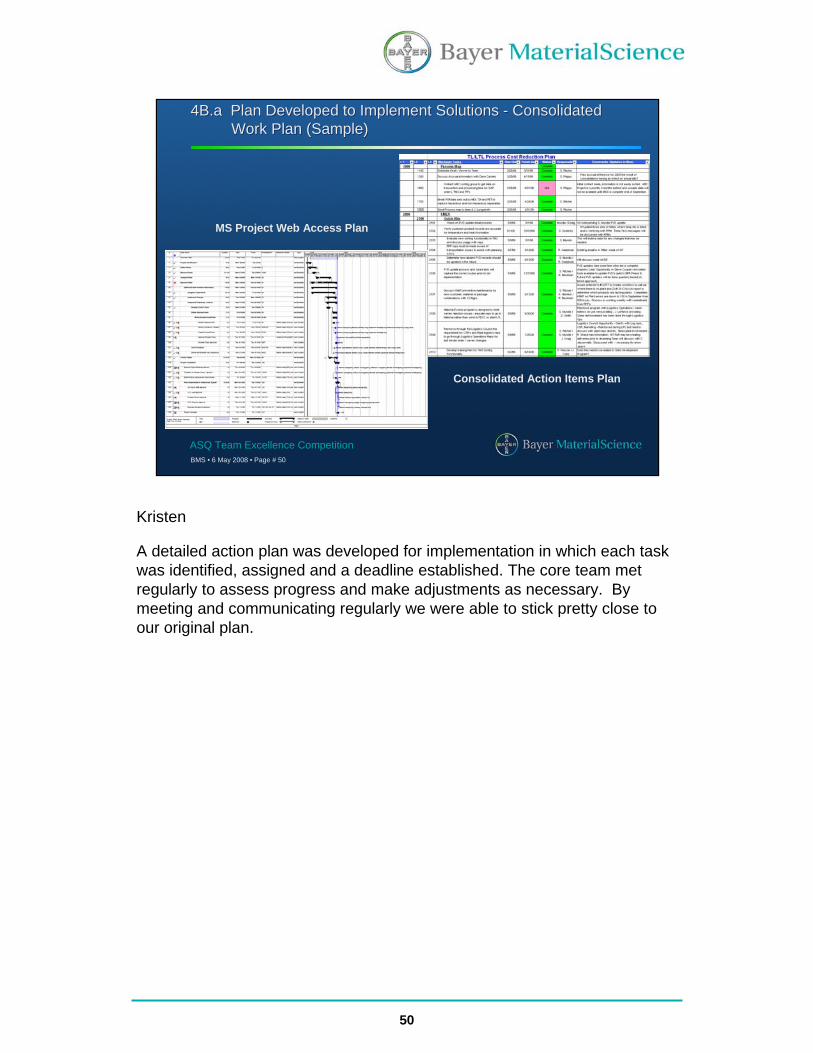
A detailed action plan was developed for implementation in which each task was identified, assigned and a deadline established. The core team met regularly to assess progress and make adjustments as necessary. By meeting and communicating regularly we were able to stick pretty close to our original plan.
51
BMS • 6 May 2008 • Page # 51
ASQ Team Excellence Competition
4B.b Approach Used to Implement Improvements4B.b Approach Used to Implement Improvements
1. Established New Weight Breakpoint in Carrier TablesApproach: Hard coding breakpoint into the carrier tables was made “live” on a proscribed date and communicated to all users. Result: Eliminated potential errors due to judgment or training.
2. Improved Sorting Capability in Transportation SoftwareApproach: Sorting capability changes implemented based on core team directions and communicated to all users outside the core team through one-on-one training sessions. Result: Enhanced consolidation opportunity visibility.
3. Enhanced Carrier Table Update ProcessApproach: Systematizing the carrier table update process was implemented based on core team directions and communicated to users outside the core team through formal training sessions. Result: Eliminated previous process of guessing.
4. Enabled Use of Routing GuidesApproach: Users were retrained on the use of Routing Guides. Result: Routing guides provide four carrier choices and a freight payment rating system is available for new customer locations.
DD MM AA II CC
Ron
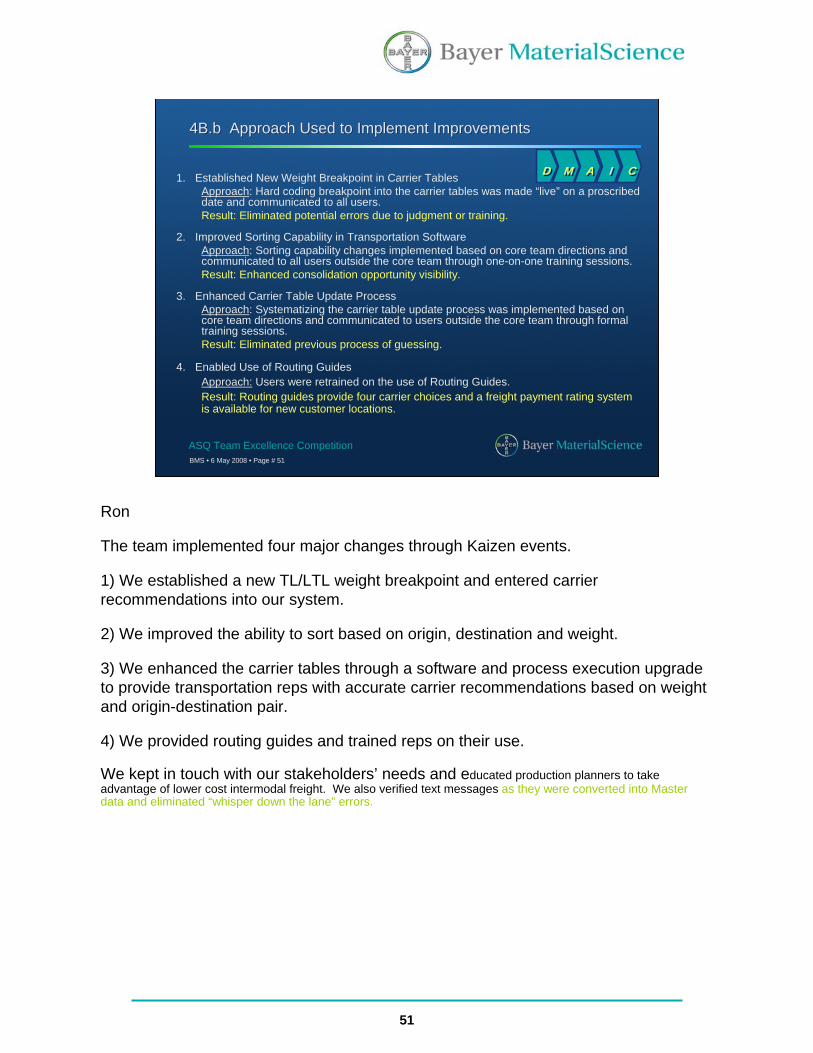
The team implemented four major changes through Kaizen events.
1) We established a new TL/LTL weight breakpoint and entered carrier recommendations into our system.
2) We improved the ability to sort based on origin, destination and weight.
3) We enhanced the carrier tables through a software and process execution upgrade to provide transportation reps with accurate carrier recommendations based on weight and origin-destination pair.
4) We provided routing guides and trained reps on their use.
We kept in touch with our stakeholders’ needs and educated production planners to take advantage of lower cost intermodal freight. We also verified text messages as they were converted into Master data and eliminated “whisper down the lane” errors.
52
BMS • 6 May 2008 • Page # 52
ASQ Team Excellence Competition
4B.c Creation/Installation of Measuring System4B.c Creation/Installation of Measuring System
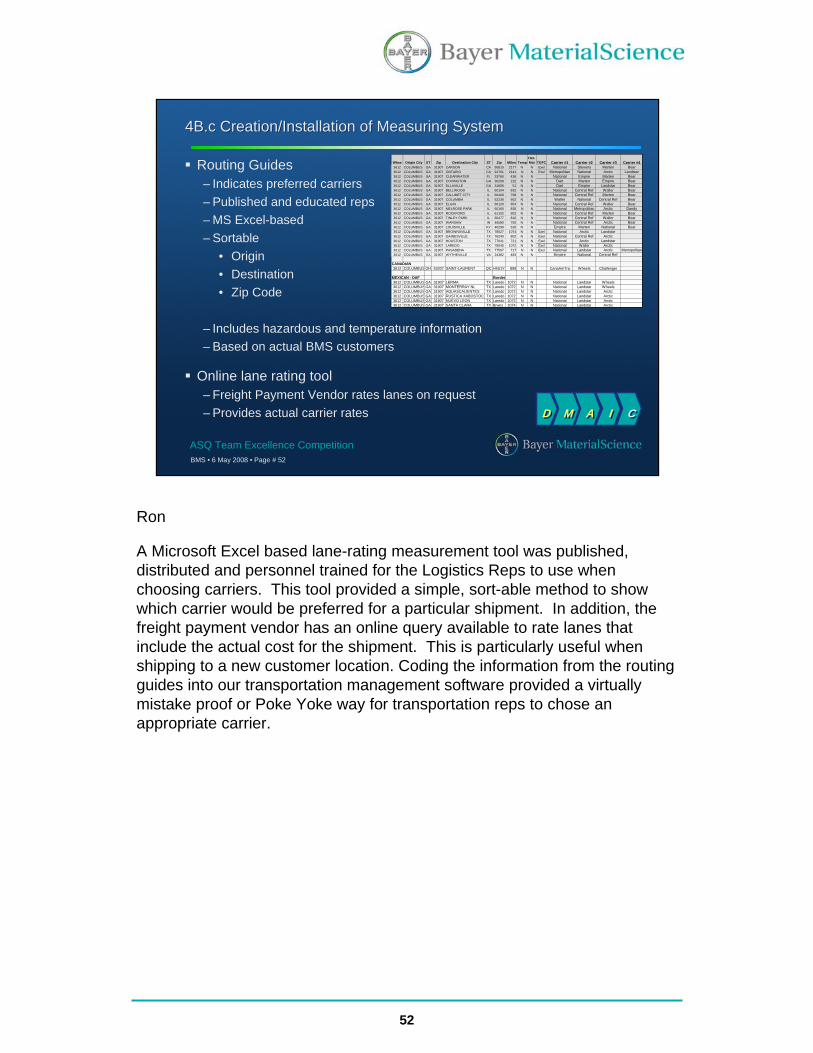
Routing Guides– Indicates preferred carriers – Published and educated reps– MS Excel-based – Sortable
• Origin• Destination• Zip Code
– Includes hazardous and temperature information – Based on actual BMS customers
Online lane rating tool– Freight Payment Vendor rates lanes on request– Provides actual carrier rates
Whse Origin City ST Zip Destination City ST Zip Miles TempHaz-Mat TOFC Carrier #1 Carrier #2 Carrier #3 Carrier #4
3612 COLUMBUS GA 31907 CARSON CA 90810 2177 N N Exel National Stevens Marten Bear3612 COLUMBUS GA 31907 ONTARIO CA 91761 2141 N N Exel Metropolitan National Arctic Landstar3612 COLUMBUS GA 31907 CLEARWATER FL 33760 436 N N National Empire Marten Bear3612 COLUMBUS GA 31907 COVINGTON GA 30209 132 N N Dart Marten Empire Bear3612 COLUMBUS GA 31907 ELLAVILLE GA 31806 51 N N Dart Empire Landstar Bear3612 COLUMBUS GA 31907 BELLWOOD IL 60104 832 N N National Central Ref Waller Bear3612 COLUMBUS GA 31907 CALUMET CITY IL 60409 798 N N National Central Ref Marten Bear3612 COLUMBUS GA 31907 COLUMBIA IL 62236 662 N N Waller National Central Ref Bear3612 COLUMBUS GA 31907 ELGIN IL 60120 854 N N National Central Ref Waller Bear3612 COLUMBUS GA 31907 MELROSE PARK IL 60160 835 N N National Metropolitan Arctic Dandy3612 COLUMBUS GA 31907 ROCKFORD IL 61102 902 N N National Central Ref Marten Bear3612 COLUMBUS GA 31907 TINLEY PARK IL 60477 810 N N National Central Ref Waller Bear3612 COLUMBUS GA 31907 WARSAW IN 46580 750 N N National Central Ref Arctic Bear3612 COLUMBUS GA 31907 LOUISVILLE KY 40299 520 N N Empire Marten National Bear3612 COLUMBUS GA 31907 BROWNSVILLE TX 78527 1074 N N Exel National Arctic Landstar3612 COLUMBUS GA 31907 GAINESVILLE TX 76240 802 N N Exel National Central Ref Arctic3612 COLUMBUS GA 31907 HOUSTON TX 77041 721 N N Exel National Arctic Landstar3612 COLUMBUS GA 31907 LAREDO TX 78045 1072 N N Exel National Waller Arctic3612 COLUMBUS GA 31907 PASADENA TX 77507 717 N N Exel National Landstar Arctic Metropolitan3612 COLUMBUS GA 31907 WYTHEVILLE VA 24382 483 N N Empire National Central Ref
CANADIAN3612 COLUMBUS OH 43207 SAINT-LAURENT QC H4S1Y1 899 N N CanaAmTra Wheels Challenger
MEXICAN - DAF Border3612 COLUMBUS GA 31907 LERMA TX Laredo 1072 N N National Landstar Wheels3612 COLUMBUS GA 31907 MONTERRAY NL TX Laredo 1072 N N National Landstar Wheels3612 COLUMBUS GA 31907 AQUASCALIENTES TX Laredo 1072 N N National Landstar Arctic3612 COLUMBUS GA 31907 RUSTICA XABOSTOC TX Laredo 1072 N N National Landstar Arctic3612 COLUMBUS GA 31907 NUEVO LEON TX Laredo 1072 N N National Landstar Arctic3612 COLUMBUS GA 31907 SANTA CLARA TX Brwns 1074 N N National Landstar Arctic
DD MM AA II CC
Ron
A Microsoft Excel based lane-rating measurement tool was published, distributed and personnel trained for the Logistics Reps to use when choosing carriers. This tool provided a simple, sort-able method to show which carrier would be preferred for a particular shipment. In addition, the freight payment vendor has an online query available to rate lanes that include the actual cost for the shipment. This is particularly useful when shipping to a new customer location. Coding the information from the routing guides into our transportation management software provided a virtually mistake proof or Poke Yoke way for transportation reps to chose an appropriate carrier.
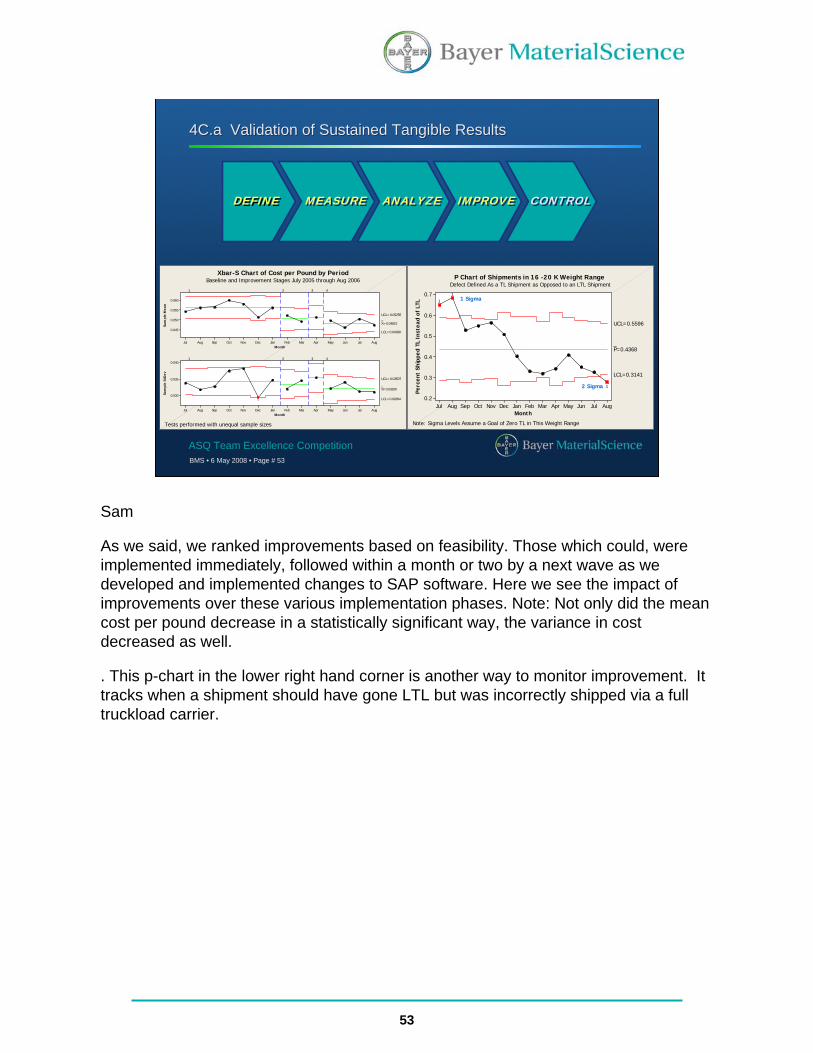
53
BMS • 6 May 2008 • Page # 53
ASQ Team Excellence Competition
AugJulJunMayAprMarFebJanDecNovOctSepAugJul
0.7
0.6
0.5
0.4
0.3
0.2
MonthPe
rcen
t Sh
ippe
d TL
Ins
tead
of
LTL
_P=0.4368
UCL=0.5596
LCL=0.3141
1
1
1
P Chart of Shipments in 16 -20 K Weight Range Defect Defined As a TL Shipment as Opposed to an LTL Shipment
1 Sigma
2 Sigma
Note: Sigma Levels Assume a Goal of Zero TL in This Weight Range
AugJulJunMayAprMarFebJanDecNovOctSepAugJul
0.060
0.055
0.050
0.045
Month
Sam
ple
Mea
n
__X=0.04821
UCL=0.05255
LCL=0.04388
1 2 3 4
AugJulJunMayAprMarFebJanDecNovOctSepAugJul
0.040
0.035
0.030
Month
Sam
ple
StD
ev
_S=0.03200
UCL=0.03507
LCL=0.02894
1 2 3 4
1
Baseline and Improvement Stages July 2005 through Aug 2006Xbar-S Chart of Cost per Pound by Period
Tests performed with unequal sample sizes
4C.a Validation of Sustained Tangible Results4C.a Validation of Sustained Tangible Results
DEFINEDEFINE MEASUREMEASURE ANALYZEANALYZE IMPROVEIMPROVE CONTROLCONTROL
Sam
As we said, we ranked improvements based on feasibility. Those which could, were implemented immediately, followed within a month or two by a next wave as we developed and implemented changes to SAP software. Here we see the impact of improvements over these various implementation phases. Note: Not only did the mean cost per pound decrease in a statistically significant way, the variance in cost decreased as well.
. This p-chart in the lower right hand corner is another way to monitor improvement. It tracks when a shipment should have gone LTL but was incorrectly shipped via a full truckload carrier.
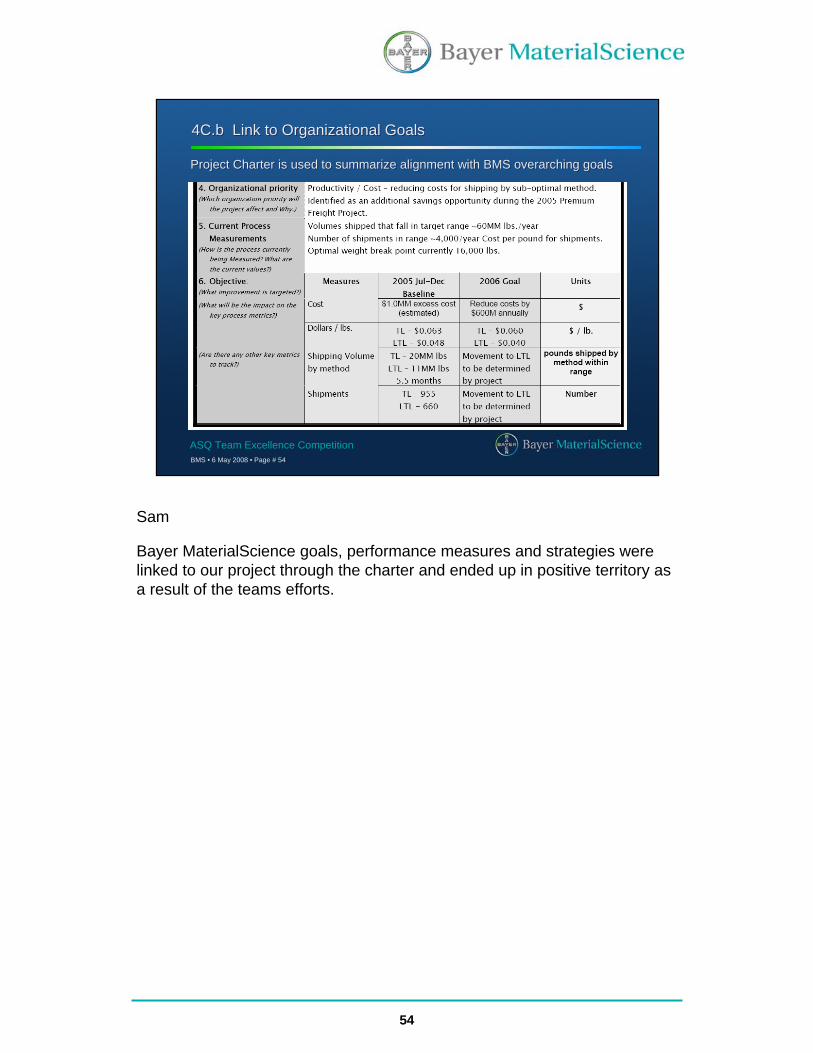
54
BMS • 6 May 2008 • Page # 54
ASQ Team Excellence Competition
Project Charter is used to summarize alignment with BMS overarching goalsProject Charter is used to summarize alignment with BMS overarching goals
4C.b Link to Organizational Goals4C.b Link to Organizational Goals
Sam
Bayer MaterialScience goals, performance measures and strategies were linked to our project through the charter and ended up in positive territory as a result of the teams efforts.
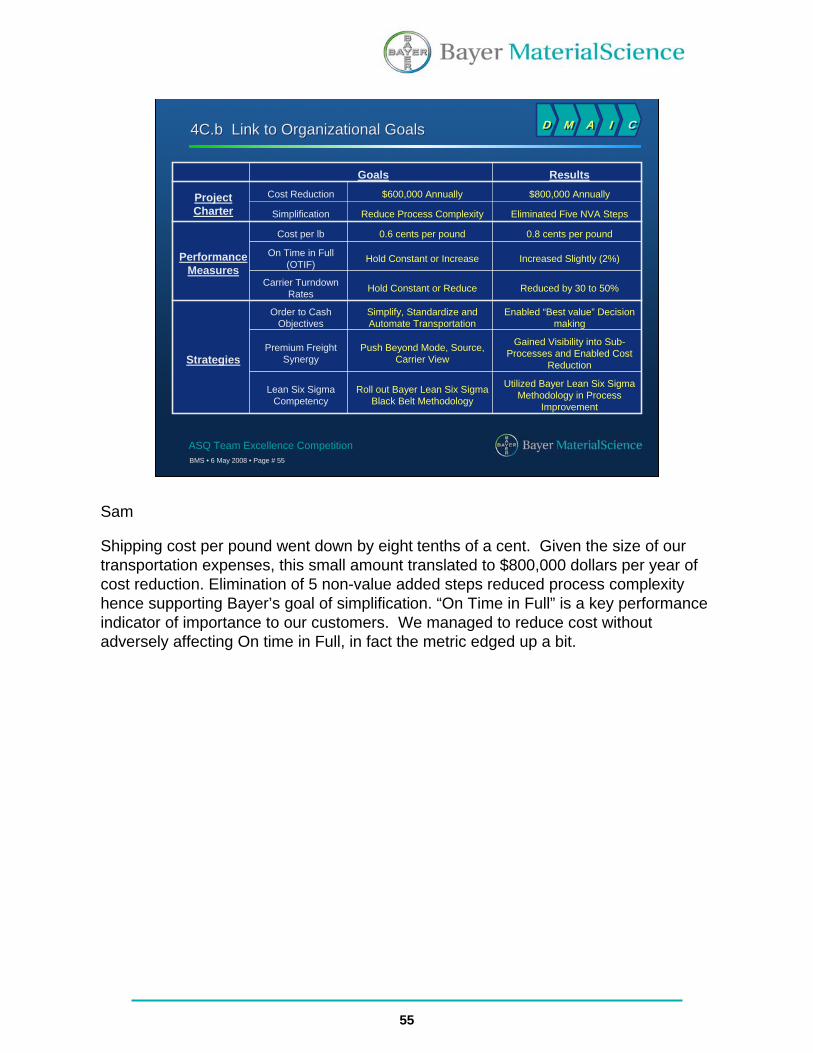
55
BMS • 6 May 2008 • Page # 55
ASQ Team Excellence Competition
4C.b Link to Organizational Goals4C.b Link to Organizational Goals
Strategies
Performance Measures
Project Charter
ResultsGoals
Utilized Bayer Lean Six Sigma Methodology in Process
Improvement
Roll out Bayer Lean Six Sigma Black Belt Methodology
Lean Six Sigma Competency
Gained Visibility into Sub-Processes and Enabled Cost
Reduction
Push Beyond Mode, Source, Carrier View
Premium Freight Synergy
Enabled “Best value” Decision making
Simplify, Standardize and Automate Transportation
Order to Cash Objectives
Reduced by 30 to 50%Hold Constant or ReduceCarrier Turndown Rates
Increased Slightly (2%)Hold Constant or IncreaseOn Time in Full (OTIF)
0.8 cents per pound0.6 cents per poundCost per lb
Eliminated Five NVA StepsReduce Process ComplexitySimplification
$800,000 Annually$600,000 AnnuallyCost Reduction
DD MM AA II CC
Sam
Shipping cost per pound went down by eight tenths of a cent. Given the size of our transportation expenses, this small amount translated to $800,000 dollars per year of cost reduction. Elimination of 5 non-value added steps reduced process complexity hence supporting Bayer’s goal of simplification. “On Time in Full” is a key performance indicator of importance to our customers. We managed to reduce cost without adversely affecting On time in Full, in fact the metric edged up a bit.
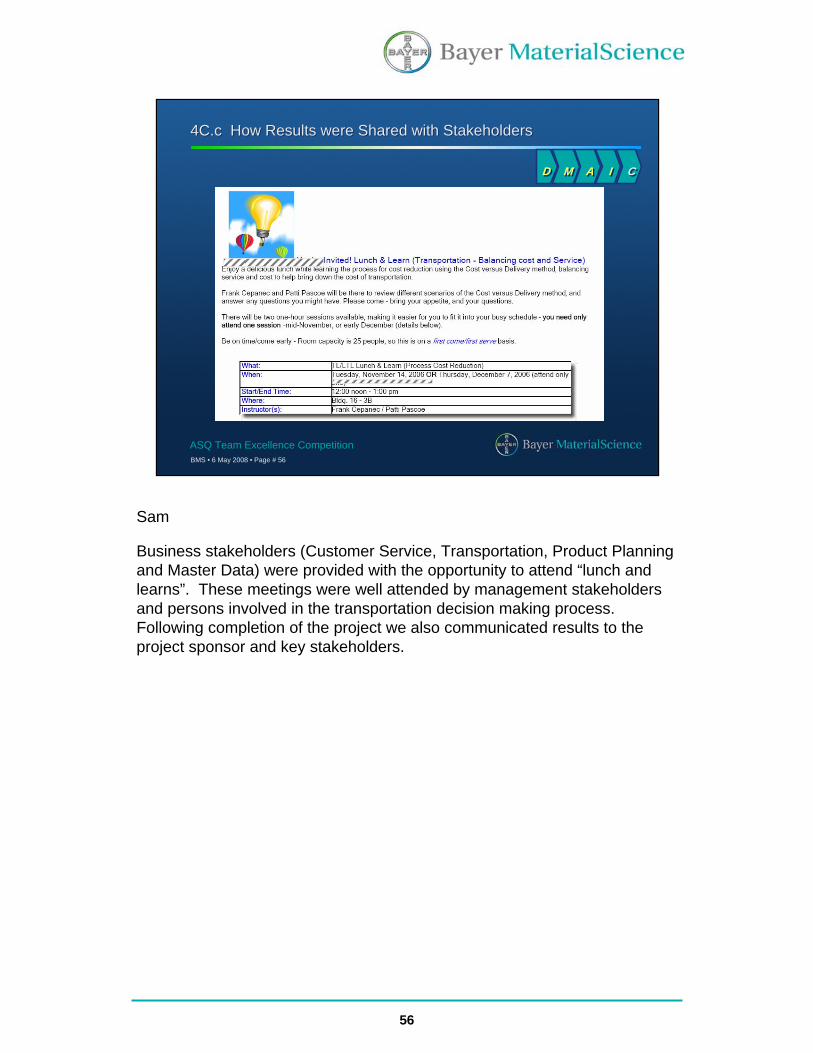
56
BMS • 6 May 2008 • Page # 56
ASQ Team Excellence Competition
4C.c How Results were Shared with Stakeholders4C.c How Results were Shared with Stakeholders
DD MM AA II CC
Sam
Business stakeholders (Customer Service, Transportation, Product Planning and Master Data) were provided with the opportunity to attend “lunch and learns”. These meetings were well attended by management stakeholders and persons involved in the transportation decision making process. Following completion of the project we also communicated results to the project sponsor and key stakeholders.
57
BMS • 6 May 2008 • Page # 57
ASQ Team Excellence Competition
Section 5: Team Management and Project Presentation
Laurie
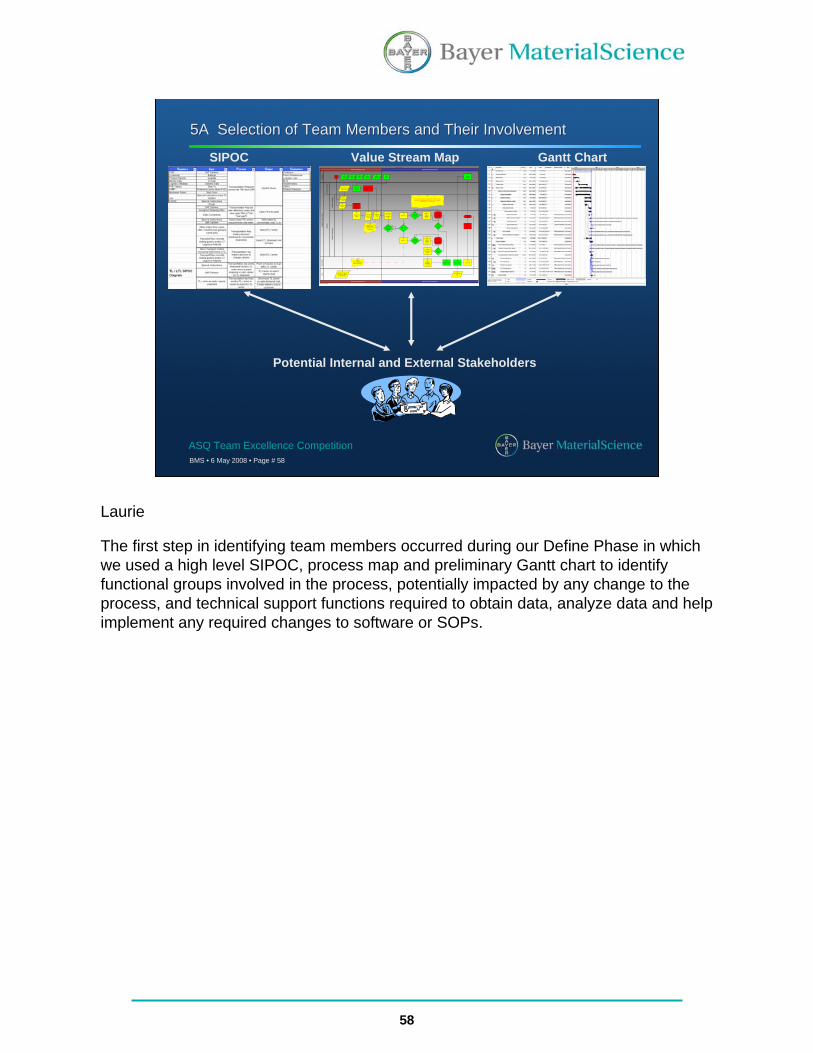
58
BMS • 6 May 2008 • Page # 58
ASQ Team Excellence Competition
TL LTL Process.igx
Revised 5/19/2006
Cust
omer
Regi
onal
Ser
vice
Cen
ter
Cust
omer
Ser
vice
Logi
stic
s
Logi
stic
s S
trate
gyLo
gist
ics
Oper
atio
ns
Plan
t / W
hse
CTL
Order Preparation Phase
Order Preparation Phase
Shipment Preparation Phase
Shipment Preparation Phase
Start 1
Create SAP Delivery
4
Carrier Bid Results
26
Select open TR, review
requirements / notes
6
Transportat ion Request sent to TM3 from SAP
5
Tender TL Load to
preferred carrier
9
Carrier Accept load?
10
Order Quant ity
31
Update PVD Tables
29
Prepare PVD update
spreadsheet
27
Select TL carrier and tender load
25
No
Load Carrier
11
Generate BOL
13
Enter PGI
14
Daily File? to CTL
15
Carrier Freight Bill
24
Network Optimization
Results
2
BMS Carrier rates (TL by lane, LTL general
discount only)
28
Place Order
30Material
Type
32Delivery
Date
33Ship to
Location
34Special
Inst ructions
35
Plant Schedules Pickup with LTL Carrier
41
Receive Shipment
42
Preferred Carrier from
PVD
43
Transport Query YTO4
45
Send Shipment Unit to Plant /
Whse
46
KNMT Customer Material Record
47
Consolidate Shipments TL / LTL
50 Yes
Ship asTL or LTL
51
Override Preferred TL Carrier
53
No
No
Yes
Yes
Missing Data - Transport Rep does not see rates!
59
Ship as TL
60
Ship as LTL
61Override Preferred
LTL Carrier
62
No
Yes
End22
Tender LTL Load to
preferred carrier
63
Carrier Accept load?
64
No
Yes
Select LTL carrier and tender load
65
TL
LTL
Yes
Missing Data - TM3 does not show
consolidat ions in an easy format
66
How is the choice made to consolidate on TL or LTL . How is master bill of lading generated - load nose or tail? How does
system pull PVD for consolidation
67
SIPOC Value Stream Map
Potential Internal and External Stakeholders
Gantt Chart
5A Selection of Team Members and Their Involvement5A Selection of Team Members and Their Involvement
Laurie
The first step in identifying team members occurred during our Define Phase in which we used a high level SIPOC, process map and preliminary Gantt chart to identify functional groups involved in the process, potentially impacted by any change to the process, and technical support functions required to obtain data, analyze data and help implement any required changes to software or SOPs.
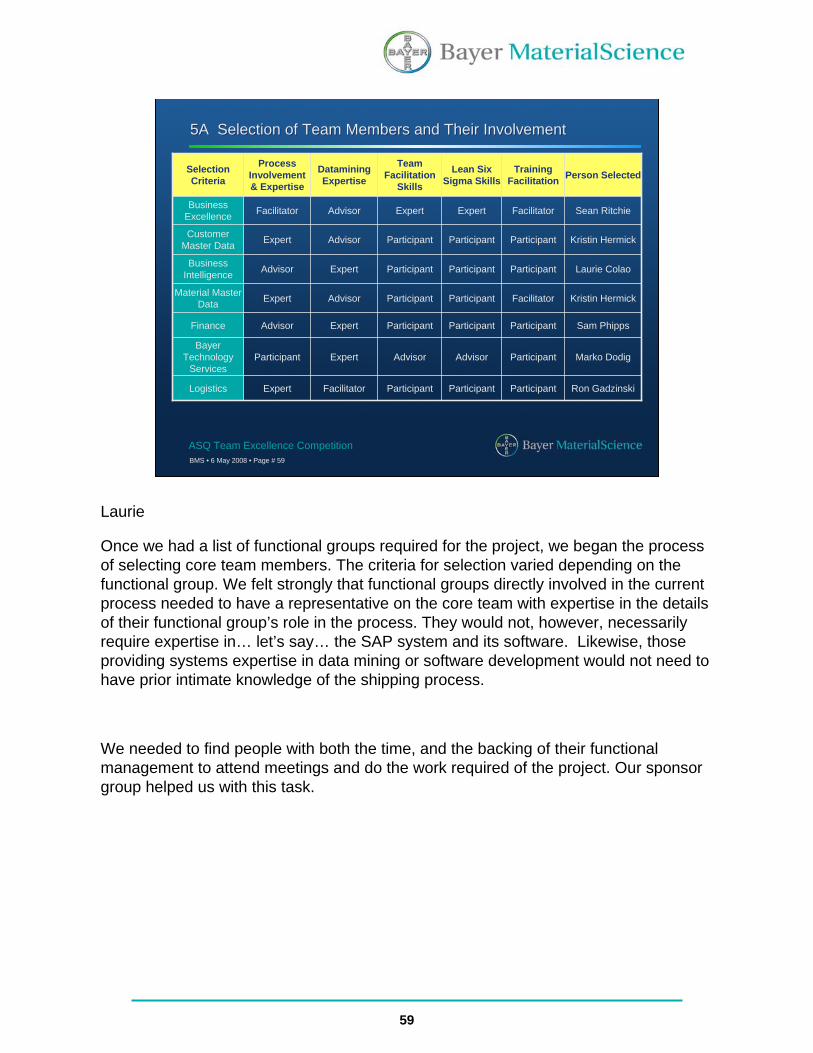
59
BMS • 6 May 2008 • Page # 59
ASQ Team Excellence Competition
5A Selection of Team Members and Their Involvement5A Selection of Team Members and Their Involvement
Participant
Participant
Participant
Facilitator
Participant
Participant
Facilitator
Training Facilitation
Participant
Advisor
Participant
Participant
Participant
Participant
Expert
Lean Six Sigma Skills
Marko DodigAdvisorExpertParticipantBayer
Technology Services
Sam PhippsParticipantExpertAdvisorFinance
Kristin HermickParticipantAdvisorExpertMaterial Master Data
Ron GadzinskiParticipantFacilitatorExpertLogistics
Laurie ColaoParticipantExpertAdvisorBusiness Intelligence
Kristin HermickParticipantAdvisorExpertCustomer Master Data
Sean RitchieExpertAdvisorFacilitatorBusiness Excellence
Person SelectedTeam
Facilitation Skills
DataminingExpertise
Process Involvement& Expertise
Selection Criteria
Laurie
Once we had a list of functional groups required for the project, we began the process of selecting core team members. The criteria for selection varied depending on the functional group. We felt strongly that functional groups directly involved in the current process needed to have a representative on the core team with expertise in the details of their functional group’s role in the process. They would not, however, necessarily require expertise in… let’s say… the SAP system and its software. Likewise, those providing systems expertise in data mining or software development would not need to have prior intimate knowledge of the shipping process.
We needed to find people with both the time, and the backing of their functional management to attend meetings and do the work required of the project. Our sponsor group helped us with this task.
60
BMS • 6 May 2008 • Page # 60
ASQ Team Excellence Competition
5B How the Team Prepared To Work Together5B How the Team Prepared To Work Together
Roles and Responsibilities
Lean Six Sigma Orientation
Planning/ Time ManagementMutual Expectations
Goals
Decision Making
CommunicationsManagement Expectations
Concerns/ObstaclesTeam Composition
Laurie
Before we began to work on the project itself, we needed to talk about how we were going to work as a team. What were our relative roles and responsibilities? Did we need any additional team members? What were our mutual agreements regarding how we would conduct ourselves? What did we expect of each other? What did we think management expected? How much of our time will this require and over what period? How will we make decisions? What is Lean Six Sigma and how is it different from what we’ve been doing? We spent some extra time reviewing the DMAIC process and some of the tools we would be using along the way.
Working out these basics before we began laid the foundation for us to be an effective team.
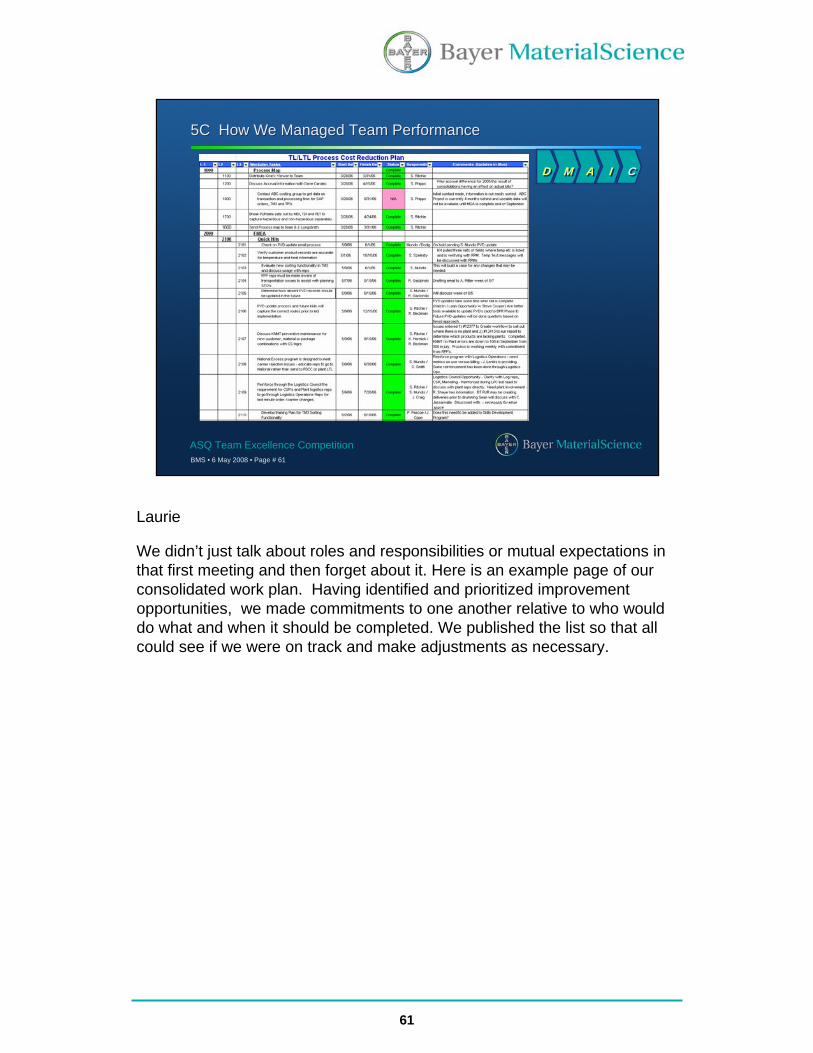
61
BMS • 6 May 2008 • Page # 61
ASQ Team Excellence Competition
5C How We Managed Team Performance5C How We Managed Team Performance
DD MM AA II CC
Laurie
We didn’t just talk about roles and responsibilities or mutual expectations in that first meeting and then forget about it. Here is an example page of our consolidated work plan. Having identified and prioritized improvement opportunities, we made commitments to one another relative to who would do what and when it should be completed. We published the list so that all could see if we were on track and make adjustments as necessary.
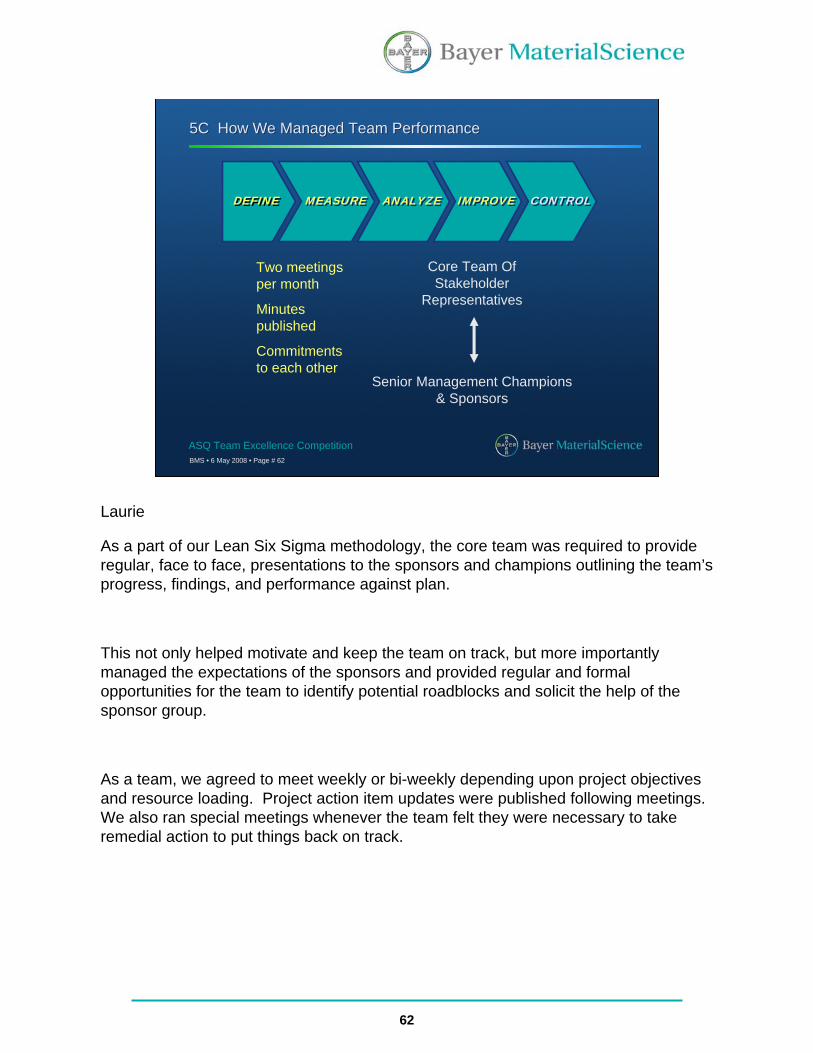
62
BMS • 6 May 2008 • Page # 62
ASQ Team Excellence Competition
5C How We Managed Team Performance5C How We Managed Team Performance
Senior Management Champions & Sponsors
Core Team Of Stakeholder
Representatives
Two meetings per month
Minutes published
Commitments to each other
DEFINEDEFINE MEASUREMEASURE ANALYZEANALYZE IMPROVEIMPROVE CONTROLCONTROL
Laurie
As a part of our Lean Six Sigma methodology, the core team was required to provide regular, face to face, presentations to the sponsors and champions outlining the team’s progress, findings, and performance against plan.
This not only helped motivate and keep the team on track, but more importantly managed the expectations of the sponsors and provided regular and formal opportunities for the team to identify potential roadblocks and solicit the help of the sponsor group.
As a team, we agreed to meet weekly or bi-weekly depending upon project objectives and resource loading. Project action item updates were published following meetings. We also ran special meetings whenever the team felt they were necessary to take remedial action to put things back on track.

63
BMS • 6 May 2008 • Page # 63
ASQ Team Excellence Competition
Bayer MaterialScience – Science for a Better LifeBayer MaterialScience – Science for a Better Life
Working together as a cross-functional team utilizing the Bayer Lean Six Sigma Methodology, we were able to optimize the Truckload / Less than Truckload Decision Making Process and reduce Bayer MaterialScience Transportation costs by over $800M in 2007.
Thank You for Your Attention
Laurie
Thank you for providing us the opportunity to obtain your feedback on our on-going process improvement endeavors. We would now like to take your questions.

64
Questions?Questions?
ASQ Team Excellence Competition
Laurie