Optimizing Sample Preparation Protocols for Multi- Modal...
58
1 Optimizing Sample Preparation Protocols for Multi- Modal Imaging Mass Spectrometry (IMS) Master of Science Thesis in the Master Degree Programme, Chemistry and Bioscience MASOUMEH DOWLATSHAHI POUR Department of Chemical and Biological Engineering Division of Chemistry and bioscience CHALMERS UNIVERSITY OF TECHNOLOGY Gothenburg, Sweden, 2013 Report No. xxxx
Transcript of Optimizing Sample Preparation Protocols for Multi- Modal...

1
Optimizing Sample Preparation Protocols for Multi-Modal Imaging Mass Spectrometry (IMS)Master of Science Thesis in the Master Degree Programme, Chemistry andBioscience
MASOUMEH DOWLATSHAHI POUR
Department of Chemical and Biological EngineeringDivision of Chemistry and bioscienceCHALMERS UNIVERSITY OF TECHNOLOGYGothenburg, Sweden, 2013Report No. xxxx
2
Optimizing Sample Preparation Protocols for Multi-Modal Imaging Mass Spectrometry (IMS)
MASOUMEH DOWLATSHAHI POUR, [email protected]
Master thesis
Subject Category: Sample preparation protocols for IMS
Chalmers University of Technology
Kemivägen 10
SE-412 96 Gothenburg
Sweden
Examiner: Professor Andrew Ewing
Supervisors, name: Professor Andrew Ewing, Melissa Passarelli
Supervisor address: Kemigården 4 (the Chalmers area)
Client: Chalmers University of Technology
Date: April 2013
Keywords: Matrix Deposition, Matrix Sublimation, ImagePrep, MeSIMS, MALDI Imaging.
3
Abstract
Matrix application is one of the most crucial steps in sample preparation of Imaging Mass
Spectrometry techniques such as MALDI and MeSIMS. Essentially an efficient and reproducible
matrix deposition method needs to be applied in order to obtain high quality, trust worthy and
reproducible images in IMS. Several strategies have been developed to apply matrix in both
manual and automatic procedures in recent years.
In this workflow two matrix application techniques of ImagePrep and sublimation were utilized
to apply DHB (2, 5-dihydroxybenzoic acid) used as the matrix on tissue samples. In the first
step, size, distribution and coverage of produced matrix crystals through use of ImagePrep and
sublimation were investigated. ImagePrep creates inhomogeneous matrix deposition and
relatively big matrix crystals with poor coverage, whereas sublimation is able successfully to
generate very small crystals and homogeneous films.
In next step of this project, deposition temperature and time were optimized for sublimation of
DHB which were found to be 125°C and 8 min, respectively. Eventually, in order to obtain a
proper thickness of deposited DHB for MALDI and SIMS imaging, sublimation of DHB was
performed at125°C in 10, 30 and 60 min.
SIMS imaging results showed that none of deposition generates an appropriate thickness for
SIMS imaging. In conclusion, times of 5, 15 and 20 min should be performed to obtain an
optimized time.
For MALDI imaging, 10 min sublimation produced insufficient thickness of the deposited DHB,
whereas the thickness produced after 60 min deposition was too thick. Ultimately, 30 min
deposition time was found to produce the most intense signals.
Keywords: Matrix Deposition, Matrix Sublimation, ImagePrep, MeSIMS, MALDI Imaging.
4
TABLE OF CONTENTS
1. INTRODUCTION……………………………………………………………….………6
2. THEORY………………………...……………………………………….………………8
2.1 What isMass Spectrometry?
2.2 What is Imaging Mass Spectrometry (IMS)?
2.2.1. Techniques:2.2.1.1. SIMS2.2.1.2. MALDI2.2.1.3. DESI
2.3 Pitfalls of Imaging Mass Spectrometry (IMS)?2.3.1. Resolution and Sensitivity
2.4 Secondary Ion Mass Spectrometry (SIMS)2.4.1 Principles of SIMS
2.4.1.1. Cluster Ion Sources2.4.1.2. MeSIMS (matrix enhanced SIMS)
2.4.2 Application of SIMS
2.5 Matrix-Assisted Laser Desorption Ionization (MALDI)2.5.1 Principles of MALDI2.5.2 Choice of Matrix
2.5.2.1 DHB (2, 5-dihydroxybenzoic acid)
2.5.2.2CHCA (α- cyano-4-hydroxycinnamic acid)
2.5.3 Applications of MALDI
2.6 Mass Analyzers2.6.1 Time of Flight
2.7 Sample Preparation2.7.1 Deposition of Matrix
2.7.1.1 ImagePrep
2.7.1.2 Matrix Sublimation
5
3. MATERIALS AND METHOD………………………………………….…………….27
3.1 Materials
3.2 Methods
3.2.1 Deposition of matrix
3.2.1.1 Imageprep
3.2.1.2 Sublimation
3.2.2 Mass spectrometry imaging
4. RESULTS AND DISCUSSION ………………………………………………………30
4.1 ImagePrep4.1.1 Coverage of matrix (DHB) crystals on the sample surface
4.2 Sublimation4.2.1 Optimization of time and temperature for sublimation of DHB4.2.2 The optical microscope images4.2.3 Optimization of time and temperature for sublimation of CHCA
4.3 Instrumental measurements4.3.1 SIMS imaging4.3.2 MALDI imaging
5. CONCLUSIONS…………………………………………….……………….………...48
6. REFERENCES ……………………………………….………………..………….…...49
7. ACKNOWLEDGMENTS ………………………………………………...…….…......52
8. APPENDIX ……………………………………….……………………...…………......53
6
1. INTRODUCTION
Imaging mass spectrometry (IMS) is a powerful technique for determining, mapping and
visualizing the distribution of endogenous biological molecules such as lipids or neuropeptides
across biological materials. The IMS technique combines the chemical specificity and spatial
analysis of surfaces. As a result, the analyst is able to obtain spatial localization of several
different compounds, complex biomolecules and parallel detection of multiple analytes [1-2].
These species are recorded directly without the need of target-specific reagent and radioactive or
fluorescence labels in contrast to commonly used in other imaging techniques such as optical
imaging, positron tomography, electron microscopy, atomic force microscopy and scanning
tunnel microscopy [3-4].
Recently, research efforts have been applied to a more comprehensive study of compounds in
tissue via IMS. For instance, secondary ion mass spectrometry (SIMS) imaging is frequently
utilized to investigate the distribution of atoms and small molecules with spatial resolution below
one micron. Another advance in the field of IMS is matrix-assisted laser desorption/ionization
(MALDI). This well-known technique is a prominent imaging method used to study lipids,
peptides and proteins at a spatial resolution ranging from 3 to 250 micro meters [5-6].
For MALDI imaging the following steps are preformed to prepare the sample, 1) the deposition
of matrix, 2) data acquisition, and 3) image re-construction [7]. For protein and peptide targeted
analyses, the samples are washed to remove lipid contamination before the matrix application
step [8].
Although it seems obvious that each of these steps are needed to be fulfilled accurately to
achieve a high quality image, it is important to focus on the deposition of matrix step to find an
optimized protocol as a main aim in this workflow. Typically, several application strategies are
utilized for matrix application. Some key aspects such as homogeneity of the matrix layer,
reproducibility of the matrix application, deposition of sufficient amount of matrix, and spatial
integrity of the sample have to be considered during this process in order to obtain desired
resolution and high quality results [2] [8-9].

7
In this project two matrix application techniques have been compared, a spray technique using an
automated commercial system, the ImagePrep from Bruker, Gmb, and sublimation, a non-
commercial technique. Matrix thickness, incubation time and wetness have been optimized in
ImagePrep. For sublimation-based matrix application, matrix deposition time and the
sublimation temperature have been optimized.
8
2. THEORY
This section provides some of the theoretical framework for the MALDI matrix deposition
methods used in this thesis as well as their testing and application.
2.1 What is Mass Spectrometry?
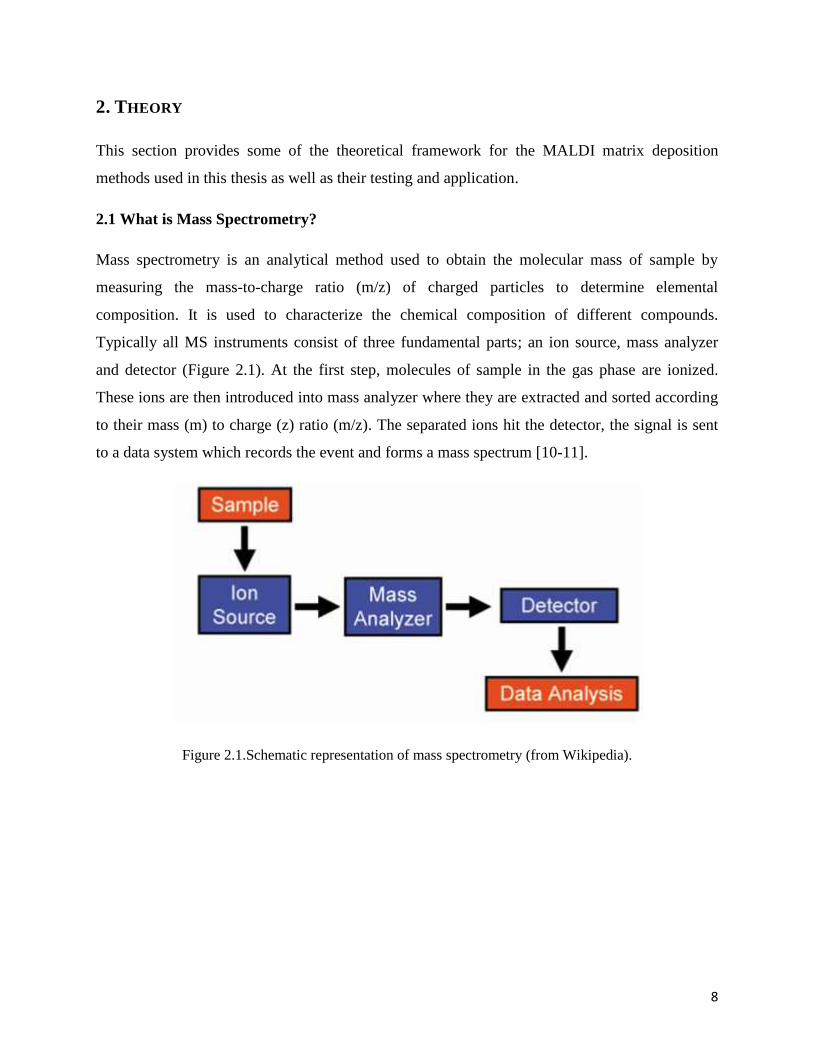
Mass spectrometry is an analytical method used to obtain the molecular mass of sample by
measuring the mass-to-charge ratio (m/z) of charged particles to determine elemental
composition. It is used to characterize the chemical composition of different compounds.
Typically all MS instruments consist of three fundamental parts; an ion source, mass analyzer
and detector (Figure 2.1). At the first step, molecules of sample in the gas phase are ionized.
These ions are then introduced into mass analyzer where they are extracted and sorted according
to their mass (m) to charge (z) ratio (m/z). The separated ions hit the detector, the signal is sent
to a data system which records the event and forms a mass spectrum [10-11].
Figure 2.1.Schematic representation of mass spectrometry (from Wikipedia).
9
2.2 What is Imaging Mass Spectrometry (IMS)?
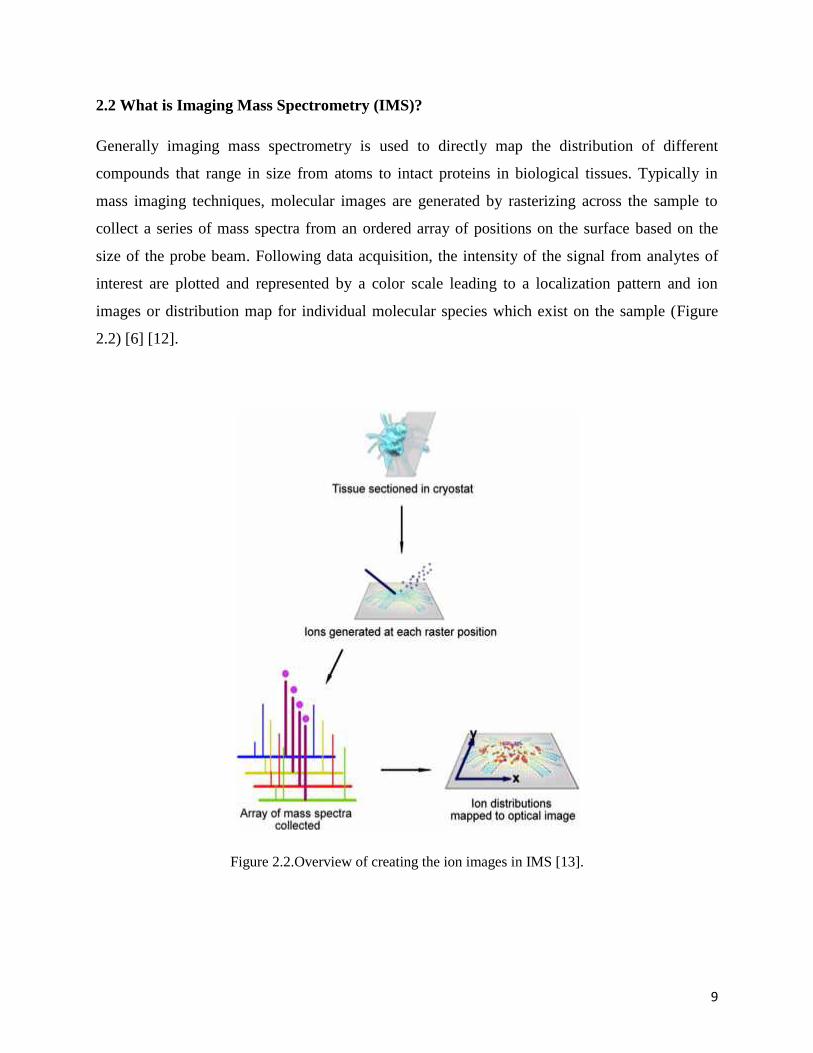
Generally imaging mass spectrometry is used to directly map the distribution of different
compounds that range in size from atoms to intact proteins in biological tissues. Typically in
mass imaging techniques, molecular images are generated by rasterizing across the sample to
collect a series of mass spectra from an ordered array of positions on the surface based on the
size of the probe beam. Following data acquisition, the intensity of the signal from analytes of
interest are plotted and represented by a color scale leading to a localization pattern and ion
images or distribution map for individual molecular species which exist on the sample (Figure
2.2) [6] [12].
Figure 2.2.Overview of creating the ion images in IMS [13].
10
2.2.1 Techniques
In general, the following steps are commonly used for mass spectrometry methods: analyte must
be ionized, separated in a vacuum, and then detected. Consequently based on the ionization
method used, mass spectrometry has been divided into three powerful techniques including
secondary ion mass spectrometry (SIMS), matrix-assisted laser desorption (MALDI), and
desorption electrospray ionization (DESI) [11].
2.1.1.1 SIMS
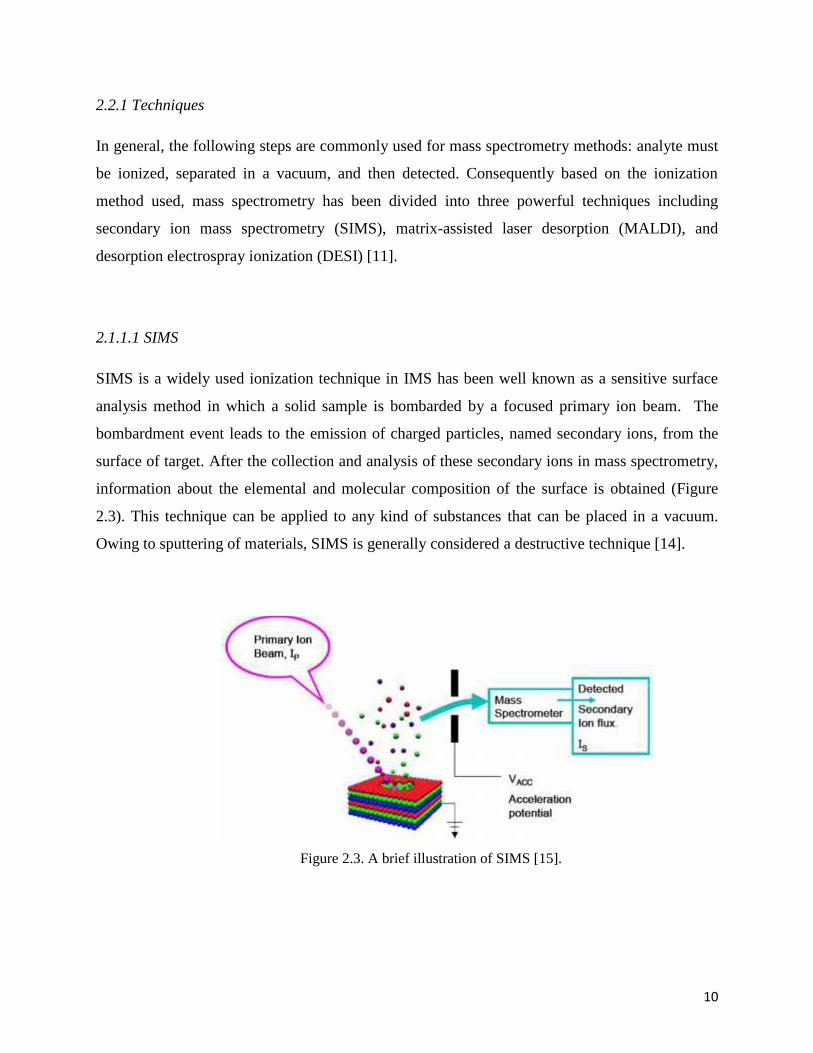
SIMS is a widely used ionization technique in IMS has been well known as a sensitive surface
analysis method in which a solid sample is bombarded by a focused primary ion beam. The
bombardment event leads to the emission of charged particles, named secondary ions, from the
surface of target. After the collection and analysis of these secondary ions in mass spectrometry,
information about the elemental and molecular composition of the surface is obtained (Figure
2.3). This technique can be applied to any kind of substances that can be placed in a vacuum.
Owing to sputtering of materials, SIMS is generally considered a destructive technique [14].
Figure 2.3. A brief illustration of SIMS [15].

11
2.1.1.2 MALDI
Matrix-assisted laser desorption ionization (MALDI) is a laser based soft ionization method
utilized in mass spectrometry which has been known as one of the most successful methods for
investigation of large molecules. In MALDI a matrix that consists of crystallized molecules is
mixed with the analyte (or placed on the analyte). Following vaporization of the solvent,
molecules of analyte are extracted and cocrystallized with matrix leading to formation of
analyte-doped matrix crystals. The sample-matrix crystals are bombarded with a UV laser beam
to excite the matrix and subsequently transfer energy to the analytes, causing them to be ejected
from the surface. This process gives rise to ablation, desorption and ionization of the analytes
mainly as charged particles [1, 11]. Figure 2.4 shows the process by which ions are formed in
MALDI.
Figure 2.4. The formation of ions during MALDI [16].

12
2.1.1.3 DESI
Desorption electrospray ionization (DESI) is a combination of electrospray (ESI) and desorption
(DI) techniques and is unique as it is carried out at atmospheric pressure. DESI is accomplished
by directing an electrosprayed mist of charged droplets onto a surface of the sample from a few
millimeters away. By applying an electrical potential, the stream of the electrospray impacts the
sample surface leading to the generation of ions from the chemical species present.
Consequently, these ions move through the air to the mass spectrometer inlet under the influence
of an applied potential field. Figure 2.5depicts a simple illustration of procedure to produce ions
by the DESI technique [6] [17].
Figure 2.5. Schematic diagram of DESI desorption and ionization process [17].

13
2.3 Pitfalls of Imaging Mass Spectrometry (IMS)
Compatibility of the samples in high vacuum, which is a typical condition to work in IMS
instruments, is important. At room temperature, there is the possibility of molecular diffusion in
all the steps of sample preparation, such as cutting, washing, matrix application, which influence
negatively on data reproducibility and the quality of the images.
Biological samples are too complex to analyze by IMS directly. The multiple molecules existing
in tissue sections including proteins, lipids, oligonucleotides, carbohydrates, matrix ions, and
salts which adversely impress efficiency of desorption and ionization and also lead to inhibition
of optimal detection. This phenomenon, called ion suppression, in which the ionization process is
less efficient causes reduction the quality of the IMS analysis.
When the size of the matrix crystals exceeds 10 µm, this can negatively effect on the spatial
resolution in MALDI imaging. In SIMS, a matrix is not required for ionization and desorption
[16] [18-19].
2.3.1 Resolution and Sensitivity
Generally there is a trade-off between lateral resolution and the number of ions produced. This is
considered the sensitivity of analysis leading to a limitation in instrumental work at cellular
level. In fact, at high lateral resolution there is an obvious reduction in the amount of available
molecules to be ionized and detected. In other words, lateral resolution is increased at the cost of
sensitivity. To improve sensitivity, surface treatment methods, including adding a thin layer of
matrix-metal - named metal assisted (MetA) and adding a matrix to enhance(Me) SIMS have
been reported to increase the desorption/ionization of analytes [20].
14
2.4 Secondary Ion Mass Spectrometry (SIMS)
In SIMS, a primary beam of either positive or negative ions focused on the surface of sample to
produce secondary ions, which are then transferred into a mass spectrometer to achieve
quantitative and qualitative chemical information [6].
2.4.1 Principles of SIMS
As the primary ion beam impacts the sample surface a sufficient energy is added to ionize many
molecules and elements. Typically the range of this energy is about 5-25 keV, which is much
bigger than the bond energies of surface molecules leading to a huge fragmentation of molecules
and emission of atomic particles especially near the interaction site. In other words, less
fragmentation is generated in the crater region around the impact site [16]. When the surface
binding energy is overcome, a small amount of intact molecules are produced from the first layer
of the surface. The majority of ejected molecules are neutral and only around 1% of them are
charged.
These resultant ions that are freed from the surface are accelerated, separated, and analyzed in a
mass spectrometer. SIMS is widely used in two modes; static and dynamic. In static SIMS a low
energy primary ion beam is sputtered on the surface extremely slowly, and this is used for
analysis of atomic or molecular mono layers on the sample surface. Static SIMS is run with ion
beams such that less than 1% of the surface is sputtered – the so called static limit.
In contrast, in the dynamic SIMS mode, a higher energy primary ion beam is utilized to produce
a high yield of secondary ions. This technique has been well known for bulk analysis of
elements, depth profiling, and as the only approach that can provide truly quantitative
information [16] [21].
15
2.4.1.1Cluster Ion Sources
The overall concept of desorption of molecules by ion bombardment of a surface began around
30 years ago and was successfully utilized to detect organic molecules [22]. Although,
unfortunately, this earliest production of ToF-SIMS instruments did not work for organic
molecules analysis owing to low sensitivity, high molecular fragmentation [20] and too much
damage of the sample surface.
Many of the weaknesses of SIMS promise to be overcome with the advent of modern of primary
ion beam sources formed from molecular clusters such as C60, SF5, Bi3, Aun, Csn, and Ar4000
rather than single atomic particles [22]. Typically, the use of these polyatomic primary beams is
now leading to extensive development and change in direction of SIMS approaches, particularly
in the areas of bioanalysis.
Cluster sources offer several advantages over atomic ion sources, including a reduction in the
damage of the sample surface physically and chemically and also the enhancement of secondary
ion yields mainly for high-mass organic molecular ions. These advantages lead to a larger mass
detection range and a wider range of biomolecules that can be studied. In addition, the amount
of molecules detected per image pixel is increased resulting in brighter signals and better contrast
between neighboring pixels. This ultimately improves the sensitivity for chemical mapping of
samples like single cells. The bombardment pattern is significantly different when compared to
atomic ion sources owing to an energy distribution between all of individual atoms in the clusters
that gives rise to higher molecular ion sensitivity, this results partly from less fragmentation.
The ability of cluster ion sources to desorb secondary ions from the sample surface without too
much fragmentation makes it a more appropriate technique for the analysis of intact
biomolecules from tissue surfaces. For instance cluster SIMS has been used a lot recently in the
analysis of lipids from cells and tissue as a direct result of its ability to detect intact molecular
species particularly in two or three dimensions [16] [20] [22].
16
2.4.1.2 MeSIMS (matrix enhanced SIMS)
Standard SIMS essentially suffers from low sensitivity for higher mass molecules and high
fragmentation for smaller molecules. Recently some surface modification methods have been
developed to enhance sensitivity of larger molecules and the production of intact molecular ions.
One of them is MeSIMS in which a normal SIMS apparatus and a protocol for MALDI sample
preparation can be utilized in parallel. In fact, MeSIMS can be regarded as a combination of
MALDI and SIMS in which a thin layer of small molecule organic matrices are applied to the
surface sample in a similar way used for MALDI IMS. The main advantages of MeSIMS is that
it is easy to work with and inexpensive [8] [16].
In MeSIMS the coating of organic acid on tissue leading to incorporation of analyte into the
matrix layer results in enhancement the ionization efficiency of larger molecules such as proteins
as large as lysozyme at 14 kDa [6]. Besides a significant improvement of the maximum mass
range for SIMS, matrix enhancement also decreases the fragmentation of lower mass analytes
giving rise to increased sensitivity [16].
2.4.2 Applications of SIMS
SIMS as an imaging technique has numerous applications in biotechnology and biological
studies particularly in medicine and pathology fields. There have been some reports using this
technique successfully in imaging of unicellular organisms and single cells, chromosomes and
some tissues in organs like the kidney, brain, prostate, cockroach and snail tissue and also to
provide 3D imaging of tumors and oocytes [16].
17
2.5 Matrix Assisted Laser Desorption Ionization (MALDI)
MALDI is a powerful technique to study intact biomolecules such as proteins directly from
tissue sections. This is inherently a soft ionization technique using a laser combined with a
chemical matrix, usually an organic acid, to produce ions from an analyte sample mixed with the
matrix molecules [16].
2.5.1 Principles of MALDI
MALDI is a two-step process; in the first step a matrix is applied having a strong absorption of at
the wavelength of the ablation laser. Analyte molecules are embedded in the matrix. Application
of the laser causes ablation of upper layer of the matrix material and the analyte molecules with
it. The majority of the laser energy is absorbed by the matrix causing desorption of material with
analyte into the gas phase [10-11].
The MALDI matrix is also thought to result in ionization of molecules in the gas phase. There
have been some chemical and physical ionization mechanisms suggested for MALDI including
gas-phase photoionization, excited state proton transfer, ion-molecule reactions, desorption of
preformed ions. Among these mechanisms, ion formation from proton transfer in the solid phase
before desorption or gas-phase proton transfer from photoionized matrix molecules are the most
generally recognized mechanisms [10].
Typical MALDI spectra contain the singly charged compounds produced by protonation in the
positive ion mode. While deprotonated species are generally identified in the negative mode.
Furthermore some multiply charged ions and a lot of fragments are also detected.
In MALDI, the analyte is usually incorporated into the matrix crystals which results in a less
sensitive method to contaminants such as salts, buffers and detergents compared to other
ionization techniques.
A high concentration of contaminants such as buffer salts can affect negatively the desorption
and ionization steps. Generally prior purification is helpful to eliminate this sort of contamination
and subsequently to obtain higher quality mass spectra [16].

18
2.5.2 Choice of Matrix
Typically the matrix is a small organic acid which has a strong absorbance at wavelength of used
laser. In general, these compounds applied to tissue samples, play a major role in desorption and
ionization of analyte molecules. Hence, selecting the proper matrix is a critical step. Basically
the matrix crystals absorbing energy of laser light are evaporated leading to release of the
trapped analyte molecules into the gas phase [1] [8].
The matrix serves another fundamental function containing the ionization of analytes. The
ionized molecules, typically detected by MALDI-MS, are generally singly charged species
[M+H]+ [16].
However, the choice of a proper matrix does not follow any general rules. There are some
considerations such as solubility of matrix and analyte in solvents used in matrix solution, the
ability of the matrix in absorbance at the laser wavelength, the stability of matrix in vacuum
conditions, and also the chemical properties and mass range of analytes with a minimal overlap
between analyte and applied matrix.
Many different kinds of matrices are derived from benzoic acid, cinamic acid, and picolinic acid
are commonly used in MALDI. There are some matrices normally used in MALDI such as
alpha-cyano-4-hydroxycinnamic acid (CHCA) are routinely used and recommended for lower
molecular weight peptides whereas sinapic acid (SA) is more suitable for higher molecular
weight proteins. For phospholipids2, 5-dihydroxybenzoic acid (DHB) is usually used [8] [16].
2.5.2.1DHB (2, 5-Dihydroxybenzoic acid)
DHB, a derivative of benzoic acid with molar mass 154.12 g/mol and molecular formula
C7H6O4, is a well-known matrix used in MALDI. It absorbs laser energy at 337 and 355 nm
[23]. DHB is soluble in both water and organic solvents. In comparison to the other matrices,
DHB is less sensitive to contaminants, such as salts and/or detergents.
19
The main disadvantage of DHB is its large crystal size. Large crystals with varying geometries
cause spot to spot variation within the samples and result in the decrease of resolution
significantly [24].
DHB is frequently used for peptides, glycopeptides, nucleotides, glycoproteins and small
proteins [8]. This matrix has been also properly used for the negative ion MALDI-MS
glycolipids [23].
2.5.2.2 CHCA (α- cyano-4-hydroxycinnamic acid)
Alpha-cyano (α-cyanois) is a yellow powder and a derivative of cinnamic acid with molecular
formula C10H7NO3 and molar mass 189.17 g/mol. It is frequently used as a suitable matrix for
peptides particularly in low mass range for MALDI analysis. This matrix is insoluble in water
while it has very solubility in organic solvents [24].
The most important advantage of α-cyanois is its ability to produce small homogeneous crystals
leading to good resolution especially in measurement of peptides. Also, since this matrix is not
soluble in water, it can be used to wash samples on target. The main disadvantage of α-cyanois is
an extreme amount of fragmentation. Generally, α-cyano is commonly used for peptides, small
proteins, and glycopeptides [8] [24].
2.5.3 Applications of MALDI
MALDI provides mass data for lipids, peptides, proteins and metabolites directly from tissue
sections and is well known as a sufficiently developed technique to analyze biomolecules and
investigate tissue properties at the molecular level. Significantly, MALDI imaging is finding
more and more application in the life sciences. One such example is cancer classification and
diagnosis [25].

20
2.6 Mass Analyzers
In general, gas-phase ions that are produced are separated based on their masses, which must be
identified in any of the mass spectrometry techniques. Typically a mass analyzer has the ability
to measure mass to charge ratio (m/z). There are a great variety of mass analyzers available
which have been developed for IMS. There are some reasons leading to more focus on time-of-
flight (TOF) among other types of mass analyzers in this workflow. Firstly, the majority of IMS
studies are successfully carried out with TOF. Secondly, TOF mass analyzers are commonly
coupled with IMS techniques and ultimately a TOF mass analyzer provides parallel detection of
several species from each single pixel [6] [10] [16].
2.6.1 Time of Flight
The TOF mass analyzer separates accelerated ions according to their molecular mass and works
based on the fact that the velocities of two ions with different mass is different with lighter ions
having a higher speed arriving at the detector faster. Thus, ions reach the detector at times that
are inversely proportional to ratio of their mass to charge. According to equation 2.1 the kinetic
energy of an accelerated ion within an electrical field with potential V will be
= 2 Equation 2.1where z, m and v are charge, mass and velocity of the ion respectively.
Equation 2.2 demonstrates the velocity of the ion in which L is length of the flight path and t
shows the time.
= Equation 2.2Replacing the term v in equation 2.1 gives equation 2.3.
= 2 Equation 2.3
21
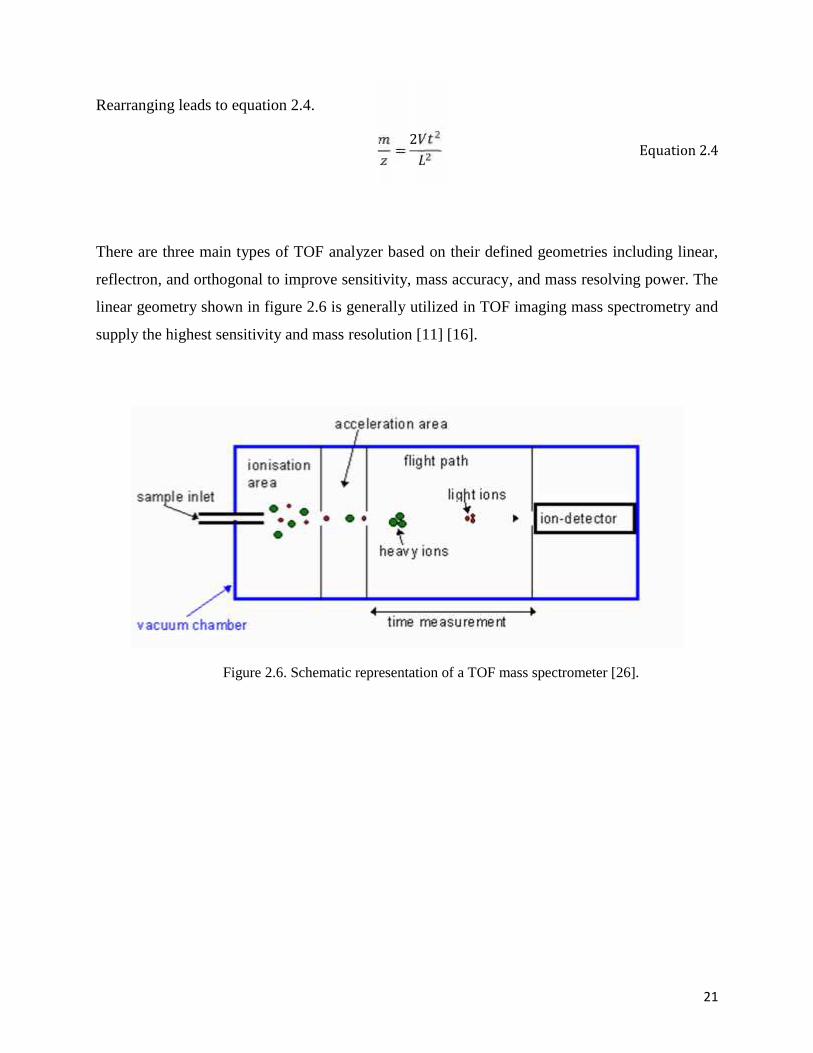
Rearranging leads to equation 2.4.
= 2 Equation 2.4There are three main types of TOF analyzer based on their defined geometries including linear,
reflectron, and orthogonal to improve sensitivity, mass accuracy, and mass resolving power. The
linear geometry shown in figure 2.6 is generally utilized in TOF imaging mass spectrometry and
supply the highest sensitivity and mass resolution [11] [16].
Figure 2.6. Schematic representation of a TOF mass spectrometer [26].
22
2.7 Sample Preparation
The sample preparation step plays a key role in order to obtain high quality, trust worthy, and
reproducible images [9]. A large variety of samples that remain stable under high vacuum
conditions can be used in IMS techniques. Samples that can be analyzed include pressed
powders, bulk films, fibers, particles, and thin films. In particular for SIMS analysis the
thickness and morphology of the sample can have effects on the possibility of producing
secondary ions and consequently the stability of the spectrum. The accuracy of the analysis is
negatively affected by contaminants deposited on the sample surface, thus cleanliness of sample
surface is important during sample preparation process.
Surface diffusion of analytes is another issue that is important. To prevent molecular
reorientation and surface contamination, analysis of samples must be started immediately after
preparation. Yet another important consideration in sample preparation is spatial integrity, which
is required to remain constant to obtain high spatial resolution during analysis. Experimentally,
spatial resolution is sacrificed due to any failure in spatial integrity larger than pixel size [1] [14].
The sample preparation protocol in the case of tissue sections consists of different steps
including preserving, sectioning, and washing the tissue and application of the matrix. However,
each step has a significant impact on the spectrum and image quality, thus this workflow is
typically focused on optimization of the protocol for the matrix application [7] [8] [27].
2.7.1 Deposition of Matrix
Deposition of matrix on the sample surface, which must be performed before MALDI and Me-
SIMS, is one of the crucial steps in sample preparation. There are some features that need to be
considered during matrix application including reproducibility of the process and homogeneity
of the matrix layer, which plays a key role in obtaining similarity in the extraction and desorption
of analytes. The matrix crystal size, which is another important parameter in deposition of
matrix, has to be equal to or smaller than the size of single pixel in order to obtain high-
resolution imaging.
23
For instance in MeSIMS small crystals lead to higher spatial resolution while crystals that are
larger (10 µm) and that cover a huge area of the tissue cause extraction of molecules from many
cells at the same time and reduction of spatial resolution. In addition, the size of crystals has
significant impact on the sensitivity of IMS detection. Typically, lower sensitivity for intact
bimolecules is achieved when the crystals are too small in MALDI. Hence, the desired crystal
size depends on the combination of several parameters such as the desorption and ionization
technique, required sensitivity, and spatial resolution.
The concentration of the matrix in solution is another important parameter and this needs to be
carefully measured, since concentration that is too low leads to diffusion of analyte from its
original position before crystallization and also proper crystals will not be formed owing to the
lack of enough organic acid. In contrast, a concentration of matrix that is too high causes rapid
formation of crystals and this reduces the time to extract and incorporate of analyte.
The thickness of the deposited matrix layer is another fundamental consideration since a matrix
thickness that is not optimal can give rise to unstable analyte signals and too much wetting
results in analyte migration. However, the desired thickness of matrix in the two methods of
MeSIMS and MALDI are different. In fact, Me-SIMS is a surface analysis method with the
primary ions impacting just several nanometers into the sample. Thus, in MeSIMS, an extremely
thin layer of any traditional MALDI matrix needs to be coated on sample surface. In MALDI, the
laser has a higher penetration depth and much more material is expelled [6] [8] [16].
Several strategies have been developed to apply matrix on tissue sections for SIMS and MALDI
in recent years. These methods, which are used based on the required spatial resolution of the
analysis, can be carried out either manually or automatically.
Manual procedures suffer from poor reproducibility, whereas automated devices provide better
reproducibility and control during the extraction process. This leads to the possibility for
comparison between different samples. In both cases a particular issue is the formation of
possible homogenous crystals trapping most of the analytes without any diffusion of molecules
[16] [28-29].
24
There are not any available commercial matrix deposition instruments for MeSIMS-based
sample preparation. However, an automated device named ImagePrep is commercially available
and is commonly used for MALDI sample preparation. This can be applied for deposition of
matrix in MeSIMS. In addition, a non-commercial and a solvent-free method, called sublimation,
can be used for matrix deposition in both MALDI and SIMS. Therefore between all of the
current strategies of matrix deposition, these have been used and the following sections provide
some of theoretical framework for ImagePrep and sublimation individually.
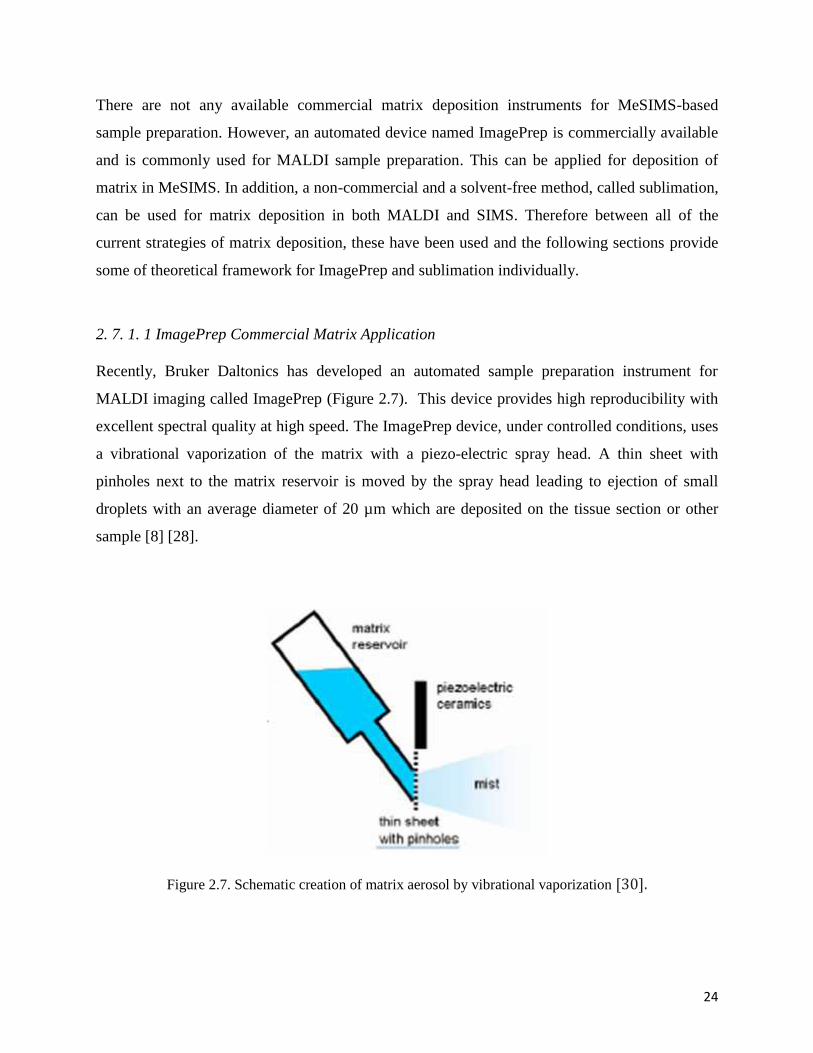
2. 7. 1. 1 ImagePrep Commercial Matrix Application
Recently, Bruker Daltonics has developed an automated sample preparation instrument for
MALDI imaging called ImagePrep (Figure 2.7). This device provides high reproducibility with
excellent spectral quality at high speed. The ImagePrep device, under controlled conditions, uses
a vibrational vaporization of the matrix with a piezo-electric spray head. A thin sheet with
pinholes next to the matrix reservoir is moved by the spray head leading to ejection of small
droplets with an average diameter of 20 µm which are deposited on the tissue section or other
sample [8] [28].
Figure 2.7. Schematic creation of matrix aerosol by vibrational vaporization [30].

25
The ImagePrep station has an optical sensor to monitor the scattered light from the matrix layer
deposited on the tissue section to control via direct feedback the deposition. This makes the
device fully automated and controls all the relevant preparation parameters including the matrix
thickness, incubation time, and wetness [28] [30].
The matrix thickness, incubation time and wetness affect the lateral resolution and chemical
homogeneity of the measurement and sample, respectively. The matrix thickness is determined
by the number of sprays and the spray intensity.
To achieve increased matrix thickness, multiple passes of matrix application are used, which
results in greater homogeneity of the coating, but over-coating can suppress analyte signal. The
incubation time is defined as the waiting time after each spray cycle. During this time the
sample is allowed to dry under a stream of nitrogen. More incubation time generates better
analyte incorporation into matrix crystals leading to more sensitivity but the time of matrix
application is increased.
The wetness parameter controls the residual wetness of the sample before starting of the next
spray cycle. For instance, more wetness gives rise to more covered analyte molecules, greater
homogeneity, and better spectra, whereas excessive wetness can cause more analyte migration
and delocalization. Therefore these parameters must be experimentally optimized to obtain a
desired resolution and quality of IMS analysis [16] [30].
2. 7. 1. 2 Matrix sublimation
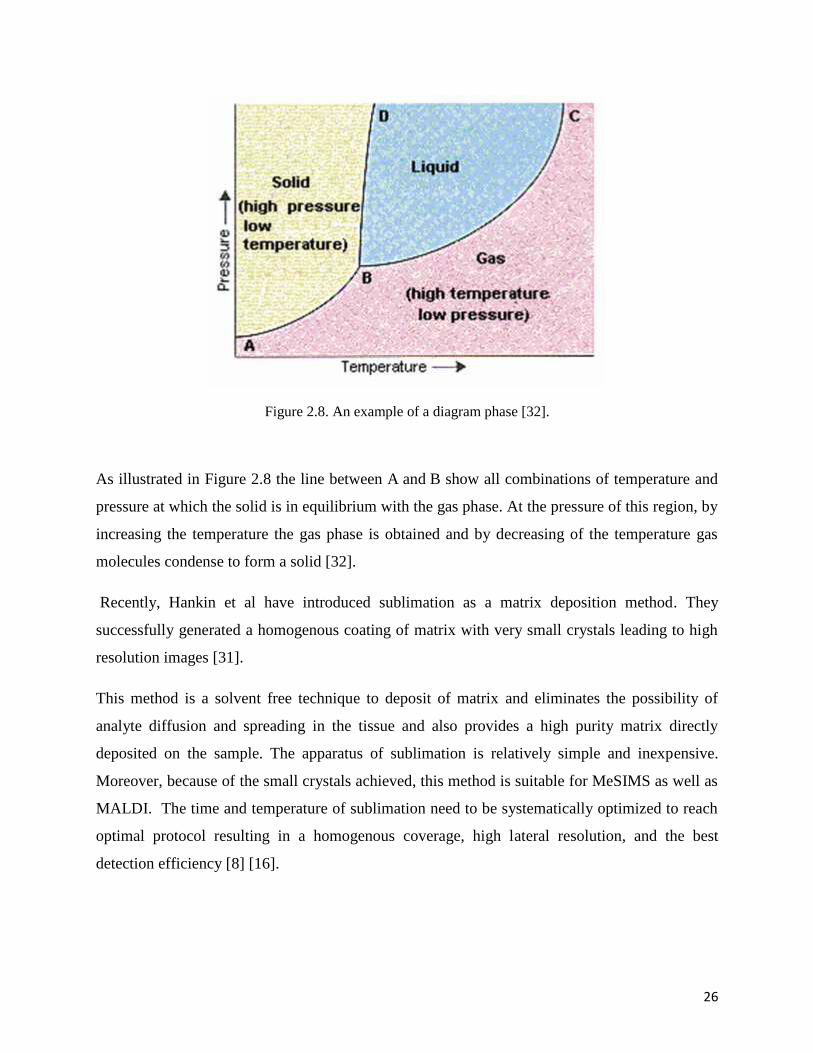
Sublimation is a physical phenomenon that refers to the direct transition of solid to the gas phase
without passing through an intermediate liquid phase. Essentially, sublimation is an endothermic
phase transition that occurs at temperatures and pressures below the triple point of a substance in
its phase diagram.
Figure 2.8 depicts a diagram phase showing the effect of temperature and pressure on a system.
The diagram with three different areas containing the solid, liquid, and gaseous phases of the
substance show what phases exist at any given temperature and pressure [31-32].
26
Figure 2.8. An example of a diagram phase [32].
As illustrated in Figure 2.8 the line between A and B show all combinations of temperature and
pressure at which the solid is in equilibrium with the gas phase. At the pressure of this region, by
increasing the temperature the gas phase is obtained and by decreasing of the temperature gas
molecules condense to form a solid [32].
Recently, Hankin et al have introduced sublimation as a matrix deposition method. They
successfully generated a homogenous coating of matrix with very small crystals leading to high
resolution images [31].
This method is a solvent free technique to deposit of matrix and eliminates the possibility of
analyte diffusion and spreading in the tissue and also provides a high purity matrix directly
deposited on the sample. The apparatus of sublimation is relatively simple and inexpensive.
Moreover, because of the small crystals achieved, this method is suitable for MeSIMS as well as
MALDI. The time and temperature of sublimation need to be systematically optimized to reach
optimal protocol resulting in a homogenous coverage, high lateral resolution, and the best
detection efficiency [8] [16].
27
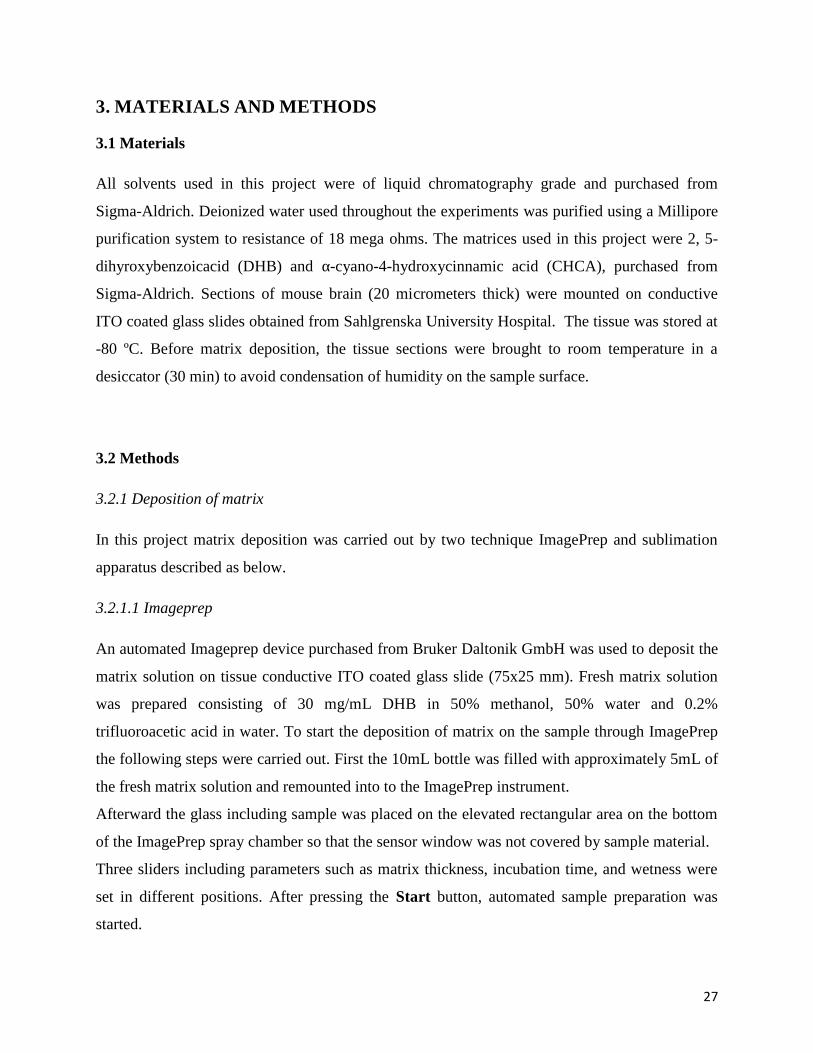
3. MATERIALS AND METHODS
3.1 Materials
All solvents used in this project were of liquid chromatography grade and purchased from
Sigma-Aldrich. Deionized water used throughout the experiments was purified using a Millipore
purification system to resistance of 18 mega ohms. The matrices used in this project were 2, 5-
dihyroxybenzoicacid (DHB) and α-cyano-4-hydroxycinnamic acid (CHCA), purchased from
Sigma-Aldrich. Sections of mouse brain (20 micrometers thick) were mounted on conductive
ITO coated glass slides obtained from Sahlgrenska University Hospital. The tissue was stored at
-80 ºC. Before matrix deposition, the tissue sections were brought to room temperature in a
desiccator (30 min) to avoid condensation of humidity on the sample surface.
3.2 Methods
3.2.1 Deposition of matrix
In this project matrix deposition was carried out by two technique ImagePrep and sublimation
apparatus described as below.
3.2.1.1 Imageprep
An automated Imageprep device purchased from Bruker Daltonik GmbH was used to deposit the
matrix solution on tissue conductive ITO coated glass slide (75x25 mm). Fresh matrix solution
was prepared consisting of 30 mg/mL DHB in 50% methanol, 50% water and 0.2%
trifluoroacetic acid in water. To start the deposition of matrix on the sample through ImagePrep
the following steps were carried out. First the 10mL bottle was filled with approximately 5mL of
the fresh matrix solution and remounted into to the ImagePrep instrument.
Afterward the glass including sample was placed on the elevated rectangular area on the bottom
of the ImagePrep spray chamber so that the sensor window was not covered by sample material.
Three sliders including parameters such as matrix thickness, incubation time, and wetness were
set in different positions. After pressing the Start button, automated sample preparation was
started.

28
3.2.1.2 Sublimation
The sublimation apparatus was purchased from Sigma Aldrich. The apparatus was coupled to a
pump to supply appropriate vacuum for sublimation and was placed on a sand bath heated by a
hot plate. The temperature was monitored by a digital thermometer. Sublimation was performed
by following these steps.
First, ITO coated glass slides including tissue used as a target for deposited matrix were cut to 2
mm dimensions to fit in the sublimation chamber and affixed to the condenser using double
sided tape. Then 300 mg of DHB powder was added to the bottom section of the apparatus. The
two pieces were attached together using O-ring seal.
Vacuum was applied by the pump connected to the apparatus and after 15 min at reduced
pressure, the condenser was filled with a flow of cold water (5 °C). After 5 additional min, heat
was applied to the base of sublimation chamber using a sand bath placed on the heating plate.
Figure 3.1 shows the sublimation device used in this project to apply matrix on tissue samples.
Figure 3.1. A photograph of the sublimation apparatus utilized in this project.
29
Sublimation of DHB was performed at 50, 75, 100, 125, 150 °C for a period from 1 to 15 min for
each temperature. The heat was then removed and the system which was still under vacuum was
allowed to slowly adjust to room temperature.
All above steps was carried out for sublimation of CHCA at 125, 150, 175 and 200 °C over the
period from 1 to 30 min for each temperature and 225 °C from 1 to 20 min. To obtain the
average amount of deposited DHB on per square centimeter, the slide was weighed before and
after DHB sublimation using the analytical balance. This procedure was repeated 3 times at each
time point, 10, 30 and 60 min at 125 °C.
3.2.2 Mass spectrometry imaging
Profiling and imaging MS of tissue sections were performed using the two methods of SIMS and
MALDI imaging in this project. The images shown in the Results and Discussion were obtained
in positive ion mode using an Ion-ToF 5 GmbH and Bruker UltrafleXtremeTM MALDI-TOF/TOF
spectrometer using FlexControl 3.3 software.

30
4. RESULTS AND DISCUSSION
The results obtained during this project are presented and discussed in this section of the thesis.
This includes results related to crystal size measured by microscopy and the thickness of
deposited matrix as carried out by the two methods of ImagePrep and sublimation. Ultimately, in
order to evaluate the proper thickness of deposited matrix on tissue, SIMS and MALDI imaging
data are depicted, investigated, and comprehensively discussed.
4.1 ImagePrep
4.1.1 Coverage of matrix (DHB) crystals on the sample surface
ImagePrep has typically been designed to work in two modes manually and automatically.
Deposition of the DHB solution was performed on the glass slides through both of these modes
to achieve the percentage of matrix coverage. Based on the procedure followed in this part of
project, a gradient from 10 to 60 cycles of DHB solution, which was sprayed in the manual mode
of the device, was obtained on one glass slide. To achieve this gradient, one part of the slide was
exposed to a specific spray cycle while the rest of slide was covered as shown in Figure 4.1.
Afterwards, to apply the DHB solution on another glass slide in the automatic mode of
ImagePrep, the first three parameters of matrix thickness, incubation time, and wetness were set
in the middle position and then the device was run in the automatic mode.
Figure 4.1. A scheme of the gradient of different sprayed cycle on one glass slide.

31
In order to obtain the percentage of DHB coverage, distribution, and size of the deposited matrix
crystals in both modes of ImagePrep, the matrix deposited slides were observed visualized
through the optical microscope (Figure 4.2). As shown in Figures 4.2 ImagePrep produces large
crystals that distribute unevenly on the sample surface.
Figure 4.2. Images of DHB crystals deposited on the glass surfaces obtained in the optical microscope.

32
The percentage of DHB coverage was obtained through the microscope pictures and equation 4.1
then plotted for each spray cycle as shown in Figure 4.3.
Crystal coverage(%) = # # x 100 Equation 4.1Figure 4.3 depicts clearly that the percentage of DHB coverage produced in both modes of
manual and automatic is very poor and roughly reaches 52% coverage.
Figure 4.3. Coverage of DHB crystals for different cycles of DHB solution which were sprayed in the twomodes - manually and automatically.

33
4.2 Sublimation
4.2.1 Optimization of time and temperature for sublimation of DHB
In order to find the proper temperature and time at which DHB is sublimated and coated on the
sample surface homogenously, sublimation of DHB was performed at 50, 75, 100, 125, 150 °C
over the period from 1 to 15 min for each temperature through the procedure described in the
method section. As shown in Table 4.1, DHB was not sublimed at 50 and 75 °C during the
period of times evaluated. Eventually DHB started to be sublimed at 125 °C after 4 min poorly
and after 4 min more a uniform coating layer of DHB increasing with time was formed on the
sample surface perfectly, which was simply distinguishable by eye as shown in Figure 4.4.
Temperature ⁰C 50 75 100 125 150Time (min)
123456789
101112131415
Table 4.1.Deposition of DHB at 50, 75, 100, 125, 150 °C from 1 to 15 min for each temperature.
No deposition
Poor deposition
Too much deposition
Perfect deposition
34
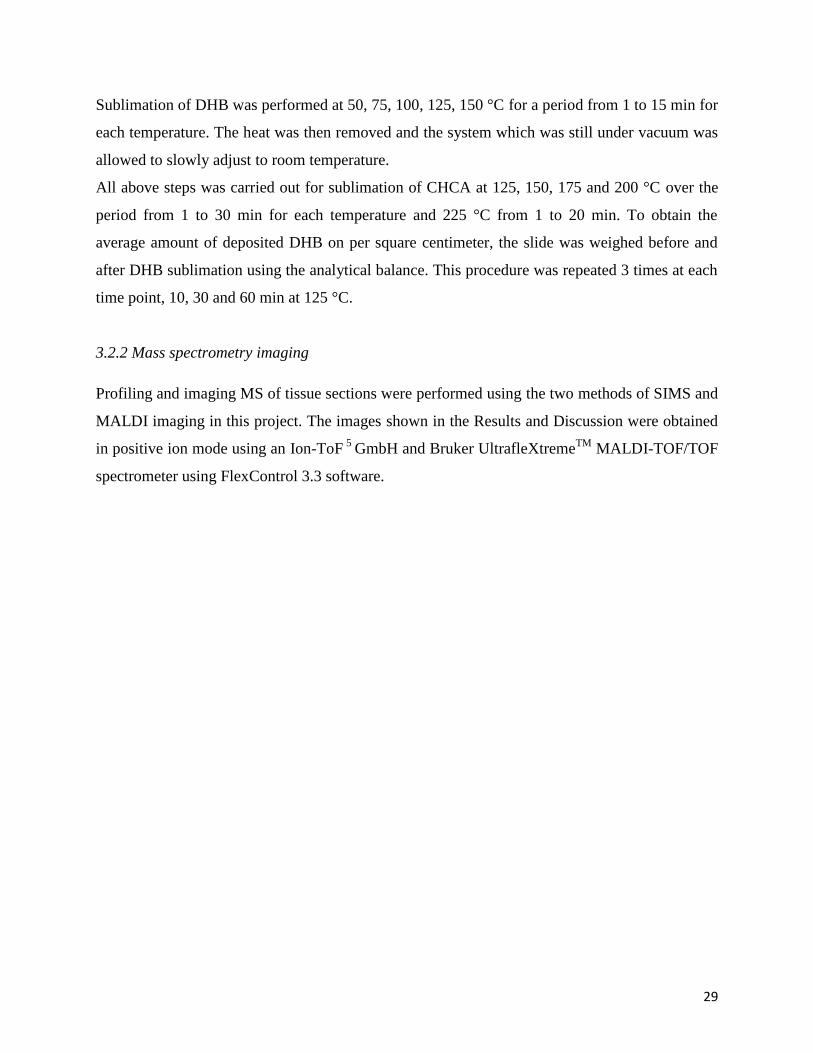
Figure 4.4.A uniform coating layer of DHB formed on the sample surface at 125 °C after 8 min.
As shown in Table 4.1, at 150 °C the layer of deposited DHB was too thick, and thus covered the
tissue densely but not very evenly. Therefore the proper temperature for sublimation of DHB
using the procedure carried out in this project appears to be 125 °C and the optimal time is 8
min.
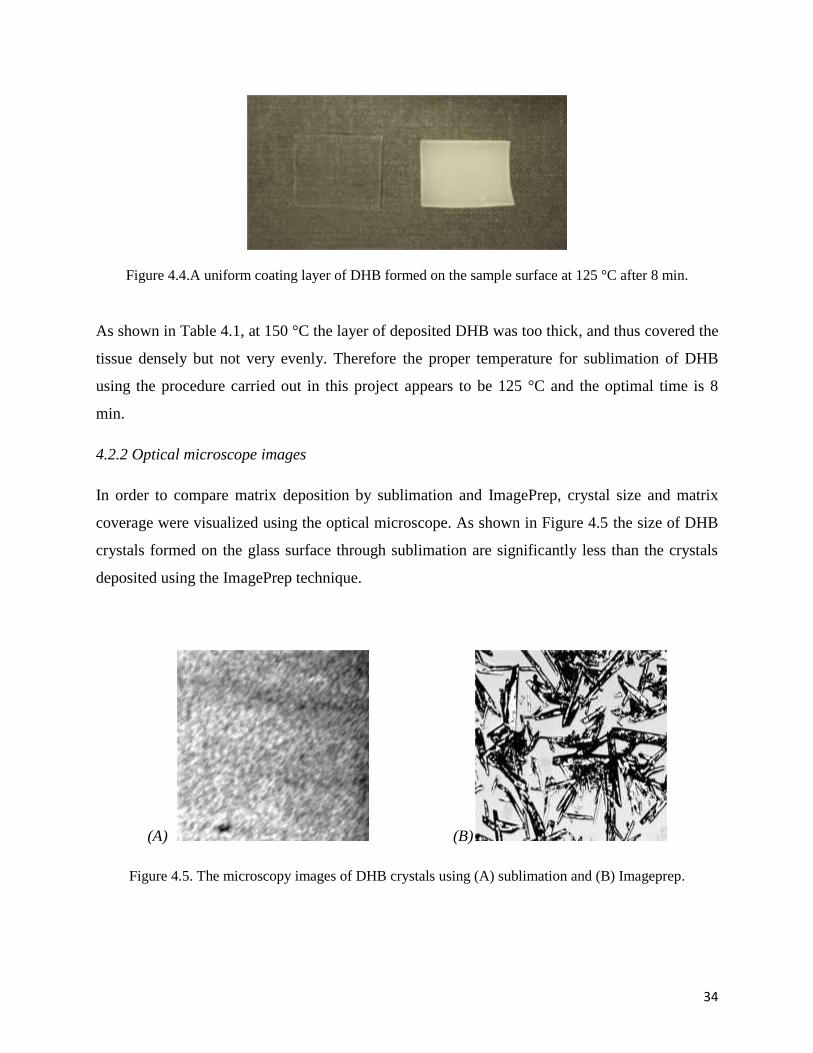
4.2.2 Optical microscope images
In order to compare matrix deposition by sublimation and ImagePrep, crystal size and matrix
coverage were visualized using the optical microscope. As shown in Figure 4.5 the size of DHB
crystals formed on the glass surface through sublimation are significantly less than the crystals
deposited using the ImagePrep technique.
(A) (B)
Figure 4.5. The microscopy images of DHB crystals using (A) sublimation and (B) Imageprep.
35
4.2.3 Optimization of time and temperature for sublimation of CHCA
Sublimation of CHCA was performed at 125, 150, 175 and 200 °C from 1 to 30 min and at 225
°C over the period from 1 to 20 min. Sublimation and deposition of CHCA did not occur at
temperatures of 125, 150, 175 and 200 °C even after 30 min.
Ultimately CHCA started to deposit on the target glass surface very poorly at 225°C and after 8
min. A thin and uneven layer of CHCA was coated on surface after 12 min and increased with
time, but not uniformly.
Sublimation of CHCA based on the procedure used in this project did not create a homogeneous
layer, whereas DHB was simply sublimated and deposited as an even layer on the glass surface.
Therefore DHB appears to be preferable as a matrix in this work.
4.3 Instrumental measurements
As explained in theoretical part, the thicknesses of deposited matrix required for the two
techniques of SIMS and MALDI are different. In order to achieve an appropriate thickness in
each one, sublimation of DHB was performed at 10, 30 and 60 min on tissue and repeated 3
times. To obtain the average amount of deposited DHB per square centimeter, the weight of each
slide with a tissue sample was measured before and after sublimation using the analytical
balance. The dimensions of the slides were obtained using a ruler to calculate surface area.
According to equation 4.2, the height of DHB deposited on each slide was obtained and then
listed in table 4.2.
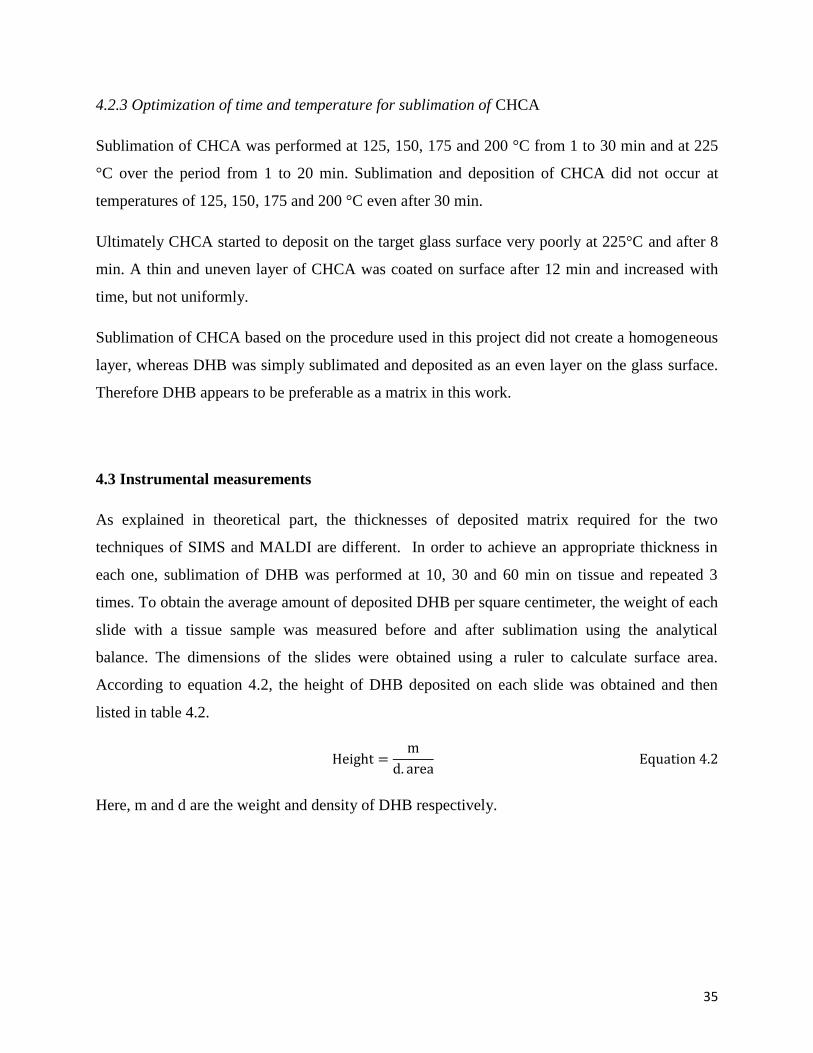
Height = md. area Equation 4.2Here, m and d are the weight and density of DHB respectively.

36
Table 4.2. The thickness of deposited DHB after 10, 30 and 60 min deposition time.
Figure 4.6 shows the data from Table 4.2 as a plot of the height of deposited DHB on glass
versus of time. As expected, the thickness of the deposited layer increases with time of
deposition. In addition, the small standard deviation achieved in this experiment indicates
reproducibility of the deposition.
Figure 4.6. Height of deposited DHB on glass versus time of deposition.
Height of deposited DHB on glass surface (um)
Timeof deposition(min)
run 1 run 2 run 3 average Std. dev.
10 1,197 1,50 1,857 1,52 0,33
30 11,54 11,28 10,06 10,96 0,79
60 24,44 24,82 22,68 23,98 1,14
37
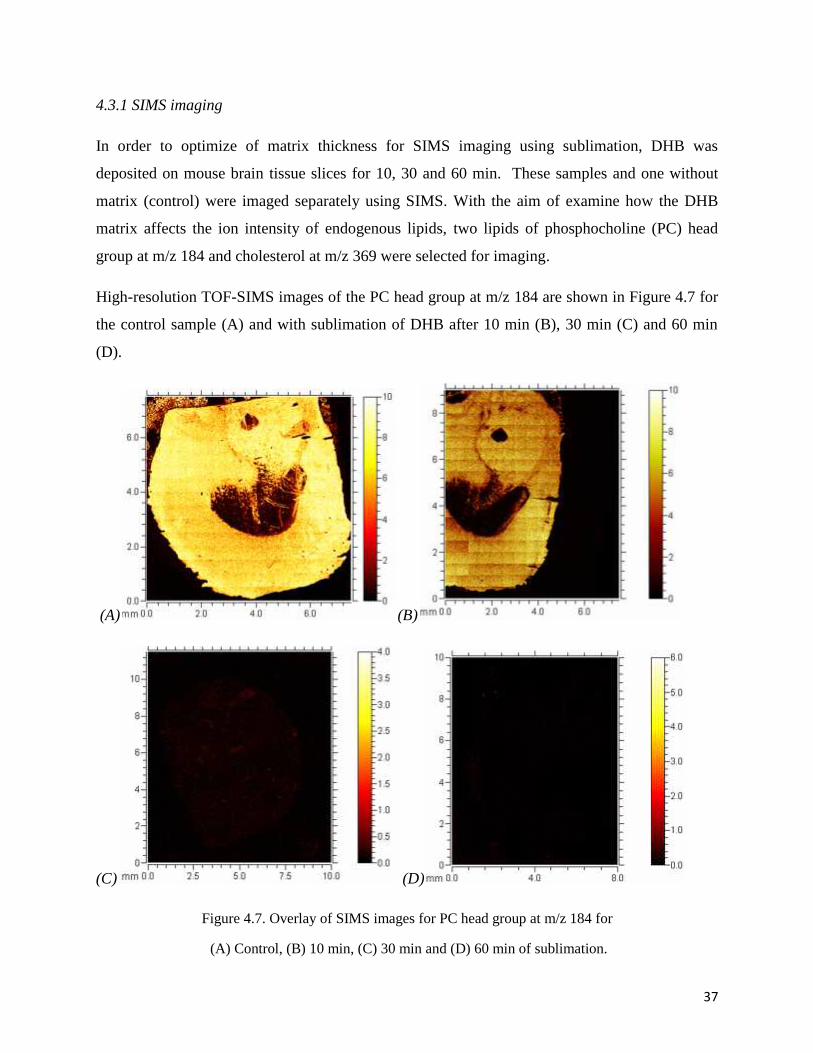
4.3.1 SIMS imaging
In order to optimize of matrix thickness for SIMS imaging using sublimation, DHB was
deposited on mouse brain tissue slices for 10, 30 and 60 min. These samples and one without
matrix (control) were imaged separately using SIMS. With the aim of examine how the DHB
matrix affects the ion intensity of endogenous lipids, two lipids of phosphocholine (PC) head
group at m/z 184 and cholesterol at m/z 369 were selected for imaging.
High-resolution TOF-SIMS images of the PC head group at m/z 184 are shown in Figure 4.7 for
the control sample (A) and with sublimation of DHB after 10 min (B), 30 min (C) and 60 min
(D).
(A) (B)
(C) (D)
Figure 4.7. Overlay of SIMS images for PC head group at m/z 184 for
(A) Control, (B) 10 min, (C) 30 min and (D) 60 min of sublimation.

38
As shown in the overlaid images, it is clear that increasing the time of matrix deposition
diminished the intensity of the PC ion fragment image.
With regard to images in Figure 4.7, the scanned areas of SIMS measurement are not the same
for different sublimation times which can affect on ion intensity. In order to have a more
accurate comparison in peak area and intensity, the same size of area (1.1 x 1.1 mm2) in both
gray and white matter of each brain tissue slice were selected and imaged as shown in Appendix.
The integrated peak areas of the PC fragment obtained from mentioned regions were plotted
versus different sublimation times as illustrated in Figure 4.8.
Figure 4.8. Log peak areas of phosphocholine with m/z 184 for different time of sublimation in gray-
(blue bars) and white (red bars) matters of brain tissue slices (number of trails=1).
As shown in Figure 4.8, the peak areas of the PC fragment in both gray and white matters
decreases with increasing matrix thickness.
0
1
2
3
4
5
6
0 10 30 60
Log
peak
are
a
Time of sublimation (min)
Gray matter
White matter

39
Cholesterol with m/z of 369 was probed as another fragment to see the effect of sublimation time
on ionization in SIMS imaging. SIMS images of the cholesterol fragments are shown in Figure
4.9 without deposition of DHB as a control sample (A) and with sublimation of DHB after 10
min (B), 30 min (C) and 60 min (D).
(A) (B)
(C) (D)
Figure 4.9. SIMS images of cholesterol (A) control, (B) 10 min, (C) 30 min and (D) 60 min sublimation.
It is clear in the TOF-SIMS images shown in Figure 4.9 that increasing the sublimation time leads to a
significant decline of intensity for cholesterol ions.

40
The integrated peak areas of the cholesterol fragment acquired from SIMS measurements of the
same size regions (1.1 x 1.1 mm2) in both gray and white matter of each brain tissue slice were
plotted versus different sublimation times as illustrated in Figure 4.10.
Figure 4.10. Log peak areas of cholesterol fragment with m/z 369 for different sublimation times in gray -
(blue bars) and white (red bars) matters of brain tissue slices (number of trails=1).
As shown in Figure 4.10 clearly, increasing the time of sublimation decreases the ionization
observed for this fragment in both gray and white matters.
In conclusion, for both the PC and cholesterol fragments the matrix enhancement effects are not
observed at the different deposition times for sublimation of DHB. This can be explained by the
fact that SIMS is highly surface sensitive and can only probe a few nanometers in to the sample
surface. Thus, thicknesses obtained from 30 and 60 min sublimation times as illustrated in Table
4.2 are too thick for SIMS detection and the analyte is buried under the matrix.
0
1
2
3
4
5
6
0 10 30 60
Log
peak
are
a
Time of sublimation (min)
Gray matter
White matter

41
Since none of times 10, 30 and 60 min could generate a proper thickness of deposited DHB for
SIMS imaging, times of 5, 15 and 20 min should be performed to obtain an optimized time.
In order to see the effect of time on ionization of the matrix itself, distribution of the detected
DHB ions at m/z 154 was imaged by SIMS imaging and illustrated in Figure 4.11 after 10 min
(A), 30 min (B) and 60 min (C) deposition time.
(A) (B)
(C)
Figure 4.11. SIMS images of DHB after (A) 10 min, (B) 30 min and (C) 60 min sublimation.

42
Surprisingly, as depicted in Figure 4.11, the intensity of DHB ions significantly diminishes by
increasing of the deposition time.
Furthermore, the logarithm peak areas obtained from SIMS measurements of the same size
regions (1.1 x 1.1 mm2) in both matters of gray and white for DHB at m/z 154 were measured
and these are shown in Figure 4.12.
Figure 4.12.Log peak areas of DHB with m/z 154 for different times of sublimation in gray (blue bars)
and white (red bars) matters of brain tissue slices (number of trails=1).
As demonstrated in Figure 4.12, ionization of DHB decreases with increasing amounts of
deposited DHB. This can be explained by charging effects in which the matrix acts as an
insulating layer resulting in significant decrease in the ionization yield.
0
1
2
3
4
5
6
10 30 60
Log
peak
are
a
Time of sublimation (min)
Gray matter
White matter
43
4.3.2 MALDI imaging
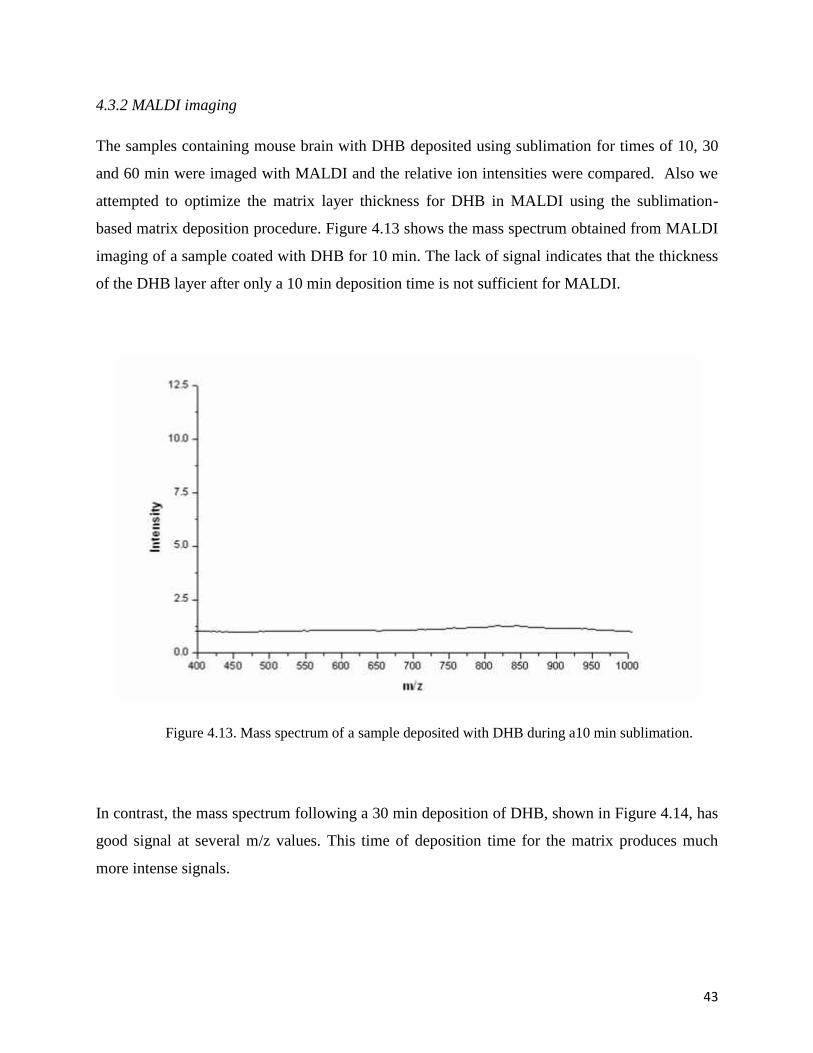
The samples containing mouse brain with DHB deposited using sublimation for times of 10, 30
and 60 min were imaged with MALDI and the relative ion intensities were compared. Also we
attempted to optimize the matrix layer thickness for DHB in MALDI using the sublimation-
based matrix deposition procedure. Figure 4.13 shows the mass spectrum obtained from MALDI
imaging of a sample coated with DHB for 10 min. The lack of signal indicates that the thickness
of the DHB layer after only a 10 min deposition time is not sufficient for MALDI.
Figure 4.13. Mass spectrum of a sample deposited with DHB during a10 min sublimation.
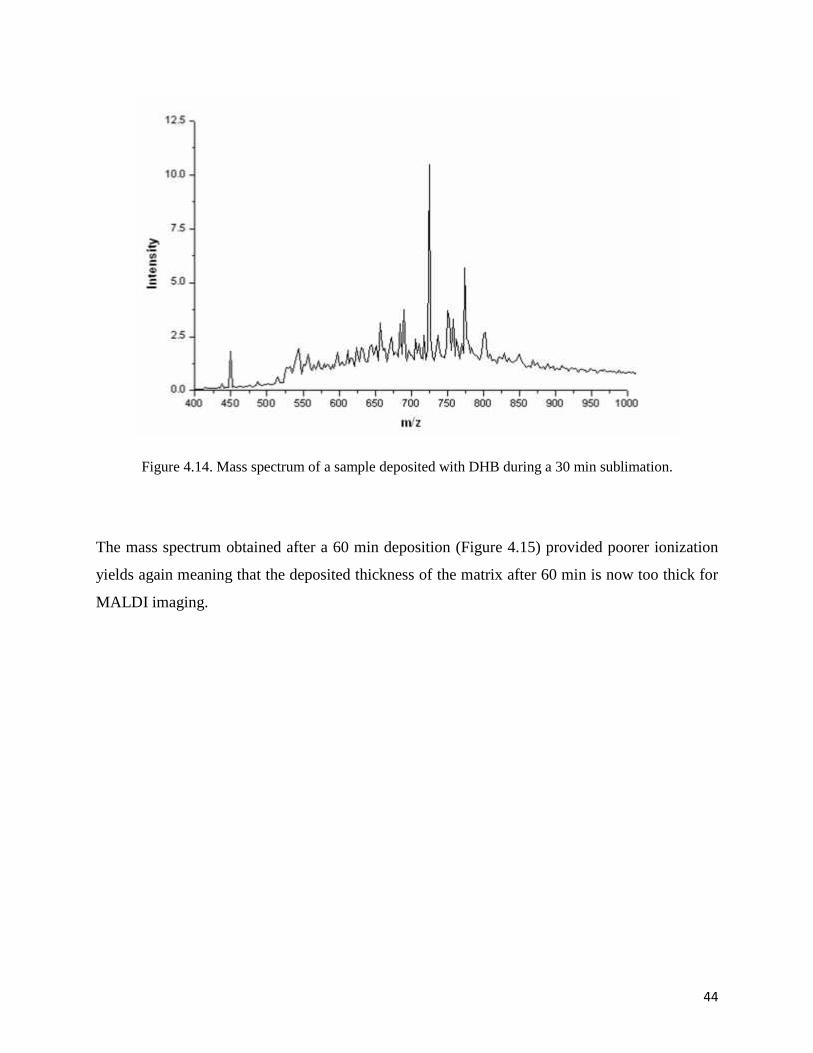
In contrast, the mass spectrum following a 30 min deposition of DHB, shown in Figure 4.14, has
good signal at several m/z values. This time of deposition time for the matrix produces much
more intense signals.
44
Figure 4.14. Mass spectrum of a sample deposited with DHB during a 30 min sublimation.
The mass spectrum obtained after a 60 min deposition (Figure 4.15) provided poorer ionization
yields again meaning that the deposited thickness of the matrix after 60 min is now too thick for
MALDI imaging.

45
Figure 4.15. Mass spectrum of a sample deposited with DHB during a 60 min sublimation.
Looking at Figure 4.14, the main peak obtained from 30 min deposition is related to an ion with
m/z 723.5. This matches phosphocholine ([M+H]+ = m/z 760.5) plus sodium (Na+ = 23 Da)
minus tri-methyl-amine (TMA=59 Da). The structure of POPC shown in Figure 4.16 is a major
glycerophosphocoline lipid component in tissue and this peak is commonly observed in IMS
measurements of the mouse brain [16]. This fragment with m/z 723.5 was observed in each
MALDI image for each time of sublimation as shown in figures from 4.17 to 4.19.
Figure 4.16. The structure of POPC (16:0/18:1) [from Wikipedia].
46
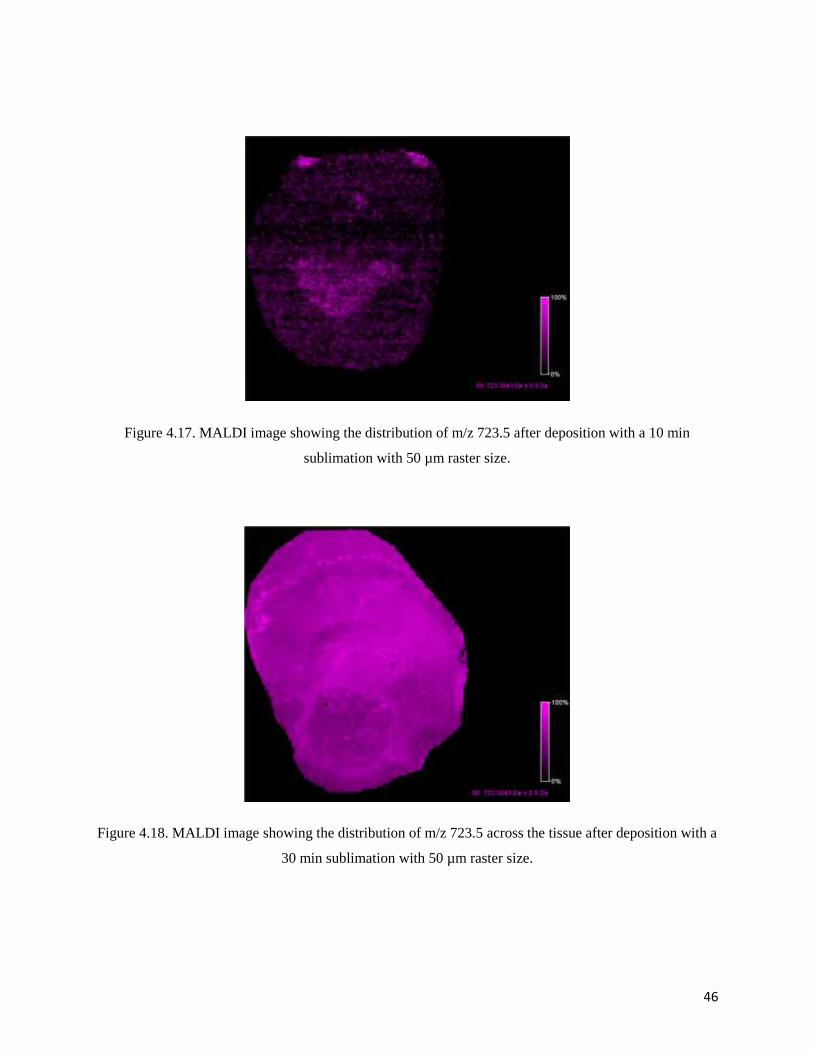
Figure 4.17. MALDI image showing the distribution of m/z 723.5 after deposition with a 10 min
sublimation with 50 µm raster size.
Figure 4.18. MALDI image showing the distribution of m/z 723.5 across the tissue after deposition with a
30 min sublimation with 50 µm raster size.
47
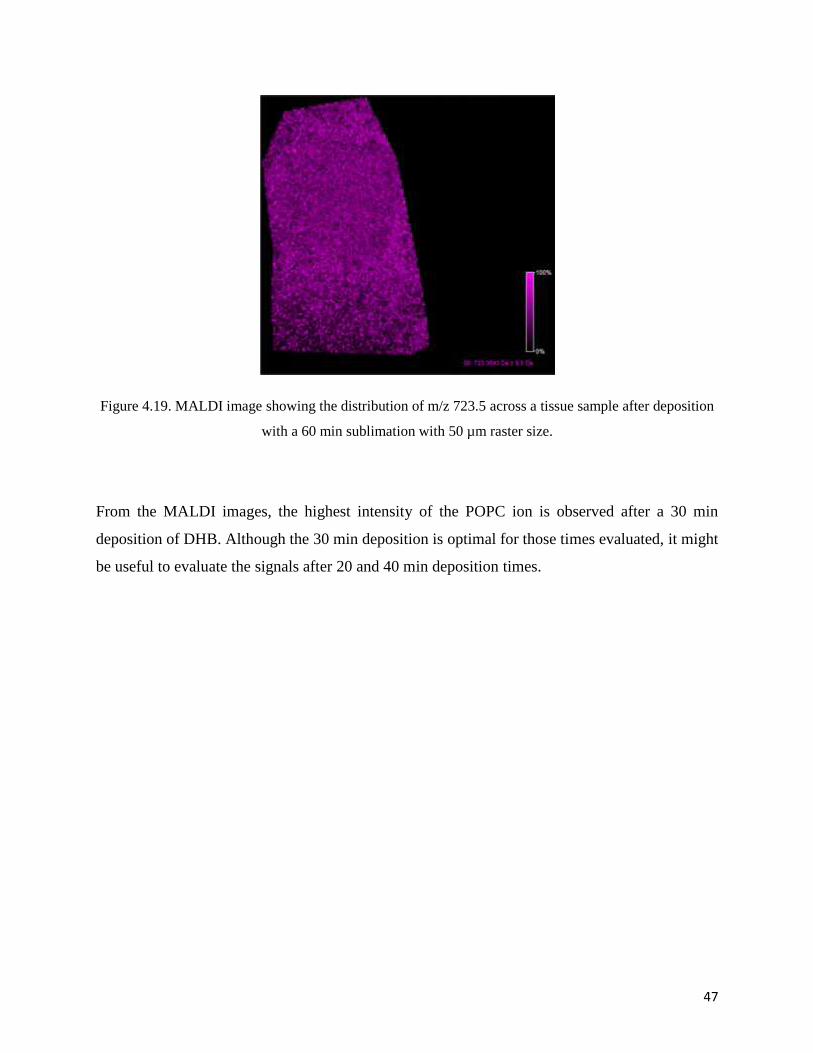
Figure 4.19. MALDI image showing the distribution of m/z 723.5 across a tissue sample after deposition
with a 60 min sublimation with 50 µm raster size.
From the MALDI images, the highest intensity of the POPC ion is observed after a 30 min
deposition of DHB. Although the 30 min deposition is optimal for those times evaluated, it might
be useful to evaluate the signals after 20 and 40 min deposition times.
48
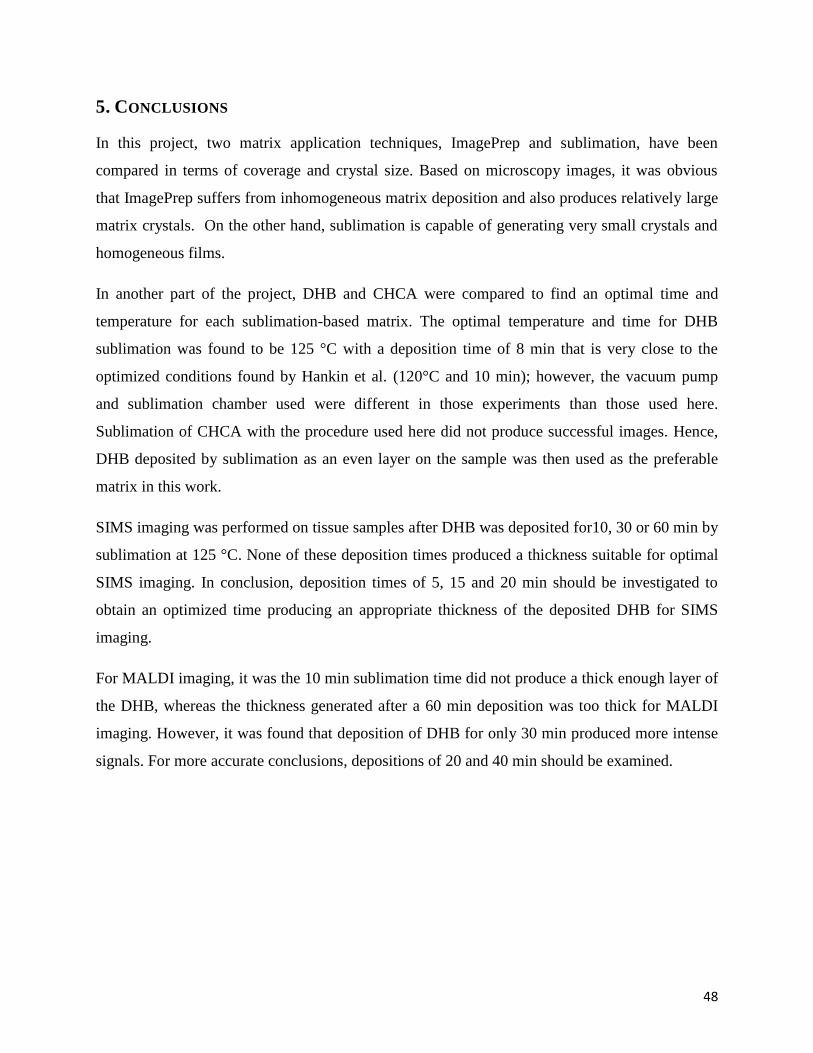
5. CONCLUSIONS
In this project, two matrix application techniques, ImagePrep and sublimation, have been
compared in terms of coverage and crystal size. Based on microscopy images, it was obvious
that ImagePrep suffers from inhomogeneous matrix deposition and also produces relatively large
matrix crystals. On the other hand, sublimation is capable of generating very small crystals and
homogeneous films.
In another part of the project, DHB and CHCA were compared to find an optimal time and
temperature for each sublimation-based matrix. The optimal temperature and time for DHB
sublimation was found to be 125 °C with a deposition time of 8 min that is very close to the
optimized conditions found by Hankin et al. (120°C and 10 min); however, the vacuum pump
and sublimation chamber used were different in those experiments than those used here.
Sublimation of CHCA with the procedure used here did not produce successful images. Hence,
DHB deposited by sublimation as an even layer on the sample was then used as the preferable
matrix in this work.
SIMS imaging was performed on tissue samples after DHB was deposited for10, 30 or 60 min by
sublimation at 125 °C. None of these deposition times produced a thickness suitable for optimal
SIMS imaging. In conclusion, deposition times of 5, 15 and 20 min should be investigated to
obtain an optimized time producing an appropriate thickness of the deposited DHB for SIMS
imaging.
For MALDI imaging, it was the 10 min sublimation time did not produce a thick enough layer of
the DHB, whereas the thickness generated after a 60 min deposition was too thick for MALDI
imaging. However, it was found that deposition of DHB for only 30 min produced more intense
signals. For more accurate conclusions, depositions of 20 and 40 min should be examined.

49
6. REFRENCES
[1] L.A. McDonnell, R.M.A. Heeren, Imaging mass spectrometry, Mass spectrom. Rev. 2007,
26,606-643.
[2] S. Guenther, A. Römpp, W. Kummer, B. Spengler, AP-MALDI imaging of neuropeptides in
mouse pituitary gland with 5 µm spatial resolution and high mass accuracy, Mass Spectrom.
2011, 305, 228-237.
[3] M.A.F. Altelaar, I.M. Taban, L.A. McDonnell, P.D.E.M. Verhaert, et all., High-resolution
MALDI imaging mass spectrometry allows localization of peptide distributions at cellular length
scales in pituitary tissue section, Mass Spectrom. 2007, 260, 203-211.
[4] S.S. Rubakhin, J.E.B. Monroe, J.V. Sweedler, Imaging mass spectrometry: fundamentals and
applications to drug discovery, DDT. 2005, 10, 823-837.
[5] S. Khatib-Shahidi, M. Andersson, J.L. Herman, T.A. Gillespie, R.M. Caprioli, Direct
molecular analysis of whole-body animal tissue sections by imaging MALDI mass spectrometry,
Anal Chem. 2006, 78, 6448-6456.
[6] T. A. Zimmerman, E. B. Monroe, K. R. Tucker, S.S. Rubakhin, J.V. Sweedler, Imaging of
cells and tissues with mass spectrometry: Adding Chemical information to imaging, Methods in
Cell Biol. 2008, 89, 361-390.
[7] J. Yang, R. M. Caprioli, Matrix sublimation recrystallization for imaging proteins by mass
spectrometry at high spatial resolution, Anal. Chem. 2011, 83, 5728-5734.
[8] B. K. Kaletas et al. Sample preparation issues for tissue imaging by imaging MS, Proteomics.
2009, 9, 2622-2633.
[9] R.B. Chen, L.M. Hui, R.M. Sturm, L.J. Li, Three dimensional mapping of neuropeptides and
lipids in crustacean brain by mass spectral imaging, the American Society for mass spec. 2009,
20(6), 1068-1077.
[10] E. Hoffmann, V. Stroobant, Mass spectrometry, Brussels, Belgium
50
[11] G. M. Lampman, D. L. Pavia, J. R. Vyvyan, Spectroscopy, Bellingham, Washington
[12] M. Stoeckli, P. Chaurand, D. E. Hallahan, R. M. Caprioli, Imaging mass spectrometry: A
new technology for the analysis of protein expression in mammalian tissues, Nature medicine.
2001, 7(4), 493-496.
[13] T. Greer, R. Sturm, L. Li, Mass spectrometry imaging for drugs and metabolites,
Proteomics. 2011, 74 (12), 2617-2631.
[14] A. M. Belu, D. J. Graham, D. G. Castner, Time-of- flight secondary ion mass spectrometry:
techniques and applications for the characterization of biomaterial surfaces, Biomaterials. 2003,
24, 3635-3653.
[15] http://www3.imperial.ac.uk/materials/facilities/surfaceanalysis/simstechnique.
[16]K.Chughtai, R.M. A. Heeren, Mass spectrometric imaging for biomedical tissue analysis,
Chem Rev. 2010, 110 (5), 3237-3277.
[17] http://www.rsc.org/Publishing/Journals/AN/article.asp.
[18] R. J. Goodween, S. R. Pennington, A. R. Pitt, Protein and peptides in pictures: Imaging with
MALDI mass spectrometry, Proteomics. 2008, 8 (18), 3785-3800.
[19] L. MacAleese, J. Stauber, R. M. Heeren, Perspectives for imaging mass spectrometry in the
proteomics landscape, Proteomics. 2009, 9 (4), 819-834.
[20] M. K. Passarelli, N. Winograd, Lipid imaging time-of-flight secondary ion mass
spectrometry (Tof-SIMS), BiochimicaetBiophysicaActa. 2011, 1811, 976-990.
[21] http://pprco.tripod.com/SIMS/Theory.htm.
[22] N. Winograd, The magic of cluster SIMS, Analytical Chemistry, 2005, 143-148.
[23] http://www.proteochem.com/dhb25mg-p-78.html.
[24] http://www.sdstate.edu/chem/mass-spec/tutorials/upload/Maldi-Sample-Preparation.pdf.
51
[25] J. O. R. Gustafsson, M. K. Oehler, A. Ruszkiewicz, S. R. McColl, P. Hoffmann, MALDI
Imaging Mass Spectrometry (MALDI-IMS)-Application of Spatial Proteomics for Ovarian
Cancer Classification and Diagnosis, Molecular Sciences. 2011, 12, 773-794.
[26] http://alevelnotes.com/Mass-Spectrometry/124.
[27] J. Hanrieder, A. Ljungdahl, M. Andersson, MALDI imaging mass spectrometry of
neuropeptides in Parkinson’s disease, J Visualized Experiments. 2012, 60, 1-7.
[28] A. Walch, S. Rauser, S. O. Deininger, H. Höxer, MALDI imaging mass spectrometry for
direct tissue analysis: a new frontier for molecular histology, Histochem Cell Biol. 2008.
[29] S. Kaspar, M. Peukert, A. Svatos, A. Matros, H. P. Mock, MALDI-imaging mass
spectrometry – An emerging technique Q1 in plant biology, 2011, 11, 1-11.
[30] ImagePrep user manual, BrukerDaltonic, Revision 3, 2010.
[31] J. A. Hankin, R. M. Barkley, R. C. Murphy, Sublimation as a method of matrix application
for mass spectrometric imaging, J Am Soc Mass Spectrom. 2007, 18 (9), 1646-1652.
[32] http://chemed.chem.purdue.edu/genchem/topicreview/bp/ch14/phase.php.

52
7. ACKNOWLEDGEMENT
First and foremost, I would like to express my sincere gratitude to my supervisor and examiner
Prof. Andrew Ewing for giving me a great opportunity to do my master thesis in his
professional research group and for all his continuous supports, helps and kindnesses.
I would also like to thank Dr. Melissa Passarelli for showing me the direction along my way
and for all her guidance, help and feedbacks to this project.
Finally thanks to all people at department of Bioanalytical Imaging, Sensors, and Cells Groups
for making a great scientific and friendly atmosphere.
53
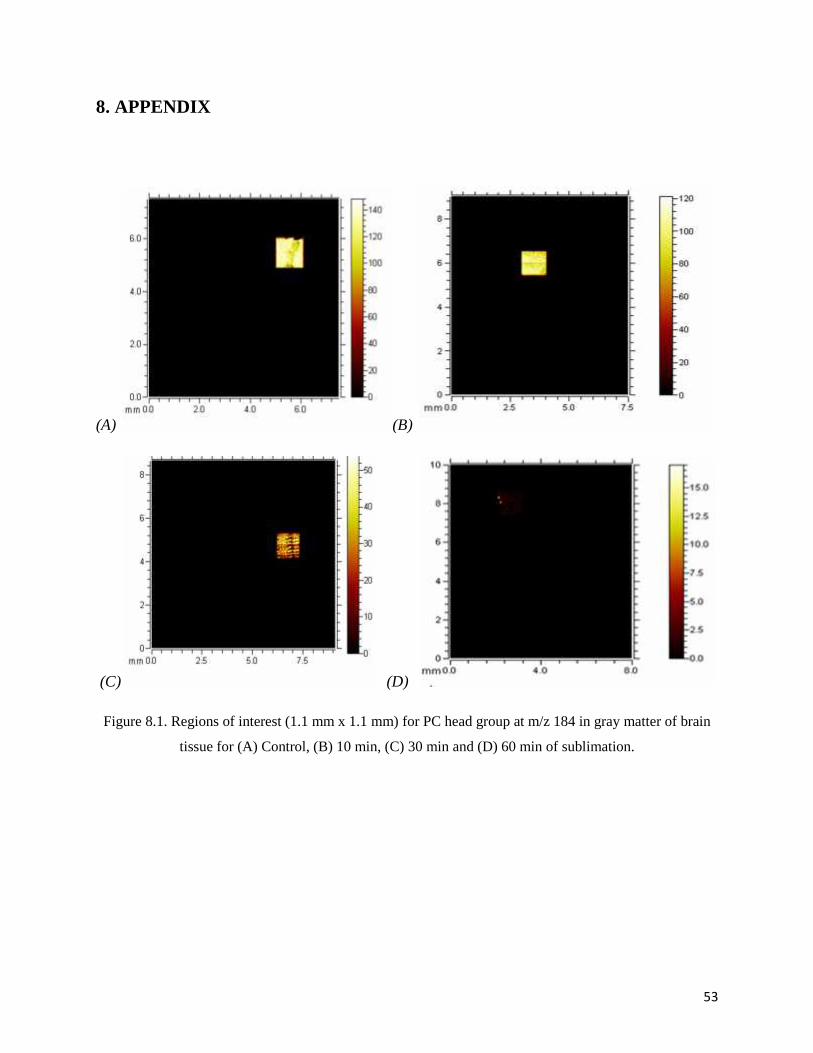
8. APPENDIX
(A) (B)
(C) (D)
Figure 8.1. Regions of interest (1.1 mm x 1.1 mm) for PC head group at m/z 184 in gray matter of brain
tissue for (A) Control, (B) 10 min, (C) 30 min and (D) 60 min of sublimation.
54
(A) (B)
(C) (D)
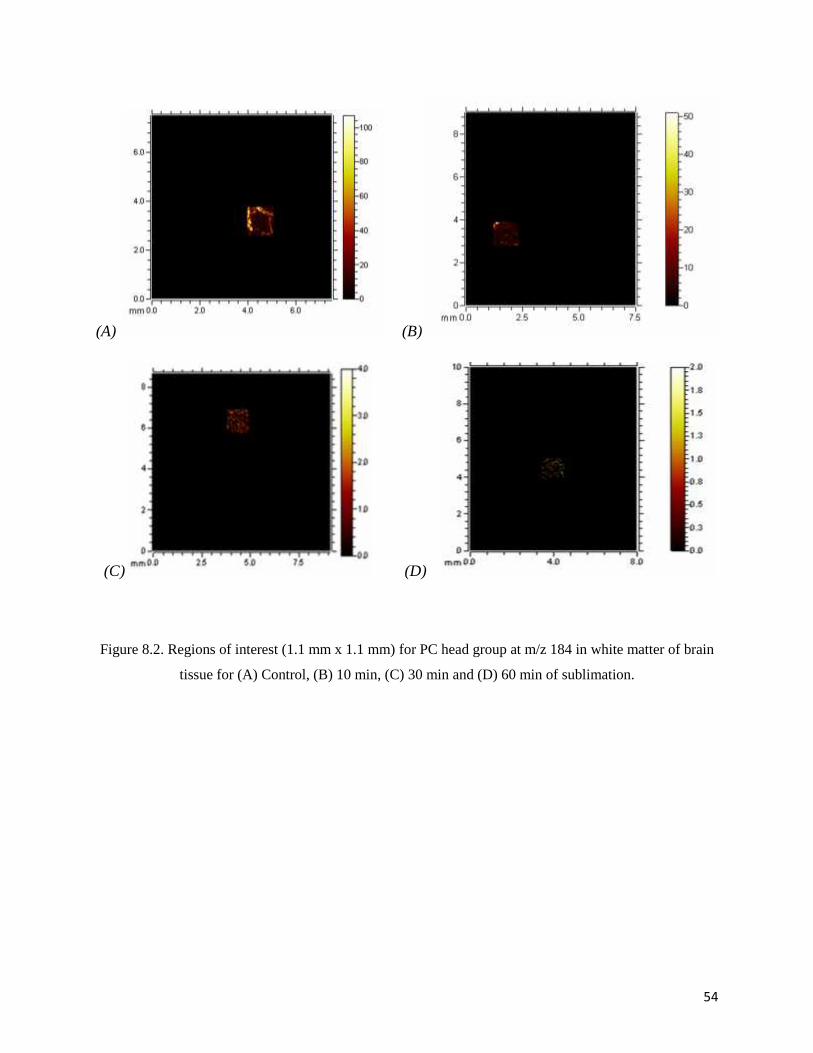
Figure 8.2. Regions of interest (1.1 mm x 1.1 mm) for PC head group at m/z 184 in white matter of brain
tissue for (A) Control, (B) 10 min, (C) 30 min and (D) 60 min of sublimation.
55
(A) (B)
(C) (D)
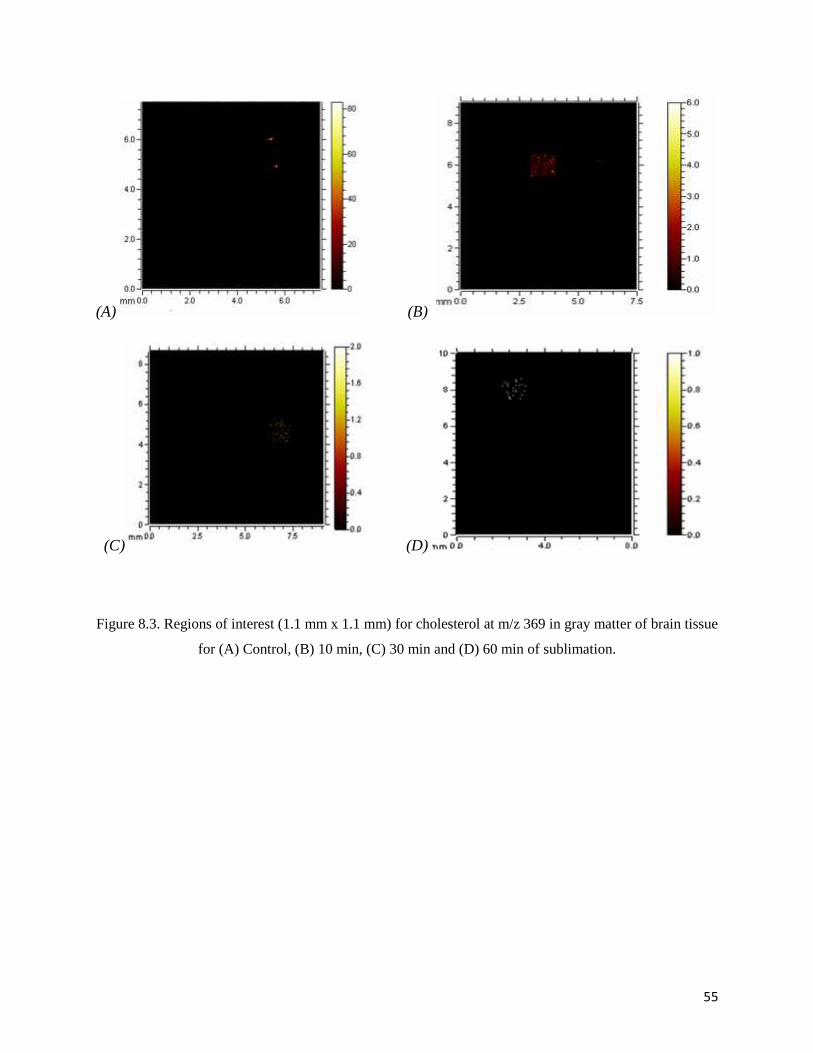
Figure 8.3. Regions of interest (1.1 mm x 1.1 mm) for cholesterol at m/z 369 in gray matter of brain tissue
for (A) Control, (B) 10 min, (C) 30 min and (D) 60 min of sublimation.
56
(A) (B)
(C) (D)
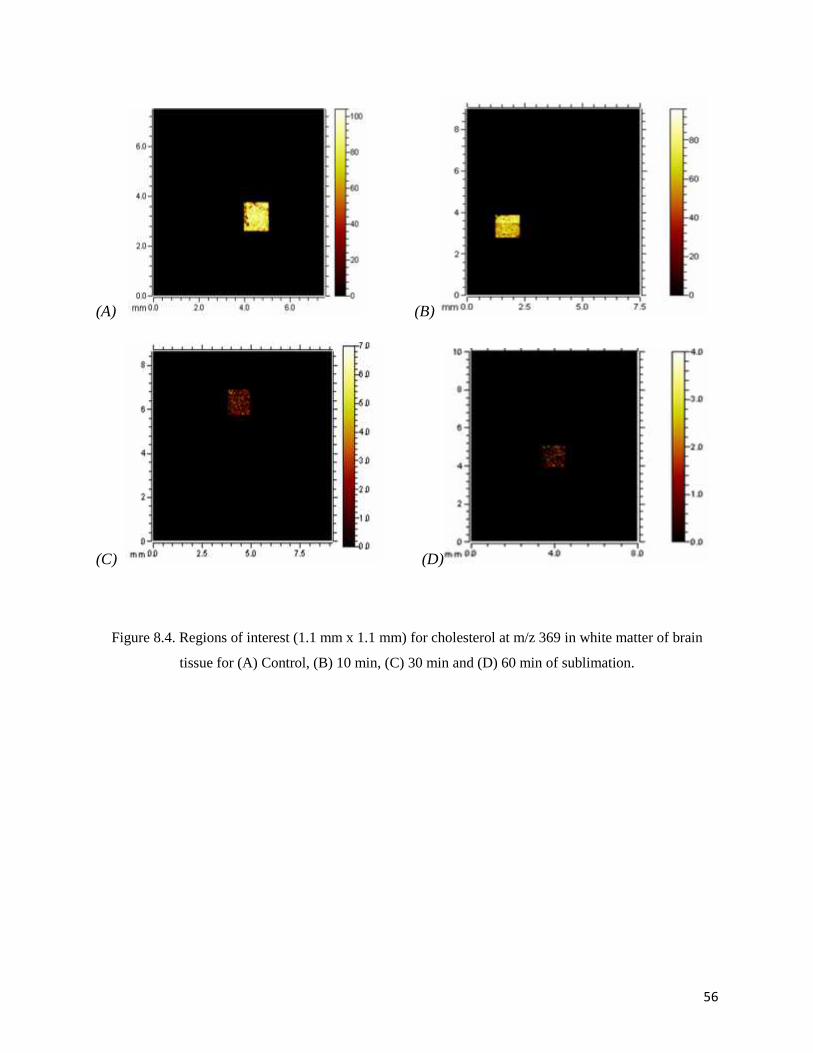
Figure 8.4. Regions of interest (1.1 mm x 1.1 mm) for cholesterol at m/z 369 in white matter of brain
tissue for (A) Control, (B) 10 min, (C) 30 min and (D) 60 min of sublimation.
57
(A) (B)
(C)
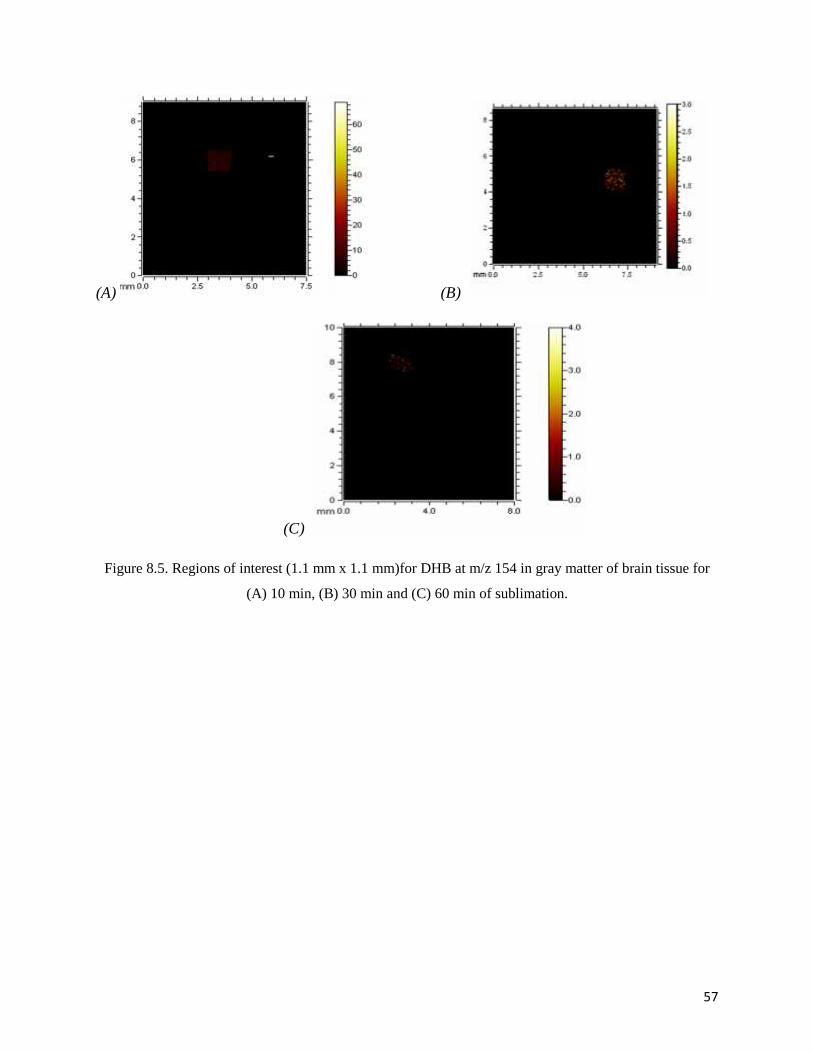
Figure 8.5. Regions of interest (1.1 mm x 1.1 mm)for DHB at m/z 154 in gray matter of brain tissue for
(A) 10 min, (B) 30 min and (C) 60 min of sublimation.
58
(A) (B)
(C)
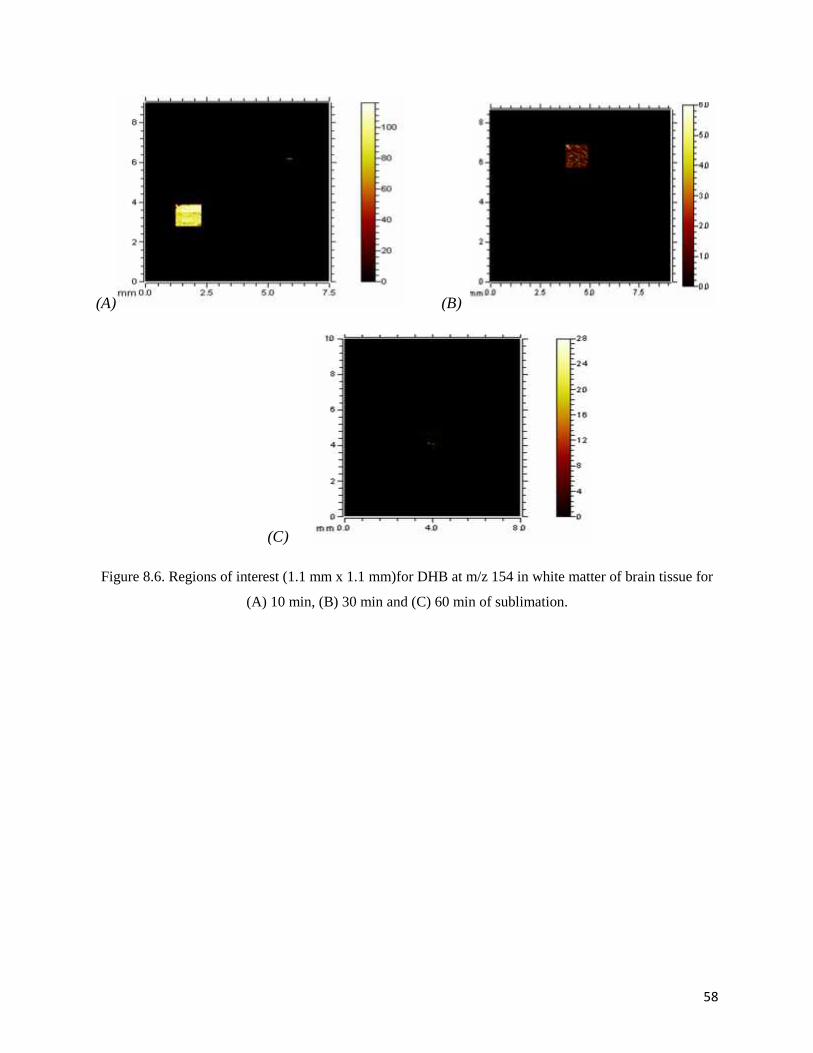
Figure 8.6. Regions of interest (1.1 mm x 1.1 mm)for DHB at m/z 154 in white matter of brain tissue for
(A) 10 min, (B) 30 min and (C) 60 min of sublimation.