Optimizing Project Resources and Improving Visibility in the Professional Services Organization
18
December 2, 2014 Improving Control Visibility and Profitability in the Services Business: Optimizing Project Resources and Improving Visibility into Performance www.blytheco.com
-
Upload
alicia-anderson -
Category
Business
-
view
52 -
download
1
Transcript of Optimizing Project Resources and Improving Visibility in the Professional Services Organization

December 2, 2014
Improving Control Visibility and Profitability in the Services Business:
Optimizing Project Resources and Improving Visibility into Performance
www.blytheco.com

Agenda
Panel Introductions
Questions for Our Panel
The State of the Industry Today
The Top Requirements and Capabilities
Solutions to Help
Why NetSuite?
Your Questions
Next Steps

Introductions
John GarzouziSenior Solutions Consultant, NetSuite
Designs cloud-based technology systems for businesses nationwide.
Jeanne UrichManaging Director, Service Performance Insight
Co-author of the Professional Service Maturity Model™ benchmark used by over 10,000 project and service oriented organizations to diagnose and improve their performance.
www.spiresearch.com

Introductions
Alicia Anderson
Strategic Marketing, Blytheco
19 years in ERP sales, service and marketing
Leading ERP provider to thousands of companies nationwide
Rick Cobb
Senior Solutions Architect, Blytheco
Helps companies evaluate and design ERP and CRM solutions.
24 years of industry experience in designing and implementing business management technology

What is the Current “State of the Industry?”

www.spiresearch.comSPISPIResearchResearch
Peop
le
Peop
le
Process
Process
CapitalCapital
Copyright © 2014 Service Performance Insight
All rights reserved. Not for distribution.
2014 Service Industry Trends
Revenues are increasing!
Attrition is on the rise!
Finding skilled talent is a top challenge!
Importance of workforce engagement
Virtual teams and workplaces

www.spiresearch.comSPISPIResearchResearch
Peop
le
Peop
le
Process
Process
CapitalCapital
Copyright © 2014 Service Performance Insight
All rights reserved. Not for distribution.
Organizational Challenges Are Changing!
Challenges (Rated 1 to 5 Scale) 2012 2013 2014
Improve sales and marketing 4.18 4.21 4.15
Talent attract, retain high-quality staff 4.28 3.94 4.11
Support rapid growth and expansion 4.09 4.06 4.10
Achieve revenue and margin targets 4.18 4.18 4.06
Improve quality and consistency 4.20 4.12 3.85
Improve and expand portfolio and markets 3.82 3.83 3.83
Alignment - between functions or groups 3.72 3.59 3.31

“On the Ground” Observations

How Do the Challenges Show Up in PSOs?

www.spiresearch.comSPISPIResearchResearch
Peop
le
Peop
le
Process
Process
CapitalCapital
Copyright © 2014 Service Performance Insight
All rights reserved. Not for distribution.
Resource Management is Critical!
Bill rates and utilization are stagnant! But attrition is rising!
66%
67%
67%
68%
68%
69%
69%
70%
70%
71%
2010 2011 2012 2013 2014
67.5%
69.6%
70.3%
69.7%
69.8%
5.0%
5.5%
6.0%
6.5%
7.0%
7.5%
8.0%
8.5%
2010 2011 2012 2013 2014
6.8%
7.4%7.2%
8.3%8.4%
Annual Employee AttritionBillable Utilization

www.spiresearch.comSPISPIResearchResearch
Peop
le
Peop
le
Process
Process
CapitalCapital
Copyright © 2014 Service Performance Insight
All rights reserved. Not for distribution.
Some good news! Firms are reducing overhead!
Lower Overhead! Much Higher Revenue Yields!
68%
69%
70%
71%
72%
73%
74%
75%
76%
2010 2011 2012 2013 2014
70.8%
74.2%
75.2%
71.2%
74.6%
Percentage Billable Employees
$145
$150
$155
$160
$165
$170
$175
2010 2011 2012 2013 2014
$156
$167 $168
$155
$175
Annual Revenue Per Employee

Rev Rec
Inefficiencies Abound!
Projects

How are Companies Solving these Challenges?

www.spiresearch.comSPISPIResearchResearch
Peop
le
Peop
le
Process
Process
CapitalCapital
Copyright © 2014 Service Performance Insight
All rights reserved. Not for distribution.
Service Delivery Excellence depends on Integrated Systems
KPI Best Rest ▲
Use a standardized delivery methodology 77.3% 64.5% 19.9%
Average project duration (months) 5.95 5.11 16.5%
Average project staff (people) 4.3 3.7 15.2%
Projects delivered on-time 84% 77% 9.2%
Use a commercial PSA 83.3% 77.2% 7.9%
Level of PSA integration with ERP 75.0% 59.9% 25.2%
Integrated PSA/CRM/ERP provides visibility – open books
Resource visibility ensures high utilization
Supporting methodology, tools, templates, learning guides
Constant quality reviews and continuous improvement

www.spiresearch.comSPISPIResearchResearch
Peop
le
Peop
le
Process
Process
CapitalCapital
Copyright © 2014 Service Performance Insight
All rights reserved. Not for distribution.
The “Best” versus the “Rest” shows up on the bottom-line
KPI Best Rest ▲
EBITDA 30.2% 9.8% 209.0%
Average revenue per project (k) $413 $178 132.0%
Annual revenue per employee (k) $236 $150 57.3%
Annual revenue per billable consultant (k) $291 $187 55.6%
Quarterly revenue target in backlog 65.8% 43.7% 50.7%
Project margin for time & expense projects 40.4% 37.4% 7.9%
Larger projects due to positioning, service productizing
Precision execution – high utilization, rates, integrated systems
Robust pipeline, attention to backlog
Lean overhead – virtual facilities and workforce
Enterprise-Wide Visibility
Project
Billing Rules
Revenue Rules
Expenses and Purchases
Timesheets
Bills
Employees Project and Resource
Management
Finance
Invoices
Charges
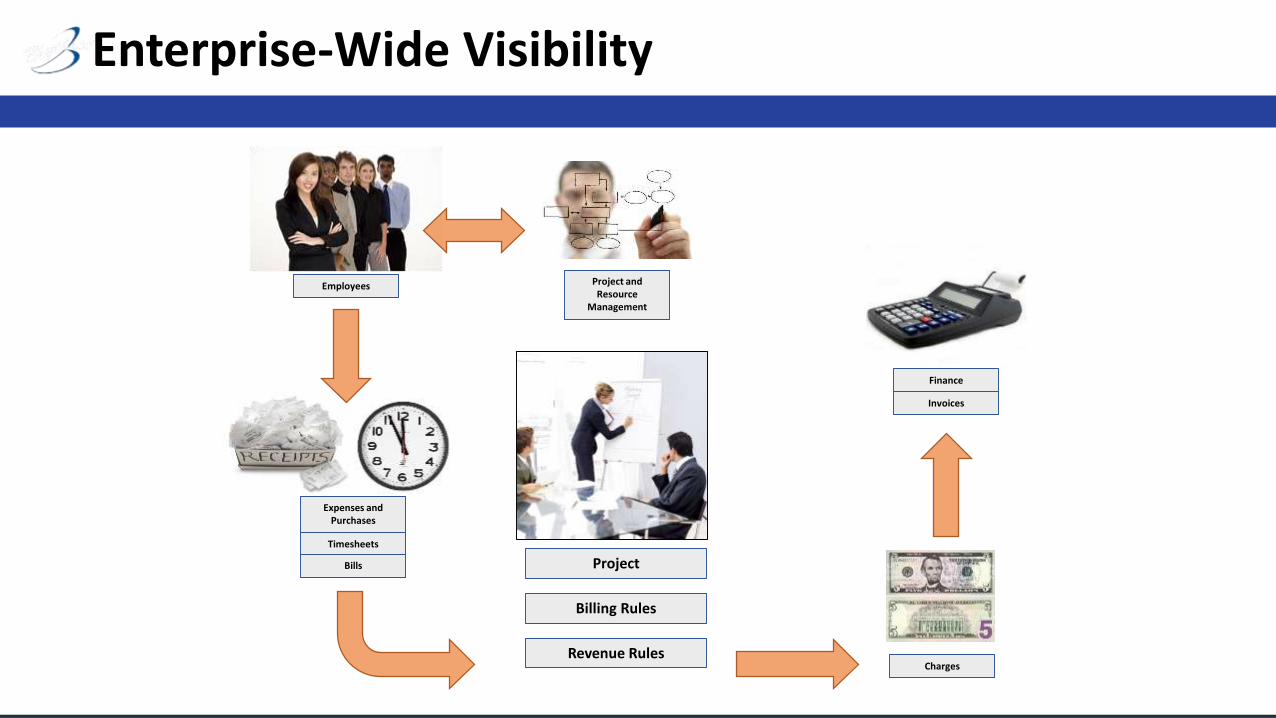
Next Steps
Learn more about best practices in managing PSOs, including:
Download SPI Research’s “Introducing the PS Maturity Model™” paper.
Take the PS Maturity™ benchmark survey and get a FREE ($995 value) copy of the “2015 PS Maturity™ Benchmark” report when it is published in February, 2015
View the NetSuite flash demo
info.blytheco.com/services-resources