Optimizing Laboratory Pyrolysis Methods to Compliment Real ...
148
University of Central Florida University of Central Florida STARS STARS Electronic Theses and Dissertations, 2004-2019 2017 Optimizing Laboratory Pyrolysis Methods to Compliment Real Optimizing Laboratory Pyrolysis Methods to Compliment Real World Fire Debris World Fire Debris Richard Coulson University of Central Florida Part of the Forensic Science and Technology Commons Find similar works at: https://stars.library.ucf.edu/etd University of Central Florida Libraries http://library.ucf.edu This Masters Thesis (Open Access) is brought to you for free and open access by STARS. It has been accepted for inclusion in Electronic Theses and Dissertations, 2004-2019 by an authorized administrator of STARS. For more information, please contact [email protected]. STARS Citation STARS Citation Coulson, Richard, "Optimizing Laboratory Pyrolysis Methods to Compliment Real World Fire Debris" (2017). Electronic Theses and Dissertations, 2004-2019. 5449. https://stars.library.ucf.edu/etd/5449
Transcript of Optimizing Laboratory Pyrolysis Methods to Compliment Real ...

University of Central Florida University of Central Florida
STARS STARS
Electronic Theses and Dissertations, 2004-2019
2017
Optimizing Laboratory Pyrolysis Methods to Compliment Real Optimizing Laboratory Pyrolysis Methods to Compliment Real
World Fire Debris World Fire Debris
Richard Coulson University of Central Florida
Part of the Forensic Science and Technology Commons
Find similar works at: https://stars.library.ucf.edu/etd
University of Central Florida Libraries http://library.ucf.edu
This Masters Thesis (Open Access) is brought to you for free and open access by STARS. It has been accepted for
inclusion in Electronic Theses and Dissertations, 2004-2019 by an authorized administrator of STARS. For more
information, please contact [email protected].
STARS Citation STARS Citation Coulson, Richard, "Optimizing Laboratory Pyrolysis Methods to Compliment Real World Fire Debris" (2017). Electronic Theses and Dissertations, 2004-2019. 5449. https://stars.library.ucf.edu/etd/5449

OPTIMIZING LABORATORY PYROLYSIS METHODS TO COMPLIMENT REAL WORLD
FIRE DEBRIS
by
RICHARD MARK COULSON JR.
B.S. STETSON UNIVERSITY, 2013
A thesis submitted in partial fulfillment of the requirements
for the degree of Master of Science
in the Department of Chemistry
in the College of Sciences
at the University of Central Florida
Orlando, Florida
Spring Term
2017

ii
© Coulson 2017

iii
ABSTRACT
Forensic analysts are tasked with determining the presence of ignitable liquid residue in fire
debris. Analysis of fire debris allows the analyst to understand how the fire occurred. However, the
presence of some substrates can potentially impact the identification of ignitable liquid residue and
classification of a sample as positive or negative for the presence of ignitable liquid. Pyrolysis of
building materials and furnishings (substrates) lead to background interference within the resulting
chromatographic profile. To combat misclassification of a sample as positive for ignitable liquid
residue, knowledge of the pyrolysis products from individual substrates is of utmost importance.
However, unburned reference samples from a fire scene can be difficult to obtain. The use of a
database in conjunction with the analysis of the samples can lead to a more complete analysis of
fire debris.
Within this research, four different burn methods (modified destruction distillation method,
top heat, bottom heat, and tube furnace) were utilized in burning eight different flooring substrates
(polyester, nylon, and olefin carpeting, carpet padding, vinyl flooring, laminate flooring, yellow
pine, and plywood) to obtain pyrolysis/combustion product profiles. Each burn method was
performed at three different burn times for a total of twelve different burns of each substrate.
Standard methods, ASTM E1412-12 and ASTM E1618-14, were used in the extraction and
interpretation of the laboratory burn products. Principal component analysis (PCA) was used to
relate the laboratory burn results to neat ignitable liquid/substrate and large scale burn data sets.
Laboratory burn data projected into the PCA space displayed that the laboratory burn data
is similar to the data contained within the ILRC and Substrate databases. Differences observed
within laboratory burn data projections illustrated the variability of the laboratory burn methods.
The composition of the substrate dictated the pyrolysis/combustion products produced. While this

iv
research only focuses on flooring substrates, an increase in the number of different types of
materials in the Substrate Database can aid analysts in identifying common pyrolysis/combustion
products observed in fire debris.

v
I would like to thank Dr. Sigman, Mary Williams, Dr. Bridge and the entire faculty at National
Center of Forensic Science for allowing me the opportunity to pursue my dreams of obtaining
knowledge in the field of forensics. My coworkers and friends alike have aided me in my pursuit
of understanding. I would also like to thank my mother and father as they have impacted my life
and I would love to be able to support them in the future if need be. Many trials and tribulations
have come up along the way, but we have had the determination to overcome those obstacles
together. I cherish their love and support as words cannot fully display my thanks for them, this is
for you.

vi
ACKNOWLEDGMENTS
I am eternally grateful for the tutelage under Dr. Michael Sigman, Mary Williams and
Dr. Candice Bridge and everything they aided me in with training of instrumentation and
spreading of a wealth of knowledge and understanding. Thank you, University of Central
Florida, for allowing me to strive for obtaining my Master’s Degree. Also, acknowledgments to
Earl F. Glynn for displaying the color chart in R and the inclusion of “saddle brown”.
vii
TABLE OF CONTENTS
LIST OF FIGURES ........................................................................................................................ x
LIST OF TABLES ....................................................................................................................... xiv
LIST OF ABREVIATIONS (or) ACRONYMS ........................................................................... xv
CHAPTER 1: INTRODUCTION ................................................................................................... 1
CHAPTER 2: BACKGROUND AND LITERATURE RESEARCH ............................................ 4
2.1 Pyrolysis ................................................................................................................................ 4
2.2 Flooring Material Substrate Information ............................................................................ 10
2.2.1 Carpeting ...................................................................................................................... 10
2.2.2 Wood ............................................................................................................................ 14
2.2.3 Processed Flooring ....................................................................................................... 16
2.3 Extraction and Analysis of Interference Points .................................................................. 18
2.4 Automated Fire Debris Classification ................................................................................. 20
CHAPTER 3: METHODS/EXPERIEMNTATION ..................................................................... 23
3.1 Materials ............................................................................................................................. 23
3.1.1 Large Scale Burn Data Set ........................................................................................... 24
3.1.2 Neat IL/SUB Data Set .................................................................................................. 25
3.2 Laboratory Burning Methods .............................................................................................. 26
3.2.1 Modified Destruction Distillation Method (MDDM) .................................................. 27
3.2.2 Top Heat Burn Method (TH) ....................................................................................... 28

viii
3.2.3 Bottom Heat Burn Method (BH) ................................................................................. 29
3.2.4 Tube Furnace Burn Method (FURN) ........................................................................... 30
3.2.5 Ignitable Liquid Addition ............................................................................................ 32
3.3 Passive Headspace Adsorption Technique for Extraction .................................................. 33
3.4 GC-MS Instrumental Parameters ........................................................................................ 34
3.5 GC-MS Analysis Process .................................................................................................... 34
CHAPTER 4: RESULTS AND DISCUSSION ............................................................................ 36
4.1 Fire Debris Samples ............................................................................................................ 36
4.2 Projection of In Silico Data into Fire Debris Data Sets ...................................................... 37
4.3 Polyester Carpeting ............................................................................................................. 43
4.3.1 Projection of Laboratory Burns into Fire Debris Data Sets ......................................... 43
4.3.2 TICs from Laboratory Burns ....................................................................................... 46
4.4 Nylon Carpeting .................................................................................................................. 50
4.4.1 Projection of Laboratory Burns into Fire Debris Data Sets ......................................... 50
4.4.2 TICs from Laboratory Burns ....................................................................................... 53
4.5 Olefin Carpeting.................................................................................................................. 57
4.5.1 Projection of Laboratory Burns into Fire Debris Data Sets ......................................... 57
4.5.2 TICs from Laboratory Burns ....................................................................................... 60
4.6 Carpet Padding .................................................................................................................... 63
4.6.1 Projection of Laboratory Burns into Fire Debris Data Sets ......................................... 63

ix
4.6.2 TICs from Laboratory Burns ....................................................................................... 67
4.7 Vinyl Flooring ..................................................................................................................... 70
4.7.1 Projection of Laboratory Burns into Fire Debris Data Sets ......................................... 70
4.7.2 TICs from Laboratory Burns ....................................................................................... 74
4.8 Laminate Flooring ............................................................................................................... 77
4.8.1 Projection of Laboratory Burns into Fire Debris Data Sets ......................................... 77
4.8.2 TICs from Laboratory Burns ....................................................................................... 81
4.9 Plywood .............................................................................................................................. 85
4.9.1 Projection of Laboratory Burns into Fire Debris Data Sets ......................................... 85
4.9.2 TICs from Laboratory Burns ....................................................................................... 88
4.10 Yellow Pine ....................................................................................................................... 92
4.10.1 Projection of Laboratory Burns into Fire Debris Data Sets ....................................... 92
4.10.2 TICs from Laboratory Burns ..................................................................................... 95
4.11 Polyester Carpet/Carpet Padding ...................................................................................... 99
4.11.1 Projection of Laboratory Burns into Fire Debris Data Sets ....................................... 99
4.11.2 TICs from Laboratory Burns ................................................................................... 103
4.12 Compilation of Laboratory Burns ................................................................................... 107
CHAPTER 5: CONCLUSION ................................................................................................... 111
APPENDIX: COPYRIGHT PERMISSIONS ............................................................................. 114
REFERENCES ........................................................................................................................... 125
x
LIST OF FIGURES
Figure 1: Random Scission of Polyethylene 10 ............................................................................... 6
Figure 2: Side Group Scission of Polyvinyl Chloride (PVC) 10 ..................................................... 7
Figure 3: Common Polymers and Polymer Degradation Mechanisms 10 ....................................... 9
Figure 4: Structure of Synthetic Carpeting ................................................................................... 11
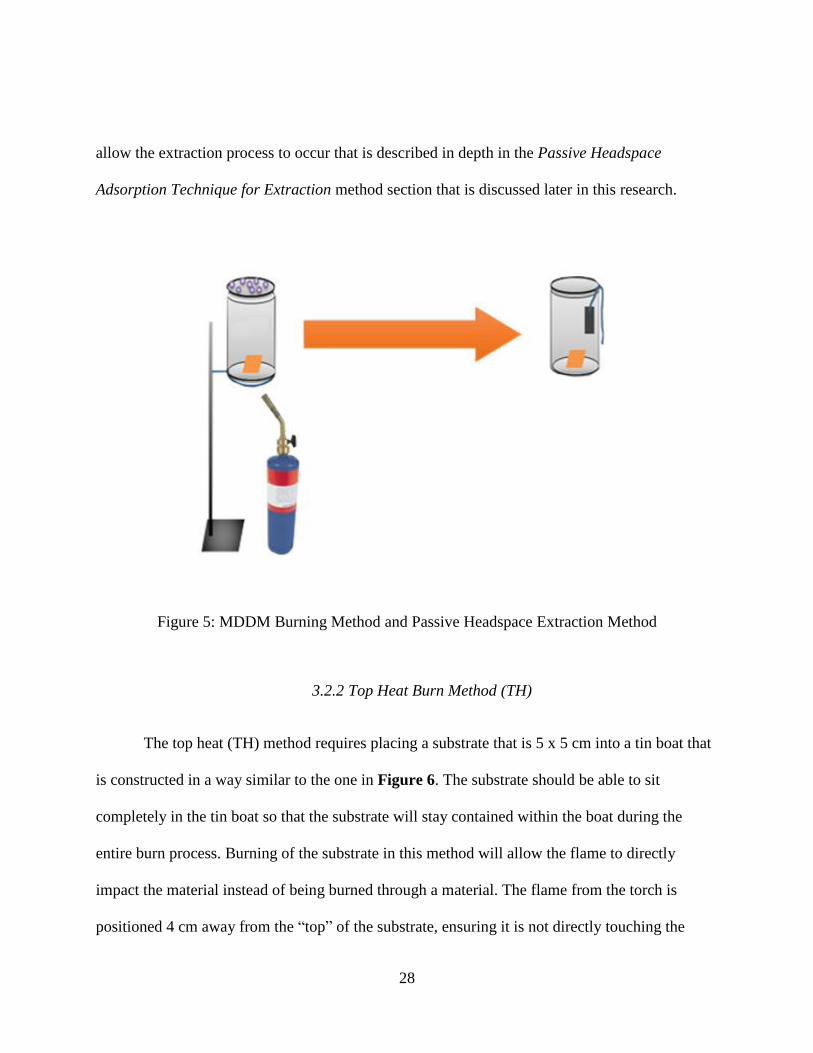
Figure 5: MDDM Burning Method and Passive Headspace Extraction Method ......................... 28
Figure 6: Top Heat Burning Method ............................................................................................ 29
Figure 7: Bottom Heat Burning Method ....................................................................................... 30
Figure 8: Apparatus used in Tube Furnace Method ...................................................................... 32
Figure 9: Projection of pure IL and SUB into LSB PCA space .................................................... 39
Figure 10: Projection of in silico data into large scale burn PCA space....................................... 40
Figure 11: Projection of in silico data into neat IL/SUB PCA space............................................ 42
Figure 12: Polyester laboratory burns projection into LSB PCA space ....................................... 44
Figure 13: Polyester laboratory burns projection into neat IL/SUB PCA space .......................... 45
Figure 14: Compounds (1) benzene, (2) toluene, (3) 2,4-dimethyl-1-heptene, (4) styrene, (5)
benzaldehyde, (6) acetophenone, (7) benzoic acid, (8) biphenyl ..................................... 47
Figure 15: Compounds (4) styrene, (5) benzaldehyde, (6) acetophenone .................................... 48
Figure 16: Nylon laboratory burns projection into LSB PCA space ............................................ 51
Figure 17: Nylon laboratory burns projected into neat IL/SUB PCA space................................. 52
Figure 18: Compounds (1) toluene, (2) 2,4-dimethyl-1-heptene, (3) styrene, (4) benzaldehyde,
(5) alpha methylstyrene, (6) acetophenone, (7) caprolactam, (8) biphenyl, (9) naphthalene
........................................................................................................................................... 54

xi
Figure 19: Compounds (2) 2,4-dimethyl-1-heptene, (3) styrene, (4) benzaldehyde, (5) alpha
methylstyrene, (6) acetophenone, (7) caprolactam ........................................................... 55
Figure 20: Olefin laboratory burns projection into LSB PCA space ............................................ 58
Figure 21: Olefin laboratory burn projection into neat IL/SUB PCA space................................. 59
Figure 22: Compounds (1) toluene, (2) 2,4-dimethyl-1-heptene, (3) styrene, (4) benzaldehyde,
(5) alpha methylstyrene, (6) acetophenone, (7) naphthalene, (8) biphenyl ...................... 61
Figure 23: Compounds (1) toluene, (2) 2,4-dimethyl-1-heptene, (3) styrene, (4) benzaldehyde,
(5) alpha methylstyrene, (6) acetophenone, (8) biphenyl ................................................. 62
Figure 24: Padding laboratory burns projection into LSB PCA space ......................................... 64
Figure 25: Projection of carpet padding into neat IL/SUB PCA space ........................................ 66
Figure 26: Components (1) 2-propanol, 1-chloro-, phosphate (3:1), (2) 1-propene, 1,3-dichloro,
(3) 1,3-dichloro, 2-propanol, (4) benzene, (5) toluene, (6) styrene, (7) benzonitrile, (8)
alpha methylstyrene, (9) 4-phenylbutronitrile, (10) benzaldehyde, (11) phenol .............. 68
Figure 27: Components (1) 2-propanol, 1-chloro-, phosphate (3:1), (2) 1-propene, 1,3-dichloro,
(3) 1,3-dichloro, 2-propanol, (6) styrene, (9) 4-phenylbutronitrile, (10) benzaldehyde ... 69
Figure 28: Vinyl laboratory burns projection into LSB PCA space ............................................. 71
Figure 29: Vinyl laboratory burns projected into neat IL/SUB PCA space ................................. 73
Figure 30: Compounds (1) benzene, (2) methyl isobutyl ketone, (3) toluene, (4) 2-ethyl-1-
hexanol, (5) methyl ester hexadecanoic acid, (6) naphthalene ......................................... 75
Figure 31: Compounds (1) benzene, (2) methyl isobutyl ketone, (3) toluene, (4) 2-ethyl-1-
hexanol, (5) methyl ester hexadecanoic acid, (6) naphthalene ......................................... 76
Figure 32: Projection of laminate flooring burns into LSB PCA space ....................................... 78

xii
Figure 33: Projection of laminate flooring into neat IL/SUB PCA space .................................... 80
Figure 34: Components (1) hexanal, (2) 2-furaldehyde, (3) benzaldehyde, (4) nonanal, (5) alpha
terpinol, (6) furfuryl alcohol, (7) 2-methoxyphenol, (8) 2-methoxy-4-methylphenol, (9) 4-
ethyl-2-methoxyphenol, (10) toluene................................................................................ 82
Figure 35: Components (1) hexanal, (2) 2-furaldehyde, (3) benzaldehyde, (4) nonanal, (5) alpha
terpinol, (6) furfuryl alcohol, (7) 2-methoxyphenol, (8) 2-methoxy-4-methylphenol, (9) 4-
ethyl-2-methoxyphenol, (10) toluene................................................................................ 83
Figure 36: Projection of plywood material into LSB PCA space ................................................. 86
Figure 37: Projection of plywood material into neat IL/SUB PCA space .................................... 87
Figure 38: Compounds (1) hexanal, (2) 2-cyclopenten-1-one, (3) 2-furaldehyde, (4) alpha pinene,
(5) 2-methoxyphenol, (6) 2-methoxy-4-methoxyphenol, (7) 4-ethyl-2-methoxyphenol, (8)
eugenol, (9) benzaldehyde, (10) nonanal, (11) hexanoic acid, (12) octanoic acid, (13) 5-
methylfurfural, (14) furfuryl alcohol ................................................................................ 89
Figure 39: Compounds (1) hexanal, (2) 2-cyclopenten-1-one, (3) 2-furaldehyde, (5) 2-
methoxyphenol, (6) 2-methoxy-4-methoxyphenol, (7) 4-ethyl-2-methoxyphenol, (8)
eugenol, (9) benzaldehyde, (10) nonanal, (11) hexanoic acid, (12) octanoic acid, (13) 5-
methylfurfural, (14) furfuryl alcohol ................................................................................ 90
Figure 40: Projection of yellow pine flooring into LSB PCA space ............................................ 93
Figure 41: Projection of yellow pine into neat IL/SUB PCA space ............................................. 94
Figure 42: Compounds (1) pentanal, (2) 1-pentanol, (3) toluene, (4) hexanal, (5) 2-furaldehyde,
(6) heptanal, (7) alpha pinene, (8) octanal, (9) nonanal, (10) 1-methoxy-4-(2-propenyl)

xiii
benzene, (11) 2-methoxyphenol, (12) 2-methoxy-4-methylphenol, (13) 4-ethyl-2-
methoxyphenol, (15) TXIB, (16) furfuryl alcohol, (17) 5-methylfurufral ....................... 96
Figure 43: Compounds (1) pentanal, (2) 1-pentanol, (3) toluene, (4) hexanal, (5) 2-furaldehyde,
(6) heptanal, (7) alpha pinene, (8) octanal, (9) nonanal, (10) 1-methoxy-4-(2-propenyl)
benzene, (11) 2-methoxyphenol, (12) 2-methoxy-4-methyl phenol, (13) 4-ethyl-2-
methoxy-phenol, (14) eugenol, (15) TXIB, (16) furfuryl alcohol, (17) 5-methylfurfural 97
Figure 44: Projection of polyester carpeting and carpet padding into LSB PCA space ............. 100
Figure 45: Projection of polyester carpeting and padding into neat IL/SUB PCA space ........... 101
Figure 46: Compounds (1) 2,4-dimethyl-1-heptene, (2) styrene, (3) alpha methylstyrene, (4) n-
nonane, (5) n-decane, (6) n-undecane, (7) naphthalene, (8) toluene, (9) 4-
phenylbutronitrile, ........................................................................................................... 105
xiv
LIST OF TABLES
Table 1: Most common pyrolysis/combustion products from laboratory burns ......................... 108
Table 2: Common pyrolysis/combustion products for carpet flooring from laboratory burns ... 109
Table 3: Common pyrolysis/combustion products for processed flooring from laboratory burns
......................................................................................................................................... 109
Table 4: Common pyrolysis/combustion products for wood flooring from laboratory burns .... 110

xv
LIST OF ABREVIATIONS (or) ACRONYMS
ACS activated charcoal strip
AR Aromatic
ASTM American Society for Testing and Materials
BFFEA Bureau of Forensic Fire and Explosive Analysis
BH Bottom Heat
˚C Celsius (centigrade) in degrees
cm centimeter
Cn Hydrocarbon range with n as a number (C8)
CS2 Carbon Disulfide
EIC Extracted Ion Chromatogram
FURN Furnace
GAS Gasoline
GC-MS Gas Chromatograph – Mass Spectrometer
HCl Hydrochloric acid
IL Ignitable Liquid
ILR Ignitable Liquid Residue
ILRC Ignitable Liquid Reference Collection
ILRCC Ignitable Liquid Reference Collection Committee
Inc. Incorporated
ISO Isoparaffinic
LSB large scale burn
xvi
m meter
m/z mass-to-charge ratio
MDDM Modified Destructive Distillation Method
Min minute
MISC Miscellaneous
mL milliliter
mm millimeter
MPD Medium Petroleum Distillate
MS Mass Spectrometer
n-alkane Normal Alkane
NA Normal Alkane
NCFS National Center for Forensic Science
NIST National Institute of Standards and Technology
NP Naphthenic-Paraffinic
OXY Oxygenate
PC n Principal Component n (where n refers to a number; PC1)
PCA Principal Component Analysis
PD Petroleum Distillate
PET Polyethylene Terephthalate
PVC Polyvinyl Chloride
SRN Standard Reference Number
SUB Substrate
xvii
TWGFEX Technical Working Group for Fire and Explosions
T/SWGFEX Technical and Scientific Working Group for Fire and Explosions
TCPP Tris (1-chloro, 2-propyl) phosphate
TH Top Heat
TIC Total Ion Chromatogram
TIS Total Ion Spectrum
TXIB 2,2,4-trimethyl-1,3-pentanediol diisobutyrate
UCF University of Central Florida
µL microliter

1
CHAPTER 1: INTRODUCTION
Arson has been an increasing problem in today’s society for police investigators, analysts
and everyone impacted by the fire. In the United States in 2013, there were 1.4 million fires
across the entirety of the country.1 It is estimated of those 1.4 million fires that occurred in the
United States, that 31.7% of the fires were residential.1 A residential fire is not only affecting the
lives of individuals within the homes, but those around them as well. The fact that a combined
23% of the residential fires were committed intentionally or are under investigation displays the
volume of arson attacks that are occurring within the United States.1 Fires are a growing concern
that cost the lives of individuals and damage the natural world with destructive force. To make
matters worse, the destructive nature of fire is variable as no two fires are alike in intensity, size,
and content of environment that is burning.2 It is the job of the analyst to determine the presence
of possible ignitable liquids at a fire scene. Investigative efforts in collection and analysis of the
ignitable liquids are difficult as the destruction will not only yield possible ignitable liquid
residue, but the breakdown of material within the fire causes interfering patterns adding another
layer of difficulty.3 This struggle is one of the main causes for arson scenes that were reported
many years ago to still be under investigation to this date.
Arson scene investigation requires adequate search techniques of the perimeter of the fire
scene searching for signs of forced entry and leads to the center of the burn area. The dynamics
of fire can be affected by many factors, but three main components will always be present in
some ratio of heat, fuel and oxygen.2, 4 If any of the three components of fire are taken away,
extinguishment will occur. Piecing together the arson scene and evaluating the fire’s path will
lead to an understanding of how the ratio of fuel to heat to oxygen could have impacted the force
2
and movement of the fire within the fire scene. An increase in oxygen from a door opening that
was not open previously or a window breaking could cause a myriad of effects on the strength of
the fire.5
Collection of the material at the fire scene and observing the ventilation and different
layers of damage at the scene is extremely important to the investigation. Materials collected at
the fire scene will be analyzed at the laboratory and compared to appropriate reference samples
that are unburned, if possible. Collection of known unburned reference samples allow for the
comparison of materials to interpret the degradation of the material and possible presence of an
ignitable liquid.6 Even an experienced analyst may have trouble identifying the presence of an
ignitable liquid residue within fire debris that is masked by pyrolysis and combustion
interference products.7,8 Simulation of “real life” fire debris by burning, analyzing and
interpreting materials in the laboratory is the goal of this research. If a laboratory burn can
simulate a real life fire debris scenario, then if an unburned reference sample is impossible to
collect at the fire scene, there is an alternative that can be used for comparison purposes.
Unfortunately, a full scale duplication of a fire scene is near impossible in the laboratory.9
Therefore, focusing on creating testing conditions for laboratory burns of common household
flooring materials was a more sound approach to this research.
A database of different laboratory burn methods including different substrates allows for
further improved performance of investigative understanding of arson scenes. Evaluation of
chromatographic profiles will yield dividends in identification of possible ignitable liquid and
pyrolysis products.6 Further investigation into the projection of simulated laboratory burn data
utilizing chemometrics and contour plots will allow the analyst to observe the similarities and

3
differences between burned materials that may or may not contain ignitable liquid. Analyzing the
similarities and differences of laboratory burn data through chemometric methods will display if
the substrate laboratory burns are similar to casework fire debris and substrate/ignitable liquid
contained within the neat Ignitable Liquid Reference Collection and Substrate databases.

4
CHAPTER 2: BACKGROUND AND LITERATURE RESEARCH
2.1 Pyrolysis
Pyrolysis is a process where a material breaks down or degrades into smaller components
by heat alone.2, 4 It occurs without interaction of oxygen or oxidants. It is important to recognize
that some of the smaller components (pyrolysis products) formed can be observed during
analysis using GC-MS instrumentation. Most of the pyrolysis products released by the substrate
will be fueling the flame, while part of the product will be adsorbed onto the substrate.10 Not
only will pyrolysis products be observed, but partial combustion products will be produced as
well, if they are not lost during the burning process. Pyrolysis/combustion products formed
during the laboratory burning process may be representative of the products obtained in real-
world fire debris.10 If ignitable liquid is present in a fire debris sample, then ignitable liquid
residue (ILR) will likely be observed in the chromatogram in addition to pyrolysis/combustion
products. The destructive nature of fire makes investigation difficult due to evidence being
damaged and altered by the fire and firefighting efforts.11 The different compositions of materials
increase the difficulty of identifying possible ILR in the chromatographic profile.
Stauffer previously stated there are three separate mechanisms of degradation observed in
pyrolysis of polymeric material.10 Random scission, side group scission or side elimination and
monomer reversion (depolymerization) are commonly observed separating mechanisms
encountered in pyrolysis of a product. There are other less commonly seen mechanisms that have
been discovered including rearrangement of natural, synthetic organic material and cross-linking
with char formation. Cross-linking occurs within molecules like polyacrylonitriles or phenolic

5
resins, which strengthen the polymer product creating a minimal amount of volatile products.12
Burned material does not always undergo only one particular type of pyrolysis mechanism.
Often, multiple pyrolysis mechanism routes are taken simultaneously.13 Pyrolysis routes that are
observed will be determined by the strength of the bonds of the molecules within the substrate
being burned and the temperature of the flame. Variations in pyrolysis mechanisms complicate
the chromatographic profile examined by the fire debris analyst.
Random scission occurs when similar strength carbon-carbon bonds are in the backbone
of the molecule and the molecule breaks apart randomly. Smaller sized components in the form
of alkanes, alkenes, and alkadienes will be the outcome of random scission as the hydrocarbon
chain of the molecule is forced to decompose.10 This commonly occurs within polymers as their
backbones have similar strength carbon-carbon bonds.14 In particular, polyethylene and
polypropylene will typically undergo random scission. Polyethylene burns will lead to the
formation of a radical, unsaturated hydrocarbon (alkene), and saturated hydrocarbon (alkane)
within the chromatographic profile.4 The full mechanism of side group scission of polyethylene
is shown within Figure 1.

6
Figure 1: Random Scission of Polyethylene 10
Polypropylene, on the other hand, contains methyl substituents along its backbone. This
means that every other carbon within its chain that is attached to a methyl group is tertiary.15
Random scission of polypropylene will result in scission of the carbon chain predominantly
between the tertiary and secondary carbon.
Side group scission occurs when groups attached to the side of the carbon backbone of
the polymer are lost, resulting in a polyunsaturated structure. Then, the polyunsaturated structure
undergoes additional reactions of scission, aromatization and char formation.16
Polyvinylchloride, or PVC, undergoes side group scission. Polyvinylchloride, a polymer
material, experiences loss of HCl to yield a conjugated double bond backbone.4 The conjugated
double bonds in the backbone undergo further degradation forming aromatic components and
7
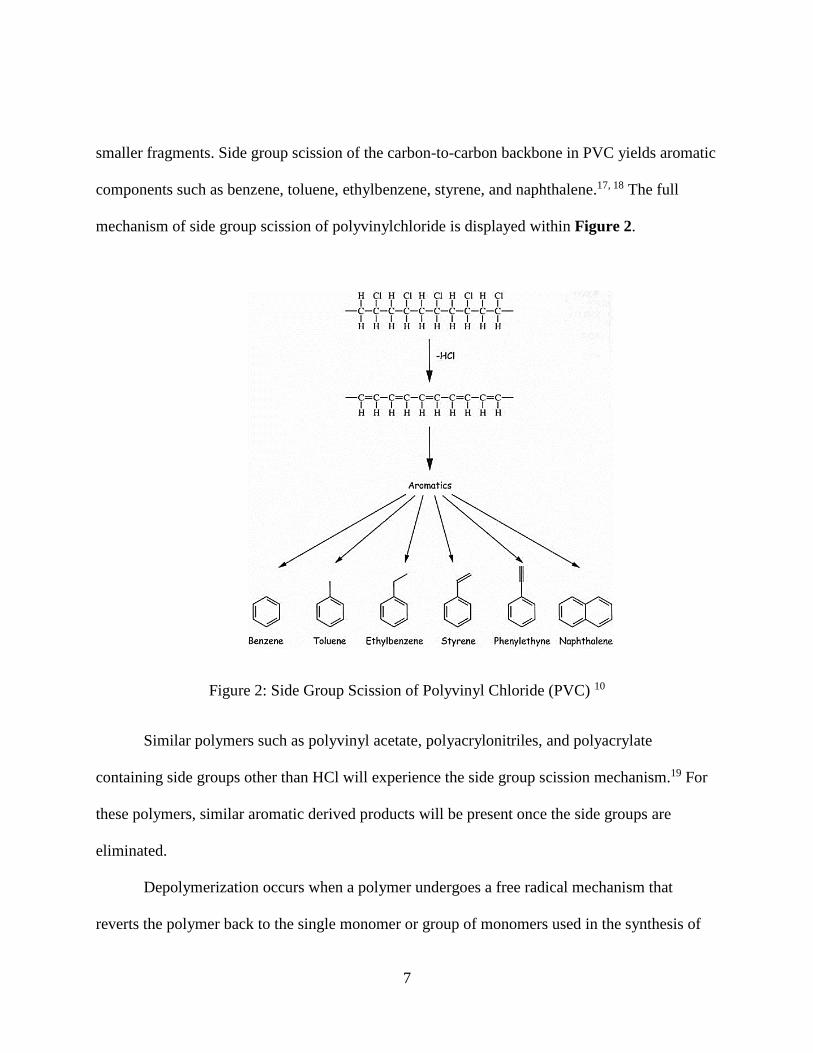
smaller fragments. Side group scission of the carbon-to-carbon backbone in PVC yields aromatic
components such as benzene, toluene, ethylbenzene, styrene, and naphthalene.17, 18 The full
mechanism of side group scission of polyvinylchloride is displayed within Figure 2.
Figure 2: Side Group Scission of Polyvinyl Chloride (PVC) 10
Similar polymers such as polyvinyl acetate, polyacrylonitriles, and polyacrylate
containing side groups other than HCl will experience the side group scission mechanism.19 For
these polymers, similar aromatic derived products will be present once the side groups are
eliminated.
Depolymerization occurs when a polymer undergoes a free radical mechanism that
reverts the polymer back to the single monomer or group of monomers used in the synthesis of

8
the polymer. The depolymerization mechanism will generate a simple chromatogram with large
peaks corresponding to the monomers that were created from the polymer degradation. Two
polymers that undergo depolymerization, often referred to as monomer reversion, are
polystyrene and polymethacrylates.18 In particular, polymethacrylates undergo scission to
liberate an unsaturated smaller component (monomer) and a free radical. The free radical from
the end of the polymer chain will facilitate further cleaving of the polymer and the continued
breakdown of the polymer is commonly referred to as “unzipping”. The associated
chromatographic profile for polymethacrylates will display the smaller unsaturated monomer as
the major peak within the chromatogram.19 If the polymer exclusively undergoes
depolymerization, the chromatographic profile will be easier to analyze with one peak
corresponding to the monomer. However, the depolymerization process can be subsequent to the
side group scission process that was discussed previously, which will lead to additional peaks
within the chromatogram.
Substrates that are burned at a fire scene will undergo one or multiple pyrolysis
process(es). Estimation of the pyrolysis mechanism each material will undergo has been studied
extensively. Stauffer observed polymers and their relative pyrolysis products commonly found
within fire debris.10 Commonly encountered polymers and favored degradation mechanisms are
displayed in Figure 3.

9
Figure 3: Common Polymers and Polymer Degradation Mechanisms 10
For the purposes of this research, flooring material substrates and their favored
degradation mechanisms were the focus. Specifically, the pyrolysis of carpeting, wood, and
processed flooring will yield products that are related to the type(s) of degradation mechanisms
utilized and the substrate composition.
10
2.2 Flooring Material Substrate Information
Flooring materials that are collected at the crime scene can have a large impact on the
spread of the fire due to their composition. This can cause product background interference in the
chromatographic profile of fire debris that can be misinterpreted if the analyst is not careful.
With an increase in selectivity of instrumentation and analytical techniques, forensic scientists
have become more aware of the contributions decomposition of different materials can have on
the impact of fire debris and the fire itself.9 Building materials, for example, are amongst the
most submitted samples for analysis of fire debris.20 They are used in the construction and
furnishings of homes that are commonly affected in arson cases. The focus is not only on the
composition of material that is used in the construction of homes, but the finishings, additives
and adhesives that have been added to those materials, which will also impact the analysis
process. Through the analytical process, analysts can overcome these distinctive difficulties in
analysis of debris by collecting unburned reference samples away from the fire, if possible.
Knowledge of burning characteristics of materials utilized in building and outfitting households
is crucial in fire testing and analysis.2 A deeper understanding of different building materials will
also give insight into the effect these different potential fuel contributors are relaying to the fire
path, intensity, and speed at which the fire spreads.
2.2.1 Carpeting
In an upholstered structure that contains carpeting, there will be multiple layers to the
flooring consisting of the carpeting face, carpet padding acting as an underlayer and then
subflooring as the bottom-most layer. The composition of a commonly found synthetic carpet

11
and padding underlayer is presented within Figure 4.
Figure 4: Structure of Synthetic Carpeting
While the carpet face may be initially burned in a fire scenario, the lower and backing
layers found between the carpet face and padding need to be recognized as well. A combination
is created with the carpet seated on the carpet padding and the carpet fiber is essentially woven
or glued to a backing.4 Common microfiber, or one main fiber, carpeting types include nylon,
polyester, and olefin. The carpet backing is usually composed of a polymer, commonly
propylene or polybutadiene.4 Propylene is commonly identified as the ribbon-like appearance
that is found on the back of most carpets. Carpets may have a rubber or urethane-foam backing
that is installed over a separate foam pad.2 The most common underlayer of the carpet is carpet
padding; it is created using polyurethane polymer. The synthetically created monofiber carpets,
that have been mentioned, will burn easier than carpets that are handmade with cotton due to the
inclusion of synthetic material. Synthetic carpets are known to melt and reduce the specific
materials’ burning rate while simultaneously increasing the heat release rate of the fire.5 Their

12
flammable nature tends to support open-room combustion and propagate a flashover effect where
the carpet ignites and directly adds to the heat rate of the fire.4 The synthetic carpeting creates a
phenomenon of conflicting natures with an insulating fiber on the face in combination with
padding that acts as additional fuel for the fire to persist. Previously, the burning of the synthetic
carpet material and padding have been mistaken for circular halo patterns that were thought to be
formed by burning ignitable liquid, so caution in interpretation is necessary.21, 22 If the propylene
backing is exposed to a room fire, it tends to melt causing the entire carpeting to shrink. This
exposes the carpet padding to the fire, thus allowing it to add additional fuel to the flame.2
Product formation is not only established from the decomposition of carpet fibers seated
above the carpet padding, but from the polymer adhesive that strengthens the hold of multiple
components as well. Assumedly, solvents that are utilized in the process of creating the adhesive
would evaporate overtime. However, solvents tend to remain trapped in the polymer creation and
will be detectable through the analysis process.20 Some pyrolysis products, such as those from
burned carpet face, may appear similar to an ignitable liquid like gasoline. With the addition of
the breakdown of the polymer adhesive that is used in the mixture of carpet and padding, it can
further increase the difficulty in understanding what allowed the fire to occur and/or persist. In
fact, it is not unusual to find C3-and C4-alkylbenzenes, indanes and naphthalenes in samples of
burned carpets.8, 9, 23
Specifically, the fiber content for the carpeting will further lead to different
chromatographic profiles being observed. The most common synthetic carpet fibers (polyester,
nylon, and olefin) will require unburned reference samples for comparison purposes to allow the
analyst to observe chromatographic differences between burned and unburned flooring materials.

13
Polyester synthetic carpeting is manufactured using terephthalic acid and ethylene glycol
which act as a precursor to the creation of the polymer, polyethylene terephthalate, also known
as PET. PET will likely undergo random scission yielding small amounts of oxygenated
aromatics.10 Nylon synthetic carpeting, similarly, is a polyamide polymer that is frequently used
in commercial carpeting. In fact, nylon comes in two polymeric forms that are used for carpeting
in Nylon 6 and Nylon 6-6.24 Both Nylon 6 and Nylon 6-6 undergo random scission, but Nylon 6
will further degrade by depolymerization yielding caprolactam.10 Nylon 6-6 will yield a
characteristic cyclopentanone peak.25 Olefin synthetic carpeting is a polypropylene polymer that
is relatively cheaper than both nylon and polyester carpeting and will also undergo random
scission.26
The breakdown of these individual polymers will be facilitated by the pyrolysis
mechanisms that have been discussed previously. The additional decomposition of the carpet
backing composed of polypropylene will melt and mix with the detection of the adhesive still
affixed in the creation of the combination of carpeting.20 The breakdown of the fibers in the
carpeting will not produce significant pyrolysis/combustion products that could interfere with
observation of possible ignitable liquid residue patterns. However, the carpet backing will be a
source for alkylbenzenes and aromatic compounds that may complicate the identification process
of ILR.8, 27 All of these factors interwoven into carpeting that could be found at a fire scene could
potentially be observed in the analyzed chromatographic profile of an unknown carpet sample.

14
2.2.2 Wood
Wood is commonly utilized as a household building material. Older buildings in
particular will still have interiors constructed with some form of wood compared to businesses or
offices in today’s world.2 Additionally, furnishings around the household have been outfitted
using different types of wood. Fire impacts wood through the thermal degradation process,
which will produce changes in the structure that can be accelerated by an increase in heat.
Volatile components expelled from the decomposition of flames interacting with the wood allow
for the analysis of characterizing different types of wood.28
Wood is composed of three main components: cellulose, hemicellulose and lignin that are
polymeric materials making up a wood cell.29 Approximately 50% wood composition is
cellulose, while hemicellulose and lignin are both 25% of the remaining composition.25 Cellulose
is a sugar molecule that is a polymer composed of repeating units. Cellulose composes the cell
walls and sturdiness of the wood. Hemicellulose is found in the cell walls as a polymeric
carbohydrate with a random structure that is less strong than cellulose. Lignin is a polymer that
adds to the strength of the wood molecule while acting as an adhesive keeping cells closely
bound and aiding in keeping trees upright.29
Although the pyrolysis of wood will be significant in the breakdown of these cellulosic
components, the molecular composition of the wood is not the only concern. Solvents and
finishes that are applied to wood flooring, commonly found in commercial homes, will impact
the chromatographic profile of a burned wood material.30 Analysts cannot dismiss the possibility
of additives being applied to the wood, as the chosen material can seep within the wood and

15
persist. It has been reported in previous studies that through thermal degradation, wood has
produced toluene, styrene and limonene readily observed in the chromatographic profile.20, 23, 28
From finishing to fire retardant treatment, the composition of commercial flooring should
be analyzed diligently to observe if there was an impact from the additives on the
pyrolysis/combustion products within the chromatographic profile. Fire retardant is used to delay
ignition, reduce heat release and attempt to reduce the spread of the flame.31 In fact, the wood
structure will absorb the additive, where the cell walls will act as pores and take in fire retardant
in an attempt to protect the structure from fires. Fire retardants aim at delaying the ignition time
and the rate of heat release during combustion and reduce the spreading of flames throughout the
structure.31 Char formation also plays a large role in slowing decomposition by increasing
thermal resistance between wood and pyrolysis.29 The two types of wood that were analyzed in
this research include yellow pine and plywood.
Plywood is a combination of pine wood that has been manmade with an adhesive to
allow for pieces to be stuck together on the bottom surface.2, 60 However, the top surface is
composed of plywood material. Pyrolysis of the material should yield contribution from both
surfaces plus the addition of any additives that may been used in the manufacturing process.
Other woods are used without being affixed through an adhesive, like yellow pine, but may have
finishes or fire retardants that can alter the chromatographic profile. Addition of ignitable liquid
only increases the difficulty of attempting to identify the components that are found in fire debris
with potential interferences from multiple sources in the wood. Background interference is
dependent on all possible contributions on the origin of the substrate.23 Realizing the impact
coatings and finishes can have on wood materials will allow the analyst to consider the path of

16
the fire. Additionally, where certain burned and unburned samples need to be collected to better
accurately observe and identify potential pyrolysis/combustion products during the analysis
process is important as well.
2.2.3 Processed Flooring
In addition to carpets and woods, other flooring materials are common both in residential
and business structures. Processed flooring is synthetically created using additives and raw
materials, combining them and recreating a final product with some sort of finishing. The
amalgamation of multiple layers or materials to create a synthetic product is the cornerstone of
these products. Adhesives will most likely be representative in the chromatographic profile that
will result from pyrolysis of a sample of this flooring type.20 Ultimately, the background
interferences observed will depend on the origin of the substrates being analyzed.23 No matter
the material used in the creation of flooring, the material and synthetic combination will have a
strong influence on the spread of fire and alter the fuel load and ease of ignition. Thus, this will
affect the overall contribution on the fuel content that is reflected in the pyrolysis product
profile.2 Two common examples of these processed floors are vinyl and laminate flooring.
Vinyl flooring is a product that is made in combination with vinyl resin and different
plasticizers, stabilizers, pigments and fillers to create a finished amalgamation of adhesive and
building material.32 Vinyl flooring is currently one of the most popular types of flooring chosen
by consumers.33 In recent studies, an analysis of vinyl flooring revealed a number of volatile
components like toluene, C2 and C3 alkylbenzenes detected in pyrolyzed vinyl flooring.23 Several
layers compose the vinyl flooring material that include a wear layer, print layer, foam layer, and

17
felt backing layer.33 Similar to carpeting, vinyl flooring contains multiple layers that are held
together with an adhesive that is applied between the layers to ensure the material will not
deteriorate or peel easily. In addition to adhesive, plasticizers are utilized in the mixture of vinyl
flooring specifically 2,2,4-trimethyl-1,3-pentanediol diisobutyrate (TXIB) and normal alkanes,
which have recognizable ignitable liquid residue patterns when analyzed.33 Polyvinyl chloride
(PVC), a synthetic plastic, is utilized in the manufacturing of vinyl flooring and treated with
plasticizers to improve rigidity.34 Possible interference results from the plasticizers mixed with
the volatile components have been observed from analyzing vinyl flooring fire debris exhibiting
the difficulty in understanding the chromatographic profile.
Laminate flooring is a synthetic product that is composed of multiple layers sealed
together through a manufacturing process. Similar to vinyl flooring, there are four distinct layers
to laminate flooring that include: wear resistant layer, decorative print layer, core layer made of
fiberboard and a backing layer for support.35, 36 The wear resistant layer is composed of
melamine which acts as a fire retardant material and is the topmost clear covering.36 The
decomposition of the polymer utilized in laminate flooring production, poly(melamine-co-
formaldehyde), yields products such as methanol and formaldehyde.34 Wood based-products may
contain important variations in their pyrolysis processes that are difficult to predict.
The pyrolysis of cellulosic products, which includes wood-based products like laminate,
will decompose to commonly yield 2-furaldehyde, 2-furanmethanol (also known as furfuryl
alcohol), and 5-methyl-2-furancarboxaldehyde (also known as 5-methylfurfural).10 The
definition of laminate, in fact, is the bonding together of two or more layers of material.37 There
are no adhesives that are used to combine the different layers together for this type of flooring, so
18
there will be no potential interference in the chromatographic profile from adhesives. However,
there is potential for there to be fire retardant material on the outer layer of the laminate flooring
and the flooring to burn from the inside out. A space is created between the laminate flooring and
the sub-flooring material where it “floats freely” above the sub-flooring.38 Laminate flooring is
likely to be burned from beneath as it allows the fire to spread upwards and limits any chance at
isolating the flame to one specific area.2
2.3 Extraction and Analysis of Interference Points
Along with possible pyrolysis/combustion products that can be observed
chromatographically, it is important to realize that additional interference patterns from ignitable
liquid residue may also be observed within fire debris evidence. Decomposition products formed
during the pyrolysis processes will be released into the gas phase, where they could react with
other pyrolysis products or undergo partial or complete combustion reactions. Some pyrolysis
products remain in the fire debris and are released during the analytical process. The amount of
pyrolysis/combustion product that is consumed or released depends on the material analyzed and
the burn method utilized. Ignitable liquid residue may add additional contributions to the
chromatographic profile of a sample, increasing the complexity of the chromatographic profile.
Depending on the type of substrate that is being burned, and if an ignitable liquid was
administered on or near the material, both ignitable liquid residue and pyrolysis/combustion
products can cause background interference in the analysis of the produced chromatogram.
The possible detection of ignitable liquid residue in fire debris will be displayed through
the combination of extraction method ASTM E1412-12 and analysis and interpretation method

19
ASTM E1618-14. ASTM E1412-12 is the passive headspace sampling method and it is the most
commonly used extraction method because it is extremely sensitive and essentially
nondestructive.39, 40 The method is ideally completed by suspending a 100 mm2 activated
charcoal strip (ACS) in the sample container and placing it into an oven for 16 to 24 hours.39, 41
The ACS is utilized for adsorption of the residue from the sample, but if the correct parameters
are not observed, product may be lost. The analyst must ensure the sample is heated at an
appropriate temperature as too little or too much heat may be insufficient to volatize components
or displace more volatile pyrolysis product respectively.39 Under ideal conditions, the analyst can
observe the full range of hydrocarbons from C6-C20 on the activated charcoal strip with the
correct analytical technique ASTM E1618-14.42 ASTM E1618-14 is the standard test method for
analyzing samples from fire debris using GC-MS instrumentation.6
GC-MS, or gas chromatograph-mass spectrometer is the “gold standard” for analysis of
possible ignitable liquid and pyrolysis/combustion product in fire debris samples. The E1618-14
method utilizes CS2 as a solvent to displace the residue adsorbed onto the charcoal strip. A
syringe is used to inject the extract into the instrument. The gas chromatograph is where the
mixture will be separated in a column before it is sent to the mass spectrometer for detection. It
takes time for the molecules to traverse the column and reach the mass spectrometer for
detection. The time it takes for the molecules to travel through the column is referred to as the
retention time, which is utilized to identify the presence of different components in the sample.
There is a specific breakdown of molecules into smaller fragments within the MS source. The
peak pattern and target compounds are identified by the analysts and cross referenced against a
database.43 A qualitative search of an ignitable liquid database for comparable components and

20
similar product pattern to those found within the sample aids in the identification of ignitable
liquid residues. A similar search of a substrate pyrolysis database can help to explain
components arising from pyrolysis. Ultimately, the analyst must have the experience,
knowledge, and understanding to interpret results based on the match quality. The classification
of ignitable liquids and the subsequent sub-classification is done by following the ASTM E1618-
14 classification guide.6 The penultimate question is whether an analyst can identify the
chromatographic patterns of fire debris as substrate pyrolysis/combustion products and possible
addition of ignitable liquid residue when it is present within the mixture. An ignitable liquid is
not always discovered, but looking at the total ion chromatogram (TIC) and extracted ion
chromatograms (EIC) yields valuable information about the pyrolysis/combustion products
present in the substrate from the fire debris.
2.4 Automated Fire Debris Classification
Attempting to classify ignitable liquids into the ASTM E1618-14 classes and subsequent
sub-classifications by hydrocarbon range is important when analyzing samples that are collected
from a fire scene. Classifications can be automated and fire debris better understood by
compiling and analyzing existing data. Principal component analysis, or PCA, offers several
advantages and insights into fire debris classification and analysis. Principal component analysis
allows for the reduction of dimensionality by combining factors that are being interpreted for a
given set of data.44 PCA is ideal when working with multivariate data because it allows the
analyst to reduce the number of variables that will be utilized in interpretation of data.45
Chromatographic profiles will be clustered to be in arrangement with the previously mentioned

21
ASTM E1618-14 classification system for ignitable liquid classes.6 Total ion spectra (TIS) for
ignitable liquids, pyrolysis samples and fire debris will be simplified with the aid of PCA. Scores
from the first three principal components will provide enhanced understanding of fire debris. The
TIS corresponds to the average mass spectrum across the chromatographic profile for a given
sample.43 The TIS of the fire debris will be analyzed by PCA and the scores from the first three
principal components (PCs) will be plotted and labeled by their ASTM E1618-14 classifications.
These plots will be useful in displaying the similarity between the fire debris data and compared
database data sets. Two particularly interesting ignitable liquid classes are gasoline and distillate.
Distinct patterns of specific major ions appear in gasolines regularly and a dominant Gaussian-
like shape of the spectra in pure distillates.6 Because of the defining pattern seen within the
composition of non-weathered gasoline and distillates in the chromatographic profile, an analyst
is more likely to recognize the source of the pattern and identify the classification of ignitable
liquid based on the ASTM E1618-14 classification system.
TIS is one of several data representations that have been studied as alternatives to the
TIC. Sigman et al. extensively studied the use of covariance mapping of different groups of
ignitable liquids from the ASTM classification guide to allow for groupings of chromatographic
ion data to physically plot on or toward a region of ignitable liquid.46,47 The covariance map of a
sample could be searched against a library of standards for ignitable liquids and substrates to
identify those most similar to the sample. This will allow similar grouped burn data points to be
observed graphically. To overcome the complexity and data storage challenges, Sigman et al.
simplified the data representation by summing the intensities of each ion over the
chromatographic profile to output the TIS.43 The TIS has been used as the data representation for

22
automated chemometric-based classification of fire debris as positive or negative for ignitable
liquid residue and for classification of residue into the ASTM E1618-14 classes.48, 49 TIS allows
for inter laboratory comparisons, as the retention time no longer complicates the data
representation.11 This facilitates quicker interpretations of ignitable liquids against a database.

23
CHAPTER 3: METHODS/EXPERIEMNTATION
3.1 Materials
Eight different flooring substrates (polyester, nylon, and olefin carpeting, laminate
flooring, vinyl flooring, yellow pine, plywood, and carpet padding) were utilized in the burning
process for this experimentation. Three different mixtures using polyester carpeting and carpet
padding (polyester and padding, polyester and padding with distillate, and polyester and padding
with gasoline) were created to simulate what would likely be observed in an actual fire with
carpet padding residing under the top carpet layer. The ignitable liquid addition in two mixtures
will be used to display the impact of different ignitable liquids to substrate material. The flooring
material was purchased from Home Depot® near Orlando, Florida. The ignitable liquids that
were collected for use in the mixtures were from the Ignitable Liquid Reference Collection
(ILRC) maintained by National Center for Forensic Science (NFCS). The ignitable liquids
utilized exclusively for the mixtures were SRN 30 (Klean-Strip® Odorless Mineral Spirits) for
distillate and SRN 105 (Phillips 66® Unleaded Regular Gasoline; neat liquid) for gasoline. Paint
cans were of 1 quart size and purchased online from bestcontainers.com retailer. Activated
charcoal strips were purchased from Albrayco Technologies Inc. and crimp top vials used for
analysis were purchased from Thermo Scientific. A Carbolite brand tube furnace was utilized for
the tube furnace burn method. GC-MS instrumentation, 5977E MS/7890B GC, was purchased
from Agilent Technologies and used for the analysis portion of this experimentation with the
Chemstation software. A purchased library from the National Institute of Standards and
Technology (NIST) and the compiled ILRC database were employed for comparison of spectra

24
with fragmentation identification. PCA calculations and projections onto contour mapping
plotted regions were performed using the freeware software, R.
3.1.1 Large Scale Burn Data Set
The large scale burns (LSB) were completed at the Florida Fire College using four 2.4 x
2.4 x 6.1 m3 Konex shipping containers that were constructed to simulate a two room structure
that would be found in a real world scenario.51 Containers were constructed with sheetrock walls
and ceilings. Each shipping container housed similar items that would be found within common
homes. A window opening was at the rear of the containers that would allow for minimal control
of the air that could potentially support the strength of the fire. Additionally, building and
flooring materials in chairs, carpet, carpet padding, sofas, tables, beds, and dressers were all
found within the shipping containers. The backroom housed the bed and dresser to simulate a
bedroom. The front room housed the sofa, table and chair to resemble a living room. Floors were
made of plywood and were covered with carpeting and carpet padding and there was a small
space covered in vinyl or wood laminate in each shipping container. Building and flooring
material was purchased from Home Depot while the furnishing was purchased from either IKEA
or Wal-Mart. Clothing, plastic and paper items were added within some of the shipping
containers to add “fuel” to the fire and present additional material that could be found within the
analysis of the burns that would be completed. 500 mL of different ignitable liquid classes were
used in separate containers, where one specific ignitable liquid was used for each different
shipping container. The ignitable liquid was poured from the front of the container near the
couch and lead back towards the bed. The fire was started when a fire fighter used a torch near
25
the couch. The fires lasted for 5 to 15 minutes in duration and usually “flashover” occurred.
Flashover ensues when all fuels within a room burst into flaming combustion simultaneously and
could occur if the window opens and ventilation changes allow a fresh source of air to enter the
system.5 After the fire persisted for the allotted time duration, fire fighters would extinguish the
fire using water. An initial cool down period would take place, then material was collected near
the ignitable liquid pour trail and material was collected away from the pour path for comparison
purposes. The material samples were analyzed using the GC-MS instrumentation and the ASTM
E1618-14 method. Classification of the experimental fire debris was performed by an “informed
analyst” who had knowledge of the ignitable liquid that was used to initiate the fires and
examined the outputted chromatographic profiles in an attempt to determine if any patterns from
the liquid could be observed.50 If any trace ignitable liquid pattern was observed, then the analyst
classified the sample as IL otherwise the analyst classified the sample as SUB. If the analyst
observed a pattern that was similar to pyrolysis product formation, then the analyst would
recognize that and label the sample as SUB. The data set is composed of 159 different IL and
SUB samples that were collected and analyzed by NCFS. Ideally, these fire scenarios will be
representative of casework fire debris that would be collected from arson scenes.
3.1.2 Neat IL/SUB Data Set
The neat ignitable liquid (IL) and substrate (SUB) data set is a collection of pure ignitable
liquids and substrates that have been analyzed using GC-MS instrumentation. The pure ignitable
liquid portion of the data set was gathered by NCFS and maintained as the Ignitable Liquid
Database and Reference Collection (ILRC), which was developed by the Technical and

26
Scientific Working Group for Fire and Explosives (T/SWGFEX) Ignitable Liquids Reference
Collection Committee (ILRCC) in conjunction with NCFS and UCF.52 The NCFS-UCF group
updates and administers the collection as well as performing analyses on additional ignitable
liquids that will be added to the database. The ignitable liquid is classified according to the
ASTM E1618-14 test method.6 Only pure ignitable liquid samples were chosen for the neat
IL/SUB data set. The substrate portion of the data set was maintained and administered by the
same ILRCC that allowed the NCFS-UCF group to perform the burns and analysis of the
substrates within their laboratory.53 All of the current substrates that are found within the
Substrate Database were burned and analyzed using the Modified Destructive Distillation
Method (MDDM) burning method. The ASTM E1412 standard method was used to passively
collect the headspace adsorption onto the suspended activated charcoal strip. These substrate and
ignitable liquid data sets were collected into a data set in 2014 with 567 representative samples
composed of 445 pure ignitable liquid and 122 substrate samples.50 A comparison of the neat IL
and SUB data to casework fire debris and laboratory burn data will be explored further within the
Results and Discussion section of this research.
3.2 Laboratory Burning Methods
Controlled heating of flooring materials was completed in an attempt to replicate fire
debris samples that would be observed in real world situations. The controlled heating was
completed using four separate burn methods to compensate for the variances that are seen from
one fire to another. The first burn method is a modified version of normal destructive distillation
method, which was produced by the Florida Bureau of Forensic Fire and Explosive Analysis

27
(BFFEA).54 It is important to note that the “top” surface of the material is a reference to the side
of the material that would normally be initially exposed to the flame during a fire. The “top” will
be used to indicate side of the material that will be exposed to the heat source for the application
of these different methods. Each burn method is performed within a fume hood for safety
purposes. An attempt to be consistent in each burn method for each substrate is important to
increase reproducibility among experiments.
3.2.1 Modified Destruction Distillation Method (MDDM)
Modified destructive distillation method (MDDM) requires placing a substrate that is 5 x
5 cm into a paint can taking note of the “top” side of the material that will be placed facing the
bottom of the can. The lid of the paint can will be punctured with nine holes about 1 mm in
diameter and placed onto the labeled paint can with information as to the composition of the
material being burned, method being used and the laboratory burn time. The paint can is placed
onto the ring apparatus that will allow for the paint can to sit directly above the flame, which is
placed about 4 cm away from the bottom of the paint can, as displayed in Figure 5. Three
different burn time intervals of 30 seconds, 1 minute, and 2 minutes were used for each substrate.
Timing is started when smoke first appears. The flame is continuously applied to the bottom of
the can for the allotted time. After heating has persisted for the designated time period, the heat
is removed and the hole-punched lid is immediately replaced with a new lid containing no holes,
to contain the substrate product within the can. The can is allowed to cool to room temperature
before being placed into an oven for the extraction process. An activated charcoal strip is
suspended by un-waxed dental floss in the headspace of the paint can and placed into the oven to
28
allow the extraction process to occur that is described in depth in the Passive Headspace
Adsorption Technique for Extraction method section that is discussed later in this research.
Figure 5: MDDM Burning Method and Passive Headspace Extraction Method
3.2.2 Top Heat Burn Method (TH)
The top heat (TH) method requires placing a substrate that is 5 x 5 cm into a tin boat that
is constructed in a way similar to the one in Figure 6. The substrate should be able to sit
completely in the tin boat so that the substrate will stay contained within the boat during the
entire burn process. Burning of the substrate in this method will allow the flame to directly
impact the material instead of being burned through a material. The flame from the torch is
positioned 4 cm away from the “top” of the substrate, ensuring it is not directly touching the

29
material. Timing of the burn is started as soon as the flame hits the material. Once again three
separate burn times were used: 30 seconds, 1 minute and 2 minutes. After the burn time has
passed, the flame is removed and the substrate is transferred in the tin boat to an unused paint
can that is labeled with the burn time and substrate information. The sample is allowed to cool to
room temperature before being placed into an oven for the extraction process. An activated
charcoal strip is suspended by un-waxed dental floss in the headspace of the paint can and placed
into the oven to allow the extraction process to occur that is described in depth in the Passive
Headspace Adsorption Technique for Extraction method section that is discussed later in this
research.
Figure 6: Top Heat Burning Method
3.2.3 Bottom Heat Burn Method (BH)
The bottom heat (BH) method requires placing a substrate that is 5 x 5 cm into a tin boat
constructed in a way similar to the previously described top heat method. The substrate should be
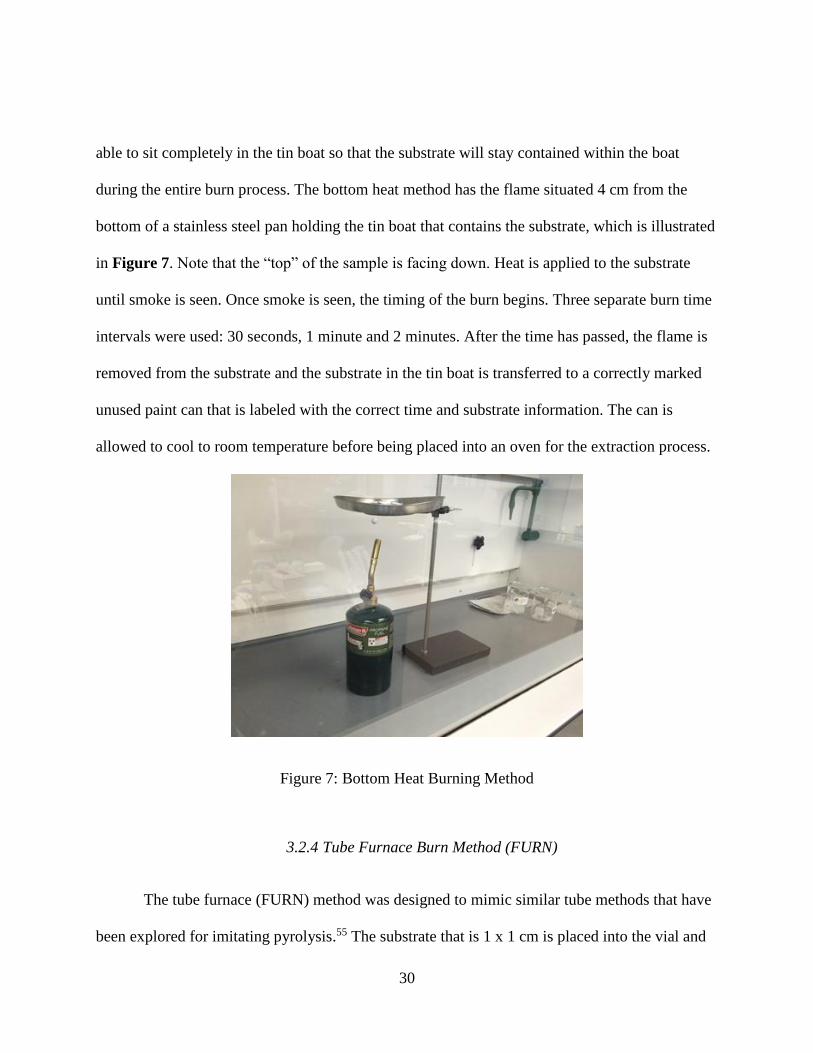
30
able to sit completely in the tin boat so that the substrate will stay contained within the boat
during the entire burn process. The bottom heat method has the flame situated 4 cm from the
bottom of a stainless steel pan holding the tin boat that contains the substrate, which is illustrated
in Figure 7. Note that the “top” of the sample is facing down. Heat is applied to the substrate
until smoke is seen. Once smoke is seen, the timing of the burn begins. Three separate burn time
intervals were used: 30 seconds, 1 minute and 2 minutes. After the time has passed, the flame is
removed from the substrate and the substrate in the tin boat is transferred to a correctly marked
unused paint can that is labeled with the correct time and substrate information. The can is
allowed to cool to room temperature before being placed into an oven for the extraction process.
Figure 7: Bottom Heat Burning Method
3.2.4 Tube Furnace Burn Method (FURN)
The tube furnace (FURN) method was designed to mimic similar tube methods that have
been explored for imitating pyrolysis.55 The substrate that is 1 x 1 cm is placed into the vial and

31
inserted into the tube furnace, as shown in Figure 8. The sample situated within a tube furnace
near to the center, where the desired temperature was noted. A temperature of 400˚C was the
target temperature that was chosen to allow for the pyrolysis of substrates within the vial. Before
situating the vial within the tube furnace, a “faux lid” is created using aluminum foil with
punctured holes in an attempt to replicate the punctured lid that was utilized in the modified
destructive distillation method and placed over the vial ensuring it is secure. Once smoke is seen,
the burn timing is started. Three separate burn time intervals were used: 2 minutes, 5 minutes and
10 minutes. After the burn time, the vial is slowly removed from the tube furnace following shut
off of the power as a safety precaution. The vial and the faux lid are punctured with a glass
stopper and allowed to cool to room temperature. Once it has reached room temperature, the
activated charcoal strip is suspended into the vial using a paperclip and a cap is tightened to seal
the opening of the vial. The vial is then placed into the oven to allow the extraction process to
occur that is described in the Passive Headspace Adsorption Technique for Extraction method
section.

32
Figure 8: Apparatus used in Tube Furnace Method
3.2.5 Ignitable Liquid Addition
The ignitable liquid addition burn procedure was performed on two substrate “mixtures”
that were done to simulate actual flooring that would commonly be found in homes. Carpet and
carpet padding was selected as the mixture that would be analyzed using one of the previously
described methods. The method that was chosen (MDDM) was performed on the mixture
without ignitable liquid addition and with two different ignitable liquids. The chosen ignitable
liquids were petroleum distillate and gasoline due to their recognition in a spectrum based on
pattern recognition and major ion fragmentations formed and displayed to the analyst. In
preparation for the procedure, the chosen ignitable liquids were slowly added dropwise onto the
carpet and padding mixture that was layered like that of actual carpeting in a home. 500 µL of
ignitable liquid was added to the mixture using a micropipette distributing across the entirety of

33
the top surface of the carpeting. Because this was done using the MDDM method, all MDDM
methodology was followed past the point where ignitable liquid was slowly added to the
substrate mixture. Sterile tongs were used to place the material within the can before the method
was applied.
3.3 Passive Headspace Adsorption Technique for Extraction
The laboratory oven is set to 66˚C and the pyrolyzed substrate sample in the quart paint
cans is heated for 16 to 18 hours. The activated charcoal strip is suspended into the headspace of
the can and the lid is resealed prior to heating. This allows enough time for the transfer of
material from the side walls of the paint can or the pyrolyzed sample and adsorption onto the
activated charcoal strip. The passive headspace adsorption technique is perfect for extracting
ignitable liquid residues over the entire range of concentration due to its high level of sensitivity
and non-destructive nature.39 When the paint can is placed into the oven with the activated
charcoal strip, the pyrolysis product will vaporize and adsorb preferentially onto the carbon strip,
which results in extraction of the components that derive from heating of the substrate. A 100
mm2 area carbon strip is utilized for extraction of the products at temperatures below 80⁰C
because a higher temperature can cause the increase of concentration of headspace. An increase
in the concentration of headspace will increase the likelihood of displacement of lighter volatiles
by heavier, less volatile residue.41 After the substrate is heated, the paint can is removed from the
oven and allowed to cool to room temperature.

34
3.4 GC-MS Instrumental Parameters
All samples were analyzed on an Agilent 7890B gas chromatograph with a G4567A
series autosampler and interfaced to a 5977E mass spectrometer. The samples are introduced
through a split injector and 1 µL of sample was split 50:1 and is injected at a temperature of
250°C. The initial oven temperature was held at 50°C for three minutes and then ramped up at a
rate of 10°C per minute until it reaches 280°C and held for four minutes for the total run time of
thirty minutes. The chromatographic column is a HP-1 methyl siloxane column of 0.2 µm
diameter, 24.36 meter length, 0.50 µm thickness and 38 cm per second linear velocity. Helium
gas was maintained throughout the system at a constant flow of 34 cm per minute on the column.
The mass analyzer scanned from 30 to 350 m/z where the detector is turned off between 1.54 to
2.00 minutes that was programmed as a timed event to account for solvent delay. An additional
timed event turns off the detector from 1.08 to 1.13 minutes to avoid air peak elution. The mass
spectrometer quad temperature was set to 150°C and the source temperature at 230°C and both
are monitored and maintained.
3.5 GC-MS Analysis Process
The paint can from the extraction process is unsealed after cooling to room temperature
and the carbon strip is removed. The carbon strip is placed into a vial with 500 µL of CS2 that
will act as a solvent extract material off of the activated charcoal strip. The extraction of material
from the adsorbed carbon strip into carbon disulfide, CS2, provides a sample for subsequent GC-
MS analyzes. CS2 is used as a solvent because it is a better absorber and will displace the
hydrocarbon residue that has been adsorbed by the activated charcoal strip. When the carbon
35
strip is submerged in the CS2 in the vial during this analysis process, the GC-MS will be able to
identify the pyrolysis/combustion products that were formed during the burning process and
extracted from the headspace of the can. It is important for the CS2 solvent to have greater
affinity to activated charcoal than the adsorbed components from the substrate material and for
the adsorbed molecules to be readily soluble in the solvent.4 The vial is labeled appropriately
with the method used, sample composition and the laboratory burn time used for that particular
run. The chromatographic profile is analyzed to detect and identify the major components and
the information is recorded for comparison purposes that will later be discussed in the Results
and Discussion section.

36
CHAPTER 4: RESULTS AND DISCUSSION
4.1 Fire Debris Samples
In order to recreate fire debris samples for the purpose of interpreting fire debris results,
nine different flooring substrates were burned within a laboratory using four different burn
methods. Different laboratory burns were completed with three different burn times to simulate
real world fire debris with differing levels of pyrolysis/combustion products. Each substrate (or
substrate mixture) has a total of 12 different burns that were compared to reflect the variability in
the laboratory burn methods and the resulting chromatographic profile of each burned substrate.
The materials used include: polyester carpeting, nylon carpeting, olefin carpeting, carpet
padding, vinyl flooring, laminate flooring, yellow pine, plywood, and polyester/padding mixture.
These materials were discussed extensively in the Materials section of this research, but were
revisited for the observation of the pyrolysis/combustion products found within each
chromatographic profile of each substrate. In all, 108 laboratory burns were analyzed,
interpreted, and projected against both “real world” fire debris and neat ignitable liquid and
substrate data sets. All substrate laboratory burn data projected neatly into both LSB and neat
IL/SUB PC spaces. Therefore, similarity between the laboratory burns and the different data sets
could be observed. Analysis of projected laboratory burn data into the LSB and neat IL/SUB PC
spaces and TICs of the laboratory burns yielded information regarding the similarities and
differences between the laboratory burn methods.

37
4.2 Projection of In Silico Data into Fire Debris Data Sets
Sigman et al. prepared a data set by mixing the total ion spectrum from ignitable liquid
with the total ion spectrum from randomly selected substrate data that served as a training set for
fire debris model development.50 If any ignitable liquid contribution was present in a sample, it
was labeled as ignitable liquid and samples that contained no presence of ignitable liquid
contribution were labeled as substrate. Therefore, a sample that was labeled as ignitable liquid
had at least 1% of ignitable liquid contribution. The ignitable liquid database that was utilized in
creating fire debris models was the ignitable liquid reference collection (ILRC) database
administered by the National Center for Forensic Science (NCFS). The Substrate Database is
currently administered by NCFS and ILRC Committee of the Technical Working Group for Fire
and Explosives (TWGFEX). The Substrate Database currently contains 212 common household
building materials and furnishings at the time of this project.53 Only one controlled laboratory
burn method, MDDM, was utilized in the preparation of burned substrate material for the
Substrate Database.
Principal component analysis was completed on large scale burn (LSB) and neat IL/SUB
data sets to produce scores and eigen vectors. Scores are compiled and plotted onto a principal
component space that displays the relative variance covered for a chosen number of principal
components. For purposes of this research, the first three principal components (PCs) were
utilized. The first three PCs covered 74% of the variance in LSB data. The first three PCs
covered 61% of the variance in neat IL/SUB data. Contour maps of substrate and IL scores are
plotted for the LSB and neat IL/SUB PC spaces.

38
LSB PC space contained the map of the contour region of the mixture of ignitable liquid
and substrate from the analysis of burned material that was collected within the large scale burn
data set. Projection of pure ignitable liquid and substrate data into the LSB PC spaces displayed
the potential difference between the substrate and ignitable regions within the LSB contour. The
pure ignitable liquid and substrate data was not mixed compared to the burn data contained
within the LSB data set. Therefore, if there was a distinction between the SUB/IL regions within
the LSB contour, it would be observed within this projection of pure IL and SUB data points.
The projection onto the three principal component spaces is displayed in Figure 9.
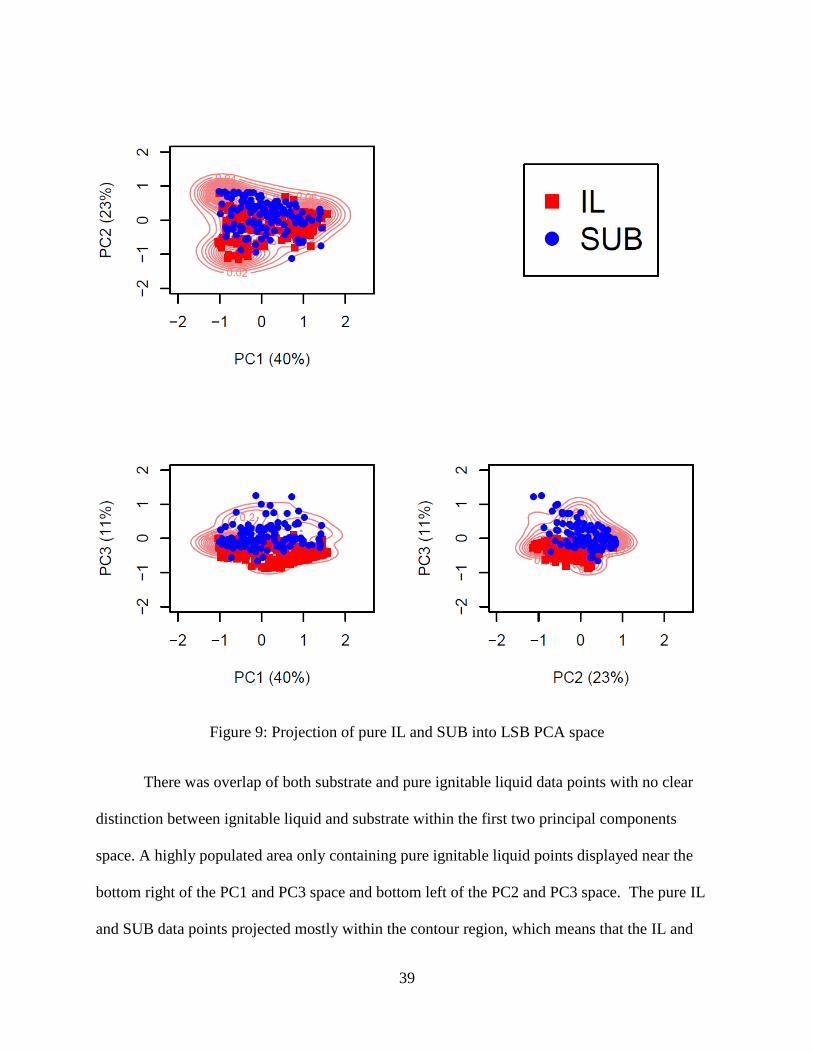
39
Figure 9: Projection of pure IL and SUB into LSB PCA space
There was overlap of both substrate and pure ignitable liquid data points with no clear
distinction between ignitable liquid and substrate within the first two principal components
space. A highly populated area only containing pure ignitable liquid points displayed near the
bottom right of the PC1 and PC3 space and bottom left of the PC2 and PC3 space. The pure IL
and SUB data points projected mostly within the contour region, which means that the IL and

40
SUB data was similar to the LSB data set. The projection of the in silico data set into the LSB
contour region further revealed the similarity of the data to the LSB burn data set, but
classification of data points as either substrate or ignitable liquid cannot be completed.
For the in silico data set, only the first two principal components were utilized. The in
silico data set acted as a test set against the model LSB contour region. Projection of in silico
data into the LSB space displayed the similarities between IL and SUB data and the LSB data
set. Figure 10 below displays the projection of in silico data points into the LSB PC space.
Figure 10: Projection of in silico data into large scale burn PCA space

41
Projection of in silico data into the large scale burn principal component space revealed
the similarity between in silico data and LSB fire debris. No clear distinction between ignitable
liquid and substrate regions could be made as Figure 9 displayed previously. The points labeled
as ignitable liquid that were projected likely included a percentage of substrate as the data set
was a mixture of both substrate and ignitable liquid data. As expected, the in silico data projected
into the large scale burn PC space neatly as both data sets contained ignitable liquid and substrate
data. The computational in silico data set was similar to the large scale burn data.
Two distinct classifications, designated SUB and IL, corresponded to samples containing
only pyrolysis and samples containing pyrolysis and ignitable liquid residue (ILR), respectively.
The IL designation could be further sub-divided into ignitable liquid classes defined by ASTM
E1618-14. The substrate sample region was identified with the “SUB” marker and the “IL”
region included the ASTM classes with various class-clustering regions being marked on the
contour. The different ignitable liquid classes included in the data set were: aromatic (AR),
oxygenate (OXY), normal alkane (NA), petroleum distillate (PD), gasoline (GAS), isoparaffinic
(ISO), naphthenic paraffinic (NP) and miscellaneous (MISC). Projection of the in silico data into
the neat IL/SUB PC spaces displayed the similarity between the in silico data and the neat
IL/SUB data sets. The projection exhibited the challenge in attempting to discriminate in silico
points as either ignitable liquid or substrate as the in silico data points projected into both
substrate and IL regions. Projection of in silico data into IL/SUB PCA space was performed and
displayed in Figure 11 with ignitable liquid regions (in red) and substrate regions (in blue)
labeled.

42
Figure 11: Projection of in silico data into neat IL/SUB PCA space
In silico data projected into the contour mapping region of IL and SUB presented in the
neat IL/SUB PC plot due to in silico data being a mixture from the neat IL/SUB data set. It
closely resembled the neat IL/SUB data set within the projection as most points tended to
correspond to either the substrate or ignitable liquid regions. However, few points projected
outside of the contour mapping region of neat IL/SUB. Some projected in silico points that were
labeled as IL contained contribution from substrate leading to projection of points toward the
SUB contour region. Projected data points outside of the contour region in the principal

43
component space could be viewed as substrate and ignitable liquid mixtures that were not
represented in the database or occur infrequently. Expansion of the database with additional
substrates using other laboratory burn methods increased the coverage of the database.
Flooring substrates were the focus of this research. The Substrate database currently
contains laboratory data for burns that were performed by the MDDM burn method only burned
for 2 minutes. Analysis and interpretation of additional pyrolysis products within
chromatographic burn profiles allowed for the further expansion of the database. The TIS from
laboratory burns completed for this research were projected into both the previously shown LSB
and neat IL/SUB PCA spaces. The results facilitated an increased understanding of how
additional substrate pyrolysis methods and products can enhance the Substrate database.
4.3 Polyester Carpeting
4.3.1 Projection of Laboratory Burns into Fire Debris Data Sets
Polyester carpeting burns were completed using four different laboratory burn methods
(MDDM, BH, TH, and FURN) with three different burn times and projected into the same
principal component space and map of the contour regions that were used for projection of the in
silico data. Laboratory burn data was projected into LSB and neat IL/SUB principal component
spaces. The first three principal components were utilized for projection of polyester laboratory
burn data. Projection of the polyester laboratory burn data into the LSB PCA space is provided in
Figure 12.

44
Figure 12: Polyester laboratory burns projection into LSB PCA space
Due to similarities in the properties of BH and TH methods, they were grouped together
into similar shapes and color for easier interpretation. FURN and MDDM were also grouped
together with similar shapes and color.
In the three different orthogonal views covering 74% variance in the data, all polyester
carpeting burn data projected into the LSB map of the contour region. Clustering was observed
between TH and BH laboratory burn projections. Shifts in projection of the FURN laboratory

45
burn data occurred with increase in burn time. MDDM laboratory burn data shifted slightly in
projection with increase in burn time, but clustered together. Projection of the polyester
laboratory burn data into the neat IL/SUB PCA space is provided in Figure 13.
Figure 13: Polyester laboratory burns projection into neat IL/SUB PCA space
Because the Substrate Database was composed of substrates burned using the MDDM
burn method, it was expected that each MDDM laboratory burn of polyester carpeting projected
46
within the map of the contour region of neat IL/SUB. Not only did all MDDM laboratory burns
project within the mapping space, all laboratory burn data for all PCs shown in Figure 13
projected within the contour region.
In the three different orthogonal views covering 61% variance in the data, all polyester
laboratory burns projected within the neat IL and SUB PC map of the contour region. Clustering
occurred between TH and BH laboratory burn data. Shifts in projection of the FURN laboratory
burn data occurred with increase in burn time. MDDM laboratory burn data shifted slightly, but
were clustering together.
4.3.2 TICs from Laboratory Burns
Polyester carpeting was burned using four different burning methods and three burn times
for each method. The TICs from the laboratory burns were compared between the burns. Major
pyrolysis products expected for polyester carpeting were produced from the random scission of
PET and polypropylene or polybutadiene backing of the carpeting, which yields small amounts
of aromatics like toluene, benzene and styrene. Polyester carpeting laboratory burns were
performed without any carpet padding. Pyrolysis products were confirmed through mass spectra
comparisons from NIST and ILRC NCFS compiled libraries and retention time comparison. The
TICs from the MDDM and TH laboratory methods are displayed in Figure 14. The TICs from
the BH and FURN laboratory burn methods are displayed in Figure 15.

47
Figure 14: Compounds (1) benzene, (2) toluene, (3) 2,4-dimethyl-1-heptene, (4) styrene, (5)
benzaldehyde, (6) acetophenone, (7) benzoic acid, (8) biphenyl

48
Figure 15: Compounds (4) styrene, (5) benzaldehyde, (6) acetophenone
From the above figures, multiple conclusions about the substrate and laboratory burning
methods could be reached. The MDDM burning method produced the largest number of
identified products. With increase in burn time, MDDM laboratory burn TIC peak intensities
decreased in the front portion of the chromatographic profiles, which contained volatile
pyrolysis/combustion products. Additionally, an increase in peak abundance of less volatile

49
components was observed at the tail end of the chromatogram. Thus, 2 min MDDM laboratory
burn revealed a difference in chromatographic profile relative to shorter burn times, with fewer
identified pyrolysis/combustion products in the front of the TIC. TH laboratory burns displayed
an increase of pyrolysis/combustion products throughout the chromatographic profiles. The 0.5
min TH laboratory burn showed fewer identified compounds in the TIC, compared to increasing
burn times. The 1 and 2 min TH laboratory burns displayed an increase in abundance of volatile
components in the front of the product profile. BH laboratory burns produced the least amount of
identified pyrolysis/combustion products in the front portion of the chromatographic profiles at
all burn times. Only benzaldehyde was identified in 0.5 and 1 min BH burns and benzaldehyde
and acetophenone in the 2 min BH burn. Similarities between TH and BH laboratory burns were
observed in the clustering of projections in the previous plots of LSB and neat IL/SUB PC
spaces. Similar burn product patterns were observed within the TH and BH TICs. All MDDM
laboratory burns of polyester carpet yielded similar chromatographic profiles. FURN laboratory
burns yielded few observed pyrolysis/combustion products in the front of the TIC with only
styrene, benzaldehyde and acetophenone identified.
Across all polyester laboratory burns, benzaldehyde was present in all chromatographic
profiles. Intense benzaldehyde product was observed in the front portion of the chromatogram,
possibly due to oxidation of toluene. Toluene, a major component commonly found within
gasoline, was a product that was observed in the 0.5 min and 1 min MDDM laboratory burns.
Polyester in combination with carpet padding will be discussed later within this research.
Different burn method parameters and the laboratory burn time affected the chromatographic
profile of polyester pyrolysis/combustion products that were produced.
50
4.4 Nylon Carpeting
4.4.1 Projection of Laboratory Burns into Fire Debris Data Sets
Nylon burns were completed using four different laboratory burn methods (MDDM, BH,
TH, and FURN) with three different burn times and projected into the same principal component
space and map of the contour regions that were used for projection of the in silico data.
Laboratory burn data was compared graphically to LSB and neat IL/SUB principal component
spaces. The first three principal components were utilized for projection of nylon laboratory burn
data. Projection of the nylon laboratory burn data into the LSB PCA space is provided in Figure
16.

51
Figure 16: Nylon laboratory burns projection into LSB PCA space
As stated for the previously discussed substrates, BH/TH and MDDM/FURN were
grouped together due to their similarities in properties. In the three different orthogonal views
covering 74% variance in the data, all laboratory burn data projected into the LSB map of the
contour region. Clustering was observed between TH and BH laboratory burn projections.
Additional clustering was observed between MDDM and FURN laboratory burn projections.

52
Projection of the nylon laboratory burn data into the neat IL/SUB PCA space is provided in
Figure 17.
Figure 17: Nylon laboratory burns projected into neat IL/SUB PCA space
Because the Substrate Database was composed of substrates burned using the MDDM
burn method, it was expected that each MDDM laboratory burn of nylon carpeting projected
within the map of the contour region of neat IL/SUB. Not only did all MDDM laboratory burn

53
data project within the contour space, all laboratory burn projections shown in Figure 17
projected within the contour region.
In the three different orthogonal views covering 61% variance in the data, all nylon
laboratory burns projected within the neat IL and SUB PC map of the contour region. Clustering
occurred between the TH and BH laboratory burn projections. The 2 minute FURN and MDDM
laboratory burn data clustered as well. BH and FURN laboratory burn data did not cluster and
were noticeably different in all three orthogonal views. Shifting in projection of the FURN
laboratory burn data occurred with increase in burn time.
4.4.2 TICs from Laboratory Burns
Nylon carpeting was burned using four different burning methods and three burn times
for each method. The TICs from the laboratory burns were compared between the burns. Major
pyrolysis products expected for nylon carpeting were produced from the random scission of
either Nylon 6 or Nylon 6-6 polymers and propylene or polybutadiene backing of the carpet.
Pyrolysis of propylene or polybutadiene backing of carpet yielded small amounts of aromatics
like toluene and styrene. Nylon 6 underwent random scission and additional depolymerization
that yielded caprolactam.25, 56 Nylon carpeting laboratory burns were performed without any
carpet padding. Pyrolysis products were confirmed through mass spectral comparisons from
NIST and ILRC NCFS compiled libraries and retention time comparison. The TICs from the
MDDM and TH laboratory methods are displayed in Figure 18. The TICs from the BH and
FURN laboratory burn methods are displayed in Figure 19.

54
Figure 18: Compounds (1) toluene, (2) 2,4-dimethyl-1-heptene, (3) styrene, (4) benzaldehyde,
(5) alpha methylstyrene, (6) acetophenone, (7) caprolactam, (8) biphenyl, (9) naphthalene

55
Figure 19: Compounds (2) 2,4-dimethyl-1-heptene, (3) styrene, (4) benzaldehyde, (5) alpha
methylstyrene, (6) acetophenone, (7) caprolactam
From the above figures, multiple conclusions about the substrate and laboratory burning
methods could be reached. As observed for polyester carpeting, the MDDM burning method
produced the largest number of identified products. The 0.5 and 1 min MDDM laboratory burns
56
observed an increase of less volatile components in the front portion of the chromatographic
profiles. The 2 min MDDM laboratory burn displayed intense peaks of less volatile components
at the tail end of the chromatogram. TH laboratory burns of nylon carpeting exhibited an increase
of volatile components in the front portion of the chromatograms with increasing burn time. BH
laboratory burns exhibited an increase in the number of identified pyrolysis/combustion products
in the front of the TIC with increasing burn time. The 2 min BH laboratory burn TIC observed
additional volatile components in the front portion of the chromatogram. With increasing burn
time, FURN laboratory burns displayed a decrease in volatile components in the front of the
TICs. The 10 min FURN burn displayed increased peak abundance of caprolactam compared to
the other FURN laboratory burn times. Similarities between TH and BH laboratory burns were
observed in the clustering of projections in the previous plots of LSB and neat IL/SUB PC
spaces. All MDDM laboratory burns of nylon carpet yielded similar chromatographic profiles
and clustered together in previous plots of LSB and neat IL/SUB PC spaces.
Caprolactam was identified in all chromatographic profiles of nylon carpet laboratory
burns except in the BH laboratory burns. Identification of caprolactam was important within
synthetic nylon carpeting; it could be indicative of the Nylon 6 polymer being utilized in the
manufacturing process. There was an increase of caprolactam peak abundance with increasing
burn time within MDDM, TH and FURN laboratory burn TICs. Across all nylon laboratory burn
profiles, benzaldehyde was present in all chromatographic profiles in the front portion of the
chromatograms. Different burn method parameters and laboratory burn time affected the
chromatographic profile of nylon pyrolysis/combustion products that were produced.

57
4.5 Olefin Carpeting
4.5.1 Projection of Laboratory Burns into Fire Debris Data Sets
Olefin burns were completed using four different laboratory burn methods (MDDM, BH,
TH, and FURN) with three different burn times and projected into the same principal component
space and map of the contour regions that were used for projection of in silico data. Laboratory
burn data was compared graphically to LSB and neat IL/SUB principal component spaces. The
first three principal components were utilized for projection of olefin laboratory burns.
Projection of the olefin laboratory burn data into the LSB PCA space is provided in Figure 20.

58
Figure 20: Olefin laboratory burns projection into LSB PCA space
As for the analogous graphs for polyester and nylon pyrolysis, similarities in the
properties of BH/TH and MDDM/FURN allowed for grouping together into similar shapes and
color for easier interpretation. In the three different orthogonal views covering 74% variance in
the data, all laboratory burn data projected into the LSB map of the contour region. Clustering of
FURN laboratory burn data with increase in burn time was observed. Shifts in projection of TH
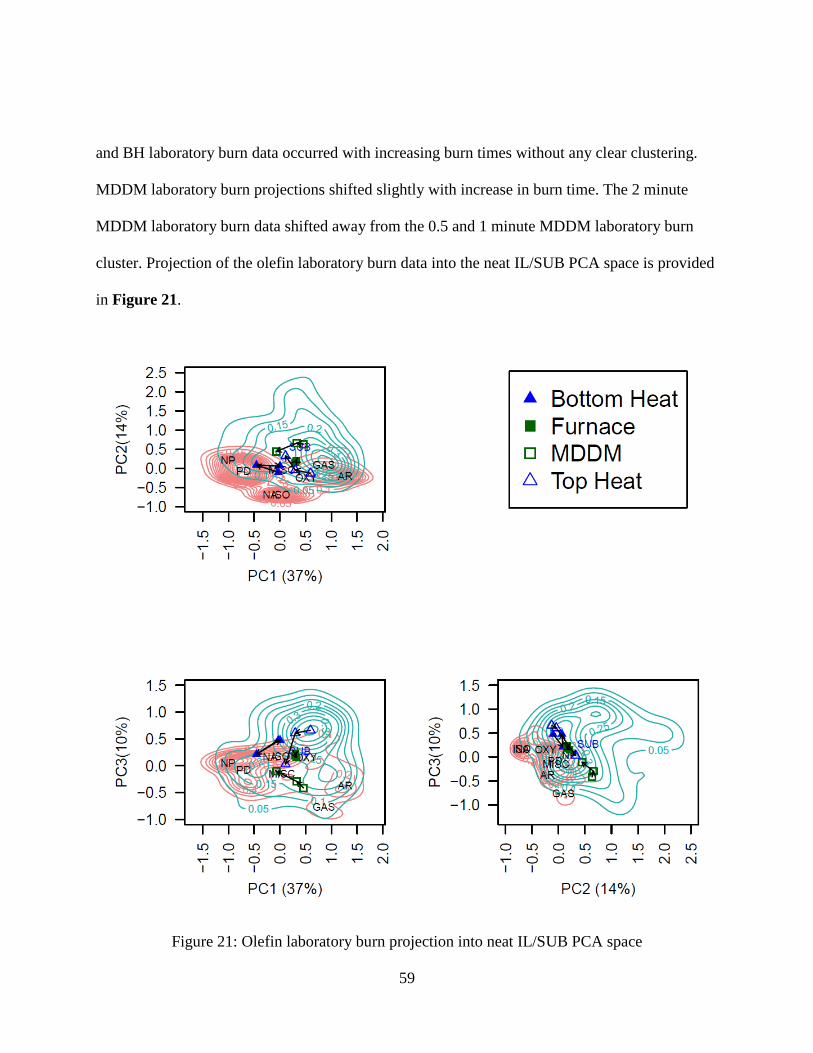
59
and BH laboratory burn data occurred with increasing burn times without any clear clustering.
MDDM laboratory burn projections shifted slightly with increase in burn time. The 2 minute
MDDM laboratory burn data shifted away from the 0.5 and 1 minute MDDM laboratory burn
cluster. Projection of the olefin laboratory burn data into the neat IL/SUB PCA space is provided
in Figure 21.
Figure 21: Olefin laboratory burn projection into neat IL/SUB PCA space

60
Because the Substrate Database was composed of substrates burned using the MDDM
burn method, it was expected that each MDDM laboratory burn of olefin carpeting projected
within the map of the contour region of neat IL/SUB. Not only did all MDDM laboratory burn
data project within the mapping space, all laboratory burn data for all PCs shown in Figure 21
projected within the contour region.
In the three different orthogonal views covering 61% variance in the data, all olefin
laboratory burns projected within the neat IL and SUB PC map of the contour region. Clustering
occurred between the FURN laboratory burn data as the points were shifting slightly with
increase in burn time. Shifting in projection occurred for the TH and BH laboratory burn data
with increasing burn time. Shifting in projection occurred for the MDDM laboratory burn data as
well with increase in burn time. MDDM and BH laboratory burn data appeared to be different
with no clustering in all three orthogonal views.
4.5.2 TICs from Laboratory Burns
Olefin carpeting was burned using four different burning methods and three burn times
for each method. The TICs from the laboratory burns were compared between the burns. Major
pyrolysis products expected for olefin carpeting were produced from random scission of
polypropylene polymer and propylene or polybutadiene backing of the carpet. Olefin carpet
laboratory burns were performed without any carpet padding. Pyrolysis products were confirmed
through mass spectra comparisons from NIST and ILRC NCFS compiled libraries and retention
time comparison. The TICs from the MDDM and TH laboratory methods are displayed in

61
Figure 22. The TICs from the BH and FURN laboratory burn methods are displayed in Figure
23.
Figure 22: Compounds (1) toluene, (2) 2,4-dimethyl-1-heptene, (3) styrene, (4) benzaldehyde,
(5) alpha methylstyrene, (6) acetophenone, (7) naphthalene, (8) biphenyl
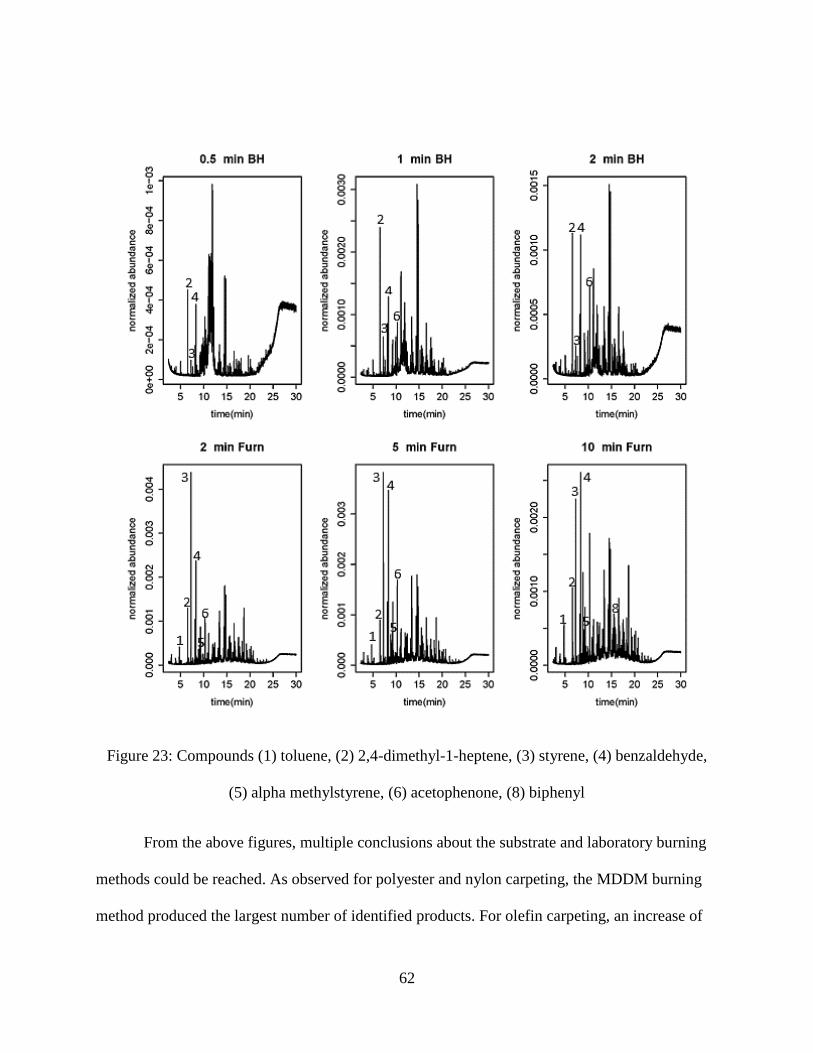
62
Figure 23: Compounds (1) toluene, (2) 2,4-dimethyl-1-heptene, (3) styrene, (4) benzaldehyde,
(5) alpha methylstyrene, (6) acetophenone, (8) biphenyl
From the above figures, multiple conclusions about the substrate and laboratory burning
methods could be reached. As observed for polyester and nylon carpeting, the MDDM burning
method produced the largest number of identified products. For olefin carpeting, an increase of

63
volatile components in the 2 min MDDM burn was observed with increase in burn time. TH
laboratory burns yielded 2,4-dimethyl-1-heptene in all TH burns. With increase in burn time,
additional pyrolysis/combustion products were identified in the 2 min TH chromatographic
profile that were not observed in the 0.5 and 1 min TH burn TICs. BH laboratory burns yielded
similar pyrolysis/combustion products in the front portion of the chromatogram with increase in
burn time. All FURN laboratory burns of olefin carpet yielded similar pyrolysis/combustion
products in the front portion of the TICs with increasing burn time.
Across all olefin carpeting laboratory burns, 2,4-dimethyl-1-heptene was present in all
chromatographic profiles. 2,4-dimethyl-1-heptene was an aliphatic compound identified within
the TICs of the other discussed carpeting burns. Within the BH and 0.5 and 1 min TH laboratory
burns, 2,4-dimethyl-1-heptene was one of the few identified pyrolysis/combustion products in
the TICs. Random scission occurred within all three different carpets burned for this research.
Styrene, another commonly identified carpet pyrolysis/combustion product, was observed in
almost all laboratory burn chromatographic profiles of olefin carpeting. Different burn method
parameters and the laboratory burn time affected the chromatographic profile of olefin
pyrolysis/combustion products that were produced.
4.6 Carpet Padding
4.6.1 Projection of Laboratory Burns into Fire Debris Data Sets
Carpet padding burns were completed using four different laboratory burn methods
(MDDM, BH, TH and FURN) with three different burn times and projected into the same

64
principal component space and map of the contour regions that were used for projection of the in
silico data. Laboratory burn data was compared to LSB and neat IL/SUB principal component
spaces. The first three principal components were utilized for projection of carpet padding
laboratory burn data. Projection of the carpet padding laboratory burn data into the LSB PCA
space is provided in Figure 24.
Figure 24: Padding laboratory burns projection into LSB PCA space
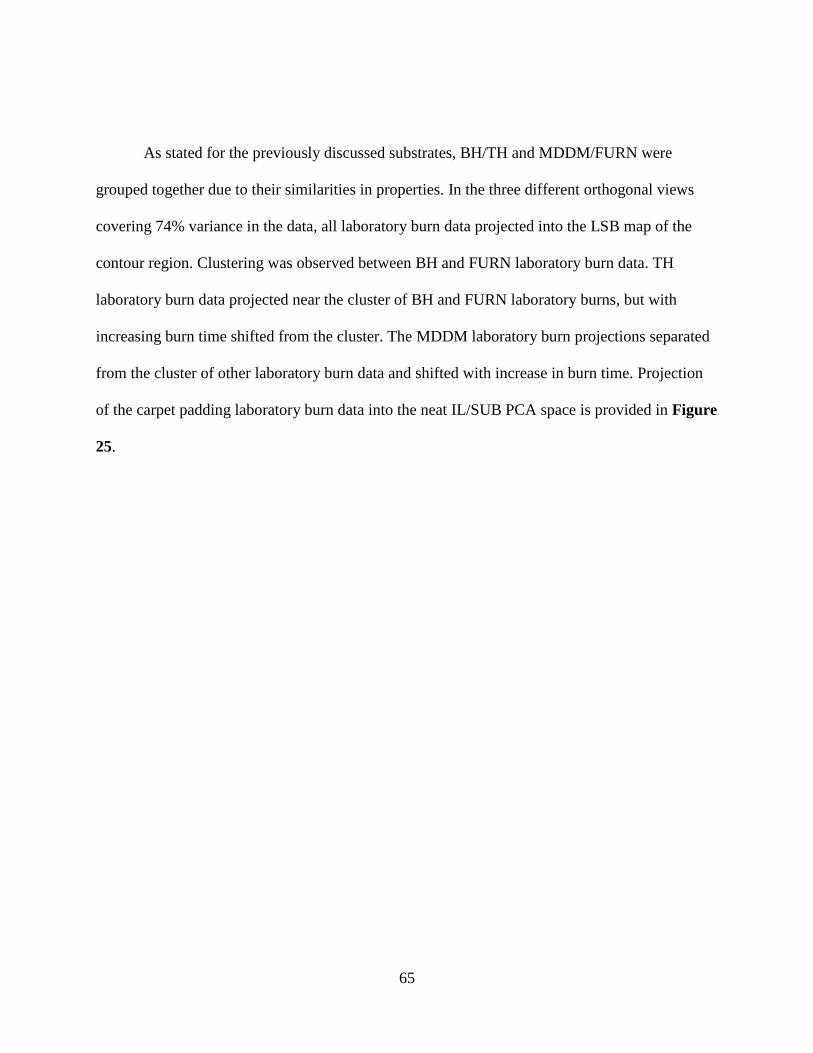
65
As stated for the previously discussed substrates, BH/TH and MDDM/FURN were
grouped together due to their similarities in properties. In the three different orthogonal views
covering 74% variance in the data, all laboratory burn data projected into the LSB map of the
contour region. Clustering was observed between BH and FURN laboratory burn data. TH
laboratory burn data projected near the cluster of BH and FURN laboratory burns, but with
increasing burn time shifted from the cluster. The MDDM laboratory burn projections separated
from the cluster of other laboratory burn data and shifted with increase in burn time. Projection
of the carpet padding laboratory burn data into the neat IL/SUB PCA space is provided in Figure
25.

66
Figure 25: Projection of carpet padding into neat IL/SUB PCA space
Because the Substrate Database was composed of substrates burned using the MDDM
burn method, it was expected that each MDDM laboratory burn of carpet padding projected
within the map of the contour region of neat IL/SUB. Not only did all MDDM laboratory burn
data project within the mapping space, all laboratory burn data for all PCs show in Figure 25
projected within the contour region.
67
In the three different orthogonal views covering 61% variance in the data, all carpet
padding laboratory burns projected within the neat IL and SUB PC map of the contour region.
Clustering occurred between TH, BH and FURN laboratory burn data with slight shifting with an
increase in burn time. Shifts in projection occurred for MDDM laboratory burn data away from
the cluster of TH, BH and FURN laboratory burn projections. The TH, BH and FURN laboratory
burns appeared to project within the SUB region, which means these laboratory burns were
similar to the data contained within the Substrate database.
4.6.2 TICs from Laboratory Burns
Carpet padding was burned using four different burning methods and three burn times for
each method. The TICs from the laboratory burns were compared between the burns. Major
pyrolysis products expected for carpet padding were produced from decomposition of
polyurethane yielding benzene, toluene, alpha methylstyrene, and styrene through random
scission.10, 25 Pyrolysis products were confirmed through mass spectra comparisons from NIST
and ILRC NCFS compiled libraries and retention time comparison. The TICs from the MDDM
and TH are displayed in Figure 26. The TICs from the FURN and BH are displayed in Figure
27.

68
Figure 26: Components (1) 2-propanol, 1-chloro-, phosphate (3:1), (2) 1-propene, 1,3-dichloro,
(3) 1,3-dichloro, 2-propanol, (4) benzene, (5) toluene, (6) styrene, (7) benzonitrile, (8) alpha
methylstyrene, (9) 4-phenylbutronitrile, (10) benzaldehyde, (11) phenol

69
Figure 27: Components (1) 2-propanol, 1-chloro-, phosphate (3:1), (2) 1-propene, 1,3-dichloro,
(3) 1,3-dichloro, 2-propanol, (6) styrene, (9) 4-phenylbutronitrile, (10) benzaldehyde
From the above figures, multiple conclusions about the substrate and laboratory burning
methods could be reached. As observed for the polyester, nylon and olefin carpetings, the
MDDM burning method produced the largest number of identified products. The fire retardant,
Tris (1-chloro, 2-propyl) phosphate or TCPP was identified within MDDM laboratory burns and

70
TH and BH burns of carpet padding. TCPP was added as a fire retardant in the manufacturing
process of polyeurathane foam.59 With increasing burn time, there was a shift in the
chromatographic profile favoring less volatile components within the MDDM laboratory burns.
Styrene was the most abundant peak in MDDM laboratory burns with increasing burn time.
Similarly, styrene was the most abundant pyrolysis/combustion product observed in the TICs of
TH laboratory burns with increasing burn time. With increase in burn time, TH laboratory burns
displayed a decrease in abundance of volatile components in the front portion of the
chromatogram. BH laboratory burns yielded chloro-based hydrocarbons such as TCPP, 1-
propene, 1-3-dichloro and 1-3-dichloro, 2-propanol. Increase in volatile components and
identified components occurred with increasing burn time for BH laboratory burns. FURN
laboratory burns displayed low abundance of pyrolysis/combustion products within the TICs.
TCPP was identified in the 10 min FURN laboratory burn TIC. The mixture of carpeting and
carpet padding was discussed later within this research. Different burn method parameters and
laboratory burn time affected the chromatographic profiles of pyrolysis/combustion products that
were produced.
4.7 Vinyl Flooring
4.7.1 Projection of Laboratory Burns into Fire Debris Data Sets
Vinyl burns were completed using four different laboratory burn methods (MDDM, TH,
BH and FURN) with three different burn times and projected into the same principal component
space and map of the contour regions used for projection of the in silico data. Laboratory burns
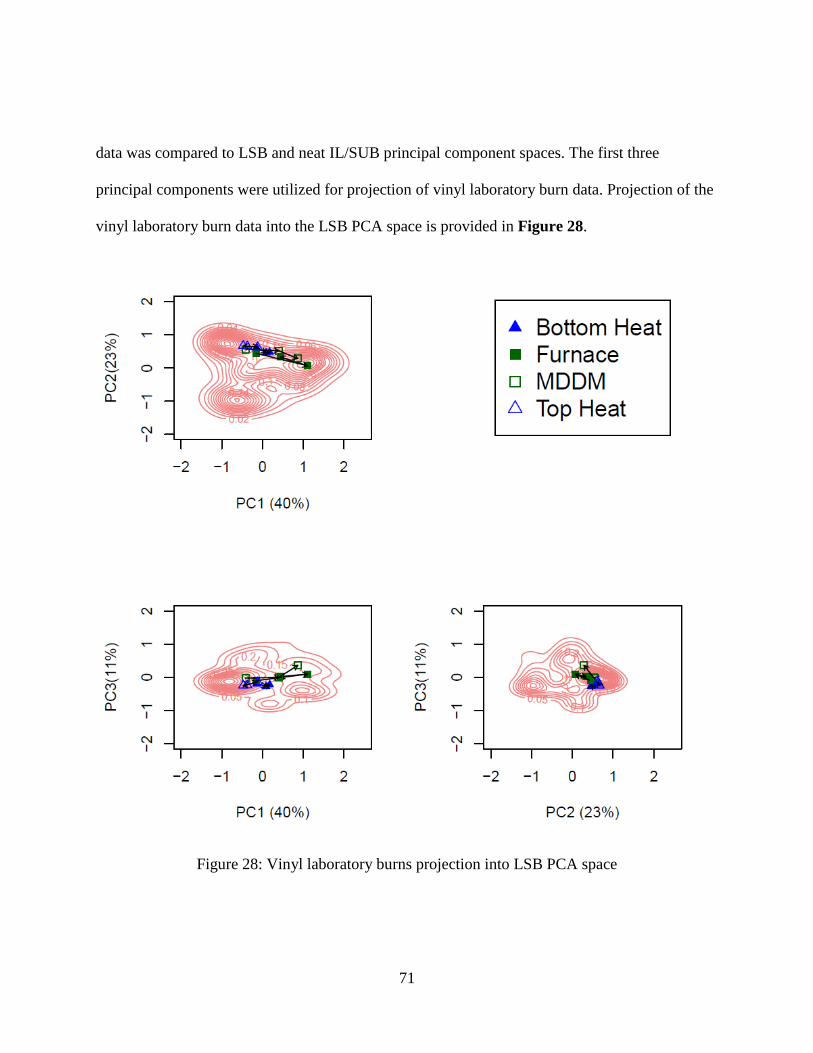
71
data was compared to LSB and neat IL/SUB principal component spaces. The first three
principal components were utilized for projection of vinyl laboratory burn data. Projection of the
vinyl laboratory burn data into the LSB PCA space is provided in Figure 28.
Figure 28: Vinyl laboratory burns projection into LSB PCA space

72
As stated for the previously discussed substrates, BH/TH and MDDM/FURN were
grouped together due to their similarities in properties. For the first two principal components
covering 74% of the variance in the data, all laboratory burn data projected into the LSB map of
the contour region. Clustering was observed between the TH and BH laboratory burn
projections. Shifts in projection of the FURN laboratory burn data was occurring with increase in
burn time. MDDM laboratory burn data shifted as well with increase in burn time. Projection of
the vinyl laboratory burn data into the neat IL/SUB PCA space is provided in Figure 29.

73
Figure 29: Vinyl laboratory burns projected into neat IL/SUB PCA space
Because the Substrate Database was composed of substrates burned using the MDDM
burn method, it was expected that each MDDM laboratory burn of vinyl flooring projected
within the map of the contour region of neat IL/SUB. Not only did all MDDM laboratory burn
data project within the mapping space, all laboratory burn data for all PCs shown in Figure 29
projected within the contour region.

74
In the three different orthogonal views covering 61% variance in the data, all vinyl
laboratory burns projected within the neat IL and SUB PC map of the contour region. Shifts in
projection of the TH and BH laboratory burn data occurred with increase in burn time. FURN
laboratory burn projections shifted as well with increase in burn time. MDDM laboratory burn
data clustered near the FURN laboratory burn data and shifted with increase in burn time.
4.7.2 TICs from Laboratory Burns
Vinyl flooring was burned using four different burning methods and three burn times for
each method. The TICs from the laboratory burns were compared between the burns. Major
pyrolysis products expected for vinyl flooring were produced from side group scission of
polyvinyl chloride (PVC) polymer and vinyl resin with different plasticizers, stabilizers,
pigments and fillers. The conjugated chain within PVC broke randomly at a C-C bond, yielding
aromatic compounds such as benzene, toluene, and naphthalene.10, 16, 17 Comparisons between
different burning methods was provided using PCA projections into the LSB and neat IL/SUB
data sets. Pyrolysis products were confirmed through mass spectral comparisons from NIST and
NCFS ILRC libraries and retention time comparisons. The TICs from the MDDM and TH
laboratory methods are displayed in Figure 30. The TICs from the BH and FURN laboratory
burn methods are displayed in Figure 31.

75
Figure 30: Compounds (1) benzene, (2) methyl isobutyl ketone, (3) toluene, (4) 2-ethyl-1-
hexanol, (5) methyl ester hexadecanoic acid, (6) naphthalene

76
Figure 31: Compounds (1) benzene, (2) methyl isobutyl ketone, (3) toluene, (4) 2-ethyl-1-
hexanol, (5) methyl ester hexadecanoic acid, (6) naphthalene
From the above figures, multiple conclusions about the substrate and the laboratory
burning methods could be reached. As observed for all discussed carpeting, the MDDM burning
method produced the largest number of identified products. Within the MDDM laboratory burns,
77
the 1 min laboratory burn yielded an increase in methyl ester hexadecanoic acid and decrease of
volatile components in the TIC. With increase in burn time, TH laboratory burns produced
similar pyrolysis/combustion products within the TICs. BH laboratory burns of vinyl flooring
produced pyrolysis/combustion products that decrease in abundance with increasing burn time.
FURN laboratory burns of vinyl flooring yielded a less volatile, unidentified product at the tail
end of the chromatogram with observed retention time of 27 minutes. With increase in burn time,
FURN laboratory burns decreased at the tail end of the chromatogram and additional
pyrolysis/combustion products were identified in the 10 min laboratory burn chromatographic
profile.
Observed pyrolysis/combustion results may reflect different additives that were added
during the manufacturing process of vinyl flooring. Methyl ester hexadecanoic acid was the most
abundant pyrolysis/combustion product observed within all laboratory burns of vinyl flooring.
Methyl ester hexadecanoic acid, or methyl palmitate, was used in the manufacturing of the
veneer finishing layer of the vinyl flooring in addition to methyl isobutyl ketone in resin
formation and varnish finishing.57, 58 Different burn method parameters and laboratory burn time
affected the chromatographic profile of pyrolysis/combustion products that were produced.
4.8 Laminate Flooring
4.8.1 Projection of Laboratory Burns into Fire Debris Data Sets
Laminate flooring burns were completed using four different laboratory burn methods
(MDDM, TH, BH and FURN) with three different burn times and projected into the same

78
principal component space and map of the contour regions used for projection of the in silico
data. Laboratory burns were compared to LSB and neat IL/SUB principal component spaces.
The first three principal components were utilized in the projection of laminate flooring
laboratory burn data. Projection of the laminate laboratory burn data into the LSB PCA space is
provided in Figure 32.
Figure 32: Projection of laminate flooring burns into LSB PCA space

79
As stated for the previously discussed substrates, BH/TH and MDDM/FURN were
grouped together due to their similarities in properties. In the three different orthogonal views
covering 74% variance in the data, all laboratory burn data projected into the LSB map of the
contour region. Clustering was observed between TH, BH and FURN laboratory burn
projections. Shifts in projection of the MDDM laboratory burn data occur away from the
clustering of burn points with increase in burn time. Projection of the laminate laboratory burn
data into the neat IL/SUB PCA space is provided in Figure 33.

80
Figure 33: Projection of laminate flooring into neat IL/SUB PCA space
Because the Substrate Database was composed of substrates burned using the MDDM
burn method, it was expected that each MDDM laboratory burn data of laminate flooring
projected within the map of the contour region of neat IL/SUB. Not only did all MDDM
laboratory burns project within the mapping space, all laboratory burn data for all PCs shown in
Figure 33 projected within the contour region.
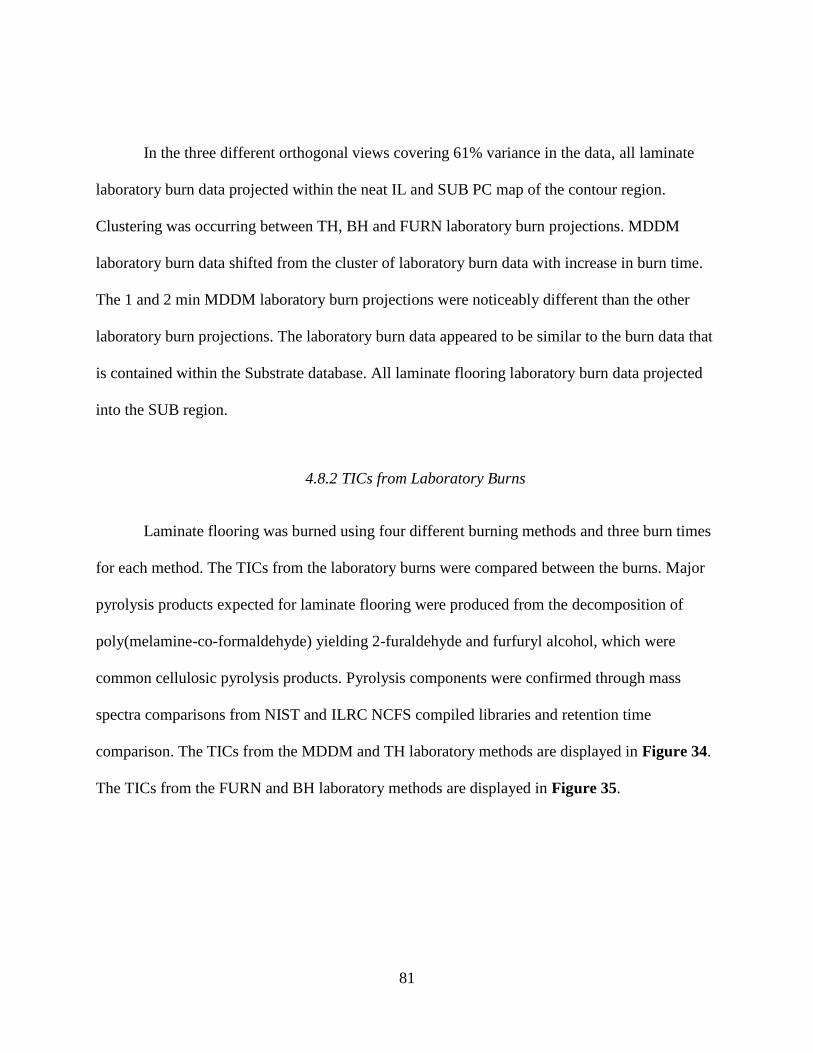
81
In the three different orthogonal views covering 61% variance in the data, all laminate
laboratory burn data projected within the neat IL and SUB PC map of the contour region.
Clustering was occurring between TH, BH and FURN laboratory burn projections. MDDM
laboratory burn data shifted from the cluster of laboratory burn data with increase in burn time.
The 1 and 2 min MDDM laboratory burn projections were noticeably different than the other
laboratory burn projections. The laboratory burn data appeared to be similar to the burn data that
is contained within the Substrate database. All laminate flooring laboratory burn data projected
into the SUB region.
4.8.2 TICs from Laboratory Burns
Laminate flooring was burned using four different burning methods and three burn times
for each method. The TICs from the laboratory burns were compared between the burns. Major
pyrolysis products expected for laminate flooring were produced from the decomposition of
poly(melamine-co-formaldehyde) yielding 2-furaldehyde and furfuryl alcohol, which were
common cellulosic pyrolysis products. Pyrolysis components were confirmed through mass
spectra comparisons from NIST and ILRC NCFS compiled libraries and retention time
comparison. The TICs from the MDDM and TH laboratory methods are displayed in Figure 34.
The TICs from the FURN and BH laboratory methods are displayed in Figure 35.
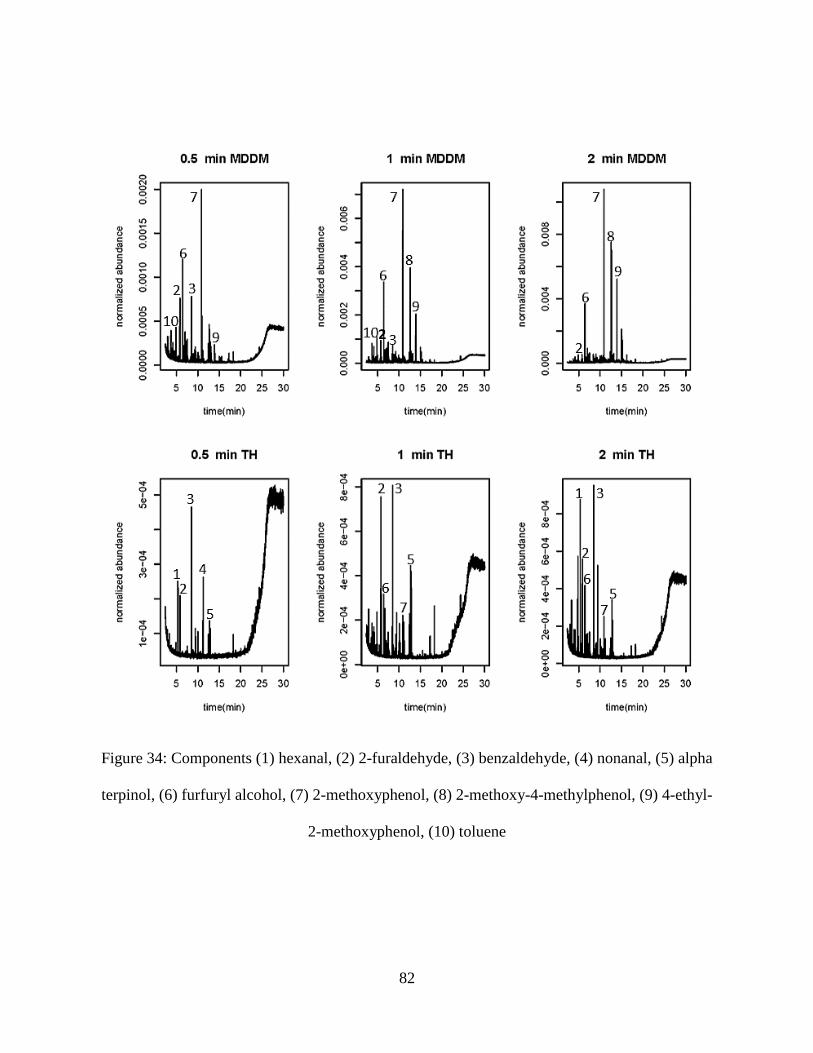
82
Figure 34: Components (1) hexanal, (2) 2-furaldehyde, (3) benzaldehyde, (4) nonanal, (5) alpha
terpinol, (6) furfuryl alcohol, (7) 2-methoxyphenol, (8) 2-methoxy-4-methylphenol, (9) 4-ethyl-
2-methoxyphenol, (10) toluene
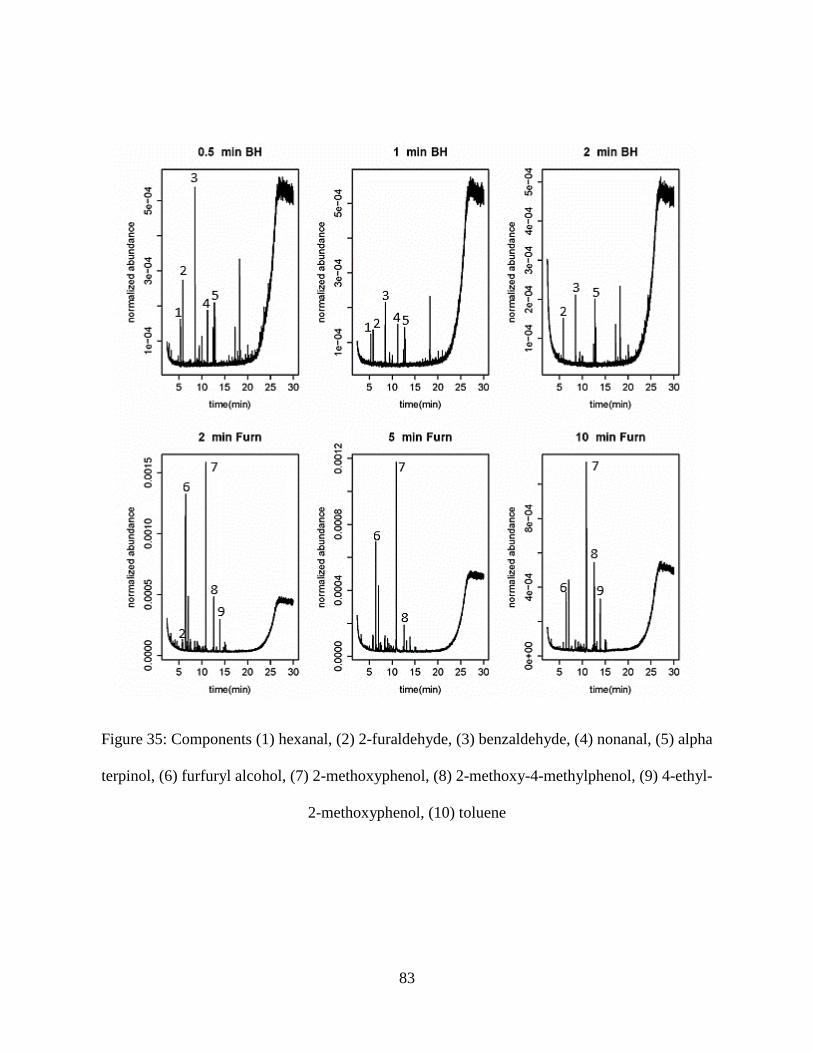
83
Figure 35: Components (1) hexanal, (2) 2-furaldehyde, (3) benzaldehyde, (4) nonanal, (5) alpha
terpinol, (6) furfuryl alcohol, (7) 2-methoxyphenol, (8) 2-methoxy-4-methylphenol, (9) 4-ethyl-
2-methoxyphenol, (10) toluene

84
From the above figures, multiple conclusions about the substrate and laboratory burning
methods could be reached. As observed for all discussed carpeting and vinyl flooring, the
MDDM burning method produced the largest number of identified products that were formed.
With an increase in burn time, MDDM laboratory burn TICs favored less volatile components
within the chromatographic profile. MDDM laboratory burns displayed an increase of identified
phenolic aromatic pyrolysis/combustion products in 1 and 2 min MDDM burns of laminate
flooring. TH laboratory burns displayed an increase in volatile pyrolysis/combustion products
with increase in burn time. Additional phenolic aromatic components were identified in the 1 and
2 min TH laboratory burns. BH laboratory burns decreased in abundance with increase in burn
time and less identified pyrolysis/combustion products were observed in the 2 min BH TIC.
FURN laboratory burns displayed mostly phenolic aromatic components within the
chromatographic profiles. With an increase in burn time, FURN laboratory burns displayed a
decrease in abundance of pyrolysis/combustion products.
Almost every laminate flooring labotoraty burn, other than the 5 and 10 min FURN
burns, displayed the identification of 2-furaldehyde. Another common cellulosic product,
furfuryl alcohol, was identified within the 5 and 10 min FURN burns. 2-furaldehyde was one of
three common pyrolysis/combustion products observed from the pyrolysis of cellulosic
materials. Furfuryl alcohol was identified in MDDM, TH, and FURN laboratory burns of
laminate flooring. Within the TH and MDDM laboratory burns, furfuryl alcohol abundance
increased with increase in burn time. FURN laboratory burns exhibited decrease of furfuryl
alcohol abundance with increasing burn time. Different burn method parameters and laboratory

85
burn time affected the chromatographic profile of pyrolysis/combustion products that were
produced.
4.9 Plywood
4.9.1 Projection of Laboratory Burns into Fire Debris Data Sets
Plywood burns were completed using four different laboratory burn methods (MDDM,
BH, TH and FURN) with three different burn times and projected into the same principal
component space and map of the contour regions that were used for projection of the in silico
data. Laboratory burn data was compared to LSB and the neat IL/SUB principal component
spaces. The first three principal components were utilized for projection of the plywood
laboratory burn data. Projection of the plywood laboratory burn data into the LSB PCA space is
provided in Figure 36.
86
Figure 36: Projection of plywood material into LSB PCA space
As stated for the previously discussed substrates, BH/TH and MDDM/FURN were
grouped togheter due to their similarities in properties. In the three different orthogonal views
covering 74% variance in the data, all laboratory burn data projected into the LSB map of the
contour region. Clustering occurred between the TH and BH laboratory burn projections.
Clustering was also occurring between the MDDM and FURN laboratory burn data. There was a
shift in projection of the 2 minute MDDM laboratory burn data away from the cluster of MDDM

87
and FURN burn projections with increase in burn time. Projection of the plywood laboratory
burn data into the neat IL/SUB PCA space is provided in Figure 37.
Figure 37: Projection of plywood material into neat IL/SUB PCA space
Because the Substrate Database was composed of substrates burned using the MDDM
burn method, it was expected that each MDDM laboratory burn of plywood flooring projected

88
within the map of the contour region of neat IL/SUB. Not only did all MDDM laboratory burn
data project within the mapping space, all laboratory burn data for all PCs shown in Figure 37
projected within the contour region.
In the three different orthogonal views covering 61% variance in the data, all plywood
laboratory burns projected within the neat IL and SUB PC map of the contour region. Clustering
was occurring between the TH and BH laboratory burn projections. Clustering also occurred
between the MDDM and FURN laboratory burn projections. The 2 min MDDM laboratory burn
data shifted in projection away from the MDDM and FURN laboratory burn cluster. BH/TH and
MDDM/FURN laboratory burn data projected separately and were noticeably different within all
three orthogonal views. The laboratory burn data appeared to be similar to the burn data that is
contained within the Substrate database. All plywood flooring laboratory burn points projected
into the SUB region.
4.9.2 TICs from Laboratory Burns
Plywood was burned using four different burning methods and three burn times for each
method. The TICs from the laboratory burns were compared between the burns. Major pyrolysis
products expected for plywood were produced from the thermal degradation of wood that yields
cellulosic materials such as 2-furaldehyde, furfuryl alcohol and 5-methylfurfural.10
Decomposition of wood broke down its three main components due to increasing temperature
with decomposition of hemicellulose (180-350˚C), cellulose (275-350 ˚C) and lignin (250-500
˚C).29, 61 Observed components were confirmed through mass spectra comparisons from NIST
and ILRC NCFS compiled libraries and retention time comparison. The TICs from the MDDM

89
and TH laboratory methods are displayed in Figure 38. The TICs from the FURN and BH
laboratory methods are displayed in Figure 39.
Figure 38: Compounds (1) hexanal, (2) 2-cyclopenten-1-one, (3) 2-furaldehyde, (4) alpha pinene,
(5) 2-methoxyphenol, (6) 2-methoxy-4-methoxyphenol, (7) 4-ethyl-2-methoxyphenol, (8)
eugenol, (9) benzaldehyde, (10) nonanal, (11) hexanoic acid, (12) octanoic acid, (13) 5-
methylfurfural, (14) furfuryl alcohol

90
Figure 39: Compounds (1) hexanal, (2) 2-cyclopenten-1-one, (3) 2-furaldehyde, (5) 2-
methoxyphenol, (6) 2-methoxy-4-methoxyphenol, (7) 4-ethyl-2-methoxyphenol, (8) eugenol, (9)
benzaldehyde, (10) nonanal, (11) hexanoic acid, (12) octanoic acid, (13) 5-methylfurfural, (14)
furfuryl alcohol

91
From the above figures, multiple conclusions about the substrate and laboratory burning
methods could be reached. As observed for all sicussed carpeting and processed flooring, the
MDDM burning method produced the largest number of identified products. MDDM laboratory
burns of plywood decreased in volatile components in the front portion of the chromatographic
profile. The 2 min MDDM laboratory burn exhibited an increase of less volatile phenolic
aromatic pyrolysis/combustion products. FURN laboratory burns displayed a similar
chromatographic profile to the 2 min MDDM laboratory burn with abundant phenolic aromatic
pyrolysis/combustion products. TH laboratory burns yielded similar chromatographic profiles
with shorter burn times, but only alpha pinene was identified in the 2 min TH burn. BH
laboratory burns displayed a similar product pattern to TH lab burns, but the 2 min BH lab burn
displayed an increase in abundance in the front portion of the chromatogram. BH and TH
laboratory burns exhibited fairly low abundance of pyrolysis/combustion products in all TICs.
The three major cellulosic pyrolysis products were observed. However, only FURN and
MDDM laboratory burns displayed the identification of the three major cellulosic pyrolysis
products of 5-methylfurfural, furfuryl alcohol and 2-furaldehyde within the TICs. Additional fire
retardant or adhesives applied during the manufacturing process could potentially alter the
pyrolysis/combustion products for plywood material. Ultimately, different burn method
parameters and laboratory burn time affected the chromatographic profile of
pyrolysis/combustion products produced.

92
4.10 Yellow Pine
4.10.1 Projection of Laboratory Burns into Fire Debris Data Sets
Yellow pine burns were completed using four different laboratory burn methods
(MDDM, TH, BH and FURN) with three different burn times and were projected into the same
principal component space and map of the contour region that were used for projection of the in
silico data. Laboratory burn data was compared to LSB and neat IL/SUB principal component
spaces. The first three principal components were utilized for projection of yellow pine
laboratory burn data. Projection of the yellow pine laboratory burn data into the LSB PCA space
is provided in Figure 40.

93
Figure 40: Projection of yellow pine flooring into LSB PCA space
As stated for the previously discussed substrates, BH/TH and MDDM/FURN were
grouped together due to their similarities in properties. In the three different orthogonal views
covering 74% variance in the data, all laboratory burn data projected into the LSB map of the
contour region. Clustering was observed between MDDM, TH, BH and FURN laboratory burn
point projections. Slight shifting in projection of the FURN laboratory burn data occurred with

94
increase in burn time. MDDM laboratory burn data shifted in projection with increase in burn
time as well. Projection of the yellow pine laboratory burn data into the neat IL/SUB PCA space
is provided in Figure 41.
Figure 41: Projection of yellow pine into neat IL/SUB PCA space
Because the Substrate Database was composed of substrates burned using the MDDM
burn method, it was expected that each MDDM laboratory burn of yellow pine projected within

95
the map of the contour region of neat IL/SUB. Not only did all MDDM laboratory burn data
project within the contour space, all laboratory burn data for all PCs shown in Figure 41
projected within the contour region.
In the three different orthogonal views covering 61% variance in the data, all yellow pine
laboratory burns projected within the neat IL and SUB PC map of the contour region. Clustering
was occurring between the TH and BH laboratory burn projections. MDDM laboratory burn data
projected near the cluster of TH and BH, but shifted away with increase in burn time. FURN
laboratory burn data shifted slightly in projection with increase in burn time as well. The
laboratory burn data appeared to be similar to the burn data that is contained within the Substrate
database. All yellow pine laboratory burn data projected into the SUB region.
4.10.2 TICs from Laboratory Burns
Yellow pine wood was burned using four different burning methods and three burn times
for each method. The TICs from the laboratory burns were compared amongst the burns. Major
pyrolysis products expected for yellow pine wood were produced from thermal degradation of
wood yielding cellulosic materials such as 2-furaldehyde, furfuryl alcohol, and 5-
methylfurfural.10 Decomposition of wood broke down its three main components due to
increasing temperature with decomposition of hemicellulose (180-350˚C), cellulose (275-350 ˚C)
and lignin (250-500 ˚C).29, 61 Pyrolysis products were confirmed through mass spectra
comparisons from NIST and ILRC NCFS compiled libraries and retention time comparison. The
TICs from the MDDM and TH are displayed in Figure 42. The TICs from the FURN and BH
are displayed in Figure 43.

96
Figure 42: Compounds (1) pentanal, (2) 1-pentanol, (3) toluene, (4) hexanal, (5) 2-furaldehyde,
(6) heptanal, (7) alpha pinene, (8) octanal, (9) nonanal, (10) 1-methoxy-4-(2-propenyl) benzene,
(11) 2-methoxyphenol, (12) 2-methoxy-4-methylphenol, (13) 4-ethyl-2-methoxyphenol, (15)
TXIB, (16) furfuryl alcohol, (17) 5-methylfurufral

97
Figure 43: Compounds (1) pentanal, (2) 1-pentanol, (3) toluene, (4) hexanal, (5) 2-furaldehyde,
(6) heptanal, (7) alpha pinene, (8) octanal, (9) nonanal, (10) 1-methoxy-4-(2-propenyl) benzene,
(11) 2-methoxyphenol, (12) 2-methoxy-4-methyl phenol, (13) 4-ethyl-2-methoxy-phenol, (14)
eugenol, (15) TXIB, (16) furfuryl alcohol, (17) 5-methylfurfural

98
From the above figures, multiple conclusions about the substrate and laboratory burn
methods could be reached. As observed for all discussed carpeting and processed flooring, the
MDDM burning method produced the largest number of identified products. With increase in
burn time, the MDDM laboratory burn TICs of yellow pine increase in volatile
pyrolysis/combustion products and additional identified phenolic aromatic products were
observed. TXIB, a wood coating commonly used as finishing, was identified in the 2 min
MDDM chromatographic profile. TH laboratory burns displayed TXIB identification in the 0.5
min laboratory burn. With increase in burn time, TH laboratory burn TICs were similar in
chromatographic profiles, but fewer identified pyrolysis/combustion products were observed in
the 2 min TH burn. The 0.5 and 1 min BH laboratory burns displayed similar peak patterns and
chromatographic profiles to TH laboratory burns. The 2 min BH laboratory burn exhibited a
difference in product profile with identification of the TXIB component. FURN laboratory burns
yielded mostly phenolic aromatic components within the TICs. The MDDM and FURN
laboratory burns displayed the three major cellulosic pyrolysis/combustion products expected
from pyrolysis of yellow pine.
2-furaldehyde was present in almost all laboratory burns of yellow pine, but the
abundance varied depending on the burning method and time utilized. 2-furaldeyhde, an
aromatic component, was one of the major expected cellulosic pyrolysis/combustion products
identified in the degradation of wood. Intensity of abundance of 2-furaldehyde decreased with
increasing burn time, but in MDDM laboratory burns, the 2-furaldehyde abundance slightly
increased. Different burn method parameters and laboratory burn time affected the
chromatographic profile of pyrolysis/combustion products that were produced.

99
4.11 Polyester Carpet/Carpet Padding
4.11.1 Projection of Laboratory Burns into Fire Debris Data Sets
Polyester carpeting and carpet padding burns were completed using three different
laboratory burn methods (MDDM, MDDM with Gasoline, and MDDM with MPD) with three
different burn times and projected into the same principal component space and map of the
contour regions that were used for projection of the in silico data. Chosen ILs utilized for the
laboratory burns were a neat gasoline, SRN 105 – Phillips 66 Unleaded Regular Gasoline, and a
medium petroleum distillate (MPD), SRN 30 – Klean Strip Odorless Mineral Spirits. Gasoline
and petroleum distillate ILs were chosen due to their target products in identification and product
pattern that is discernible through observation of the chromatogram. Laboratory burn projections
were compared to LSB and neat IL/SUB principal component spaces. The first three principal
components were utilized for projection of polyester carpet and carpet padding laboratory burn
data. Analysis of projected laboratory burn data yielded information as to the similarities and
differences between the utilized MDDM laboratory burn method and the addition of ignitable
liquid to the MDDM laboratory burning method. Projection of the polyester carpeting and carpet
padding laboratory burn data into the LSB PCA space is provided in Figure 44.

100
Figure 44: Projection of polyester carpeting and carpet padding into LSB PCA space
Due to similarities in the properties of all three MDDM methods, they were grouped into
similar shapes. Different colors denote whether the laboratory burn was performed with or
without a particular IL.
In the three different orthogonal views covering 74% variance in the data, all laboratory
burn data projected into the LSB map of the contour region. However, there were a few

101
laboratory burn projections that neared the edge of the map of the contour area. With increase in
burn time, the MDDM with IL addition laboratory burn data shifted in projection. Clustering was
observed between the MDDM without IL addition laboratory burn projections. Projection of the
polyester carpeting and carpet padding laboratory burn data into the neat IL/SUB PCA space is
provided in Figure 45.
Figure 45: Projection of polyester carpeting and padding into neat IL/SUB PCA space

102
Because the Substrate Database was composed of substrates burning using the MDDM
burn method, it was expected that each MDDM laboratory burn of polyester carpet and carpet
padding projected within the map of the contour region of neat IL/SUB. It was also expected that
each MDDM laboratory burn with IL addition projected near the respective IL contour regions
before evaporation of IL occurred with increase in burn time. Almost all laboratory burn data
projected within the contour region for all PCs shown in Figure 45. Some MDDM with Gas
addition laboratory burn data projected outside of the map of the contour region slightly.
In the three different orthogonal views covering 61% variance in the data, almost all
polyester carpeting and carpet padding laboratory burns projected within the neat IL/SUB PC
map of the contour region. Therefore, there was a similarity between the MDDM and MDDM
with MPD polyester carpeting and carpet padding burn data and the pure ignitable liquid and
substrate data contained within the ILRC and Substrate database, respectively. The MDDM with
Gas addition projected slightly outside of the contour mapping region. Therefore, there was a
slight difference between the MDDM with Gas burn data and the ignitable liquid and substrate
data sets. MDDM with no IL addition was clustering together with little shifting occurring with
increase in burn time. The 0.5 and 1 min MDDM with Gas laboratory burn points clustered
together and shifted with increase in burn time. The 0.5 and 1 min MDDM with MPD laboratory
burn projections clustered as well and then shifted with increase in burn time. The laboratory
burn data appeared to be similar to the burn data that is contained within the ILRC database. All
polyester carpet and carpet padding laboratory burn data projected into the IL region. Analysis of
the projections of laboratory burn data into the LSB and neat IL/SUB PC spaces and the TICs of

103
the laboratory burns yielded information regarding the similarities and differences between the
different MDDM laboratory burn methods.
4.11.2 TICs from Laboratory Burns
Mixture of polyester carpet and carpet padding with and without IL addition was burned
using the MDDM burning method and three burn times for each different addition mixture.
MDDM was chosen as the burning method for this experiment because it produced the largest
number of identified pyrolysis/combustion products in the chromatographic profile. Polyester
carpet was burned with carpet padding directly underneath without any IL addition. Six
additional laboratory burns were performed using addition of gasoline or medium petroleum
distillate IL to observe how the IL affected the resulting chromatographic profile. It was
expected that the product pattern would be reflective of both substrate and ILR pattern.
Major pyrolysis/combustion products expected for polyester carpet are produced from
random scission of PET and propylene or polybutadiene backing of the carpet yielding small
amounts of oxygenated aromatics like toluene, benzene and styrene. Major pyrolysis products
expected for carpet padding are produced from random scission of polyurethane yielding
benzene, toluene, alpha methylstyrene, and styrene. The addition of IL provided insight into the
possible modification of peak abundances in the scenario where substrate and IL observe similar
components in the TICs.
The TICs from the laboratory burns were compared amongst the burns. Pyrolysis
products were confirmed through mass spectra comparisons from NIST and ILRC NCFS

104
compiled libraries and retention time comparison. The TICs from the MDDM and MDDM with
ignitable liquid additions are displayed in Figure 46.

105
Figure 46: Compounds (1) 2,4-dimethyl-1-heptene, (2) styrene, (3) alpha methylstyrene, (4) n-
nonane, (5) n-decane, (6) n-undecane, (7) naphthalene, (8) toluene, (9) 4-phenylbutronitrile,
(10) biphenyl, (11) 1,2,4-trimethylbenzene, (12) 1,2,3,5-tetramethylbenzene,
(13) 2-methylnaphthalene, (14) 1,2,4,5-tetramethylbenzene
106
From the above figures, multiple conclusions about the substrate mixture, addition of
ignitable liquids and MDDM laboratory burning method could be reached. MDDM with addition
of gasoline produced the largest number of identified pyrolysis/combustion products. For the
MDDM with gasoline addition laboratory burns, volatile components such as toluene and 2,4-
dimethyl-1-heptene decreased with increasing burn time. Target compounds identified within
gasoline ILR patterns were identified within the chromatographic profiles of the MDDM with
gasoline addition TIC. The target compounds of gasoline identified were: 1,2,4-
trimethylbenzene, 1,2,3,5-tetramethylbenzene, 2-methylnaphthalene, and 1,2,4,5-
tetramethylbenzene.
For MDDM laboratory burns of polyester and carpet padding with addition of MPD,
decrease of normal alkane abundace was observed with increase in burn time. Major target
compounds identified within MPD ILR patterns were identified within the chromatographic
profiles of the MDDM with MPD addition mixture. Major target compounds of MPD identified
were: n-nonane, n-dodecane, and n-undecane.
For MDDM laboratory burn of polyester carpet and carpet padding with no addition of
IL, increase in the number of identified pyrolysis/combustion products was observed with
increasing burn time. It was apparent from the MDDM with no IL addition TICs, that the IL
addition yielded a difference of chromatographic profile with an increase in identified ILR.
Analysis of laboratory burns without use of IL addition and using that information in attempting
to understand the effects of the IL addition was extremely beneficial.
Across all polyester carpeting and carpet padding laboratory burns, 2,4-dimethyl-1-
heptene, toluene, naphthalene and styrene were present in all chromatographic profiles. 2,4-
107
dimethyl-1-heptene, an aliphatic compound, was observed in the previously discussed carpeting
and the carpet padding MDDM laboratory burns. Styrene and 2,4-dimethyl-1-heptene were
pyrolysis/combustion products from the substrate mixture of polyester carpeting and carpet
padding. Toluene and naphthalene were similarly obsvered within laboratory burns of polyester
carpeting and carpet padding and have previously been found within ILR patterns of gasoline
and MPD. Similarity in composition amongst pyrolysis/combustion products could lead to
modification of peak abundances within the chromatographic profiles. IL additions could
complicate the chromatographic profile with ILR being present in the TIC. Different burn
method parameters and the laboratory burn time affected the chromatographic profile of
pyrolysis/combustion and ILR products that were produced.
4.12 Compilation of Laboratory Burns
Eight different substrates were utilized to create the laboratory burns that were analyzed
and projected against the substrate and ignitable liquid databases. In this research, 105 laboratory
burns were completed and similar pyrolysis/combustion products were observed in the TICs of
different flooring substrates. The most commonly observed pyrolysis/combustion products in
different substrate laboratory burns using the four different laboratory burn methods have been
compiled in Table 1. This allows for the percent of observed pyrolysis/combustion products
from the burns to be compiled and compared. The majority of flooring substrates chosen for this
research were carpeting. Additional tables have been formed to display the most common
pyrolysis products observed for the three different types of chosen flooring substrates. The most
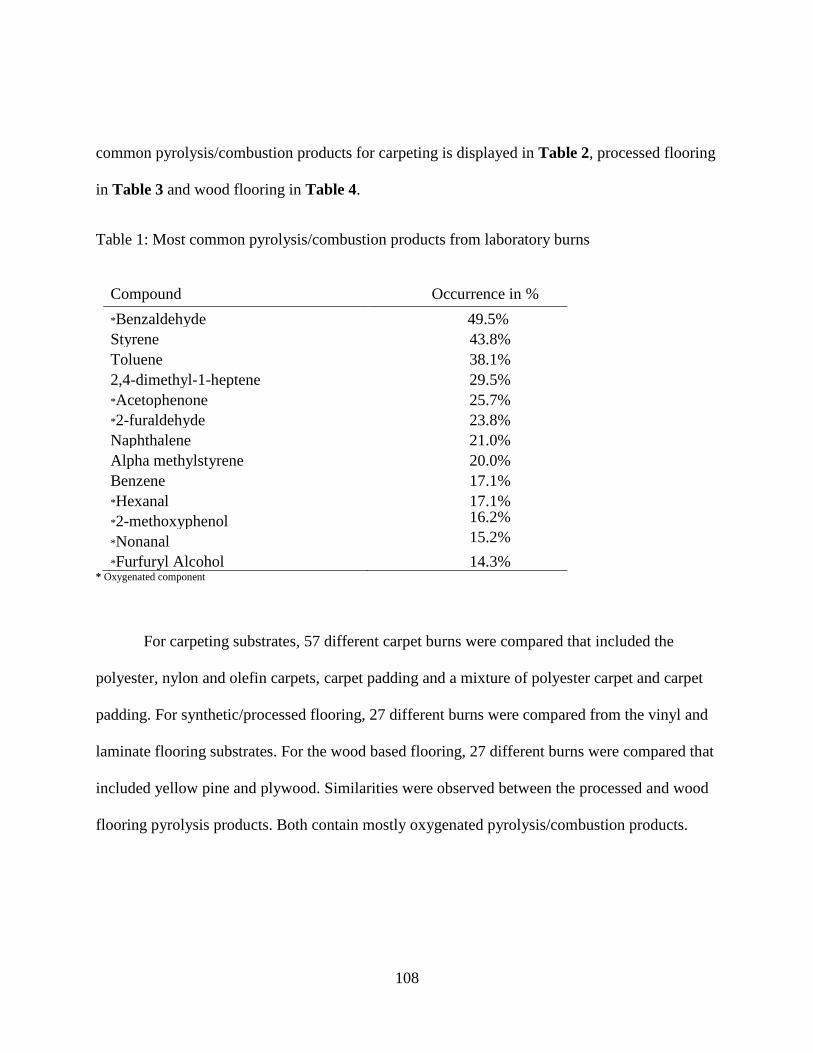
108
common pyrolysis/combustion products for carpeting is displayed in Table 2, processed flooring
in Table 3 and wood flooring in Table 4.
Table 1: Most common pyrolysis/combustion products from laboratory burns
Compound Occurrence in %
*Benzaldehyde 49.5%
Styrene 43.8%
Toluene 38.1%
2,4-dimethyl-1-heptene 29.5%
*Acetophenone 25.7%
*2-furaldehyde 23.8%
Naphthalene 21.0%
Alpha methylstyrene 20.0%
Benzene 17.1%
*Hexanal 17.1%
*2-methoxyphenol 16.2%
*Nonanal 15.2%
*Furfuryl Alcohol 14.3% * Oxygenated component
For carpeting substrates, 57 different carpet burns were compared that included the
polyester, nylon and olefin carpets, carpet padding and a mixture of polyester carpet and carpet
padding. For synthetic/processed flooring, 27 different burns were compared from the vinyl and
laminate flooring substrates. For the wood based flooring, 27 different burns were compared that
included yellow pine and plywood. Similarities were observed between the processed and wood
flooring pyrolysis products. Both contain mostly oxygenated pyrolysis/combustion products.

109
Table 2: Common pyrolysis/combustion products for carpet flooring from laboratory burns
Compound Occurrence in %
Styrene 80.7%
*Benzaldehyde 68.4%
2,4-dimethyl-1-heptene 54.4%
*Acetophenone 47.4%
Toluene 43.9%
Alpha methylstyrene 36.8%
Biphenyl 28.1%
Naphthalene 24.6%
Caprolactam 15.8%
Benzene 12.3%
4-phenylbutronitrile 10.5%
Benzonitrile 8.8% * Oxygenated component
Table 3: Common pyrolysis/combustion products for processed flooring from laboratory burns
Compound Occurrence in %
*Methyl ester hexadecanoic acid 52.2%
*2-ethyl-1-hexanol 52.2%
Toluene 47.8%
Benzene 47.8%
*2-furaldehyde 43.5%
*Methyl isobutyl ketone 39.1%
*Furfuryl alcohol 34.8%
*Benzaldehyde 34.8%
*Alpha terpinol 26.1%
*2-methoxyphenol 26.1%
*2-methoxy-4-methylphenol 17.4%
*Hexanal 17.4% * Oxygenated component

110
Table 4: Common pyrolysis/combustion products for wood flooring from laboratory burns
Compound Occurrence in %
*2-furaldehyde 65.2%
Alpha pinene 60.9%
*Hexanal 60.9%
*Nonanal 56.5%
*2-methoxyphenol 47.8%
*4-ethyl-2-methoxyphenol 43.5%
*5-methylfurfural 43.5%
*1-pentanol 39.1%
*Pentanal 34.8%
*Eugenol 34.8%
*Octanal 34.8%
*1-methoxy-4-(2-propenyl) benzene 34.8% * Oxygenated component
The majority of the highest occurring components from the burning of the different
flooring substrates appeared to be oxygenated compounds. Aromatic components were also
commonly listed components identified within the chromatographic profiles of the different
laboratory burns. Benzaldehyde and styrene were both identified in over 40% of substrate burns
within this research. Although wood and processed flooring mostly yielded oxygenated
components, carpets yielded more varied pyrolysis/combustion products. The variation observed
from the burning and analysis of different types of flooring material was reflective of the
variability of fire debris. The expansion of the Substrate Database to include many different
substrates will provide analysts with another tool to utilize during the analysis process to identify
the presence of ILR in fire debris.
111
CHAPTER 5: CONCLUSION
A burning method, MDDM, was utilized previously to study pyrolysis and combustion
products that were expected to be produced in a fire scene. Those results were compiled to form
the Substrate Database. Three additional burning methods, TH, BH and FURN, were established
to further study fire debris and pyrolysis effects in a laboratory setting. From the results, it was
difficult to replicate casework fire debris, but pertinent information could be gathered from this
research. Each substrate that was burned produced a different chromatographic profile with
different pyrolysis/combustion products and a different product pattern. Increase in burn time
affected each outputted TIC in different ways directly related to the substrate and burn method
being utilized. MDDM allowed for observation of many possible pyrolysis/combustion products
that could be observed from the burning of a material. However, every possible
pyrolysis/combustion product from the burning of a substrate may not be observed in casework
fire debris. Additional laboratory burning methods facilitated different possible burn scenarios.
This created multiple product profiles of substrates that were observable with the use of GC-MS
instrumentation utilizing ASTM E1412 extraction method. One laboratory burning method that
was most applicable to real life fire debris could not be chosen. Outputted TIS (total ion spectra),
which were projected onto the calculated PCA spaces, displayed the similarities in types of
pyrolysis/combustion products. Outputted TICs displayed differences in pyrolysis/combustion
products, product pattern, and chromatographic profile for the different burn methods and burn
times. The use of both TIS and TICs for comparison of the burn data allowed for the observation
of similarities and differences amongst the different laboratory burns.

112
A few improvements and continuing research could help escalate these studies for the
benefit of further understanding fire debris. One suggestion that could be implemented is
researching the effects of older substrates versus newer substrates. Understandably, it would be
reasonable to burn additional substrates using multiple burn methods to analyze the outputted
pyrolysis/combustion products. In terms of the burning methods, the FURN laboratory burn
method was not able to be done consecutively. The FURN laboratory method was able to be
performed twice at 2 and 5 minutes, then the tube furnace needed to be cooled before performing
the next burn. A possible solution could be to perform the MDDM method at a longer burning
time in hopes to simulate the FURN laboratory burns. Improving the BH laboratory burning
method, that was heated through two layers, would require the use of a paint can lid instead of
the tin boat and metal pan for heating. This will allow the heat to be indirectly applied from
underneath the material as the flame will only have to go through one layer. Weighing each
substrate to ensure consistency for each individual substrate could be beneficial. Another
improvement could be to perform additional experimentations similar to the addition of ignitable
liquid to carpeting and carpet padding, but on the other various substrates to see the outputted
pyrolysis product profiles. All of these improvements would only further add to the overall
coverage of the Substrate Database.
Furthermore, the analysis of the many different chromatographic profiles in comparison
to casework fire debris and the Substrate/Ignitable Liquid databases were beneficial. TH and BH
laboratory burn points consistently clustered together due to condensation. MDDM laboratory
burn TICs tended to observe the largest amount of identified pyrolysis/combustion products due
to the burn taking place within a container and condensate retained within the paint can. Shifting

113
in projections with increase in burn time was frequently observed for all burn methods. Shifts in
location of the projected points corresponded to changes in composition of the samples. The
biggest takeaway was observing the similarity between the laboratory burn data and the LSB,
ILRC and Substrate data sets. Information regarding the classification was more complex using
this study, but a few substrates were very similar to the data contained in the Substrate Database.
Indicators present in the product profile could aid the analyst in determining the presence of a
particular substrate, such as the major cellulosic products in wood. Investigation of simulated
laboratory burns using different burn methods allowed for the observation of the similarities and
differences of chemical composition within particular substrates chosen for this research.
The most beneficial aspect to this research was the expansion of the Substrate Database
to not only include additional substrates, but additional burning methods that potentially yielded
slightly different pyrolysis/combustion products. This updated database could aide analysts in
attempting to interpret chromatographic profiles that were analyzed from a fire scene. Certain
pyrolysis/combustion products could be linked to a substrate that is burned, while other peaks
could be linked to ILR that is from addition of ignitable liquid. The ILRC is currently the largest
non-profit Ignitable Liquid and Substrate databases able to be studied by anyone that has internet
access. Studying different pyrolysis processes and observing patterns amongst different
substrates facilitated further understanding of real world fire debris. Through the optimization of
different laboratory burn methods, knowledge about fire debris and sample pyrolysis/combustion
interpretation could be obtained.

114
APPENDIX: COPYRIGHT PERMISSIONS
115
ELSEVIER LICENSE
TERMS AND CONDITIONS
Aug 05, 2016
This Agreement between Richard Coulson ("You") and Elsevier ("Elsevier") consists of your
license details and the terms and conditions provided by Elsevier and Copyright Clearance
Center.
License Number 3887790403906
License date Jun 14, 2016
Licensed Content Publisher Elsevier
Licensed Content Publication Science & Justice
Licensed Content Title Concept of pyrolysis for fire debris
analysts
Licensed Content Author E. Stauffer
Licensed Content Date January 2003
Licensed Content Volume Number 43
Licensed Content Issue Number 1
Licensed Content Pages 12
Start Page 29
End Page 40
Type of Use reuse in a thesis/dissertation
Portion figures/tables/illustrations
Number of figures/tables/illustrations 1
Format both print and electronic
Are you the author of this Elsevier article? No
Will you be translating? No
Order reference number
Original figure numbers figure 1
Title of your thesis/dissertation
Optimizing Laboratory Pyrolysis
Methods to Compliment Real World Fire
Debris

116
Expected completion date Aug 2016
Estimated size (number of pages) 150
Elsevier VAT number GB 494 6272 12
Requestor Location
Richard Coulson
174 Crystal Oak Dr.
DELAND, FL 32720
United States
Attn: Richard Coulson
Total 0.00 USD
Terms and Conditions
https://s100.copyright.com/CustomerAdmin/PLF.jsp?ref=d2f7a959-f9f5-41e4-a900-
dca49227881d
ELSEVIER LICENSE
TERMS AND CONDITIONS
Aug 05, 2016
This Agreement between Richard Coulson ("You") and Elsevier ("Elsevier") consists of
your license details and the terms and conditions provided by Elsevier and Copyright
Clearance Center.
License Number 3877230787080
License date May 27, 2016
Licensed Content Publisher Elsevier
Licensed Content Publication Science & Justice
Licensed Content Title Concept of pyrolysis for fire debris analysts
Licensed Content Author E. Stauffer
Licensed Content Date January 2003
Licensed Content Volume Number 43
Licensed Content Issue Number 1
Start Page 29
End Page 40
Type of Use reuse in a thesis/dissertation
Portion figures/tables/illustrations
117
Number of figures/tables/illustrations 6
Format both print and electronic
Are you the author of this Elsevier article? No
Will you be translating? No
Order reference number
Original figure numbers Figure 6 and Figure 12
Title of your thesis/dissertation Optimizing Laboratory Pyrolysis Methods to
Compliment Real World Fire Debris
Expected completion date Aug 2016
Estimated size (number of pages) 150
Elsevier VAT number GB 494 6272 12
Requestor Location
Richard Coulson
174 Crystal Oak Dr.
DELAND, FL 32720
United States
Attn: Richard Coulson
Billing Type Invoice
Billing Address
Richard Coulson
174 Crystal Oak Dr.
DELAND, FL 32720
United States
Attn: Richard Coulson
Total 0.00 USD
Total 0.00 USD
INTRODUCTION
1. The publisher for this copyrighted material is Elsevier. By clicking "accept" in connection
with completing this licensing transaction, you agree that the following terms and conditions
apply to this transaction (along with the Billing and Payment terms and conditions
established by Copyright Clearance Center, Inc. ("CCC"), at the time that you opened your
Rightslink account and that are available at any time at http://myaccount.copyright.com).
GENERAL TERMS

118
2. Elsevier hereby grants you permission to reproduce the aforementioned material subject to
the terms and conditions indicated.
3. Acknowledgement: If any part of the material to be used (for example, figures) has
appeared in our publication with credit or acknowledgement to another source, permission
must also be sought from that source. If such permission is not obtained then that material
may not be included in your publication/copies. Suitable acknowledgement to the source
must be made, either as a footnote or in a reference list at the end of your publication, as
follows:
"Reprinted from Publication title, Vol /edition number, Author(s), Title of article / title of
chapter, Pages No., Copyright (Year), with permission from Elsevier [OR APPLICABLE
SOCIETY COPYRIGHT OWNER]." Also Lancet special credit - "Reprinted from The
Lancet, Vol. number, Author(s), Title of article, Pages No., Copyright (Year), with
permission from Elsevier."
4. Reproduction of this material is confined to the purpose and/or media for which
permission is hereby given.
5. Altering/Modifying Material: Not Permitted. However figures and illustrations may be
altered/adapted minimally to serve your work. Any other abbreviations, additions, deletions
and/or any other alterations shall be made only with prior written authorization of Elsevier
Ltd. (Please contact Elsevier at [email protected])
6. If the permission fee for the requested use of our material is waived in this instance, please
be advised that your future requests for Elsevier materials may attract a fee.
7. Reservation of Rights: Publisher reserves all rights not specifically granted in the
combination of (i) the license details provided by you and accepted in the course of this
licensing transaction, (ii) these terms and conditions and (iii) CCC's Billing and Payment
terms and conditions.
8. License Contingent Upon Payment: While you may exercise the rights licensed
immediately upon issuance of the license at the end of the licensing process for the
transaction, provided that you have disclosed complete and accurate details of your proposed
use, no license is finally effective unless and until full payment is received from you (either
by publisher or by CCC) as provided in CCC's Billing and Payment terms and conditions. If
full payment is not received on a timely basis, then any license preliminarily granted shall be
deemed automatically revoked and shall be void as if never granted. Further, in the event
that you breach any of these terms and conditions or any of CCC's Billing and Payment terms
and conditions, the license is automatically revoked and shall be void as if never
granted. Use of materials as described in a revoked license, as well as any use of the
materials beyond the scope of an unrevoked license, may constitute copyright infringement

119
and publisher reserves the right to take any and all action to protect its copyright in the
materials.
9. Warranties: Publisher makes no representations or warranties with respect to the licensed
material.
10. Indemnity: You hereby indemnify and agree to hold harmless publisher and CCC, and
their respective officers, directors, employees and agents, from and against any and all claims
arising out of your use of the licensed material other than as specifically authorized pursuant
to this license.
11. No Transfer of License: This license is personal to you and may not be sublicensed,
assigned, or transferred by you to any other person without publisher's written permission.
12. No Amendment Except in Writing: This license may not be amended except in a writing
signed by both parties (or, in the case of publisher, by CCC on publisher's behalf).
13. Objection to Contrary Terms: Publisher hereby objects to any terms contained in any
purchase order, acknowledgment, check endorsement or other writing prepared by you,
which terms are inconsistent with these terms and conditions or CCC's Billing and Payment
terms and conditions. These terms and conditions, together with CCC's Billing and Payment
terms and conditions (which are incorporated herein), comprise the entire agreement between
you and publisher (and CCC) concerning this licensing transaction. In the event of any
conflict between your obligations established by these terms and conditions and those
established by CCC's Billing and Payment terms and conditions, these terms and conditions
shall control.
14. Revocation: Elsevier or Copyright Clearance Center may deny the permissions described
in this License at their sole discretion, for any reason or no reason, with a full refund payable
to you. Notice of such denial will be made using the contact information provided by
you. Failure to receive such notice will not alter or invalidate the denial. In no event will
Elsevier or Copyright Clearance Center be responsible or liable for any costs, expenses or
damage incurred by you as a result of a denial of your permission request, other than a refund
of the amount(s) paid by you to Elsevier and/or Copyright Clearance Center for denied
permissions.
LIMITED LICENSE
The following terms and conditions apply only to specific license types:
15. Translation: This permission is granted for non-exclusive world English rights only
unless your license was granted for translation rights. If you licensed translation rights you
may only translate this content into the languages you requested. A professional translator

120
must perform all translations and reproduce the content word for word preserving the
integrity of the article.
16. Posting licensed content on any Website: The following terms and conditions apply as
follows: Licensing material from an Elsevier journal: All content posted to the web site must
maintain the copyright information line on the bottom of each image; A hyper-text must be
included to the Homepage of the journal from which you are licensing at
http://www.sciencedirect.com/science/journal/xxxxx or the Elsevier homepage for books at
http://www.elsevier.com; Central Storage: This license does not include permission for a
scanned version of the material to be stored in a central repository such as that provided by
Heron/XanEdu.
Licensing material from an Elsevier book: A hyper-text link must be included to the Elsevier
homepage at http://www.elsevier.com . All content posted to the web site must maintain the
copyright information line on the bottom of each image.
Posting licensed content on Electronic reserve: In addition to the above the following
clauses are applicable: The web site must be password-protected and made available only to
bona fide students registered on a relevant course. This permission is granted for 1 year only.
You may obtain a new license for future website posting.
17. For journal authors: the following clauses are applicable in addition to the above:
Preprints:
A preprint is an author's own write-up of research results and analysis, it has not been peer-
reviewed, nor has it had any other value added to it by a publisher (such as formatting,
copyright, technical enhancement etc.).
Authors can share their preprints anywhere at any time. Preprints should not be added to or
enhanced in any way in order to appear more like, or to substitute for, the final versions of
articles however authors can update their preprints on arXiv or RePEc with their Accepted
Author Manuscript (see below).
If accepted for publication, we encourage authors to link from the preprint to their formal
publication via its DOI. Millions of researchers have access to the formal publications on
ScienceDirect, and so links will help users to find, access, cite and use the best available
version. Please note that Cell Press, The Lancet and some society-owned have different
preprint policies. Information on these policies is available on the journal homepage.
Accepted Author Manuscripts: An accepted author manuscript is the manuscript of an
article that has been accepted for publication and which typically includes author-

121
incorporated changes suggested during submission, peer review and editor-author
communications.
Authors can share their accepted author manuscript:
• immediately
o via their non-commercial person homepage or blog
o by updating a preprint in arXiv or RePEc with the accepted manuscript
o via their research institute or institutional repository for internal
institutional uses or as part of an invitation-only research collaboration
work-group
o directly by providing copies to their students or to research
collaborators for their personal use
o for private scholarly sharing as part of an invitation-only work group
on commercial sites with which Elsevier has an agreement
• after the embargo period
o via non-commercial hosting platforms such as their institutional
repository
o via commercial sites with which Elsevier has an agreement
In all cases accepted manuscripts should:
• link to the formal publication via its DOI
• bear a CC-BY-NC-ND license - this is easy to do
• if aggregated with other manuscripts, for example in a repository or other site, be
shared in alignment with our hosting policy not be added to or enhanced in any way
to appear more like, or to substitute for, the published journal article.
Published journal article (JPA): A published journal article (PJA) is the definitive final
record of published research that appears or will appear in the journal and embodies all
value-adding publishing activities including peer review co-ordination, copy-editing,
formatting, (if relevant) pagination and online enrichment.
Policies for sharing publishing journal articles differ for subscription and gold open access
articles:
Subscription Articles: If you are an author, please share a link to your article rather than the
full-text. Millions of researchers have access to the formal publications on ScienceDirect, and
so links will help your users to find, access, cite, and use the best available version.

122
Theses and dissertations which contain embedded PJAs as part of the formal submission can
be posted publicly by the awarding institution with DOI links back to the formal publications
on ScienceDirect.
If you are affiliated with a library that subscribes to ScienceDirect you have additional
private sharing rights for others' research accessed under that agreement. This includes use
for classroom teaching and internal training at the institution (including use in course packs
and courseware programs), and inclusion of the article for grant funding purposes.
Gold Open Access Articles: May be shared according to the author-selected end-user
license and should contain a CrossMark logo, the end user license, and a DOI link to the
formal publication on ScienceDirect.
Please refer to Elsevier's posting policy for further information.
18. For book authors the following clauses are applicable in addition to the above: Authors
are permitted to place a brief summary of their work online only. You are not allowed to
download and post the published electronic version of your chapter, nor may you scan the
printed edition to create an electronic version. Posting to a repository: Authors are
permitted to post a summary of their chapter only in their institution's repository.
19. Thesis/Dissertation: If your license is for use in a thesis/dissertation your thesis may be
submitted to your institution in either print or electronic form. Should your thesis be
published commercially, please reapply for permission. These requirements include
permission for the Library and Archives of Canada to supply single copies, on demand, of
the complete thesis and include permission for Proquest/UMI to supply single copies, on
demand, of the complete thesis. Should your thesis be published commercially, please
reapply for permission. Theses and dissertations which contain embedded PJAs as part of the
formal submission can be posted publicly by the awarding institution with DOI links back to
the formal publications on ScienceDirect.
Elsevier Open Access Terms and Conditions
You can publish open access with Elsevier in hundreds of open access journals or in nearly
2000 established subscription journals that support open access publishing. Permitted third
party re-use of these open access articles is defined by the author's choice of Creative
Commons user license. See our open access license policy for more information.
Terms & Conditions applicable to all Open Access articles published with Elsevier:

123
Any reuse of the article must not represent the author as endorsing the adaptation of the
article nor should the article be modified in such a way as to damage the author's honour or
reputation. If any changes have been made, such changes must be clearly indicated.
The author(s) must be appropriately credited and we ask that you include the end user license
and a DOI link to the formal publication on ScienceDirect.
If any part of the material to be used (for example, figures) has appeared in our publication
with credit or acknowledgement to another source it is the responsibility of the user to ensure
their reuse complies with the terms and conditions determined by the rights holder.
Additional Terms & Conditions applicable to each Creative Commons user license:
CC BY: The CC-BY license allows users to copy, to create extracts, abstracts and new
works from the Article, to alter and revise the Article and to make commercial use of the
Article (including reuse and/or resale of the Article by commercial entities), provided the
user gives appropriate credit (with a link to the formal publication through the relevant DOI),
provides a link to the license, indicates if changes were made and the licensor is not
represented as endorsing the use made of the work. The full details of the license are
available at http://creativecommons.org/licenses/by/4.0.
CC BY NC SA: The CC BY-NC-SA license allows users to copy, to create extracts,
abstracts and new works from the Article, to alter and revise the Article, provided this is not
done for commercial purposes, and that the user gives appropriate credit (with a link to the
formal publication through the relevant DOI), provides a link to the license, indicates if
changes were made and the licensor is not represented as endorsing the use made of the
work. Further, any new works must be made available on the same conditions. The full
details of the license are available at http://creativecommons.org/licenses/by-nc-sa/4.0.
CC BY NC ND: The CC BY-NC-ND license allows users to copy and distribute the Article,
provided this is not done for commercial purposes and further does not permit distribution of
the Article if it is changed or edited in any way, and provided the user gives appropriate
credit (with a link to the formal publication through the relevant DOI), provides a link to the
license, and that the licensor is not represented as endorsing the use made of the work. The
full details of the license are available at http://creativecommons.org/licenses/by-nc-nd/4.0.
Any commercial reuse of Open Access articles published with a CC BY NC SA or CC BY
NC ND license requires permission from Elsevier and will be subject to a fee.
Commercial reuse includes:
• Associating advertising with the full text of the Article
• Charging fees for document delivery or access
• Article aggregation

124
• Systematic distribution via e-mail lists or share buttons
Posting or linking by commercial companies for use by customers of those companies.
20. Other Conditions:
v1.8
Questions? [email protected] or +1-855-239-3415 (toll free in the US) or
+1-978-646-2777.
https://s100.copyright.com/CustomerAdmin/PLF.jsp?ref=1d9e51a1-146a-4447-b435-
6a2e7a9ae37b

125
REFERENCES
1. Administration, U. S. F. U.S. Fire Statistics. https://www.usfa.fema.gov/data/statistics/.
2. DeHaan, J. D., Kirk's Fire Investigation. 4th Ed. ed.; Prentice Hall Inc.: 1997.
3. Stauffer, E., Sources of interference in fire debris analysis. In Fire Investigation, 2002.
4. Stauffer, E. D., J.; Newman R., Fire Debris Analysis. Elsevier Inc.: 2008.
5. Icove, D. J. D., John D., Forensic Fire Scene Reconstruction. 2nd ed.; Pearson Prentice
Hall: 2009.
6. ASTM, ASTM E1618 Standard Test Method for Ignitable Liquid Residues in Extracts
from Fire Debris Samples by Gas Chromatography-Mass Spectrometry. West
Conshohocken, PA, 2014.
7. Almirall, J. R.; Furton, K. G., Characterization of background and pyrolysis products that
may interfere with the forensic analysis of fire debris. J. Anal. Appl. Pyrolysis 2004, 71
(1), 51-67.
8. Bertsch, W., Volatiles from carpet: a source of frequent misinterpretation in arson
analysis. J. Chromatogr. A 1994, 674 (1-2), 329-333.
9. Dehaan, J. D.; Bonarius, K., Pyrolysis products of structure fires. J. Forensic Sci. Soc.
1988, 28 (5-6), 299-309.
10. Stauffer, E., Concept of pyrolysis for fire debris analysts. Sci. Justice 2003, 43 (1), 29-40.
11. Ferreiro-Gonzalez, M.; Ayuso, J.; Alvarez, J. A.; Palma, M.; Barroso, C. G., Application
of an HS-MS for the detection of ignitable liquids from fire debris. Talanta 2015, 142,
150-156.
12. Wall, L. A., Pyrolysis of polymers. J. Elastoplast. 1973, 5 (Jan.), 36-65.

126
13. Simmons, R. F. In Fire chemistry, Academic: 1995; pp 405-473.
14. CDS Analytical, I., Degradation Mechanisms - Random Scission. 2000.
15. Madorsky, S. L., Rates of thermal degradation of organic polymers. SPE J. 1962, 18,
1482-1490.
16. CDS Analytical, I., Degradation Mechanisms - Side Group Scission. 2000.
17. Wampler, T. P. In Analytical pyrolysis: an overview, CRC Press LLC: 2007; pp 1-26.
18. CDS Analytical, I., Degradation Mechanisms - Depolymerization. 2000.
19. Kusch, P. In Pyrolysis-gas chromatography/mass spectrometry of polymeric materials,
InTech: 2012; pp 343-362.
20. Lentini, J. J.; Dolan, J. A.; Cherry, C., The Petroleum-laced background. J. Forensic Sci.
2000, 45 (5), 968-989.
21. Powell, R. J., Testimony Tested by Fire. Fire and Arson Investigator 1992.
22. DeHaan, J. D., Fire: Fatal Intensity. Fire and Arson Investigator 1992.
23. Jhaumeer-Laulloo, S. M., J.; Ramtoola, L. L., Characterization of Background and
Pyrolysis Products that May Interfere with Forensic Analysis of Fire Debris in Mauritius.
Pure and Applied Chemical Sciences 2013, 1 (2), 51-61.
24. FloorBiz Nylon Carpet Fiber. http://www.floorbiz.com/carpet/carpet-buying-
guide/carpet-fiber/nylon-carpet-fiber.htm (accessed 11/29/2005).
25. Lee, X. Q.; Sandercock, P. M. L.; Harynuk, J. J., The influence of temperature on the
pyrolysis of household materials. J. Anal. Appl. Pyrolysis 2016, 118, 75-85.
26. FloorBiz Olefin Carpet Fiber (Polypropylene). http://www.floorbiz.com/carpet/carpet-
buying-guide/carpet-fiber/olefin-carpet-fiber.htm (accessed 11/29/2005).

127
27. Ying-yu, L. D., L.; Hao, S., An Analysis of Background Interference on Fire Debris.
Procedia Engineering 2013, 52, 664-670.
28. Faix, O.; Fortmann, I.; Bremer, J.; Meier, D., Thermal degradation products of wood: gas
chromatographic separation and mass spectrometric characterization of polysaccharide
derived products. Holz Roh- Werkst. 1991, 49 (5), 213-219.
29. Lowden, L. A. H., T. R., Flammability Behavior of Wood and a Review of the Methods
for Its Reduction. Fire Science Reviews 2013, 2 (4), 1-19.
30. Lentini, J. J., Persistence of floor coating solvents. J. Forensic Sci. 2001, 46 (6), 1470-
1473.
31. Hakkarainen T.; Mikkola E.; Ostman B; Tsantaridis, L. Innovative Eco-Efficient High
Fire Performance Wood Products for Demanding Applications; SP Swedish National
Testing and Research Institute: 2005.
32. AZoM Vinyl Flooring. http://www.azom.com/article.aspx?ArticleID=1018.
33. Wells, S. B., The identification of Isopar H in vinyl flooring. J. Forensic Sci. 2005, 50
(4), 865-872.
34. Helleur, R., Analytical Pyrolysis of Natural Organic Polymers, Edited by Serban C.
Moldoveanu. J. Anal. Appl. Pyrolysis 2001, 57 (2), 305-306.
35. What is Laminate Flooring? http://www.armstrong.com/flooring/what-is-laminate-
flooring.html.
36. HPDL vs. LPL. http://www.wilsonart.com/sites/default/files/docs/resources/technical-
information-technical-bulletins-hpl-vs-lpl.pdf.

128
37. Association, N. A. L. F., Laminate Flooring Specifications and Test Methods. In
Laminate Flooring, NALFA: 2011; pp 1-45.
38. Laminate. http://www.abbeycarpet.com/products_vinyl.asp.
39. ASTM E1412 Standard Practice for Separation of Ignitable Liquid Residues from Fire
Debris Samples by Passive Headspace Concentration with Activated Charcoal. ASTM:
West Conshohocken, PA, 2014.
40. Newman, R. In ASTM approach to fire debris analysis, CRC Press LLC: 2004; pp 165-
191.
41. Williams, M. R.; Fernandes, D.; Bridge, C.; Dorrien, D.; Elliott, S.; Sigman, M.,
Adsorption saturation and chromatographic distortion effects on passive headspace
sampling with activated charcoal in fire debris analysis. J. Forensic Sci. 2005, 50 (2),
316-325.
42. Cacho, J. I.; Campillo, N.; Aliste, M.; Vinas, P.; Hernandez-Cordoba, M., Headspace
sorptive extraction for the detection of combustion accelerants in fire debris. Forensic
Sci. Int. 2014, 238, 26-32.
43. Sigman, M. E.; Williams, M. R.; Castelbuono, J. A.; Colca, J. G.; Clark, C. D., Ignitable
Liquid Classification and Identification Using the Summed-Ion Mass Spectrum. Instrum.
Sci. Technol. 2008, 36 (4), 375-393.
44. Varmuza, K., Introduction to Multivariate Statistical Analysis in Chemometrics. CRC
Press: Boca Raton, Florida, 2009; p 1-313.
45. Zadora, G. M., A.; Ramos, D.; Aitken, C., Statistical Analysis in Forensic Science. John
Wiley & Sons, Ltd: 2014.
129
46. Sigman, M. E.; Williams, M. R., Covariance Mapping in the Analysis of Ignitable
Liquids by Gas Chromatography/Mass Spectrometry. Anal. Chem. 2006, 78 (5), 1713-
1718.
47. Sigman, M. E.; Williams, M. R.; Ivy, R. G., Individualization of Gasoline Samples by
Covariance Mapping and Gas Chromatography/Mass Spectrometry. Anal. Chem.
(Washington, DC, U. S.) 2007, 79 (9), 3462-3468.
48. Waddell, E. E.; Williams, M. R.; Sigman, M. E., Progress toward the determination of
correct classification rates in fire debris analysis II: utilizing soft independent modeling
of class analogy (SIMCA). J Forensic Sci 2014, 59 (4), 927-935.
49. Lopatka, M.; Sigman, M. E.; Sjerps, M. J.; Williams, M. R.; Vivo-Truyols, G., Class-
conditional feature modeling for ignitable liquid classification with substantial substrate
contribution in fire debris analysis. Forensic Sci. Int. 2015, 252, 177-186.
50. Sigman, M. E.; Williams, M. R., Assessing evidentiary value in fire debris analysis by
chemometric and likelihood ratio approaches. Forensic Sci. Int. 2016, 264, 113-121.
51. Lewis, J. The Application of Chemometrics to the Detection and Classification of
Ignitable Liquids in Fire Debris Using the Total Ion Spectrum. University of Central
Florida, 2008.
52. Ignitable Liquid Reference Collection. University of Central Florida: National Center for
Forensic Science, 2016.
53. Substrate Database. University of Central Florida: National Center for Forensic Science,
2016.
130
54. Castelbuono, J. A. The Identification of Ignitable Liquids in the Presence of Pyrolysis
Products: Generation of a Pyrolysis Product Database. Univesirty of Central Florida,
2008.
55. Sandercock, M. L., Preparation of Pyrolysis Reference Samples: Evaluation of a Standard
Method Using a Tube Furnace. Forensic Sciences 2012, 57 (3), 738-743.
56. Peebles, L. H., Jr.; Huffman, M. W., Thermal degradation of nylon 66. J. Polym. Sci.,
Part A-1: Polym. Chem. 1971, 9 (7), 1807-1822.
57. Methyl palmitate. Thermo Fisher Scientific: Alfa Aesar, 2016.
58. Agency, E. P. Methyl Isobutyl Ketone (Hexone).
https://www3.epa.gov/airtoxics/hlthef/methyl-k.html.
59. Organization, W. H., Environmental Health Criteria 209. In Flame Retardants: Tris
(Chlorophyl) Phosphate and Tris (2-Chlorethyl) Phosphate, ICPS, 1998.
60. Ryan, V. Plywood. http://www.technologystudent.com/joints/plywood1.html.
61. White, R. H.; Dietenberger, M. A., Wood Products: Thermal Degradation and Fire. In
Encyclopedia of Materials: Science and Technology, Elsevier: 2001; pp 1-5.