Optimized Perfusion Management and Patient Outcome 2_1_Justison... · Optimized Perfusion...
31
Optimized Perfusion Management and Patient Outcome GEORGE JUSTISON CCP MANAGER PERFUSION SERVICES UNIVERSITY OF COLORADO HOSPITAL
Transcript of Optimized Perfusion Management and Patient Outcome 2_1_Justison... · Optimized Perfusion...

Optimized Perfusion
Management and Patient
Outcome
GEORGE JUSTISON CCP
MANAGER PERFUSION SERVICES
UNIVERSITY OF COLORADO HOSPITAL

University of Colorado Hospital
Main hospital in University of Colorado Health System
University Hospital – Aurora, Colorado
Poudre Valley Hospital – Ft. Collins, Colorado
Medical Center of the Rockies – Loveland, Colorado
Memorial Hospital – Colorado Springs, Colorado
The only academic hospital on the eastern Rocky Mountain range
Ranked #1 in quality by the University Health Consortium
Ranked one of the top hospitals in the USA by US News and World
Report
≈ 700 CPB procedures per year (all adult)

What does optimized perfusion
management mean to you?
Reduced Hemodilution
Patient size matched extracorporeal circuits “prescriptive circuit design” ?
Autologous priming ?
Restrictive transfusion ?

Matching ECC to the Patient
Benefits
Increased use of small adult
oxygenators from 39 to 63%
Raised average hematocrit nadir
from 8.38 to 8.76 g/dL
Reduced PRBC transfusion
Females 1.5 to 1.74 M2 BSA
Males 1.75 to 1.99 M2 BSA
Blood flow selection should be
made on lean body mass (LBM)

3 Pillars of Optimized Perfusion
Equipment Selection
• Optimized Adult Oxygenator
• GME Protection
ECC Management
• Dynamic Operating Volume
• Suction Blood Management
Data Driven Management
• CONNECT™
• Goal Directed Perfusion (GDP)

University of Colorado Perfusion Transition
Sorin Primox
2006 to 2013
Only adult oxygenator
3/8 arterial and 3/8 venous
27 μ Sorin D731 filter
VAVR
Revolution centrifugal pump
1400 ml priming volume
DMS Data Management
Sorin Inspire
March 2013 MAS
Inspire 8
Inspire 6
Transition Q4 2013
Increase use each Q
Inspire 6F only adult oxygenator
850 ml priming volume
3/8 “ A-V loop
Revolution centrifugal
VAVR
900 + Inspire 6 cases
CONNECT with GDP

What size oxygenator do you need?
15 % Isolated CABG
27 % Isolated single valve
37 % Complex procedures
69 % of patients had predicted blood flow < 5 LPM
23 % 5 – 5.5 LPM
8 % > 5.5 LPM
Smallest Patient
149 cm, 48 Kg, 1.4 M2 BSA, BMI 22
Largest Patient
193 cm, 200Kg, 3.3 M2 BSA, BMI 55
Average CPB time 173 minutes
Longest pump run = 7 hours 43 min (463 min)
15%
17%
10%
17%
20%
4%
5%
12%
Case Mix
CABG AVR MVR COMB V AORTA VAD TX OTHER
12
22
35
23
53
0
5
10
15
20
25
30
35
40
<4 4.0-4.5 4.5-5.0 5.0-5.5 5.5-6.0 >6.0
% o
f p
atie
nts
Blood Flow (l/min)
Calculated Blood Flow

Index of Oxygenator Design Efficiency
Quadrox Quadrox SA Rx 15 Rx 25 Fusion Inspire 6 Inspire 8
Surface area (M2) 1.8 1.5 1.5 2.5 2.5 1.4 1.75
HE area (M2) 0.4 0.3 0.14 0.22 0.4 0.43 0.43
Combined SA (M2) 2.2 1.8 1.64 2.72 2.9 1.83 2.18
Max Flow (LPM) 7 5 5 7 7 6 8
Static Priming Volume (ml) 215 175 135 250 260 184 219
0
0,5
1
1,5
2
2,5
3
3,5
4
4,5
5
Quadrox Quadrox
SA
RX15 RX25 Fusion Inspire 6 Inspire 8
Ratio of Max Rated Flow to Total SASorin Inspire 6 is the only small adult oxygenator rated to 6
LPM covering > 97% of patients
Same heat exchanger surface area as Inspire 8
The Inspire family is the most efficient oxygenator when you
compare rated flow to total surface area exposure

Can an optimized oxygenator serve all patients?
HT
(cm)
WT (Kg) BMI BSA (M2) Q
(LPM)
CPB (min) Hgb
(g/dl)
Age (y)
Min 145 43 17 1.35 3.0 76 7.0 24
Max 193 143 41 2.63 6.45 292 12.8 87
Mean 173 81 27 1.9 4.5 171 10.5 59
SD 10.5 24 6.2 0.3 0.62 57.8 1.4 15
0,0
100,0
200,0
300,0
400,0
500,0
600,0
700,0
1 5 9
13
17
21
25
29
33
37
41
45
49
53
57
61
65
69
73
77
81
85
89
93
97
101
105
109
113
117
121
125
129
133
137
141
145
149
153
157
161
165
169
173
177
181
185
189
ml O
2/m
in
Oxygen Consumption (Green) v. Potential Max Oxygen Transfer (Blue)
n = 193
• Oxygen Transfer
Range =147-420 ml O2/min
Mean = 252 (58.9) ml
O2/min
• % Oxygen Transfer Utilization
• 5 - 87% of oxygenator • Average 35 %
• Sorin Inspire 6 is a capable
of supporting all patients
while providing a reduced
FSA exposure
• Using GDP adds an
increased level of safety

Factors and Management of AKI
Intraoperative Factors:
• CPB-SIRS response
• Emboli from CPB
• Hemodynamic alterations
Intraoperative Strategies:
• Minimize hemodilution
• MAP 50 – 70 mmHg
• Optimize Flows: 2.2 – 2.5 (Do2i)
• Minimize CPB time
Cardiopulmonary Bypass-associated Acute Kidney Injury
Avinash B. Kumar, MD; Manish Suneja, MD
Anesthesiology 2011: 114:964-70
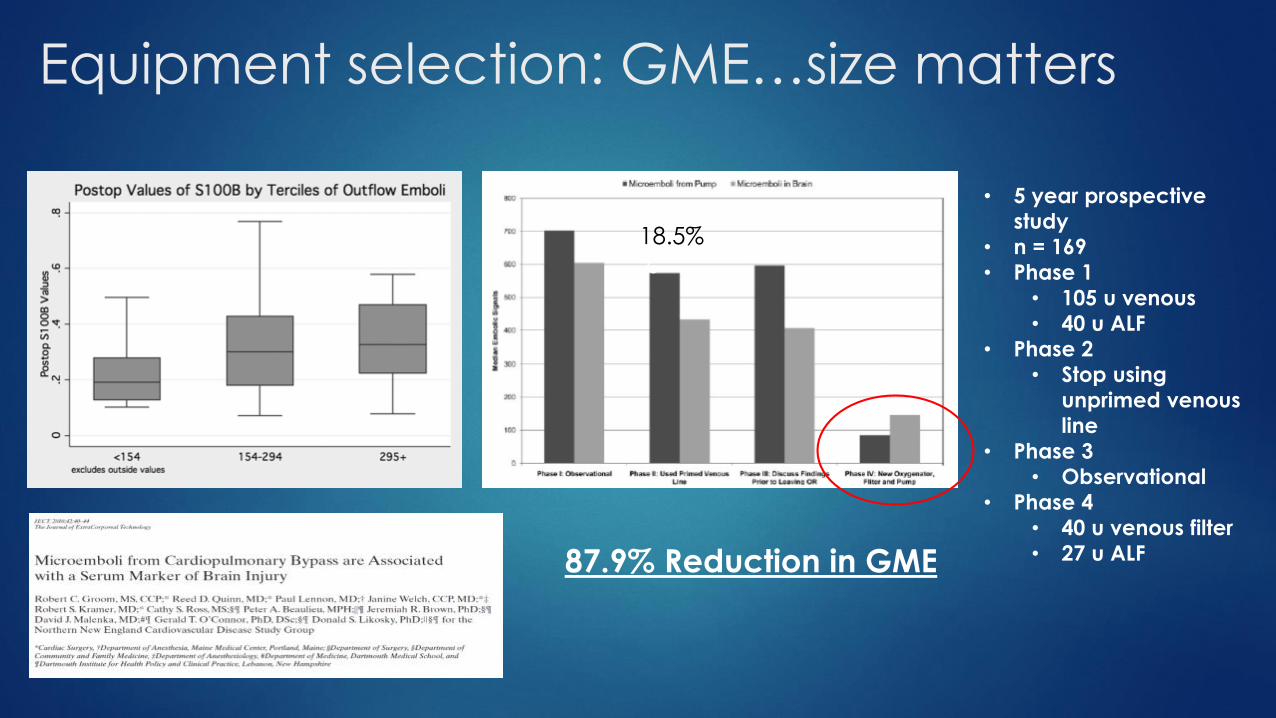
Equipment selection: GME…size matters
• 5 year prospective
study
• n = 169
• Phase 1
• 105 u venous
• 40 u ALF
• Phase 2
• Stop using
unprimed venous
line
• Phase 3
• Observational
• Phase 4
• 40 u venous filter
• 27 u ALF87.9% Reduction in GME
18.5%
%

Integrated Filter Design
• Integrated filter with bubble trap design in
combination with a 40 micron venous return
filter had the lowest embolic volume at both
3.5 and 5 L/min flow

Compared two oxygenator designs with integrated arterial filters
Terumo FX 25 and Sorin Synthesis
Fiber bundle screen filter wrap v. Separate filter chamber with screen filter
C-reactive protein, INR, aPTT, Fibrinogen, albumin, total proteins
Outcomes: Blood loss, transfusion rates
Separate filter chamber design
Decreased blood loss (p = 0.009)
Decreased red cell transfusion ( p = 0.008)
Decreased FFP (p = 0.0001)
Decreased c-reactive protein (p = 0.034)
Separate filter chamber designed showed less inflammation and better preservation of coagulation proteins. “
ASAIO 2012
C-Reactive Protein

Reducing GME Separate Filter Chamber Design
Acts like traditional arterial line filter
Screen filtration
Buoyancy
Reduction in velocity
Active purge
Maintains integrated filter convenience
Priming
Same volume as small adult ALF
Circuit configuration options
Place close to the table
Protection

Reducing GME
Improved suction blood management with dual reservoir
Separation of high inflammatory load suction blood for
alternative processing
Autotransfusion v. direct infusion
Separation of high v. low GME load
Aortic root vents v. LV vent and pump suction
Better waterfall blood handling (reduced GME generation)
Antifoam avoidance
Increased circuit protection
Pre / Post heparinization

Venous Filtration Pore Size
4047
150
105
150
105
170
38
175
0
20
40
60
80
100
120
140
160
180
200
Inspire Terumo Affinity Fusion Quadrox Bag ROCSafe Medtronic
RH
MECC
Mic
ron
Oxygenator alone is not enough to remove GME.
Efficiency ranges from 40 ≈ 98% depending on design

Pillar 2: Improved ECC Management
Dynamic Operating Volume: total effect on hemodilution
The total volume required to reach
the rated flow
Static prime volume of components
Volume not available for patient management
Venous down tube
Venous filter holdup
Minimum operating volume
Arterial filter

Dynamic Operating Volume
0
100
200
300
400
500
600
700
800
Inspire 6F FX15 FX25 Quadrox ia Fusion MECC ROCSafe25 Medtronic
RH
ml
Oxygenator Filter Min Level V Filter V Collector
502
400
515
756
675
495 500
694
6 LPM
5 LPM
• Does not include volume of centrifugal pump• Does not include A-V loop
• The Sorin Inspire 6F can meet the
dynamic operating volume of
traditional minimal “closed”ECC
systems
• Same DOV with separate ALF
• D731 (27μ ALF) + Inspire 6M
• Lower static priming components
improve the effectiveness of
autologous priming techniques
Some data in this slide courtesy of G. Meyers

Dynamic Operating Volume
• Does not include volume of centrifugal pump• Does not include A-V loop
• If you choose a non-integrated
low prime arterial filter:
• Same DOV
• Expanded application with the
Inspire 6
• Inspire = 6 LPM
• RX 15 = 5 LPM
502 500
Inspire 6 + D731 RX15 + AL6X
V Collector
V Filter
Min Level
Filter
Oxygenator
6 LPM 4-5 LPM

Improved DOV of Sorin Inspire 6 leads to decreased
transfusion and reduced acute kidney injury
Inspire 6 v. Compactflo EVO or EOS 905
Conventional circuit prime volume = 775 ml
Inspire 6 priming volume = 624 ml
151 ml prime saving
N = 383 Inspire 6 patients
Reduced transfusion rate
Reduced transfusion volume (# units)
Reduced acute kidney injury (AKI)
Small improvements in dynamic operating volume can have significant patient outcome results
1% drop in hematocrit = 7% increase risk of AKI
Ranucci M., Pistuddi V.,
Carboni G., Effects of priming volume reduction on allogeneic red blood cell transfusions and renal outcomes after heart surgery., Perfusion,
May 2014

Improved Dynamic Operating Volume =
Reduced Hemodilution
Improved static priming volume
More complete autologous
priming (retrograde + antegrade)
Average net priming volume
32 % reduction
Improved operating volume
Increased working volume
Reduced added volume on CPB
70% reduction in added volume
Reduced hemodilution
Reduced transfusion requirement
1735
1889
1704
1726
1751
868
676
718
675
586
2517
2012
1605
1336
749
2013
Q3
2013
Q4
2014
Q1
2014
Q2
2014
Q3
Perioperative Volume Management n = 535
Anesthesia Volume Net ECC Prime Volume Volume Added on CPB
n = 535

Value of Improved DOV
Improved Dynamic Operating
Volume (DOV) yields more usable
volume for blood flow management
% Hematocrit Drop
Baseline 36%
Inspire Group 12%
Chance of a transfusion free experience (95% CI)
Patient baseline hematocrit 34% to 27%
Avoids transfusion in smaller more anemic
patients
Baseline Inspire
Mean Tx (U) 2.8 0.63
f 46 20
0
5
10
15
20
25
30
35
40
45
Base Hct 1st CPB Hct nadir Hct Final Hct
%
Anemia Management
Baseline No Tx
Inspire No Tx

Effect of Sorin Inspire and Goal Directed
Perfusion (GDP) on PRBC Transfusion
0
5
10
15
20
25
30
35
40
45
50
2013 Q3 2013 Q4 2014 Q1 2014 Q2 2014 Q3
PRBC Utilization Rate Baseline PRBC Transfusion Rate
46%
Volume mean 2.8 units
End of Q3 2014 PRBC Rate
20%
Volume mean 0.63 units
50% reduction in frequency of PRBC
77% reduction in volume of PRBC units

More than DMS version 2
Sorin CONNECT™ with GDP Monitor More than a data collection and electronic
record tool
Perfusion management tool
Data to perfusion calculations
Grouped in meaningful arrangement
University of Colorado format
CI, relative flow and SVR
Temperature gradient ∆T
CrSO2 and MAP
Continuous display of DO2i along with normal
perfusion parameters

Value of Electronic Perfusion Records
• Reduce practice
variation
• Assist with QI projects

• More accurate data
• Better reproduction of
CPB
More time to
concentrate on
actual patient
management


0
100
200
300
400
500
Control GDP Control Tx GDP Tx
ml/
min
/m2
Oxygen Delivery
HI Low Mean
p = 0.98
p = 0.05
Control GDP p Control tx GDP tx P
CI 2.1 (0.27) 2.3 (0.22) 0.003 1.7 (0.24) 2.6 (0.2) < 0.001
HCT 30 (6.1) 27 (4.7) 0.04 21.5 (1.4) 21.8 (1.7) 0.94
DO2277
(58.6)
272
(46.3)
0.98 208 (37.3) 252 (20.9) 0.05
Optimizing oxygen delivery N = 140 patients
Control group HCT = 30 %
GDP group HCT = 27 %
Adjust CI to maintain same DO2
Anemia management
Select appropriate blood flow
Identify when to transfuse
Unable to maintain DO2i
DO2i/VCOi < 4.8
Oxygen extraction ratio > 35 %
Identify volume to transfuse
Only give what you need
Physiological basis for PRBC transfusion
Continuous GDP information reduces variation
0
10
20
30
40
50
Control GDP Control tx GDP tx
%
New AKI %
p = 0.04p = 0.001

Routine GDP™ Monitoring and AKI
• Baseline AKI rate before July 2014 = 25%
• July 50% use of GDP
• July – Dec average AKI = 8.4%
• 12 month (July 2015) AKI = 5%
80% reduction in rate of new AKI
0
5
10
15
20
25
30
0
50
100
150
200
250
300
350
AK
I R
ate
%
ml O
2/m
in/m
2
nadir DO2i and AKI %
nadir DO2 AKI Rate
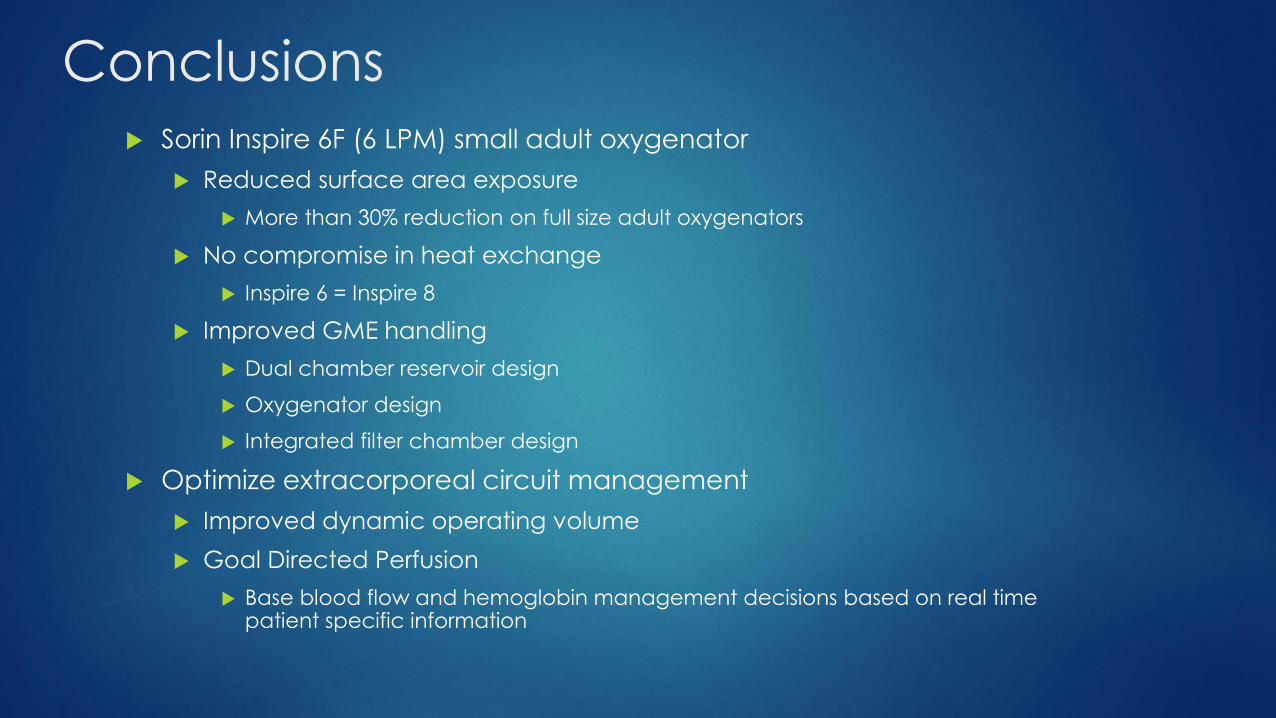
Conclusions
Sorin Inspire 6F (6 LPM) small adult oxygenator
Reduced surface area exposure
More than 30% reduction on full size adult oxygenators
No compromise in heat exchange
Inspire 6 = Inspire 8
Improved GME handling
Dual chamber reservoir design
Oxygenator design
Integrated filter chamber design
Optimize extracorporeal circuit management
Improved dynamic operating volume
Goal Directed Perfusion
Base blood flow and hemoglobin management decisions based on real time patient specific information