OPTIMIZED ANTENNA RADIATION PATTERNS REDUCE · PDF fileoptimized antenna radiation patterns...
16
Mentum • 16/18 avenue Morane Saulnier 78140 Vélizy, France • www.mentum.com OPTIMIZED ANTENNA RADIATION PATTERNS REDUCE OVERALL NETWORK INTERFERENCE A study using Mentum Planet network planning software AUGUST 2012 Fergal Lawlor, CEO, Alpha Wireless Regis Lerbour, Technology Director, Mentum 0
Transcript of OPTIMIZED ANTENNA RADIATION PATTERNS REDUCE · PDF fileoptimized antenna radiation patterns...
M e n t u m • 1 6 / 1 8 a v e n u e M o r a n e S a u l n i e r 7 8 1 4 0 V é l i z y , F r a n c e • w w w . m e n t u m . c o m
OPTIMIZED ANTENNA RADIATION PATTERNS REDUCE
OVERALL NETWORK INTERFERENCE
A study using Mentum Planet network planning software
AUGUST 2012
Fergal Lawlor, CEO, Alpha Wireless
Regis Lerbour, Technology Director, Mentum
0

2
About Mentum
Mentum provides industry-leading software and service solutions enabling wireless operators, equipment vendors
and consultants to efficiently plan, manage and optimize wireless access and backhaul networks, plan coverage ex-
pansions and launch new broadband wireless networks. Its advanced software solutions, including Mentum Planet,
Mentum Ellipse, Mentum Fusion, Mentum CellPlanner, Mentum LinkPlanner along with Mentum Geodata, enable
network operators and engineers to maximize their design potential. Through the company's global presence and
focused business approach, it helps more than 375 customers in 120 countries define their wireless networks. Men-
tum is headquartered in Paris, with offices in Dallas, Ottawa, Hong Kong, Stockholm and Tokyo. For more infor-
mation, please go to http://www.mentum.com
About Alpha Wireless
Alpha Wireless design and supply high performance base station antennas for 4G applications - LTE and WiMAX.
Using patented technology its antennas minimise network interference, while maintaining a competitive price. Cus-
tomers include Samsung, Alvarion, Airspan, Juni and Clearwire. For more information, please go to
http://www.alphaantennas.com/
3
Table of Contents
Introduction 4
Network Interference 5
Antennas and Interference 6
Using Mentum Planet to measure the effects of upper sidelobes 8
Project Set-up 8
Project Implementation 10
Project Results - Downtown 10
Project Results - Suburbs 12
Project Results - Summary 15
Conclusions 16

4
OPTIMIZED ANTENNA RADIATION PATTERNS REDUCE
OVERALL NETWORK INTERFERENCE
Introduction
Mobile network users always look for the best quality of service (QoS). The QoS depends on many fac-
tors such as the technology, the coverage, the capacity of the mobile network, etc. Interference is a factor
as important as coverage because while there is less interference, there is better QoS.
The traditional antennas for the mobile networks generate interferences but the intensity of these interfer-
ences depends on its radiation pattern. The choice of suitable antennas is important to provide good
QoS.
Mentum Planet™ tool support advanced antennas (E.g. Multi-beam antennas, Quad-pole antennas, mul-
ti-sector configurations) and offer a good representation of physical antennas (E.g. modelling of antenna
ports, e-controllers, etc.). This tool has the available Antenna Editors, and lets you organize, view, and
manage all elements of the antenna system.
This white paper explores how Mentum Planet™ Tool can be used to make a comparison between differ-
ent models of antennas and is broken down into the following sections:
What is network interference and why it is important to reduce interference to operators?
Why an optimized antenna is better than a non-optimized antenna?
How can Mentum Planet Tool be used to verify the advantages of an optimized antenna?

5
Network Interference
Interference is anything which interferes with the integrity of a signal travelling between a transmitter and
a receiver. In cellular networks, this can often be caused by frequency reuse that is the practice of reusing
bandwidth across the network. Therefore stray radiation from one cell, can disrupt transmission in other
nearby cells using the same frequency. This becomes even more pertinent in LTE networks where a fre-
quency reuse of one is quite common.
Voice is more forgiving than data. But, data corrupted due to interference may have to be re-transmitted,
and this puts additional pressure on the network. Figure 1 shows the growth in data traffic from 2010-
2015, and a 26X increase is predicted. This will put severe strain on networks, so reducing interference
so that capacity is not wasted, will become more important.
Fig 1: Global mobile data traffic will increase 26X from 2010 to 2015.
(Source: Cisco Visual Networking Index; Global Data Traffic Forecast 2010-2015)

6
Antennas and Interference
Badly designed base station antennas are one source of interference.
An antenna radiation pattern describes how an antenna emits radiation. Figure 2 shows an example. Tra-
ditionally, the antenna radiation description is represented by a horizontal and vertical cross-section of
this 3D pattern. Figure 3 shows a horizontal cross section (azimuth) in black, and a vertical cross section
(elevation) in red.
In addition to the main antenna beam (lobe), the antenna creates some unwanted radiation, in the form of
upper sidelobes, lower sidelobes and backlobes. The upper sidelobes are the main source of network
interference, and their effect is the main emphasis of this study. One objective of good antenna design is
to suppress all upper sidelobes to at least 18dB below peak. Figure 4 shows an example of good and bad
upper sidelobe suppression.
Fig. 2: Antenna Pattern (3D)

7
Fig. 3: Azimuth and Elevation Patterns
Fig. 4: Upper Sidelobes – Optimized versus non-optimized antennas
How do upper sidelobes contribute to interference? Figure 5 illustrates the problem. The main beam
(shown in yellow) defines the cell boundary. Adjusting the downtilt of the antenna increases or decreases
the cell boundary. The unwanted upper sidelobes (shown in green) are a known source of interference in
cellular networks. When the antenna has no downtilt (main beam pointing at boresight) the upper side-
lobes travel upwards and there is little chance of interference. However, when downtilt is applied to the

8
antenna these unwanted upper sidelobes can now be directed towards neighbouring cells which causes
interference if the same frequency is being used.
Fig. 5: Effect of Upper Sidelobes
Using Mentum Planet to measure the effects of upper sidelobes
Mentum Planet is a popular planning and optimization software tool for wireless access networks.
The objective of this study is to analyze, using Mentum Planet, the effects on a network of using antennas
with optimized radiation patterns versus using antennas with non-optimized radiation patterns. Alpha
Wireless antennas will be used for the former, and a radiation pattern from a more typical antenna (i.e.
non-optimized) will be used for the latter.
Project Set-up
The city of Paris was used as an example of a high density network. Both the downtown and suburban
areas were analysed. Figure 6 shows a summary of the study area.

9
Downtown Paris
84.9km2 – 183 sites
Inter-site distance – 0.5-.7km
Suburban Paris
1688 km2 – 625 sites
Inter-site distance – 1-4km
Fig. 6: Study Network
Figure 7 shows the antenna patterns used. Two scenarios were explored using the software. The first
with all non-optimised antennas (typical), the second with all optimised parts (Alpha Wireless).
Non-optimized antenna pattern used Optimized antenna pattern used
Fig. 7: Antenna patterns used
The network type was defined as follows:
• LTE TDD • Frequency Band: 2.6 GHz • Bandwidth: 20 MHz • Downlink/Uplink configuration: DSUUDDSUUD
10
• Special Sub frame Configuration: 3 • Single carrier – Frequency reuse of 1 • Mobile Equipment
• 7dB noise figure • 24 dBm transmit power
Project Implementation
The performance of both antenna types was evaluated by using Mentum Planet to generate coverage
maps of the following performance indicators in both downtown and suburban Paris.
Receive Signal Receive Power (RSRP)
Receive Signal Receive Quality (RSRQ) and or Downlink C/(N+I)
Downlink Average Data Rate1
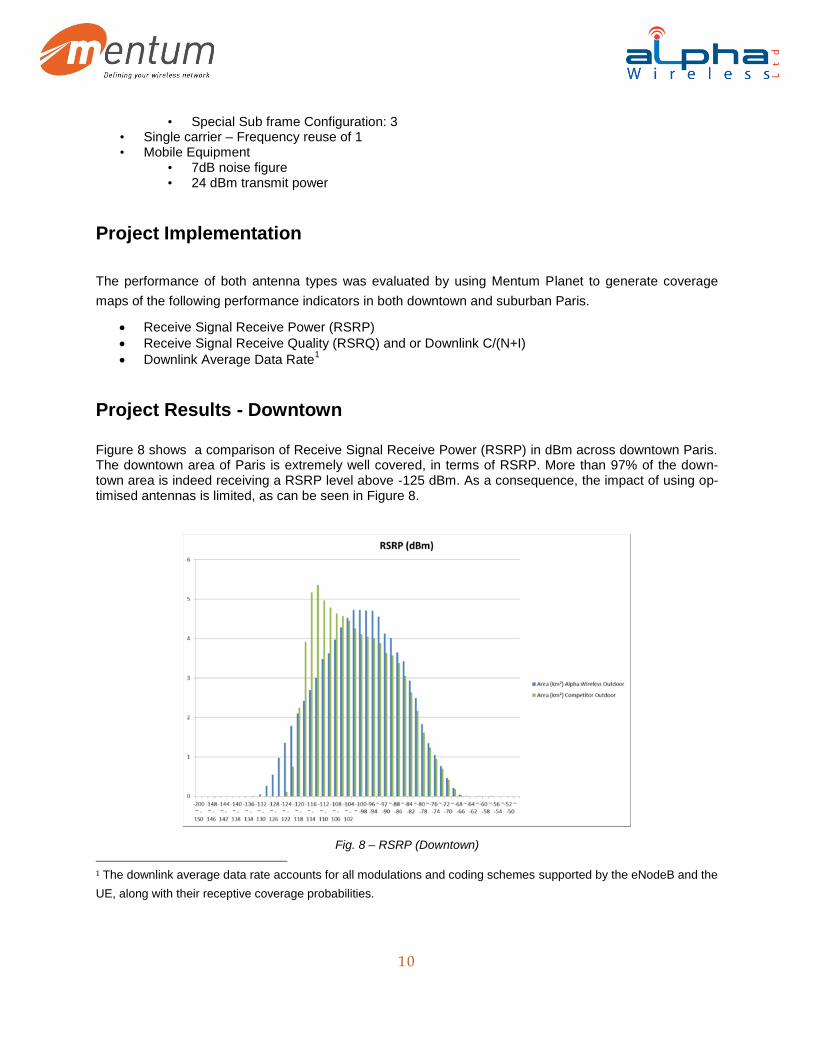
Project Results - Downtown
Figure 8 shows a comparison of Receive Signal Receive Power (RSRP) in dBm across downtown Paris. The downtown area of Paris is extremely well covered, in terms of RSRP. More than 97% of the down-town area is indeed receiving a RSRP level above -125 dBm. As a consequence, the impact of using op-timised antennas is limited, as can be seen in Figure 8.
Fig. 8 – RSRP (Downtown) 1 The downlink average data rate accounts for all modulations and coding schemes supported by the eNodeB and the
UE, along with their receptive coverage probabilities.

11
In terms of RSRQ, the difference between using optimised and non-optimised antennas is much greater.
Due to its upper sidelobe suppression capabilities, the optimised antenna helps to reduce interference
levels, which has a direct impact on RSRQ levels. As can be seen in Figure 9, the density of high RSRQ
levels (above -13dB) is much higher with optimised antennas than it is with non-optimised antennas.
Similarly, the density of low RSRQ levels is much lower. It is clear that the
use of optimised antennas has reduced the interference levels and contributed to turning areas of low RSRQ levels (below -13dB) to higher levels.
Fig. 9 – RSRQ (Downtown)
The reduction of interference levels directly impacts the CINR levels (as can be seen with the RSRQ in the previous section), which in turn impacts the data rate experienced by mobile users. As can be seen in Figure 10, areas of low data rates (below 6 Mbps) are considerably reduced thanks to the use of opti-mised antennas. Additionally, optimised antennas help to increase the highest data rates (above 42 Mbps) to a level that cannot be achieved using the non-optimised antennas.

12
Fig. 10 – Downlink Rate (Downtown)
Project Results - Suburbs
Unlike the downtown area, the suburbs encompasses areas that are not necessarily fully covered. As can be seen in Figure 11, the use of optimised antennas helps to fill the coverage holes (areas of RSRP lev-els below -120 dBm are considerably reduced compared to the use of non-optimised antennas).

13
Fig. 11 – RSRP (Suburbs)
Just as in the downtown area, the upper sidelobe suppression capabilities of optimised antennas helps to reduce the interference levels which has a direct impact on Downlink C/(N+I) levels. As presented in Fig-ure 12, the density of high Downlink C/(N+I) levels (above 10dB) is much higher with optimised antennas than it is with non-optimised antennas. Similarly, the density of low Downlink C/(N+I) levels is much lower. It is clear that the use of optimised antennas has reduced the interference levels and contributed to turn-ing areas of low Downlink C/(N+I) levels to higher levels.

14
Fig. 12 – C/(N+I) (Suburbs)
The better downlink C/(N+I) levels observed with optimised antennas directly translates into higher down-
link average data rates, as shown in Figure 13. In particular, it is worth noting that the areas of no data
rate (data rate of 0 Mbps, where coverage is missing) are significantly reduced, and that high data rates
unachieved with the non-optimised antennas are reached due to the use of optimized antennas.

15
Fig. 13 – Downlink Data Rate (Suburbs)
Project Results - Summary
Table 1 summarises the improvement in coverage gain for data rates of <5Mbps and >42Mbps. Im-
provements of 40-200% were achieved. Significant improvements, which can only lead to greater user
satisfaction.
Optimized Antenna
(non-covered area)
Non-optimized Antenna
(non-covered area)
Coverage
Gain
<5Mbps Downtown 13.9% 23% 40%
>42Mbps Downtown 3.6% 2.1% 70%
<5Mbps Suburban 1.3% 4.5% 70%
>42Mbps Suburban 6.5% 2.3% 200%
Table 1: Improvement Summary

16
Conclusions
Your base station antenna choice can impact on the efficiency of your network. Inadequate upper side-
lobe suppression in an antenna design can lead to increased interference, which can only result in less
and more dissatisfied network users. In this study, a large city network was analysed using both opti-
mised and non-optimised antenna parts, and gains in coverage area from 40-200% were achieved using
antennas with optimised radiation patterns.