OPTIMIZATION OF RUNNER SYSTEM OF MULTI-CAVITY … · Autodesk Simulation Moldflow (2014), MFA is a...
7
© 2018, IRJET | Impact Factor value: 7.211 | ISO 9001:2008 Certified Journal | Page 295 OPTIMIZATION OF RUNNER SYSTEM OF MULTI-CAVITY INJECTION MOLDING PROCESS: A CASE STUDY FOR ELECTRICAL SWITCH BOX Sushil Gahlot 1 , Abdul Samad 2 , Dr. Y. B. Mathur 3 1 Assistant Professor, Manda Institute of Technology, Raisar, Bikaner. 2 Assistant Professor, Marudhar Engineering College, Raisar, Bikaner. 3 Lecturer, Govt. Polytechnic College, Bikaner. -----------------------------------------------------------------------***------------------------------------------------------------------------ Abstract - Plastic made products are essential part of human life. Small and large scale both industries are work in this area. Plastic products qualities are dependent on their process parameters as well as material selection. In present study process parameters are used for research purpose. Aim of present study is to minimize the plastic injection molding defects using hot feeding system. A finite element method approach is used to simulate the electrical switch box by helping of “Autodesk Mold-flow Adviser” Software. All experiments are designed according design of experiment technique. Taguchi method is used in current study. Total five factors are selected with three levels each. According to taguchi method total 27 experiments are required to gain some meaning full outcomes. Two responses are selected in present study. ANOVA analysis is also performed in present study using commercial software MINITAB. Linear modeling equations are developed for both responses using regression modeling analyses. This study is useful for small scale industries worked for electrical switch box manufacturing. Keywords: FEM, Autodesk MFA, Taguchi method, ANOVA, Linear Modeling equation etc. 1. INTRODUCTION Injection molding is used at large scale in India for Polymeric fabrication process for thermoplastic materials. This process is like die casting but difficulties are more than simple metal casting. The reason behind is plastic high viscosity of liquid plastic than molten metal. Due to high viscosity high range of pressure is required to overcome the defects made during injection process. In injection molding two pressures are most important part of the succession of plastic injection molding, first one is injection pressure and second is packing pressure required to pack the final product. Injection molding process is a cyclic operation involved during injection like transformation of plastic pellets into molten liquid than filled in cavity and in last again solidifies in molded part. Electrical energy operated machines are more dominant in today’s era. The main components of a typical injection molding machine are the following clamping unit, the plasticizing unit, and the drive unit; they are shown in Fig. Fig. 1. Plastic Injection Molding Machine 2. NUMERICAL SIMULATION Autodesk Simulation Moldflow (2014), MFA is a complete suite of definitive tools for simulating, analyzing, optimizing and validating plastics part and mold designs in plastics injection molding. MFA address the broadest range of manufacturing issues and design geometry types associated with plastics molding processes. Thus, MFA can work to reduce or eliminate time delays, improve part quality, and deliver projects within budget constraints. With MFA analysis modules, filling, packing, and cooling stages of the plastic, the injection molding process can be simulated. MFA also predict post-molding phenomena such as shrinkage sink mark, air trap, weld line, and war page of the products. In addition, MFA offers an expanded material database, which includes over 9300 unique plastic materials for use in plastic injection molding process simulation software in order to ensure that users have access to the highest quality material data for plastic simulation. International Research Journal of Engineering and Technology (IRJET) e-ISSN: 2395-0056 Volume: 05 Issue: 09 | Sep 2018 www.irjet.net p-ISSN: 2395-0072
Transcript of OPTIMIZATION OF RUNNER SYSTEM OF MULTI-CAVITY … · Autodesk Simulation Moldflow (2014), MFA is a...

© 2018, IRJET | Impact Factor value: 7.211 | ISO 9001:2008 Certified Journal | Page 295
OPTIMIZATION OF RUNNER SYSTEM OF MULTI-CAVITY INJECTION
MOLDING PROCESS: A CASE STUDY FOR ELECTRICAL SWITCH BOX
Sushil Gahlot1, Abdul Samad2, Dr. Y. B. Mathur 3
1 Assistant Professor, Manda Institute of Technology, Raisar, Bikaner. 2 Assistant Professor, Marudhar Engineering College, Raisar, Bikaner.
3 Lecturer, Govt. Polytechnic College, Bikaner. -----------------------------------------------------------------------***------------------------------------------------------------------------Abstract - Plastic made products are essential part of human life. Small and large scale both industries are work in this area. Plastic products qualities are dependent on their process parameters as well as material selection. In present study process parameters are used for research purpose. Aim of present study is to minimize the plastic injection molding defects using hot feeding system. A finite element method approach is used to simulate the electrical switch box by helping of “Autodesk Mold-flow Adviser” Software. All experiments are designed according design of experiment technique. Taguchi method is used in current study. Total five factors are selected with three levels each. According to taguchi method total 27 experiments are required to gain some meaning full outcomes. Two responses are selected in present study. ANOVA analysis is also performed in present study using commercial software MINITAB. Linear modeling equations are developed for both responses using regression modeling analyses. This study is useful for small scale industries worked for electrical switch box manufacturing.
Keywords: FEM, Autodesk MFA, Taguchi method, ANOVA, Linear Modeling equation etc.
1. INTRODUCTION
Injection molding is used at large scale in India for Polymeric fabrication process for thermoplastic materials. This process is like die casting but difficulties are more than simple metal casting. The reason behind is plastic high viscosity of liquid plastic than molten metal. Due to high viscosity high range of pressure is required to overcome the defects made during injection process. In injection molding two pressures are most important part of the succession of plastic injection molding, first one is injection pressure and second is packing pressure required to pack the final product. Injection molding process is a cyclic operation involved during injection like transformation of plastic pellets into molten liquid than filled in cavity and in last again solidifies in molded part. Electrical energy operated machines are more dominant in today’s era. The main components of a typical injection molding machine are the following clamping unit, the plasticizing unit, and the drive unit; they are shown in Fig.
Fig. 1. Plastic Injection Molding Machine
2. NUMERICAL SIMULATION
Autodesk Simulation Moldflow (2014), MFA is a complete suite of definitive tools for simulating, analyzing, optimizing and validating plastics part and mold designs in plastics injection molding. MFA address the broadest range of manufacturing issues and design geometry types associated with plastics molding processes. Thus, MFA can work to reduce or eliminate time delays, improve part quality, and deliver projects within budget constraints. With MFA analysis modules, filling, packing, and cooling stages of the plastic, the injection molding process can be simulated. MFA also predict post-molding phenomena such as shrinkage sink mark, air trap, weld line, and war page of the products. In addition, MFA offers an expanded material database, which includes over 9300 unique plastic materials for use in plastic injection molding process simulation software in order to ensure that users have access to the highest quality material data for plastic simulation.
International Research Journal of Engineering and Technology (IRJET) e-ISSN: 2395-0056
Volume: 05 Issue: 09 | Sep 2018 www.irjet.net p-ISSN: 2395-0072

© 2018, IRJET | Impact Factor value: 7.211 | ISO 9001:2008 Certified Journal | Page 296
3. MATERIAL USED
In this study a common material was selected for product making and selection was based on literature review and material name was Globalene 6331. Required material properties were shown in table 1.
Step 1
Import a CAD model, which was created
in Auto-desk Inventor 2014.
Step 2
Mesh the CAD model
Step 3
Material Selection: Globalene 6331:
Taiwan P
Step 4
Simulation type selections
Step 5
Process parameters selection
Melt Temperature
Mold Temperature
Injection Speed
Packing Pressure
Gate Diameter
Step 6
Results
Material Fill time in Second
Confidence of fill of the product
Pressure drop of product
Volumetric Shrinkage at Ejection
International Research Journal of Engineering and Technology (IRJET) e-ISSN: 2395-0056
Volume: 05 Issue: 09 | Sep 2018 www.irjet.net p-ISSN: 2395-0072

© 2018, IRJET | Impact Factor value: 7.211 | ISO 9001:2008 Certified Journal | Page 297
TABLE – 1: Material Properties of Globalene 6331
S.NO. PROPERTIES VALUE
1 Specific Heat (Cp) 3100 J/kg C
2 Elastic Modulus 1340 MPa
3 Poisson’s Ratio 0.392
4 Shear Modulus 481.3 MPa
5 Melt Temperature 254.5 C
6 Density 0.92889 gm/cm3
7 Thermal conductivity 0.17 W/m-C
9 Energy Usage Indicator 3
4. PROBLEM DESCRIPTION
The problem focused in this study was to apply CAE methods in plastic injection molding process to improve productivity of thick plastic products. In this study five controlling factors named mold temperature, melt temperature, injection pressure, packing pressure and one geometrical factor named gate diameter were used with three levels by application of taguchi tables were used for design of experiment.
Gate Location of the design
5. DESIGN OF EXPERIMENT METHODOLOGY
The product quality made from plastic injection molding process is always affected by its process parameters like injection pressure, injection speed, mold temperature, melt temperature, packing pressure, packing time, cooling time and many more. The effects of these parameters were studied by various researchers from last decades. It was very difficult to design, experiments for any type of research and here a scientific approach is helpful for researchers which is known as “DESIGN OF EXPERIMENT”.
This technique was adopted by researcher for this study. By use of DOE techniques any researcher can determine important factors which are responsible for output result variation of experiments. DOE can found optimum solution for particular experiments.
6. FACTORS AND LEVELS
Design of DOE table was only possible by selection of proper factors and their levels. In this study five factors were selected with three levels for each product and were shown in table 2.
TABLE - 2: Summary table of Factors and Levels for used product
Outcome parameters for this study were fill time and volumetric shrinkage (%) shown in below table 3. After selection of factors and levels for current study it was important to select accurate orthogonal array and for this task MINITAB software was used for making of orthogonal array of factors and their levels.
7. RESULT AND DISCUSSION
Single cavity plastic injection molding process was simulated in this study for mouse family. Autodesk mold flow adviser ultimate FEM package was used for simulation purpose. All experiments were designed according to DOE technique (Taguchi orthogonal array table), which were discussed in table 3. Main outcomes focused in this were following:
Injection Pressure, Fill Time, Volumetric Shrinkage, Analysis of variance (ANOVA).
Signal to noise ratio was simple method to predict the effect of changing of factors according their levels to find effect on product quality. In this study “smaller is better” was adopted as quality indicator for S/N ratio.
The response tables for both design cases were shown in table 3 and table 4 respectively. S/N ratio gives best combination of input parameters for both cases.
International Research Journal of Engineering and Technology (IRJET) e-ISSN: 2395-0056
Volume: 05 Issue: 09 | Sep 2018 www.irjet.net p-ISSN: 2395-0072

© 2018, IRJET | Impact Factor value: 7.211 | ISO 9001:2008 Certified Journal | Page 298
TABLE - 3: L27 Orthogonal Array with Result Parameter of Hot Runner
Ex. No
A
(Mold
Temp)
B
(Melt Temp
)
C
Inj pressure
D
(Inj. Speed %)
E
(Packing Pr.
MPa)
Shrinkage %
Fill time
(sec)
1 35 210 75 60 1 8.706 1.815
2 35 210 75 60 1.5 8.997 1.815
3 35 210 75 60 2 9.137 1.798
4 35 220 85 70 1 8.745 1.645
5 35 220 85 70 1.5 9.293 1.633
6 35 220 85 70 2 8.363 1.636
7 35 230 95 80 1 9.008 1.489
8 35 230 95 80 1.5 9.521 1.477
9 35 230 95 80 2 9.838 1.461
10 40 210 85 80 1 7.856 1.774
11 40 210 85 80 1.5 8.437 1.76
12 40 210 85 80 2 8.727 1.751
13 40 220 95 60 1 9.262 1.654
14 40 220 95 60 1.5 10 1.639
15 40 220 95 60 2 9.755 1.641
16 40 230 75 70 1 9.538 1.488
17 40 230 75 70 1.5 10.13 1.477
18 40 230 75 70 2 8.403 1.933
19 45 210 95 70 1 10.42 1.469
20 45 210 95 70 1.5 8.904 1.917
21 45 210 95 70 2 9.153 1.767
22 45 220 75 80 1 8.607 1.626
23 45 220 75 80 1.5 9.229 1.614
24 45 220 75 80 2 9.539 1.606
25 45 230 85 60 1 12.79 1.654
26 45 230 85 60 1.5 10.98 1.488
27 45 230 85 60 2 10.98 1.488
“Signal to Noise” ratio was simple method to predict the effect of changing of factors according their levels to find effect on product quality. In this study “smaller is better” was adopted as quality indicator for S/N ratio.
From Table 4 it is concluded that melt temperature is most important parameter whereas packing pressure is less important parameter. On the basis of mean ratio it is concluded that it also showed same results like S/N ratio
TABLE – 4: Response table for S/N ratio
Levels
(Mold Temp)
(Melt Temp)
(Inj. Press)
(Packing pres.)
Gate Dia.
1 -16.27 -16.15 -16.35 -17.11 -16.54
2 -16.31 -16.39 -16.65 -16.40 -16.65
3 -17.10 -17.15 16.70 -16.17 -16.49
delta 0.83 1.0 0.35 0.94 0.16
rank 3 1 4 2 5
TABLE -5: The response table for mean value
Levels (Mold Temp)
(Melt Temp)
(Inj. Press)
(Packing Pr.)
Gate dia.
1 5.354 5.345 5.414 5.867 5.530
2 5.401 5.416 5.611 5.440 5.573
3 5.846 5.841 5.576 5.296 5.499
delta 0.492 0.496 0.197 0.571 0.074
rank 3 2 4 1 5
Response table for plastic product were show that input Parameter melting temperature, was most critical responsible parameter for shrinkage and fill time outcomes.
Rank was also show based on response table. Most critical parameter was melting temperature whereas less important parameter was packing pressure because level values were high and show no effect in product quality variation. Figure 8 and 9 show graphical presentation of S/N ration and also show best cases for all experiments.
International Research Journal of Engineering and Technology (IRJET) e-ISSN: 2395-0056
Volume: 05 Issue: 09 | Sep 2018 www.irjet.net p-ISSN: 2395-0072

© 2018, IRJET | Impact Factor value: 7.211 | ISO 9001:2008 Certified Journal | Page 299
The best set of combination parameters is determined by selecting the levels with high S/N ratio values from tables or graph.
Best Set: A1-B1-C1-D3-E3 (S/N ratio) Best Set: A1-B1-C1-D3-E3 (Mean ratio)
Although S/N ratio was good approach to find optimum combination of input parameters but for the verification MEANS based study was also show in this study and response figure based on means is shown below. Figure shows that most important parameter was packing pressure for the given case like S/N ratio but the optimum combination is changed in S/N ratio.
The best set of combination parameters should be determined by selecting the levels with low mean values from figure.
ANOVA ANALYSIS
The analysis of variance was calculated for plastic product and results were shown in below tables respectively. In ANOVA analysis F-Test was conduct to compare a model
variance with a residual variance. F value was calculated from a model mean square divided by residual mean square value. If f value was approaching to one means both variances were same, according F value highest was best to find critical input parameter.
TABLE – 6: ANOVA results for Shrinkage
Source DF Adj. SS Adj. MS F-Value
P-Value
Regression 5 17.1898 3.43796 7.43 0.000
A 1 4.4940 4.49400 9.71 0.005
B 1 6.5413 6.54134 14.14 0.001
C 1 0.7100 0.71003 1.53 0.229
D 1 5.3847 5.38467 11.64 0.003
E 1 0.0597 0.05974 0.13 0.729
Error 21 9.7145 0.46259
Total 26 26.9043
From literature review various researchers found that if p value was very small (less than 0.05) then the terms in the regression model have a significant effect to the responses.
Table 6 and table 7 list out one important result that F value for regression models were very high (table 6 F value was 14.14 and 11.64, and like table 7 F value was 16.02) from one and corresponding P value were very less (approx 0.001) suggested that all cases were significant.
TABLE – 7: ANOVA results for Fill time
Source DF Adj. SS Adj. MS F-Value
P-Value
Regression 5 0.250607 0.050121 3.96 0.011
A 1 0.001089 0.001089 0.09 0.772
B 1 0.202885 0.202885 16.02 0.001
C 1 0.024054 0.024054 1.90 0.183
D 1 0.010464 0.010464 0.83 0.374
E 1 0.012116 0.012116 0.96 0.339
Error 21 0.265990 0.012666
Total 26 0.516598
International Research Journal of Engineering and Technology (IRJET) e-ISSN: 2395-0056
Volume: 05 Issue: 09 | Sep 2018 www.irjet.net p-ISSN: 2395-0072
© 2018, IRJET | Impact Factor value: 7.211 | ISO 9001:2008 Certified Journal | Page 300
MODEL EQUATIONS
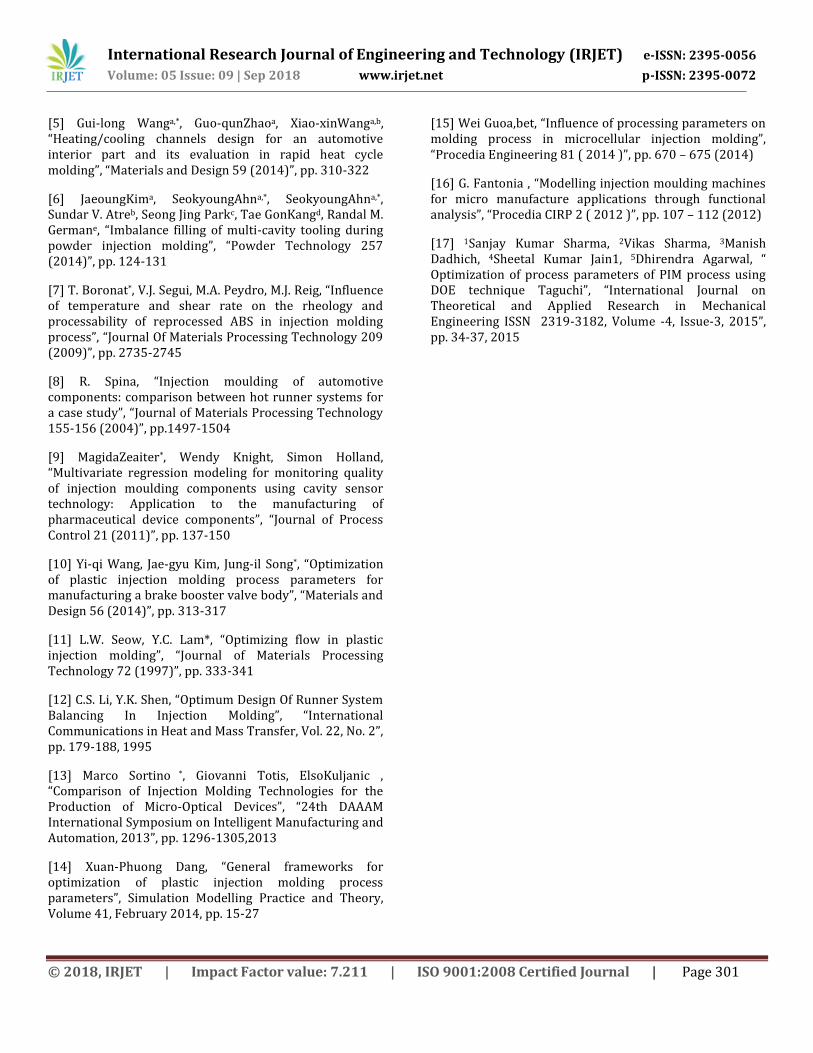
Regression Equation for Fill Time
Fill time = 4.448 -0.00156*A -0.01062*B-0.00366*C-0.00241*D+0.0519*E
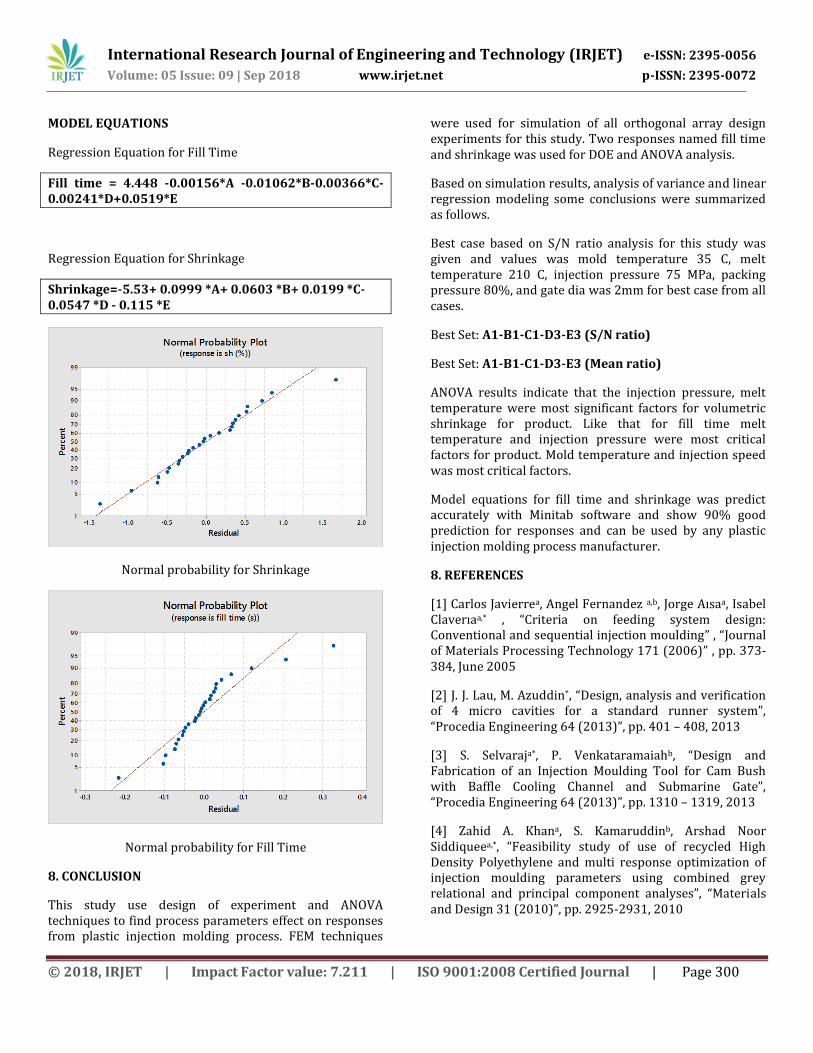
Regression Equation for Shrinkage
Shrinkage=-5.53+ 0.0999 *A+ 0.0603 *B+ 0.0199 *C-0.0547 *D - 0.115 *E
Normal probability for Shrinkage
Normal probability for Fill Time
8. CONCLUSION
This study use design of experiment and ANOVA techniques to find process parameters effect on responses from plastic injection molding process. FEM techniques
were used for simulation of all orthogonal array design experiments for this study. Two responses named fill time and shrinkage was used for DOE and ANOVA analysis.
Based on simulation results, analysis of variance and linear regression modeling some conclusions were summarized as follows.
Best case based on S/N ratio analysis for this study was given and values was mold temperature 35 C, melt temperature 210 C, injection pressure 75 MPa, packing pressure 80%, and gate dia was 2mm for best case from all cases.
Best Set: A1-B1-C1-D3-E3 (S/N ratio)
Best Set: A1-B1-C1-D3-E3 (Mean ratio)
ANOVA results indicate that the injection pressure, melt temperature were most significant factors for volumetric shrinkage for product. Like that for fill time melt temperature and injection pressure were most critical factors for product. Mold temperature and injection speed was most critical factors.
Model equations for fill time and shrinkage was predict accurately with Minitab software and show 90% good prediction for responses and can be used by any plastic injection molding process manufacturer.
8. REFERENCES
[1] Carlos Javierrea, Angel Fernandez a,b, Jorge Aısaa, Isabel Claverıaa,* , “Criteria on feeding system design: Conventional and sequential injection moulding” , “Journal of Materials Processing Technology 171 (2006)” , pp. 373-384, June 2005
[2] J. J. Lau, M. Azuddin*, “Design, analysis and verification of 4 micro cavities for a standard runner system”, “Procedia Engineering 64 (2013)”, pp. 401 – 408, 2013
[3] S. Selvaraja*, P. Venkataramaiahb, “Design and Fabrication of an Injection Moulding Tool for Cam Bush with Baffle Cooling Channel and Submarine Gate”, “Procedia Engineering 64 (2013)”, pp. 1310 – 1319, 2013
[4] Zahid A. Khana, S. Kamaruddinb, Arshad Noor Siddiqueea,*, “Feasibility study of use of recycled High Density Polyethylene and multi response optimization of injection moulding parameters using combined grey relational and principal component analyses”, “Materials and Design 31 (2010)”, pp. 2925-2931, 2010
International Research Journal of Engineering and Technology (IRJET) e-ISSN: 2395-0056
Volume: 05 Issue: 09 | Sep 2018 www.irjet.net p-ISSN: 2395-0072
© 2018, IRJET | Impact Factor value: 7.211 | ISO 9001:2008 Certified Journal | Page 301
[5] Gui-long Wanga,*, Guo-qunZhaoa, Xiao-xinWanga,b, “Heating/cooling channels design for an automotive interior part and its evaluation in rapid heat cycle molding”, “Materials and Design 59 (2014)”, pp. 310-322
[6] JaeoungKima, SeokyoungAhna,*, SeokyoungAhna,*, Sundar V. Atreb, Seong Jing Parkc, Tae GonKangd, Randal M. Germane, “Imbalance filling of multi-cavity tooling during powder injection molding”, “Powder Technology 257 (2014)”, pp. 124-131
[7] T. Boronat*, V.J. Segui, M.A. Peydro, M.J. Reig, “Influence of temperature and shear rate on the rheology and processability of reprocessed ABS in injection molding process”, “Journal Of Materials Processing Technology 209 (2009)”, pp. 2735-2745
[8] R. Spina, “Injection moulding of automotive components: comparison between hot runner systems for a case study”, “Journal of Materials Processing Technology 155-156 (2004)”, pp.1497-1504
[9] MagidaZeaiter*, Wendy Knight, Simon Holland, “Multivariate regression modeling for monitoring quality of injection moulding components using cavity sensor technology: Application to the manufacturing of pharmaceutical device components”, “Journal of Process Control 21 (2011)”, pp. 137-150
[10] Yi-qi Wang, Jae-gyu Kim, Jung-il Song*, “Optimization of plastic injection molding process parameters for manufacturing a brake booster valve body”, “Materials and Design 56 (2014)”, pp. 313-317
[11] L.W. Seow, Y.C. Lam*, “Optimizing flow in plastic injection molding”, “Journal of Materials Processing Technology 72 (1997)”, pp. 333-341
[12] C.S. Li, Y.K. Shen, “Optimum Design Of Runner System Balancing In Injection Molding”, “International Communications in Heat and Mass Transfer, Vol. 22, No. 2”, pp. 179-188, 1995
[13] Marco Sortino *, Giovanni Totis, ElsoKuljanic , “Comparison of Injection Molding Technologies for the Production of Micro-Optical Devices”, “24th DAAAM International Symposium on Intelligent Manufacturing and Automation, 2013”, pp. 1296-1305,2013
[14] Xuan-Phuong Dang, “General frameworks for optimization of plastic injection molding process parameters”, Simulation Modelling Practice and Theory, Volume 41, February 2014, pp. 15-27
[15] Wei Guoa,bet, “Influence of processing parameters on molding process in microcellular injection molding”, “Procedia Engineering 81 ( 2014 )”, pp. 670 – 675 (2014)
[16] G. Fantonia , “Modelling injection moulding machines for micro manufacture applications through functional analysis”, “Procedia CIRP 2 ( 2012 )”, pp. 107 – 112 (2012)
[17] 1Sanjay Kumar Sharma, 2Vikas Sharma, 3Manish Dadhich, 4Sheetal Kumar Jain1, 5Dhirendra Agarwal, “ Optimization of process parameters of PIM process using DOE technique Taguchi”, “International Journal on Theoretical and Applied Research in Mechanical Engineering ISSN 2319-3182, Volume -4, Issue-3, 2015”, pp. 34-37, 2015
International Research Journal of Engineering and Technology (IRJET) e-ISSN: 2395-0056
Volume: 05 Issue: 09 | Sep 2018 www.irjet.net p-ISSN: 2395-0072