OPTIMIZATION OF MAN-MACHINE RATIO IN GARMENT INDUSTRY
14
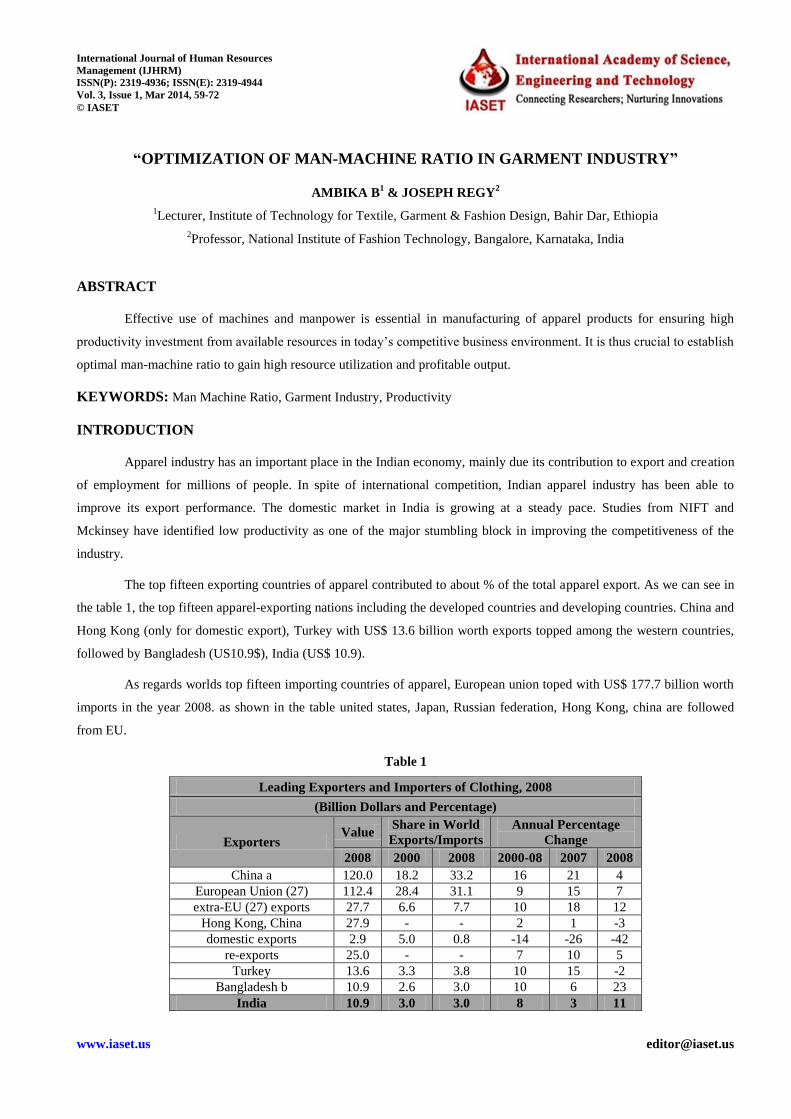
www.iaset.us [email protected] “OPTIMIZATION OF MAN-MACHINE RATIO IN GARMENT INDUSTRY” AMBIKA B 1 & JOSEPH REGY 2 1 Lecturer, Institute of Technology for Textile, Garment & Fashion Design, Bahir Dar, Ethiopia 2 Professor, National Institute of Fashion Technology, Bangalore, Karnataka, India ABSTRACT Effective use of machines and manpower is essential in manufacturing of apparel products for ensuring high productivity investment from available resources in today’s competitive business environment. It is thus crucial to establish optimal man-machine ratio to gain high resource utilization and profitable output. KEYWORDS: Man Machine Ratio, Garment Industry, Productivity INTRODUCTION Apparel industry has an important place in the Indian economy, mainly due its contribution to export and creation of employment for millions of people. In spite of international competition, Indian apparel industry has been able to improve its export performance. The domestic market in India is growing at a steady pace. Studies from NIFT and Mckinsey have identified low productivity as one of the major stumbling block in improving the competitiveness of the industry. The top fifteen exporting countries of apparel contributed to about % of the total apparel export. As we can see in the table 1, the top fifteen apparel-exporting nations including the developed countries and developing countries. China and Hong Kong (only for domestic export), Turkey with US$ 13.6 billion worth exports topped among the western countries, followed by Bangladesh (US10.9$), India (US$ 10.9). As regards worlds top fifteen importing countries of apparel, European union toped with US$ 177.7 billion worth imports in the year 2008. as shown in the table united states, Japan, Russian federation, Hong Kong, china are followed from EU. Table 1 Leading Exporters and Importers of Clothing, 2008 (Billion Dollars and Percentage) Exporters Value Share in World Exports/Imports Annual Percentage Change 2008 2000 2008 2000-08 2007 2008 China a 120.0 18.2 33.2 16 21 4 European Union (27) 112.4 28.4 31.1 9 15 7 extra-EU (27) exports 27.7 6.6 7.7 10 18 12 Hong Kong, China 27.9 - - 2 1 -3 domestic exports 2.9 5.0 0.8 -14 -26 -42 re-exports 25.0 - - 7 10 5 Turkey 13.6 3.3 3.8 10 15 -2 Bangladesh b 10.9 2.6 3.0 10 6 23 India 10.9 3.0 3.0 8 3 11 International Journal of Human Resources Management (IJHRM) ISSN(P): 2319-4936; ISSN(E): 2319-4944 Vol. 3, Issue 1, Mar 2014, 59-72 © IASET
Transcript of OPTIMIZATION OF MAN-MACHINE RATIO IN GARMENT INDUSTRY
www.iaset.us [email protected]
“OPTIMIZATION OF MAN-MACHINE RATIO IN GARMENT INDUSTRY”
AMBIKA B1 & JOSEPH REGY
2
1Lecturer, Institute of Technology for Textile, Garment & Fashion Design, Bahir Dar, Ethiopia
2Professor, National Institute of Fashion Technology, Bangalore, Karnataka, India
ABSTRACT
Effective use of machines and manpower is essential in manufacturing of apparel products for ensuring high
productivity investment from available resources in today’s competitive business environment. It is thus crucial to establish
optimal man-machine ratio to gain high resource utilization and profitable output.
KEYWORDS: Man Machine Ratio, Garment Industry, Productivity
INTRODUCTION
Apparel industry has an important place in the Indian economy, mainly due its contribution to export and creation
of employment for millions of people. In spite of international competition, Indian apparel industry has been able to
improve its export performance. The domestic market in India is growing at a steady pace. Studies from NIFT and
Mckinsey have identified low productivity as one of the major stumbling block in improving the competitiveness of the
industry.
The top fifteen exporting countries of apparel contributed to about % of the total apparel export. As we can see in
the table 1, the top fifteen apparel-exporting nations including the developed countries and developing countries. China and
Hong Kong (only for domestic export), Turkey with US$ 13.6 billion worth exports topped among the western countries,
followed by Bangladesh (US10.9$), India (US$ 10.9).
As regards worlds top fifteen importing countries of apparel, European union toped with US$ 177.7 billion worth
imports in the year 2008. as shown in the table united states, Japan, Russian federation, Hong Kong, china are followed
from EU.
Table 1
Leading Exporters and Importers of Clothing, 2008
(Billion Dollars and Percentage)
Exporters Value
Share in World
Exports/Imports
Annual Percentage
Change
2008 2000 2008 2000-08 2007 2008
China a 120.0 18.2 33.2 16 21 4
European Union (27) 112.4 28.4 31.1 9 15 7
extra-EU (27) exports 27.7 6.6 7.7 10 18 12
Hong Kong, China 27.9 - - 2 1 -3
domestic exports 2.9 5.0 0.8 -14 -26 -42
re-exports 25.0 - - 7 10 5
Turkey 13.6 3.3 3.8 10 15 -2
Bangladesh b 10.9 2.6 3.0 10 6 23
India 10.9 3.0 3.0 8 3 11
International Journal of Human Resources
Management (IJHRM)
ISSN(P): 2319-4936; ISSN(E): 2319-4944
Vol. 3, Issue 1, Mar 2014, 59-72
© IASET
60 Ambika B & Joseph Regy
www.iaset.us [email protected]
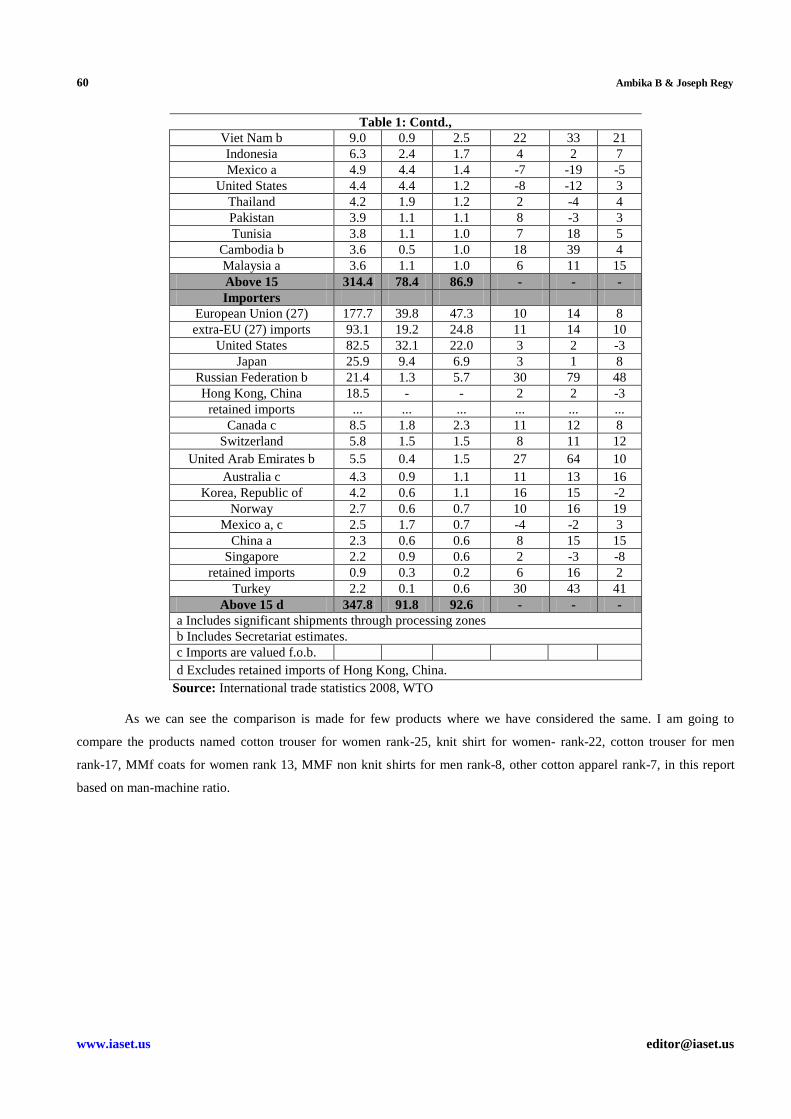
Table 1: Contd.,
Viet Nam b 9.0 0.9 2.5 22 33 21
Indonesia 6.3 2.4 1.7 4 2 7
Mexico a 4.9 4.4 1.4 -7 -19 -5
United States 4.4 4.4 1.2 -8 -12 3
Thailand 4.2 1.9 1.2 2 -4 4
Pakistan 3.9 1.1 1.1 8 -3 3
Tunisia 3.8 1.1 1.0 7 18 5
Cambodia b 3.6 0.5 1.0 18 39 4
Malaysia a 3.6 1.1 1.0 6 11 15
Above 15 314.4 78.4 86.9 - - -
Importers
European Union (27) 177.7 39.8 47.3 10 14 8
extra-EU (27) imports 93.1 19.2 24.8 11 14 10
United States 82.5 32.1 22.0 3 2 -3
Japan 25.9 9.4 6.9 3 1 8
Russian Federation b 21.4 1.3 5.7 30 79 48
Hong Kong, China 18.5 - - 2 2 -3
retained imports ... ... ... ... ... ...
Canada c 8.5 1.8 2.3 11 12 8
Switzerland 5.8 1.5 1.5 8 11 12
United Arab Emirates b 5.5 0.4 1.5 27 64 10
Australia c 4.3 0.9 1.1 11 13 16
Korea, Republic of 4.2 0.6 1.1 16 15 -2
Norway 2.7 0.6 0.7 10 16 19
Mexico a, c 2.5 1.7 0.7 -4 -2 3
China a 2.3 0.6 0.6 8 15 15
Singapore 2.2 0.9 0.6 2 -3 -8
retained imports 0.9 0.3 0.2 6 16 2
Turkey 2.2 0.1 0.6 30 43 41
Above 15 d 347.8 91.8 92.6 - - -
a Includes significant shipments through processing zones
b Includes Secretariat estimates.
c Imports are valued f.o.b.
d Excludes retained imports of Hong Kong, China.
Source: International trade statistics 2008, WTO
As we can see the comparison is made for few products where we have considered the same. I am going to
compare the products named cotton trouser for women rank-25, knit shirt for women- rank-22, cotton trouser for men
rank-17, MMf coats for women rank 13, MMF non knit shirts for men rank-8, other cotton apparel rank-7, in this report
based on man-machine ratio.

“Optimization of Man-Machine Ratio in Garment Industry” 61
www.iaset.us [email protected]
Table 2: Top Apparel Imports by the US: How India Ranks vis-à-vis its Neighbours
Source: http://www.jstor.org/pss/4414918 Economic and political weekly April 2004
Figure 1
Productivity is a measure of output from a production process, per unit of input. For example, labor productivity is
typically measured as a ratio of output per labor-hour, an input. Productivity may be conceived of as a metric of the
technical or engineering efficiency of production. As such, the emphasis is on quantitative metrics of input, and sometimes
output.
Workforce productivity is the amount of goods and services that a laborer produces in a given amount of time.
It is one of several types of productivity that economists measure. Labor productivity can be measured for a firm, a process
or a country.
Measured labour productivity will vary as a function of both other input factors and the efficiency with which the
factors of production are used (total factor productivity). So two firms or countries may have equal total factor productivity
(productive technologies) but because one has more capital to use, labour productivity will be higher.
Output per worker corresponds to the "average product of labour" and can be contrasted with the marginal product
of labour, which refers to the increase in output those results from a corresponding (marginal) increase in labour input
Operator productivity = volume of output/direct labor input (volume)
Example: operator productivity = 2000 shirts per shift/100 operator
= 20 shirt per shift

62 Ambika B & Joseph Regy
www.iaset.us [email protected]
Factors Affecting Productivity
Level of technology
Product style, price point and production volume
Training of workforce and management
Motivation level of workforce and management
Awareness of optimal productivity level
High rate of non-first quality production
Labor turnover and absenteeism
Production scale
Lead time
Industrial engineering
Labor relations
Production Quality per Year
This is the target production quantity per year when product specified in produce drawing is manufactured in
accordance with the condition mentioned in this document.
Work Days per Year
300 days are set for work days per year.
Production Quantity per Shift
The production quantity per line X the number of lines X 1 shift = the production Quantity per shift.
Formula 1
Working time per shift X the number of worker
The production quantity per shift =
Standard total operation time
* Each data can be calculated by applying (Formula 1)
Number of (Production) Line
Cutting Section
This is the line where the cutting carries out, where the number of people required cutting for a particular portion
and the target production is calculated
Sewing Section
This is the line where actual sewing operation is made. The number of lines varies depending on item.
This calculates an appropriate number of persons per line, and indicates the required number of lines for target production

“Optimization of Man-Machine Ratio in Garment Industry” 63
www.iaset.us [email protected]
quantity. When there are multiple lines, another method could be considered, namely automatic machines, fusing press
machines, special equipment etc. are treated as common equipment being separate from sewing section. Treating them as
common equipment will increase the operation rate of each equipment. This is judged from an appropriate production
quantity of each equipment.
Finishing Section
This is the line where finished products by sewing section are complemented and reformed by supplementary
works (removal of thread fray, hand stitching of buttons, hemming…), inspection, off-press, iron etc.
When there are multiple sewing lines, off-press machines and special equipment are common equipment,
and finished products may be intensively processed.
Number of Shift
The number of shifts per day.
Working Time per Shift
8 Hours are set for working time per shift. (8 hours=480 minutes)
Number of Worker
The number of persons required in the sections of sewing line and finishing line. The indirect persons such as
supervisors, persons for transportation are not included. The number of persons listed here is calculated subject to the
workers who are highly qualified in each work of operation flow.
From (Formula 1) Formula 2
Production quantity per shift X standard total operation time
The number of workers =
Working time per shift
Operation Time
This is the required total operation time for completing a garment spent in sections in sewing line and finishing
line. This time includes time allowances, not including the time of ALT or VAR. TIME ALLOWANCE…..This is the time
irregularly spent for the incidents against the regular time spent for product operation during working time, such as
arrangement of products, thread change, transportation (transfer) of products, discussion for work, restroom,
negligence etc. Unit is minute.
Daily Productivity (Sewing (section) only)
This is the daily productivity by direct sewing operation per worker.
In case the design changes, operation time in operation flow varies. The productivity changes accordingly.
Production quantity per shift
Daily productivity =
Number of sewing (section’s) worker

64 Ambika B & Joseph Regy
www.iaset.us [email protected]
RESEARCH DESIGN
Project Title “Optimization of man-machine ratio for garment industry”
Statement of Problem: Effective use of machines and manpower is essential in manufacturing of apparel
products for ensuring high productivity investment from available resources in today’s competitive business environment.
It is crucial to establish optimal man-machine ratio to gain high resource utilization and profitable output.
Objectives
Optimization of man-machine ratio
Achieving high productivity investment from available resources
To gain high resource utilization and profitable output.
METHODOLOGY
Study of the productivity of factories.
Operation breakdown for selective style in manufacturing department so that process flow and manpower
requirement for each could be established.
Comprehensive detailing of manpower requirement for each operation and establishing a standard ratio based on
the study
The comparison would involve the following
o Manpower requirement and Machinery comparisons for each operation
o Operation productivity comparison chart
o Comparison of profitable output on the machines and manpower.
Analysis of man and machine ratio.
Determination of optimized man-machine ratio for factories.
Implementation and Suggestions.
Scope
To analyze the requirement of the garment industry and suggest the best possible infrastructure in terms of
machineries and manpower keeping the productivity in mind, so that the proponent gets the best man – machine ratio.
Therefore it has a very good scope of setting up a plant of apparel industry with appropriate man machine ratio.
Limitations
Assuming same style is running in the whole factory.
Optimization is carried out only in the production department.

“Optimization of Man-Machine Ratio in Garment Industry” 65
www.iaset.us [email protected]
Type of Research: Descriptive research
Sample Size: Woven industry = 3, Knit’s = 3
Tool for Collection of Data
The collection of data is done through direct interview and telephonic conversation with the concerned people.
By visiting various Woven & Knits garment industry
METHOD OF COLLECTING DATA
Both primary and secondary data is collected.
Primary Data
During visit to garment industry by observations, the primary data like products process sequence, machines used
for particular operation, no of machines, no of operator, skill matrix, learning performance and optimization of
man-machine ratio is carried out by using through observation, recording & collections.
Secondary Data
Books, magazines
Various publications of the central, state & local governments.
Reports & publications of various associations connected with business.
Method of Analysis
Comparison with the standard manuals
Statistical analysis of man and machineries required for the industry.
Analysis through charts.
Project Work
Factory 1
Company Profile
Table 3
Industry ABC industry pvt ltd Unit-10
Type Manufacturing& Exporting
Specialization Woven’s
Established 1978
Annual revenue 80 million USD
Employees 1000+
Machine 500+
Step 1: Calculation of Man–Machine Ratio
Table 4
Factory Type Lines On Roll
Manpower
10%
Absenteeism
Sewing
Machine
Man: Machine
Ratio
ABC unit-10 woven 9.0 1164.0 1047.6 522.0 2.01

66 Ambika B & Joseph Regy
www.iaset.us [email protected]
Step 2: Break up of on – Roll Manpower
Table 5
TIPL-10
Manager 2
Quality Assurance 9
Sampling 8
IE 9
Trainnee 9
Dispatch 7
HR 10
Fabric 6
Maintance 8
Store 5
Other 8
Cutting Section 130
Sewing Section 670
Finishing 283
Step 3: Break up of Production Sector
Table 6
CUTTING
Number of operators 72
Number helpers 36
Number of checkers 9
Number of supervisor 13.5
SEWING
Number of operators 441
Number helpers 81
Number of ironers 108
Number of checkers 27
Number of supervisor 13.5
FINISHING
Number of operators 63
Number helpers 162
Number of ironers 45
Number of supervisor 13.5
Step 4: Time Study for Cutting Annexsure-1a
Step 5: Time Study for Sewing Annexsure-1b
Step 6: Time Study for Finishing Annexsure-1c
Step 7: Productivity Calculation for Shirt Manufacturing Sector
Step 7a: Cutting Productivity
Table 7
Sl. No
CUTTING TPIL-10
Particulars
Target 1000
1 Number of machines 8
2 Number of operators 8
3 Number helpers 4
5 Number of checkers 1
6 Number of supervisor 1.5
7 Duration of work shift 480

“Optimization of Man-Machine Ratio in Garment Industry” 67
www.iaset.us [email protected]
Table 7: Contd.,
8 SAM of Shirt (sewing) 1.9
9 Average daily output (per shift) 700
10 Operator Productivity 88
11 Productivity Effeciency /Operator 35
12 Total Labour Productivity(pcs per shift) 48.3
13 Machine Productivity 87.5
Step 7b: Sewing Productivity
Table 8
Sl. No
SEWING TPIL-10
Particulars
Target 1000
1 Number of machines 49
2 Number of operators 49
3 Number helpers 9
4 Number of ironers 12
5 Number of checkers 3
6 Number of supervisor 1.5
7 Duration of work shift 480
8 SAM of Shirt (sewing) 30.92
9 Average daily output (per shift) 761
10 Operator Productivity 16
11 Productivity Effeciency /Operator 100
12 Total Labour Productivity(pcs per shift) 10.2
13 Machine Productivity 15.5
Step 7c: Finishing Productivity
Table 9
Sl. No Finishing
TPIL-10 Particulars
1 Number of machines 15
2 Number of operators 7
3 Number helpers 18
4 Number of ironers 5
6 Number of supervisor 1.5
7 Duration of work shift 480
8 SAM of Shirt (sewing) 4.62
9 Average daily output (per shift) 83
10 Operator Productivity 12
11 Productivity Efficiency /Operator 11
12 Total Labour Productivity(pcs per shift) 1.8
13 Machine Productivity 5.5
Step 8
Comparison of Each Operation with JUKI Annexure -1d
Based on SAM, no of MANPOWER, no of MACHINE

68 Ambika B & Joseph Regy
www.iaset.us [email protected]
Table 10
SAM 17.84 30.924
MANPOWER 48 73
MACHINES 38 49
TARGET 1200 1200
ACHIVED 1076 760
Step 9: Implemented Results in ABC-10
For Allocation of manpower ,with the help of skill matrix is carried out –Annexsure-1e
Few attachments where used like the
o Automatic garment stacker
o Collar folder
o Cuff folder
o Sleeve placket holder
o Automatic pocket seeker
Results
Table 11
Sl. No
SEWING TPIL-10
Particulars
Target 1000
1 Number of machines 40
2 Number of operators 40
3 Number helpers 6
4 Number of ironers 0
5 Number of checkers 3
6 Number of supervisor 1.5
7 Duration of work shift 480
8 SAM of Shirt (sewing) 23.92
9 Average daily output (per shift) 800
10 Operator Productivity 20
11 Productivity Effeciency /Operator 97
12 Total Labour Productivity(pcs per shift) 16
13 Machine Productivity 20
If it can happened for 1 line then for the factory
IMPLEMENTATION RESULTS
Man: Machine ratio
Table 12
Factory Type Lines On Roll
Manpower
10%
Absenteeism
Sewing
Machine
Man: Machine
Ratio(E/F)
ABC unit-10 wovens 9.0 1164.0 1047.6 522.0 2.01
ABC unit-16 wovens 9 708 637.2 365 1.75

“Optimization of Man-Machine Ratio in Garment Industry” 69
www.iaset.us [email protected]
Table 13
Operator Productivity 16 20
Productivity Effeciency /Operator 100 97
Total Labour Productivity(pcs per shift) 10.2 16
Machine Productivity 16 20
Factory-2
Company Profile
Table 14
Industry XYZ apparel Pvt,ltd
Type Manufacturing& Exporting
Specialization Woven’s
Annual revenue 80 million USD
Employees 800+
Machine 300+
Step 1: Calculation of Man –Machine Ratio
Table 15
Factory Type Lines On Roll
Manpower
10%
Absenteeism
Sewing
Machine
Man: Machine
Ratio(E/F)
XYZ apparels pvt wovens 6 830 747.0 320 2.33
Step 2: Break up of on – Roll Manpower
Table 16
XYZ Apparels
Pvt Ltd
Manager 2
Quality Assurance 5
Sampling 10
IE 10
Trainnee 10
Dispatch 5
HR 10
Fabric 5
Maintance 7
Store 5
other 8
Cutting Section 99
Sewing Section 453
Finishing 201
Step 3: Break up of Production Sector
Table 17
CUTTING
Number of operators 54
Number helpers 24
Number of checkers 12
Number of supervisor 9
SEWING
Number of operators 312
Number helpers 72
Number of ironers 30
Number of checkers 30
Number of supervisor 9
FINISHING
Number of operators 48
Number helpers 114
Number of ironers 30
Number of supervisor 9

70 Ambika B & Joseph Regy
www.iaset.us [email protected]
Step 4: Time Study for Cutting Annexsure-2a
Step 5: Time Study for Cutting Annexsure-2b
Step 6: Time study for Cutting Annexsure-2c
Step 7: Productivity Calculation for Shirt Manufacturing Sector
Step 7a: Cutting Productivity
Table 18
Sl. No
CUTTING XYZ Apparels
Pvt Ltd Particulars
TARGET 1200
1 Number of machines 9
2 Number of operators 9
3 Number helpers 4.0
5 Number of checkers 2.0
6 Number of supervisor 1.5
7 Duration of work shift 480
8 SAM of Shirt (sewing) 2.1
9 Average daily output (per shift) 750.0
10 Operator Productivity 83
11 Productivity Effeciency /Operator 36
12 Total Labour Productivity(pcs per shift) 45.5
13 Machine Productivity 83.3
Step 7b: Sewing Productivity
Table 19
Sl. No
SEWING TPIL-10
XYZ Apparels
Pvt Ltd Particulars
Target 1000 1040
1 Number of machines 49 52
2 Number of operators 49 52
3 Number helpers 9 12.0
4 Number of ironers 12 5.0
5 Number of checkers 3 5.0
6 Number of supervisor 1.5 1.5
7 Duration of work shift 480 480
8 SAM of Shirt (sewing) 30.92 32.4
9 Average daily output (per shift) 700 750
10 Operator Productivity 14 14
11 Productivity Effeciency /Operator 92 97
12 Total Labour Productivity(pcs per shift) 9.4 9.9
13 Machine Productivity 14.3 14.4
Step 7c: Finishing Productivity
Table 20
Sl No
FINISHING XYZ
Apparels
Pvt Ltd Particulars
1 Number of machines 8
2 Number of operators 8

“Optimization of Man-Machine Ratio in Garment Industry” 71
www.iaset.us [email protected]
Table 20: Contd.,
3 Number helpers 19.0
4 Number of ironers 5.0
6 Number of supervisor 1.5
7 Duration of work shift 480
8 SAM of Shirt (sewing) 6.1
9 Average daily output (per shift) 63
10 Operator Productivity 8
11 Productivity Effeciency /Operator 10
12 Total Labour Productivity (pcs per shift) 1.5
13 Machine Productivity 7.9
Step 8: Comparison of Each Operation with JUKI
Comparison of Each Operation with JUKI Annexure -2d
Based on SAM, no of MANPOWER, no of MACHINE
Table 21
SAM 17.84 30.2
MANPOWER 48 75
MACHINE 38 47
TARGET 1200 1200
ACHIVED 1022 747
Step 9: Suggestion
For Allocation of manpower, with the help of skill matrix is carried out –Annexsure-2e
Few attachments where used like the
o Use of Automatic garment stacker
o Use of Collar folder
o Use of Cuff folder
o Use of Sleeve placket holder
o Use of Automatic pocket seeker
o Use of Proper allocation of manpower
o Use of Training program for operators
o Used of Motivation for the operators like the incentive schemes based on the performance
o Use of barcode system to track the product and also operator productivity can be traced easily
o Use of comfortable ergonomically designed chairs for the operators
o Playing of pleasant music after the lunch break
o Education about the product ,work
o If they face some injustice then there should be a suggestion box to drop or counseling should be carried out
every month during the leisure time

72 Ambika B & Joseph Regy
www.iaset.us [email protected]
If it can reduce in the 1 line then in the whole factory
Table 22
Operator Productivity 14 20
Productivity Effeciency /Operator 97 104
Total Labour Productivity(pcs per shift) 9.9 14.2
Machine Productivity 14.4 20.0
Table 23
Factory Type Lines On Roll
Manpower
10%
Absenteeism
Sewing
Machine
Man: Machine
Ratio(E/F)
XYZ wovens 6 830 747.0 320 2.33
XYZ wovens 6 615 553.5 320 1.73
CONCLUSIONS
For Allocation of manpower, with the help of skill matrix is carried out Few attachments where used like the Use
of Automatic garment stacker, Use of Collar folder, Use of Cuff folder, Use of Sleeve placket holder, Use of Automatic
pocket seeker, Use of Proper allocation of manpower, Use of Training program for operators ,Used of Motivation for the
operators like the incentive schemes based on the performance, Use of barcode system to track the product and also
operator productivity can be traced easily and few thinks like Use of comfortable ergonomically designed chairs for the
operators, Playing of pleasant music after the lunch break, Education about the product ,work, If they face some injustice
then there should be a suggestion box to drop or counseling should be carried out every month during the leisure time.
By doing the above things the operator productivity increase approximately by 1/4 %, Productivity Efficiency /Operator
by 1%, Total Labor Productivity (pcs per shift) by 1.4% and machine Productivity by 1.4% and overall man machine ratio
reduced from 2.33 to 1.73.
REFERENCES
1. Source: International trade statistics 2008, WTO
2. Source: http://www.jstor.org/pss/4414918 Economic and political weekly April2004
3. Goldratt 1999
4. Case study 1; Intel Assembly and Test manufacturing
5. Case study 2; Clark Ecozone’s Garment Industry: The Need to Upgrade
6. Technical Education and Skills Development Authority. (2000). Clark Ecozone’s Garment Industry: The Need to
Upgrade. Retrieved July 22, 2005 from the World Wide Web: http://www.tesda.gov.ph/services/info/info2.html
7. Article of Rajesh Bheda
8. Managing Productivity in the Apparel Industry by Rajesh Bheda
9. Source:http://ezinearticles.com/?Overview-of-Bangladesh-Garment-industry&id=367773
10. http://www.just-style.com/article.aspx?id=95318