Optimization of machining parameters in drilling hybrid ... hybrid aluminium metal matrix composites...
12
Trans. Nonferrous Met. Soc. China 22(2012) 1286−1297 Optimization of machining parameters in drilling hybrid aluminium metal matrix composites T. RAJMOHAN 1 , K. PALANIKUMAR 2 , M. KATHIRVEL 3 1. Department of Mechanical Engineering, Sri Chandrasekharendra Saraswathi Viswa Maha Vidyalaya University, Kanchipuram 631561, India; 2. Department of Mechanical Engineering, Sri Sairam Institute of Technology, Chennai 600044, India; 3. Department of Mechanical Engineering, Sun College of Engineering and Technology, Sun Nagar, Erachakulam Post, Kanyakumari 629902, India Received 17 October 2011; accepted 26 December 2011 Abstract: Taguchi method with grey relational analysis was used to optimize the machining parameters with multiple performance characteristics in drilling hybrid metal matrix Al356/SiC-mica composites. Experiments were conducted on a computer numerical control vertical machining centre and L 18 orthogonal array was chosen for the experiments. The drilling parameters namely spindle speed, feed rate, drill type and mass fraction of mica were optimized based on the multiple performance characteristics including thrust force, surface roughness, tool wear and burr height (exit). The results show that the feed rate and the type of drill are the most significant factors which affect the drilling process and the performance in the drilling process can be effectively improved by using this approach. Key words: hybrid composites; Grey relational analysis; Taguchi method 1 Introduction Metal matrix composites (MMCs) have become a large leading material in composite materials, and particle reinforced aluminium MMCs have received considerable attention due to their excellent engineering properties. These materials are known as the difficult-to-machine materials, because of the hardness and abrasive nature of reinforcement element like silicon carbide (SiC) particles [1]. The application fields of MMCs include aerospace, defense and automotives [2]. Hybrid MMCs were obtained by reinforcing the matrix alloy with more than one type of reinforcements having different properties [3]. The Al-based hybrid composites, with 20% SiC whiskers and 0, 2%, 5%, 7% SiC nano particles, were fabricated by squeeze casting route [4]. In the view of the growing engineering applications of these composites, a need for detailed and systematic study of their machining characteristics is envisaged. The efficient and economic machining of these materials is required for the desired dimensions and surface finish [5]. Taguchi technique is a powerful tool in experiment design. It provides a simple, efficient and systematic approach for optimization, quality and cost [6]. The methodology is valuable when the design parameters are qualitative and discrete [7]. Optimum machining condition in turning A356/SiC/20p metal matrix composites for minimizing the surface roughness was determined using desirability function approach [8]. UDAY et al [9] presented an elaborative experimentation using Taguchi methods on four Al/SiC composites to analyze the effects of size (15 and 65 μm) and volume fraction (20% and 30%) of the reinforcements in the composites on machining forces and machined surface roughness. KREMER et al [10] investigated the effect of SiC content in the Al/SiC particulate metal-matrix composites on the machinability. Artificial neural networks (ANN) based model was used for the prediction of the surface roughness during the machining of composite material using back propagation algorithm [11]. The effect of machining parameters on the surface roughness was evaluated and optimum machining conditions for maximizing the metal removal rate and Corresponding author: T. RAJUOHAN; E-mail:[email protected] DOI: 10.1016/S1003-6326(11)61317-4
Transcript of Optimization of machining parameters in drilling hybrid ... hybrid aluminium metal matrix composites...

Trans. Nonferrous Met. Soc. China 22(2012) 1286−1297
Optimization of machining parameters in
drilling hybrid aluminium metal matrix composites
T. RAJMOHAN1, K. PALANIKUMAR2, M. KATHIRVEL3
1. Department of Mechanical Engineering, Sri Chandrasekharendra Saraswathi Viswa Maha Vidyalaya University, Kanchipuram 631561, India;
2. Department of Mechanical Engineering, Sri Sairam Institute of Technology, Chennai 600044, India; 3. Department of Mechanical Engineering, Sun College of Engineering and Technology,
Sun Nagar, Erachakulam Post, Kanyakumari 629902, India
Received 17 October 2011; accepted 26 December 2011
Abstract: Taguchi method with grey relational analysis was used to optimize the machining parameters with multiple performance characteristics in drilling hybrid metal matrix Al356/SiC-mica composites. Experiments were conducted on a computer numerical control vertical machining centre and L18 orthogonal array was chosen for the experiments. The drilling parameters namely spindle speed, feed rate, drill type and mass fraction of mica were optimized based on the multiple performance characteristics including thrust force, surface roughness, tool wear and burr height (exit). The results show that the feed rate and the type of drill are the most significant factors which affect the drilling process and the performance in the drilling process can be effectively improved by using this approach. Key words: hybrid composites; Grey relational analysis; Taguchi method 1 Introduction
Metal matrix composites (MMCs) have become a large leading material in composite materials, and particle reinforced aluminium MMCs have received considerable attention due to their excellent engineering properties. These materials are known as the difficult-to-machine materials, because of the hardness and abrasive nature of reinforcement element like silicon carbide (SiC) particles [1]. The application fields of MMCs include aerospace, defense and automotives [2]. Hybrid MMCs were obtained by reinforcing the matrix alloy with more than one type of reinforcements having different properties [3]. The Al-based hybrid composites, with 20% SiC whiskers and 0, 2%, 5%, 7% SiC nano particles, were fabricated by squeeze casting route [4]. In the view of the growing engineering applications of these composites, a need for detailed and systematic study of their machining characteristics is envisaged. The efficient and economic machining of these materials is required for the desired dimensions and surface finish [5].
Taguchi technique is a powerful tool in experiment design. It provides a simple, efficient and systematic approach for optimization, quality and cost [6]. The methodology is valuable when the design parameters are qualitative and discrete [7]. Optimum machining condition in turning A356/SiC/20p metal matrix composites for minimizing the surface roughness was determined using desirability function approach [8]. UDAY et al [9] presented an elaborative experimentation using Taguchi methods on four Al/SiC composites to analyze the effects of size (15 and 65 μm) and volume fraction (20% and 30%) of the reinforcements in the composites on machining forces and machined surface roughness. KREMER et al [10] investigated the effect of SiC content in the Al/SiC particulate metal-matrix composites on the machinability. Artificial neural networks (ANN) based model was used for the prediction of the surface roughness during the machining of composite material using back propagation algorithm [11]. The effect of machining parameters on the surface roughness was evaluated and optimum machining conditions for maximizing the metal removal rate and
Corresponding author: T. RAJUOHAN; E-mail:[email protected] DOI: 10.1016/S1003-6326(11)61317-4

T. RAJMOHAN, et al/Trans. Nonferrous Met. Soc. China 22(2012) 1286−1297
1287
minimizing the surface roughness were determined using response surface methodology in the turning of particulate MMCs [12].
For the practical MMC materials, it is necessary to determine the optimal machining parameters to achieve better performance such as less tool wear and good surface finish. In the grey system theory, the grey relational analysis (GRA) is a method used to analyze the relationship between sequences, using less data and multi-factor. It is considered to be more advantageous than the statistical regression analysis. The GRA was successfully applied for the manufacturing process [13]. Taguchi-grey relational method was used to study the boro-carburizing and boronizing of AISI 1015 steel on the tensile strength [14]. Taguchi method with GRA was used for the optimization of PTA-processing in hard facing of WC/W2C-reinforced Ni-based MMC, considering multiple quality characteristics of the microstructure parameters relevant to abrasion resistance [15]. Using grey relational analysis, the multi-criteria weighted average was proposed in decision-making process to rank the materials with respect to several criterias [16].
The optimum combination of various input factors, including type of abrasive slurry, their size and concentration, nature of tool material and power rating of the machine for the ductile chip formation in the machining of Stellite 6, was determined by applying the Taguchi multi-objective optimization technique and F-test [17]. The design of experiments was utilized to create a model of the ironing process [18].
TOSUN [19] used GRA in optimizing the drilling parameters. KUO et al [20] applied Taguchi method and GRA for optimizing the multi-response simulation problems. KAO and HOCHENG [21] used the GRA for optimizing the electro polishing of 316L stainless steel with multiple performance characteristics like surface roughness and passivation strength. RAMAKRISHNAN and KARUNAMOORTHY [22] used ANN model and multi-response optimization technique to predict performance characteristics, namely material removal rate and surface roughness, to select the best cutting parameters of wire electro-discharge machining of Inconel 718. Analysis of variance (ANOVA) was also employed to identify the level of importance of the machining parameters on the multiple performance characteristics. CHIANG and CHANG [23] implemented GRA for optimizing the wire electric discharge machining process of Al2O3 particle-reinforced material (6061 alloy) with multiple performance characteristics. GRA and the principal component analysis are applied to evaluate the optimal combination of cutting parameters and weighting values corresponding to various performance characteristics in high-speed end milling on
SKD61 tool steel [24]. The basic idea of GRA is to find a grey-relational grade (GRG), which can be used for optimizing the conversion from a multi-objective case to a single-objective case. GRG was also used to estimate the parameter effects on the overall performance response [25]. TZENG et al [26] investigated the optimization of CNC turning operation parameters for SKD11 (JIS) using the grey relational analysis method.
Mica is a lamellar solid which requires more energy than graphite to shear over the laminar planes [27]. Traditionally, mica is a natural lubricant which eases the machining operation. A review of literatures indicates that the study on machining of Al/SiC−mica composites is very limited. This study presented the optimization in drilling of Al/SiC−mica composites to minimize the thrust force, surface roughness, burr height and tool wear using Taguchi method with grey relational analysis (TGRA) considering multiple performance characteristics. Eighteen experimental runs based on Taguchi orthogonal array were conducted to determine the best factor level combination. The influence of the control factors such as the mass fraction of mica, drill type, spindle speed and feed rate were studied by assessing the single weighted GRA. 2 Experimental 2.1 Material
The matrix material used for the fabrication of composites was aluminum alloy Al356 and its chemical composition is presented in Table 1. The reinforcing materials used were silicon carbide and mica. The silicon carbide particles size used was 25 μm and the average size of mica used was 45 μm. The composites were fabricated with 0 and 3% (mass fraction) mica. The silicon carbide particles used for fabricating the composites was fixed at 10%. Table 1 Composition of Al 356 alloy (mass fraction, %)
Cu Si Mg Mn
<0.0005 7.27 0.45 <0.002
Fe Ti Zn Al
0.123 0.08 0.005 Bal.
The composites were fabricated by stir casting method as it ensured the uniform distribution of the reinforcements [28]. In the process of preparing the composites, the Al 356 aluminium alloy in the form of ingot was cut into small pieces to accommodate in the silica crucible. The aluminum alloy was melted in an electric muffle furnace with crucible. Mica and SiC preheated at about 620 °C were added to the molten metal at 750 °C and stirred continuously. The stirring

T. RAJMOHAN, et al/Trans. Nonferrous Met. Soc. China 22(2012) 1286−1297
1288
was done at 500 r/min for 5−7 min. Magnesium was added in small quantity during stirring to increase the wetting. The melt with reinforcement was poured into permanent metallic mould to get the required shape and size of the work piece. 2.2 Experimental design
Taguchi method which is a powerful tool in parameter design was used for conducting the experiments. L18 (21×37) orthogonal array with 18 rows (corresponding to the number of experiments) was used for the experiment. It provided a simple, efficient and systematic approach to optimize the design for performance, quality and cost. The methodology is valuable when the design parameters are qualitative and discrete [7]. Table 2 lists the drilling parameters used as control factors and the levels. Table 2 Machining parameter and levels
Level Control parameter Symbol
1 2 3
Content of mica/% A 0 3 −
Drill type B Carbide TiN coated carbide
Polycrystalline diamond
Spindle speed/ (r·min−1) C 1000 2000 3000
Feed rate/ (mm·min−1) D 50 100 150
2.3 Experimental procedure The drilling experiments were conducted on a
computer numerical control (CNC) vertical machining centre (VMC 100), manufactured by ARIX CNC machine Co. Ltd., Taiwan, China. The dimensions of the work piece samples used for conducting the experiments were 100 mm×100 mm×10 mm. The drill size was 6 mm in diameter and its helix angle was 30°, the point angle used was 118°. The drills used were carbide, TiN coated carbide and polycrystalline diamond (PCD) manufactured by SANDVIK (India). The hardness of the drill material was HRC 72, 80 and 90, respectively.
The thrust force in drilling of the composite materials was captured by using computer controlled data acquisition system. The dynamometer used for capturing the thrust force signals in drilling was Kistler made. The dynamometer was connected to a 3-channel charge amplifier through a connecting cable, which in turn was connected to the computer by a 37-pin cable from the A/D board. The signals were captured and stored in a computer for analysis. The surface roughness of the work piece hole was measured by using Mitutoyo portable Surftest SJ−201 P/M contact profilometer with a cut-off value of 2.4 mm. The measurements were taken
perpendicularly to the circumference of the hole [28]. The surface roughness values given in this study were the mathematical average of two measurements taken from the same hole surface.
One of the biggest challenges in burr research was burr measurement. The burr height has been measured by several methods such as contact method, optical microscope method, optimal CMM method and rubber casting method. In the present study, the burr height (exit) of the drilled holes was measured with the help of coordinate measuring machine (CMM), BROWN and SHARP made. The burr heights were measured at 4 different places. In each measurement, the distance of the highest peak to the deepest valley was measured, then the average value was taken for analysis.
After drilling 10 through holes for each experimental run, the degree of flank wear was measured by using optical microscope Metzer 1395A. Measurement of tool wear in drill was comparatively more difficult than measurement of the wear of a single point tool. A special fixture was designed and fabricated to measure the flank wear, as presented in Fig. 1. The drill tool was supported by a bush in the fixture to determine the degree of flank wear. In addition, the damage and the wear features of the drill wear were investigated using scanning electron microscope (SEM). The experimental results are summarized in Table 3. The photographs of the machined samples are presented in Fig. 2.
Fig. 1 Photo of fixture used for determining drill wear
Fig. 2 Photograph of machined composites

T. RAJMOHAN, et al/Trans. Nonferrous Met. Soc. China 22(2012) 1286−1297
1289 Table 3 Experimental results using L18 orthogonal array
No. Content of mica/% Drill type Spindle speed/
(r·min−1) Feed rate/
(mm·min−1) Thrust force/
N Surface
roughness/μmTool wear/
mm Burr height/
mm
1 0 Carbide 1000 50 565 4.5 0.158 0.165
2 0 Carbide 2000 100 650 5.1 0.225 0.284
3 0 Carbide 3000 150 735 3.7 0.315 0.345
4 0 Coated 1000 50 585 4.2 0.145 0.185
5 0 Coated 2000 100 675 4.2 0.215 0.302
6 0 Coated 3000 150 755 3.5 0.3 0.365
7 0 PCD 1000 100 585 4.1 0.132 0.194
8 0 PCD 2000 150 690 4.2 0.182 0.315
9 0 PCD 3000 50 590 2.75 0.274 0.2
10 3 Carbide 1000 150 680 5.6 0.14 0.312
11 3 Carbide 2000 50 560 4.35 0.2 0.183
12 3 Carbide 3000 100 635 3.4 0.285 0.306
13 3 Coated 1000 100 730 5.1 0.125 0.225
14 3 Coated 2000 150 745 4.5 0.201 0.345
15 3 Coated 3000 50 625 3.35 0.285 0.325
16 3 PCD 1000 150 600 5.1 0.113 0.205
17 3 PCD 2000 50 520 3.4 0.168 0.118
18 3 PCD 3000 100 605 3.75 0.241 0.185
3 Grey relational analysis
Grey theory is one of the important theories and can be used for analyze the uncertainty, multi-input and discrete data. A grey system has a level of information between black and white. The grey relational analysis is a measurement of the absolute value of the data difference between sequences, and is also used to measure an approximate correlation between sequences. It is an effective means of analyzing the relationship between the sequences with less data and can analyze many factors [13]. In the present investigation, the problem has four performance characteristics that need to be minimized by choosing appropriate processing conditions. The performance characteristics used are thrust force, surface roughness, tool wear and burr height. The grey relational analysis deals with the ranks and not with the real value of the grey relational grade. 3.1 Analysis approach
The experiments were conducted according to Taguchi’s orthogonal array in 18 different experiments. For GRA, these 18 experiments became 18 subsystems. The influence of these subsystems on the response variable was analyzed by using GRA technique. The drilling process (system) was assessed by conducting 18
experiments (subsystems) and each experiment was termed as comparability sequence. The parametric conditions corresponding to the highest weighted GRG gave minimum values of the thrust force, surface roughness, tool wear and burr height. In this manner, the multi-objective problem was converted into single objective optimization using GRA technique. 3.2 Formulation of problem
PAWADE and JOSHI [29] reported the steps involved in the formulation of the multi objective problem i.e., the multi-objective optimization problem under investigation can be stated as the minimization of f (thrust force, surface roughness, tool wear and burr height), subject to independent decision variables as: content of mica, drill type, spindle speed and feed rate. Furthermore, the above multi-objective problem can be converted into a single optimization problem using GRG, such as the maximization of GRG, 0≤GRG≤1, subjected to independent decision variables. 3.3 Methodology
GRA involves the following steps [13−24]: 1) compute S/N ratio of the quality characteristics; 2) normalize the S/N ratio of the quality characteristics; 3) calculate the grey relational coefficient; 4) calculate the GRG by averaging the grey relational coefficient; 5)

T. RAJMOHAN, et al/Trans. Nonferrous Met. Soc. China 22(2012) 1286−1297
1290
analyze the experimental results using the GRG and the statistical analysis of variance; 6) select the optimal levels of process parameters; and 7) verify the optimal parameters through the confirmation experiment. 3.3.1 S/N ratio to compute quality characteristics
During the drilling of hybrid metal matrix composites, thrust force, surface roughness, tool wear and burr height have been considered as smaller-the-better type. These considerations have been made with respect to greater quality characteristics of interest. Hence, the S/N ratio η of the quality characteristics (smaller-the-better type) are computed as:
]1 [ lg1
2∑=
10− =n
iijy
nη (1) where n is the number of replications; yij is the observed response value, and i=1, 2, …, n; j=1, 2…, k. 3.3.2 Normalize S/N ratio of quality characteristics (data
pre-processing) In the GRA, S/N ratio of quality characteristics is
normalized first to reduce the variability. This known data pre-processing is normally required because the range and the unit in one data may differ from others. Data pre-processing is a means of transferring the original sequence to a comparable sequence, so the data is normalized between 0 and 1. Depending on the characteristics of the data sequence, there are various methodologies of data pre-processing available. If the target value of the original sequence is infinite, then it has a characteristic of higher-the-better. The original sequence can be normalized as [13−24]:
)(min)(max)(min)()( 00
00*
kxkxkxkxkxii
iii
−−
= (2)
When the lower-the-better characteristic of the
original sequence is considered, then the original sequence should be normalized as:
)(min)(max)()(max)( 00
00*
kxkxkxkxkxii
iii
−−
= (3)
However, if there is a definite target value (desired
value) to be achieved, the original sequence can be normalized as:
00
00*
)(max|)(|1)(xkx
xkxkxi
ii
−−
−= (4)
Or the original sequence can be simply normalized
by the most basic methodology, i.e. the values of original sequence can be divided by the first value of the sequence as:
)1()()( 0
0*
i
ii x
kxkx = (5)
where )(0 kxi is the original sequence; )(* kxi is the
sequence after the data pre-processing; )1(0ix is the first
value of the sequence; )(max 0 kxi is the largest value of
)(0 kxi ; )(min 0 kxi is the smallest value of )(0 kxi and x0 is the desired value. 3.3.3 Grey relational coefficient and grey relational grade
The grey relational analysis is used to measure the relevancy between two systems. The sequences used in the grey relational analysis are called a grey relational coefficient. The grey relational coefficient (k) can be calculated as:
max
maxmin
)(0)(
Δ+ΔΔ+Δ
=ξ
ξξk
ki
(6) where Δmin is the smallest value of Δ0i(k), Δmax is the largest value of Δ0i(k). Δmin=minimink )()( 0*
0 kxkx i− (7) Δmax=maximaxk )()( 0*
0 kxkx i− (8) Δ0i is the absolute value of the difference between
)(0 kxi and )(* kxi and it is also known as the deviation sequence and ξ is the distinguishing coefficient. The value of ξ can be adjusted with the systematic actual need and defined in the range between 0 and 1, ξ∈[0,1]. If the value of the ξ is smaller, then the distinguished ability is larger. In general, ξ= 0.5 is used.
)()(0 0*0 kxkx ii −=Δ (9)
)()(minmin **
0min kxkx jkij−=Δ
∀∈∀ (10)
)()(mixmix **
0max kxkx jkij−=Δ
∀∈∀ (11)
where )(*
0 kx is the ideal normalized S/N ratio; )(0 kxi is the normalized comparability sequence.
After the Grey relational coefficient is derived, the average value of the grey relational coefficient is taken as the GRG. The GRG is defined as:
∑=
=n
kk
n 1ii )(1 ξγ (12)
However, in a real engineering system, the
importance of various factors in the system varies according to the real condition of an unequal weight being carried out by various factors. The GRG in Eq. (12) is extended and defined as:
∑=
=n
kk kw
n 1ii )(1 ξγ (13)
where wk denotes the normalized weight of factor k. If wk is same for all the factors then, Eqs. (11) and (12) are

T. RAJMOHAN, et al/Trans. Nonferrous Met. Soc. China 22(2012) 1286−1297
1291
equal. The GRG indicates the degree of influence by the comparability sequence over the reference sequence. If a particular comparability sequence is more important than the other comparability sequences to the reference sequence, then the GRG for that comparability sequence and reference sequence are higher than other GRG.
It is known that, lower thrust force, surface roughness, tool wear and burr height provide better quality of the machined surface. Thus, the data sequences of responses have smaller-the-better characteristics. The smaller-the-better methodology as expressed in Eq. (1) is used for determining the S/N ratio. The S/N ratio values of the response variables are shown in Table 4. The S/N ratio values are normalized using Eq. (3). The minimum thrust force, surface roughness, tool wear and the burr height are set as a reference sequence )()0( kxi , and the results of the 18 experiments have the comparability sequences )()0( kxi , i=1−18, k=1−4. All the sequences after normalization are denoted as )(*
0 kx (ideal normalized S/N ratio) for reference sequence and
)(* kxi comparability sequence. The larger value of normalized results can indicate the better performance characteristics, and the best-normalized results are equal to 1. Then, the deviation sequences, =Δ )(0 ki
|)()(| *)0(0 kxkx i− are determined using Eq. (9) and are
listed in Table 5.
Table 4 S/N ratio of experimental results
S/N ratio of responses/dB No. Thrust
force Surface
roughness Tool wear
Burr height
1 −55.04096896 −13.0643 16.02686 15.65032
2 −56.25826713 −14.1514 12.95635 10.93363
3 −57.32574678 −11.364 10.03379 9.243618
4 −55.34311732 −12.465 16.77264 14.65657
5 −56.58607546 −12.465 13.35123 10.39986
6 −57.55893903 −10.8814 10.45757 8.754143
7 −55.34311732 −12.2557 17.58852 14.24397
8 −56.77698181 −12.465 14.79857 10.03379
9 −55.41704023 −8.78665 11.24499 13.9794
10 −56.65017825 −14.9638 17.07744 10.11691
11 −54.96376054 −12.7698 13.9794 14.75098
12 −56.05547451 −10.6296 10.9031 10.28557
13 −57.2664572 −14.1514 18.0618 12.95635
14 −57.44312545 −13.0643 13.93608 9.243618
15 −55.91760035 −10.5009 10.9031 9.762333
16 −55.56302501 −14.1514 18.93843 13.76492
17 −54.32006687 −10.6296 15.49381 18.56236
18 −55.63510749 −11.4806 12.35966 14.65657
Table 5 Data of 18 comparability sequences
Deviation sequence |)()(|)(0 *)0(0 kxkxk ii −=Δ Experiment run
(comparability sequence) Thrust force, Δ01(k) Surface roughness, Δ02(k) Tool wear, Δ03(k) Burr height, Δ04(k)
1 0.777422 0.307508 0.673028 0.703102134
2 0.401582 0.131511 0.328206 0.222210669
3 0.071998 0.582753 0 0.049904624
4 0.684134 0.404522 0.75678 0.601783447
5 0.300371 0.404522 0.372552 0.167789763
6 0 0.660892 0.047592 0
7 0.684134 0.438406 0.848404 0.559716675
8 0.241429 0.404522 0.53509 0.13046675
9 0.66131 1 0.136019 0.532742832
10 0.280579 0 0.791009 0.138941195
11 0.80126 0.355178 0.443096 0.611409332
12 0.464194 0.701652 0.097625 0.156137322
13 0.090304 0.131511 0.901553 0.428437387
14 0.035757 0.307508 0.438231 0.049904624
15 0.506762 0.722485 0.097625 0.10279035
16 0.616237 0.131511 1 0.510875727
17 1 0.701652 0.613166 1
18 0.593982 0.563878 0.261197 0.601783447

T. RAJMOHAN, et al/Trans. Nonferrous Met. Soc. China 22(2012) 1286−1297
1292
Next, the grey relational coefficient is calculated. In this study, all the machining parameters influence the responses equally. Considering equal weight, the distinguishing coefficient ξ=0.5 is substituted in Eq. (6). Then, the weighted GRG is determined by Eq. (12). Table 6 lists the grey relational coefficient and weighted grey relational grade for each experiment using the L18 orthogonal array. A higher weighted GRG indicates that the corresponding S/N ratio is closer to the ideally normalized S/N ratio. It is observed from the results that the experiment number 17 has the highest weighted GRG; therefore, it can be considered as a best experimental sequence for multiple performance of the process.
The GRA is further analyzed by using response tables and response graphs. For example, considering the first column in the orthogonal array, the runs No. 1−9 are the experimental runs, in which factor A is set at level 1. The average sum of these values corresponds to the average response value at that level. The mean response table for the overall GRG is listed in Table 7 and represented graphically in Fig. 3. The steep slope of GRG graph (means plot) indicates more influence of machining parameters in the performance characteristics. In the present case, the effects of feed rate and drill have greater influence as can be seen from their steep slope. A horizontal line in this figure is the value of the overall
mean of the weighted GRG. Basically, the larger the grey relational grade is, the better the multiple performance characteristics are. From the GRG graph, the optimal parametric combination is determined. The optimal factor setting is A2 B3C1D1, i.e., the mass fraction of mica at level 2 (3%), drill type at level 3 (PCD), spindle speed at level 1 (1000 r/min), and feed rate at level 1 (50 mm/min).
4 Results and discussion 4.1 Effect of content of mica on grey relational grade
The mechanism in drilling of metal matrix composite is due to the application of thrust by the drill on the composite materials. The mechanism of drilling depends on the content of reinforcement particles embedded in the matrix, type of drill used, cutting conditions used, etc. The increase in mica content increases the surface roughness for all cutting conditions. Less dense mica compared to SiC acts as a weak spot region. When the tool passes over these regions, the crushed mica particles form a deep gorge and hence increase the surface roughness of the material. Similar result was given by MURALIKRISHNAN and RAJA [30]. The removed mica particles get smeared on the machined surface, this smeared mica layer also
Table 6 Calculated grey relational coefficient and weighted GRG for 18 comparability sequences
Grey relational coefficient Experiment run (comparability sequence) Thrust
force, Δ01(k) Surface
roughness, Δ02(k)Tool wear, Δ03(k)
Burr Height, Δ04(k)
Weighted GRG
1 0.691967 0.41929 0.604615 0.627433 0.5858262
2 0.4552 0.365366 0.426696 0.391301 0.4096409
3 0.35014 0.545109 0.333333 0.344805 0.39334678
4 0.612846 0.456422 0.672748 0.556659 0.57466844
5 0.416796 0.456422 0.443479 0.375316 0.42300321
6 0.333333 0.595871 0.344256 0.333333 0.40169831
7 0.612846 0.47099 0.767346 0.531755 0.59573416
8 0.397276 0.456422 0.518183 0.365088 0.43424211
9 0.596168 1 0.366574 0.516926 0.61991687
10 0.410031 0.333333 0.705227 0.367361 0.45398814
11 0.715574 0.436749 0.47308 0.562689 0.54702291
12 0.482716 0.626294 0.356538 0.372062 0.45940232
13 0.354686 0.365366 0.835496 0.466608 0.50553938
14 0.341473 0.41929 0.470912 0.344805 0.39412016
15 0.503404 0.643074 0.356538 0.357856 0.46521809
16 0.565763 0.365366 1 0.505498 0.60915672
17 1 0.626294 0.563803 1 0.79752429
18 0.551865 0.534118 0.403616 0.556659 0.51156452

T. RAJMOHAN, et al/Trans. Nonferrous Met. Soc. China 22(2012) 1286−1297
1293
Table 7 Response table for grey relational grade Grey relational grade
Symbol Machining parameter Level 1 Level 2 Level 3
A Content of mica/% 0.493 0.527* −
B Drill 0.474 0.46 0.594*
C Speed/(r·m−1) 0.554* 0.5 0.475
D Feed rate/(mm·min−1) 0.6* 0.499 0.447 *Levels for optimum GRG
lowers the coefficient of friction. Also the buffing effect of the trapped SiC is reduced when mica is encountered at the surface of the material [28]. The addition of 3% mica reduces the thrust forces significantly, and is attributed to the solid lubricating property of the mica particles. The mica particles reduce the interfacial friction between the tool and the work piece, and lower the shear flow stress. The addition of mica in Al 356/10SiC composite increases the tool life and decreases the flank wear, this is mainly because of the lubricating properties of the mica. From the results, it is understood that mica may act as a lubricant like graphite [31], mica may form a thin lubricating film at the interface between the surface of work pieces and the tool
thus reduces the amount of heat generated in the cutting zone. This reduces the softening of the tool material, resulting in lower flank wear. The addition of mica to Al356/SiC helps in reducing the burr height. When drilling Al356/SiC−mica is at low feed rate, the thrust force encountered by the material is less and leads to reduced plastic deformation. When the plastic deformation takes place, the mica particle smears before the bending of the material due to the low interfacial bond strength and the cutting is prolonged. As the drill advances and when SiC or mica particle forms the pivot point, a burr of reduced height is formed [28]. Thus, the overall machining performance is higher and reflects in the higher value of the weighted grey related grade at 3% of mica. 4.2 Effect of drill materials on grey relational grade
PCD drills exhibit better surface finish in the machining of hybrid MMCs compared to carbide and coated carbide drills. This is due to the increase in drill hardness which decreases the surface roughness of the drilled surface [32]. Carbide and coated carbide drills exhibits more build up edge than the PCD drills, which contributes to rougher surface. RAMULU et al [33] has also published similar results. Moreover, SiC cannot
Fig. 3 Response graphs of content of mica (a), drill type (b), spindle speed (c) and feed rate (d) on grey relational grade

T. RAJMOHAN, et al/Trans. Nonferrous Met. Soc. China 22(2012) 1286−1297
1294 micro cut the PCD tool, but in other cases, SiC particles can micro cut the tool materials. Therefore, the machining performance is improved when the PCD drill is used, which can be seen in the GRG graphs. 4.3 Effect of spindle speed on grey relational grade
The increase in spindle speed reduces the surface roughness in the drilling of hybrid Al 356/SiC-mica composites. At high spindle speed, the force induced in cutting is increased which in turn cuts the hybrid MMCs smoothly and produces less surface roughness than at slow speed. The burr height is increased with increasing feed rate predominantly and the increase in burr height with the increase in spindle speed is less. This is mainly due to the thrust force generated. It indicates that at higher cutting speed, burr height may slightly decrease. As the speed increases, flanks wear increases for all the tool materials. A general trend of increase of flank wear with the increase in speed is attributed to the increase in temperature of the cutting zone. The increase of cutting speed increases the action between tool and work piece, which increases the abrasive wear on the tool. Also, as the cutting speed is increased, the recrystallization of the highly strained material of the BUE reduces the hardness and stability of the BUE, and the tool face is exposed leading to increased flank wear. It can also be observed that there is no predominant variation in thrust force on the increasing spindle speed at all the feed rates considered [33]. Thus, the overall machining performance is better at the GRG of 1000 r/min. 4.4 Effect of feed rate on grey relational grade
The results indicate that low feed rate is preferred in the drilling of hybrid Al356/SiC-mica MMC. The increase in feed rate increases the thrust force and torque, and it leads to poor surface finish. Also, the increase in feed rate increases the heat generation during drilling, which increases the surface roughness. The increase in feed rate increases the thrust force in the drilling of composites. This increase in thrust force bends the material to a larger extent before interfacial bond cracking progresses, resulting in larger burr formation.
As the feed rate increases, the flank wear increases for both the composites. This can be attributed to the increase in the temperature at high feed rates, which causes the softening of the tool material. The increase in feed rate increases the thrust force and torque and it leads to poor surface finish. Also, the increase in feed rate increases the heat generation during drilling, which increases the surface roughness [12]. Thus, the machining performance is better at lower feed rate of 50 mm/min. 4.5 Analysis of variance for grey relational grade
The GRG obtained using Eq. (12) is analyzed using ANOVA and the analysis of means (ANOM). ANOVA is used to reveal the level of significance of influence of factors on a particular response. This is accomplished by separating the total variability of the GRG, which is measured by the sum of the squared deviations from the total mean value of the GRG into contributions by each turning process parameters and the errors. The response table of Taguchi method was employed here to calculate the average GRG for each factor level. The grouping of the grey relational grades was done initially by the factor level for each column in the orthogonal array and then by averaging them. The result of ANOVA (Table 8) indicates that the feed rate is highly influential parameter (percentage contribution 38.37%) followed by drill type (33.67%). 4.6 Surface morphology
Scanning electron microscope (SEM) is used to observe and analyze the machined surface. The SEM micrographs of the drilled surface are given in Figs. 4(a)−(c). During the drilling operation, the mutual rubbing of abrasive particles in the drilled hole surface improves the surface finish. Careful examination of the worn surface reveals that a high feed causes an extensive surface damage in composites due to higher contact pressure. Higher feed rate increases the temperature at the tool-work surface. This leads to the softening by plastic deformation. Al356/SiC−mica composites exhibit voids and cracks at the SiC and mica particle/Al matrix
Table 8 Results of ANOVA for grey relational grade
Factor Degree of freedom Sum of squares Mean squares F value Prob>F Contribution/%
A 1 0.005184 0.005184 1.766476 0.2133 2.68
B 2 0.065016 0.032508 11.07812 0.0029 33.67
C 2 0.01946 0.00973 3.315839 0.0786 10.08
D 2 0.074102 0.037051 12.62616 0.0018 38.37
Error 10 0.029345 0.002934 15.20
Total 7 0.193107 100
T. RAJMOHAN, et al/Trans. Nonferrous Met. Soc. China 22(2012) 1286−1297
1295
Fig. 4 SEM images illustrating drilled surface under different conditions: (a) PCD drill, speed of 2000 r/min, feed rate of 100 mm/min, mica content of 3 %; (b) Carbide drill, speed of 3000 r/min, feed rate of 100 mm/min, mica content of 0%; (c) Coated carbide drill, speed of 2000 r/min, feed rate of 100 mm/min, mica content of 0% interface and particle pulls out. These cracks are caused by the strain hardening of the material.
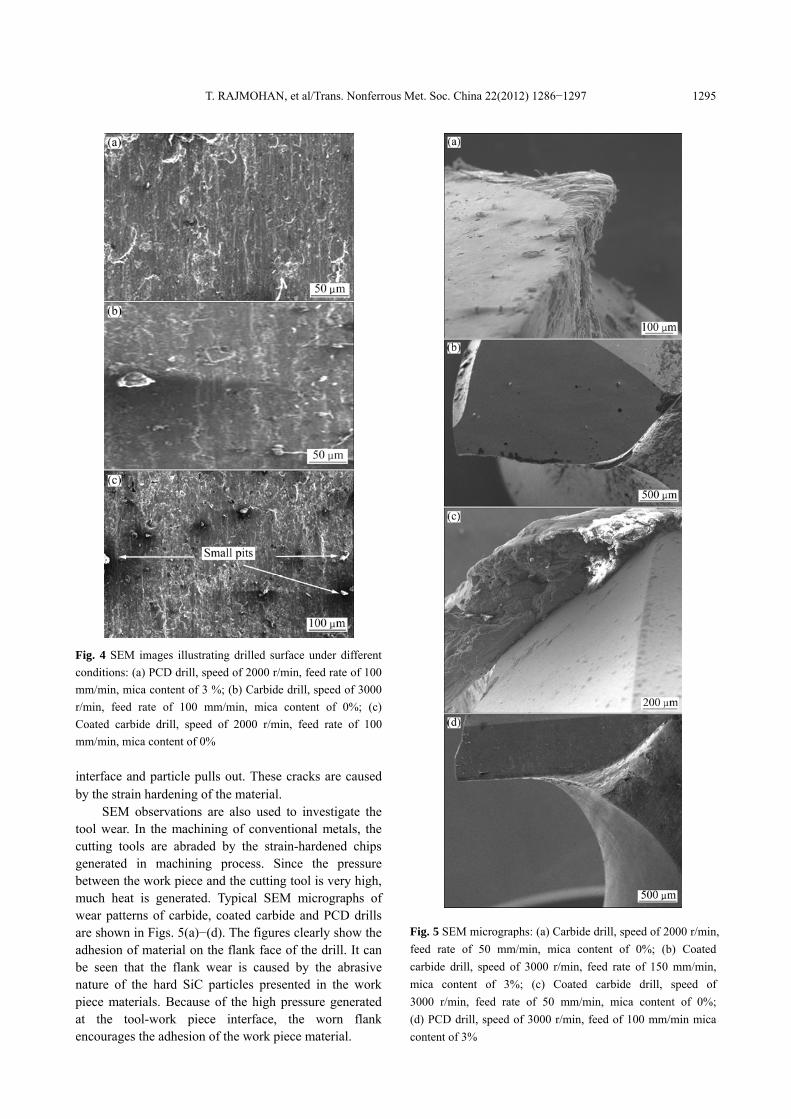
SEM observations are also used to investigate the tool wear. In the machining of conventional metals, the cutting tools are abraded by the strain-hardened chips generated in machining process. Since the pressure between the work piece and the cutting tool is very high, much heat is generated. Typical SEM micrographs of wear patterns of carbide, coated carbide and PCD drills are shown in Figs. 5(a)−(d). The figures clearly show the adhesion of material on the flank face of the drill. It can be seen that the flank wear is caused by the abrasive nature of the hard SiC particles presented in the work piece materials. Because of the high pressure generated at the tool-work piece interface, the worn flank encourages the adhesion of the work piece material.
Fig. 5 SEM micrographs: (a) Carbide drill, speed of 2000 r/min, feed rate of 50 mm/min, mica content of 0%; (b) Coated carbide drill, speed of 3000 r/min, feed rate of 150 mm/min, mica content of 3%; (c) Coated carbide drill, speed of 3000 r/min, feed rate of 50 mm/min, mica content of 0%; (d) PCD drill, speed of 3000 r/min, feed of 100 mm/min mica content of 3%
T. RAJMOHAN, et al/Trans. Nonferrous Met. Soc. China 22(2012) 1286−1297
1296 5 Verification of optimal parameters though
confirmation experiments
The final step involved in the optimization process is to predict and verify the improvement in the performance characteristic for drilling of Al356/SiC− mica composites with respect to the chosen initial parameters setting. The predicted GRG, using the optimal level of the machining parameters can be calculated as:
( )predicted m 0 m 1
N
i
ξ ξ ξ ξ=
= + −∑ (14)
where ξm is the total mean value of the GRG; ξ0 is the mean GRG at optimal level and N is the number of main design parameters that affect the multiple performance characteristics. Table 9 lists the comparison between the predicted and actual machining performance for multiple performance characteristic using the optimal cutting parameters. The confirmation experiment results at optimal level (A2B3C1D1) shows that the thrust force is reduced from 560 to 510 N, the surface finish is improved from 4.5 to 3.4 μm, tool wear is reduced from 0.158 to 0.148 mm and burr height is reduced from 0.165 to 0.118 mm. It is evidently seen from these results that the multiple performance characteristics in the composite machining process is greatly improved through this approach. It is found that an improvement of 10.06 % is observed in the weighted GRG. This ensures the usefulness of grey relational approach in relational analysis to product/process optimization, where multiple quality criteria have to be fulfilled simultaneously. Table 9 Comparison between machining performance using initial and optimal level
Optimal machining parameter Machining
parameter
Initial machining parameter Predicted Experimental
Setting level A1 B1 C1 D1 A2 B3 C1 D1
Thrust force 565 510
Surface roughness 4.5 3.4
Tool Wear 0.158 0.118
Burr height 0.165 0.118 Grey relational
grade 0.591 0.745 0.820
6 Conclusions
1) The recommended levels of drilling parameters for minimizing thrust force, surface roughness, tool wear and burr height (exit) simultaneously are the content of mica at level 2 (3%), drill type at level 3 (PCD), spindle speed at level 1 (1000 r/min) and feed rate at level 1
(50 mm/min). Among the tested parameters, the feed rate shows strongest correlation to the thrust force, surface roughness, tool wear and burr height (exit).
2) An increase in the value of predicted weighted GRG from 0.745 to 0.820 confirms the improvement in the performance of drilling of hybrid metal matrix composites when using the optimal values of process parameters.
3) The experimental results for optimal settings show that there is a considerable improvement in the performance characteristics of machining process. This technique is more convenient and economical to predict the effects of different influential combinations of the parameters within the levels studied. Acknowledgement
The authors would express their sincere gratitude to the authorities of SCSVMV University, Kanchipuram, India for funding and supporting this research work. References [1] KILIÇKAP E, ÇAKIR O, AKSOY M, İNAN A. Study of tool
wear and surface roughness in machining of homogenized SiC-p reinforced aluminium metal matrix composite [J]. Journal of Materials Processing Technology, 2005, 165: 862−867.
[2] MOHAN B, RAJADURAI A, SATYANARAYANA K G. Electric discharge machining of Al/SiCp metal matrix composites using rotary tube electrode [J]. Journal of Mater Process Technology, 2004, 153: 978−985.
[3] ZHAN Y Z, ZHANG G D. The role of graphite particles in the high temperature wear of copper hybrid composites against steel [J]. Materials and Design, 2006, 27: 79−84.
[4] ZHANG X N, GENG L, WANG G S. Fabrication of Al-based hybrid composites reinforced with SiC whiskers and SiC nano particles by squeeze casting [J]. Journal of Materials Processing Technology, 2066, 176: 146−151.
[5] GALLAB M, SKLAD M. Machining of Al/SiCp metal matrix composites. Part II: Workpiece integrity [J]. Journal Mater Process, 1998, 83: 277−283.
[6] ROSS P J. Taguchi technique for quality engineering [M]. New York: McGraw-Hill, 1988.
[7] TAGUCHI G, KONISHI S. Taguchi methods, orthogonal arrays and linear graphs: Tools for quality engineering [M]. Dearbom: American Supplier Institute, 1987: 35−38.
[8] PALANIKUMAR K, MUTHUKRISHNAN N. HARIPRASAD K S. Surface roughness parameters optimization in machining A356/SiC/20p metal matrix composites by PCD tool using response surface methodology and desirability function [J]. Machining Science and Technology, 2008, 12: 529−545.
[9] UDAY A D, HARSHAD A S, SUHAS S J. Cutting forces and surface roughness in machining Al/SiCp composites of varying composition [J]. Machining Science and Technology, 2010, 10: 258−279.
[10] KREMER A, DEVILLEZ A D, DUDZINSKI D, El MANSORI M. Machinability of Al/SiC particulate metal-matrix composites under dry conditions with CVD diamond-coated carbide tools [J]. Machining Science and Technology, 2008, 12: 214−233.
[11] PENDSE D M, JOSH S S. Modeling and optimization of machining process in discontinuously reinforced aluminium matrix composites [J]. Machining Science and Technology, 2004, 8: 85−102.

T. RAJMOHAN, et al/Trans. Nonferrous Met. Soc. China 22(2012) 1286−1297
1297
[12] PALANIKUMAR K, KARTHIKEYAN R. Assessment of factors influencing surface roughness on the machining of Al/SiC particulate composites [J]. Materials & Design, 2007, 28: 1584−1591.
[13] DENG J L. Introduction to grey system theory [J]. The Journal of Grey System, 1989, 1(1): 1−24.
[14] MATHEW M, RAJENDRAKUMAR P K. Optimization of process parameters of boro-carburized low carbon steel for tensile strength by Taquchi method with Grey relational analysis [J]. Materials & Design, 2011, 32: 3637−3644.
[15] ILO S, JUST C, XHIKU F. Optimisation of multiple quality characteristics of hardfacing using grey-based Taguchi method [J]. Materials & Design, 2012, 33: 459−468.
[16] CHAN J W K, TONG T K L. Multi-criteria material selections and end-of-life product strategy: Grey relational analysis approach [J]. Materials & Design, 2007, 28: 1539−1546.
[17] VINOD KUMAR J, KHAMBA S. Parametric optimization of ultrasonic machining of Co-based super alloy using the Taguchi multi-objective approach [J]. Production Eng Res Devel, 2009, 3: 417−425.
[18] BEHRENS B A, PÖSSE O, MILCH M, HELMS G. Optimization of ironing processes by means of DOE and FEA [J]. Production Eng Res Devel, 2007, 1: 3−8.
[19] TOSUN N. Determination of optimum parameters for multiperformance characteristics in drilling by using Grey relational analysis [J]. International Journal of Advanced Manufacturing Technology, 2006, 28: 450−455.
[20] KUO Y, YANG T, HUANG G W. The use of a grey-based Taguchi method for optimizing multi-response simulation problems [J]. Engineering Optimization, 2008, 40(6): 517−528.
[21] KAO P S, HOCHENG H. Optimization of electrochemical polishing of stainless steel by grey relational analysis [J]. Journal of Materials Processing Technology, 2003, 140: 255−259.
[22] RAMAKRISHNAN A, KARUNAMOORTHY L. Modeling and multi-response optimization of Inconel 718 on machining of CNC WEDM process [J]. Journal of Materials Processing Technology, 2008, 207: 343−349.
[23] CHIANG K T, CHANG F P. Optimization of the WEDM process of
particle-reinforced material with multiple performance characteristics using Grey relational analysis [J]. Journal of Materials Processing Technology, 2006, 180: 96−101.
[24] LUA S H, CHANGB C K, HWANGA N C, CHUNG C T. Grey relational analysis coupled with principal component analysis for optimization design of the cutting parameters in high-speed end milling [J]. Journal of Materials Processing Technology, 2009, 209: 3808−3817.
[25] KOPAC J, KRAJNIK P. Robust design of flank milling parameters based on grey-Taguchi method [J]. Journal of Materials Processing Technology, 2007, 191: 400−403.
[26] TZENG C J, LIN Y H, YANG Y K, JENG M C. Optimization of turning operations with multiple performance characteristics using the Taguchi method and Grey relational analysis [J]. Journal of Materials Processing Technology, 2009, 209: 2753−2759.
[27] BOWDEN E P TABOR D. The friction and lubrication of solids [M]. Oxford: Oxford University Press: Ciarendon Press, 1964: 199.
[28] BASAVARAJAPPA S, CHANDRAMOHAN N, DAVIM J P. Some studies on drilling of hybrid metal matrix composites based on Taguchi techniques [J]. Journal of Materials Processing Technology, 2008, 21: 332−338.
[29] PAWADE R S, JOSHI S S. Multi-objective optimization of surface roughness and cutting forces in high-speed turning of Inconel 718 using Taguchi grey relational analysis (TGRA) [J]. International Journal Adv Manuf Technology, 2011, 56: 47−62.
[30] MURALIKRISHNAN B, RAJA J. Characterization of cast iron surfaces with graphite pullouts using morphological filters [J]. Society of Manufacturing Engineers, 2002(144): 1−8.
[31] SONGMENE V. BALAZINSKI M. Machinability of graphitic metal matrix composites as a function of reinforcing particles [J]. Annals of the CIRP, 1999, 48: 77−80.
[32] TOSUN G, MURATOGLU M. The drilling of an Al/SiCp metal–matrix composites. Part I: Microstructure [J]. Composite Science Technology, 2004, 64: 299−308.
[33] RAMULU M, RAO P N, KAO H. Drilling of (Al2O3)p/6061 metal matrix composites [J]. Journal of Materials Processing Technology, 2002, 124: 244−254.
混合铝基复合材料钻削工艺参数的优化
T. RAJMOHAN1, K. PALANIKUMAR2, M. KATHIRVEL3
1. Department of Mechanical Engineering, Sri Chandrasekharendra Saraswathi Viswa Maha Vidyalaya University, Kanchipuram 631561, India;
2. Department of Mechanical Engineering, Sri Sairam Institute of Technology, Chennai 600044, India; 3. Department of Mechanical Engineering, Sun College of Engineering and Technology,
Sun Nagar, Erachakulam Post, Kanyakumari 629902, India
摘 要:采用 Taguchi 方法和灰色关联分析对 Al356/SiC-云母混合金属基复合材料的钻削工艺参数进行优化。实
验采用 L18 正交阵列,在计算机的控制立式机床上进行。考察的钻削性能指标包括轴向力、表面粗糙度、刀具磨
损和毛刺高度,对影响这些性能的钻削工艺参数进行了优化,包括轴转数、给进速度、钻头类型和云母质量分数。
结果表明:给进速度和钻头类型是影响钻削过程的重要因素,通过这种方法可以有效地改进钻削工艺的性能。 关键词:混合复合材料;灰色关联分析;Taguchi 方法
(Edited by FANG Jing-hua)