Optimization of Hazardous Waste Remediation Activities Using Life
68
Optimization of Hazardous Waste Remediation Activities Using Life Cycle Assessment Romic East Palo Alto Case Study Davie Nguyen 4/29/2011
Transcript of Optimization of Hazardous Waste Remediation Activities Using Life
Optimization of Hazardous
Waste Remediation
Activities Using Life Cycle
Assessment Romic East Palo Alto Case Study
Davie Nguyen
4/29/2011
Nguyen 1
Abstract
The cleanup of hazardous waste sites promotes sustainability by removing toxins and other
health threats left in the environment from previous unsustainable industrial practices. However,
the remediation process consumes energy, water, and natural resources, creating an
environmental footprint that is often overlooked. In order to account for the footprint created
from remediation, the study emphasizes the need for more sustainable remediation techniques
and tests the use of life cycle assessment (LCA) to analyze the environmental impacts of
treatment technologies prior to being implemented at a contaminated site. The environmental
footprints of three remediation strategies prescribed for a contaminated site in Palo Alto,
California, are compared using life cycle assessment. The study compares bioremediation with
pump-and-treat technology, and a hybridized alternative.
The results of the LCAs indicate that implementation of the bioremediation alternative results in
the least impact to the environment. Bioremediation would contribute 5,435 tons of CO2
equivalents into the atmosphere, compared to the 22,586 tons of generated by pump-and-treat,
and the 11,281 tons generated from the hybrid alternative. The study considers major
contributing processes associated with all on-site and off-site activities, and quantifies their
overall contribution with respect to the three alternatives. This information can be used by
decision-makers to optimize the selection of cleanup activities and identify where additional
sustainability benefits can be achieved within each alternative. The study recommends that LCA
and green remediation techniques be implemented nationally at all contaminated sites. Using the
tool for all cleanups will reduce the environmental impact created from remediation and
subsequently provide for a more sustainable future.

Nguyen 2
Table of Contents
Introduction ..................................................................................................................................... 3
Objective ......................................................................................................................................... 4
Hazardous Waste Remediation ....................................................................................................... 5
Green Remediation ......................................................................................................................... 6
Remedy Selection Process .............................................................................................................. 8
Life Cycle Assessment .................................................................................................................. 10
Site Background ............................................................................................................................ 11
Pump and Treat Alternative .......................................................................................................... 13
Bioremediation .............................................................................................................................. 13
Hybrid Alternative ........................................................................................................................ 14
Methods......................................................................................................................................... 14
Results ........................................................................................................................................... 17
Discussion ..................................................................................................................................... 22
Conclusion .................................................................................................................................... 25
Appendices .................................................................................................................................... 27

Nguyen 3
Introduction
As described by the United States Environmental Protection Agency (US EPA), the clean-up of
hazardous waste sites promotes sustainability by removing toxins and other health threats left in
the environment from previous unsustainable industrial practices. However, the remediation
process consumes energy, water, and natural resources, creating an environmental footprint that
is often overlooked. In 2009, US EPA established guidelines for green remediation, or “the
application of technologies and approaches that enhance a cleanup project’s environmental,
social, and economic footprints.”1 With burgeoning interest from other agencies including
California’s Department of Toxic Substances Control (DTSC), the EPA proposed a Green
Cleanup Standard Initiative in 2010 to “develop, through a consensus process, a standard that
evaluates and minimizes the environmental footprint from a cleanup.”2 The Green Cleanup
Standard Initiative set several core elements for remediation including:
- Minimize total energy use and maximize use of renewable energy
- Minimize air pollutants and greenhouse gas emissions
- Minimize water use and impacts to water resources
- Reduce, reuse, and recycle material and waste
- Protect land and ecosystems
The core elements are expected to be used in all site clean-ups, but cannot be fully implemented
without a complete understanding of all impacts generated from the remediation process. At the
same time, decision-makers need a way to zero in on specific factors and identify where
emissions reductions can be achieved. Thus, adhering to the Green Cleanup Standard Initiative
requires a full assessment of the environmental footprint generated from site cleanup, beginning
with the site investigation phase, implementation of the treatment plan, and continuing through
the operations, monitoring, maintenance, and decommissioning phases of a project. In order to
account for the footprint of remedial activities, life cycle assessment (LCA) can be used to
1 Superfund and Green Remediation. US EPA Superfund Office. http://www.epa.gov/superfund/greenremediation/.
2011
2 Green Cleanup Standard. CLU-IN EPA Green Remediation Focus. http://www.clu-
in.org/greenremediation/subtab_b5.cfm. 2011

Nguyen 4
document the quantity of all inputs and outputs associated with a remediation strategy. The tool
can help quantify environmental emissions and identify where sustainability benefits can be
achieved during each phase of site clean-up. While LCA has not been used in the selection of
remediation strategies at hazardous waste sites, incorporating the cradle-to-grave approach in
decision-making processes will assure that the environmental impact of all contributing
processes are properly accounted for.
As decision-makers are responsible for implementing cleanup strategies that result in the least
adverse impact to public health and the environment, LCAs can help assess the footprint
generated from the extraction of raw materials, transportation of materials to and from the site,
and eventual decommissioning. Thus, decision-makers can use the information gathered from
LCAs to identify where additional emissions reductions can be achieved and subsequently
optimize the selection process of treatment alternatives.
Objective
This study will compare the greenhouse gas emissions created from three cleanup alternatives
proposed at a hazardous waste site in East Palo Alto, California. The results will be used to better
inform decision-makers of the environmental impacts of traditional as well as new “green”
remediation strategies. While LCA is not currently required as part of the remedy
implementation process, the study seeks to prove that additional environmental benefits can be
achieved with the implementation of greener remediation techniques and from carefully
analyzing all stages of site-cleanup. Streamlined LCAs will be conducted to quantify the
greenhouse gas emissions generated from the three remediation alternatives at the Romic
Environmental Technologies Corporation (Romic) facility in East Palo Alto, California. The
study will analyze traditional pump-and-treat remediation, bioremediation, and a combination of
pump-and-treat and bioremediation, hereon referred to as the hybrid alternative. For each of the
three alternatives, an LCA will be conducted that assesses the emissions generated from raw
material extraction to eventual disposal at the landfill. This will take into consideration total
water and energy use, as well as the transportation footprint created during the operation and
maintenance phases. Based on these findings, the study will assess how the environmental
impact of bioremediation compares to pump-and-treat, as well as the hybrid alternative.
Furthermore, the results of the study can be used to help decision-makers minimize the

Nguyen 5
secondary impacts of remediation, and optimize the selection of cleanup strategies at any given
site.
Hazardous Waste Remediation
Prior to the EPA’s regulation of hazardous waste in 1976, hazardous waste was often improperly
stored or disposed of in landfills, abandoned in open fields, or dumped along roadways. Many of
these operations were responsible for the contamination of groundwater and soil throughout the
nation and have even been responsible for the death. Today, these sites are undergoing long-term
cleanup actions, several of which will take decades to fully study the problem, develop the right
remedy, and rid the area of hazardous waste.
As part of its mission to adequately protect human health and welfare, the US EPA manages and
implements the Superfund Remedial Program to clean up releases of hazardous wastes,
pollutants, and other contaminants. From its inception in 1980, the program has made
considerable progress toward cleaning up waste sites so that they do not adversely affect public
health and the environment.3 These contaminated sites are often referred to as Superfund,
Corrective Action, or Brownfield sites, but differentiate in terms of the level of contamination,
and the media contaminated. As such, it is important that remediation techniques involve a wide
variety of approaches and technologies to address contamination in media not limited to soil,
groundwater, sediment, and surface water.
It is estimated that more than 1,200 contaminated sites are found on the National Priorities List
(NPL), a list of prioritized sites where known releases or threatened releases of hazardous
substances, pollutants, or contaminants have been discovered. The NPL identifies sites found in
the United States and its territories, and ranks them in terms of Hazard Rank. The NPL is mainly
intended to guide the EPA in determining which sites warrant further investigation or action.4
This allows high priority sites, or sites where contamination is a significant risk to public health,
to undergo immediate and long-term cleanup. Other sites may be cited for a long-term
remediation strategy, whereby the threats of hazardous substances are serious, but not
3 Superfund Sites. US EPA. http://www.epa.gov/superfund/. 2011
4 National Priorities List. US EPA Superfund Office. http://www.epa.gov/superfund/sites/npl/. 2011

Nguyen 6
immediately life threatening. However, the NPL is not exhaustive of all contaminated sites and
smaller-scale contamination may still require remedial action.
Remedial activity falls under the umbrella of the Comprehensive Environmental Response,
Compensation, and Liability Act (CERCLA), which was enacted by Congress on December 11,
1980. The advent of CERCLA provided federal authority to respond directly to releases or
threatened releases of hazardous substances that may potentially endanger public health and
welfare.5 The law was responsible for:
- Establishing prohibitions and requirements concerning closed or abandoned hazardous
waste sites
- Providing for liability of those responsible for releases of hazardous waste at these sites
- Establishing a trust fund to provide for site cleanup when a responsible party could not be
identified
In general, the US EPA recognizes that these contaminated sites have the potential to
significantly affect the environment and people who work or live around the area. If there are
any immediate threats present at these sites, the EPA will respond quickly to perform a removal
action. In some cases, removal actions eliminate the need for long-term cleanup at certain
portions of the site. However, a majority of hazardous waste sites require long-term remedial
actions. Depending on the nature of the contamination, these long-term remedies can be energy
intensive and result in significant unaccounted secondary impacts.
Green Remediation
In September 2010, the US EPA’s Office of Superfund Remediation and Technology Innovation
published a Superfund Green Remediation Strategy, recognizing that the process of cleaning up
hazardous waste sites creates an environmental footprint on its own.6 This can be attributed to
groundwater remediation techniques such as pump and treat, which have historically utilized
energy from fossil fuel-powered utilities. Furthermore, construction equipment such as drill rigs
and bulldozers used to excavate soil are heavily dependent on diesel fuel. The subsequent
5 CERCLA Overview. US EPA Superfund. http://www.epa.gov/superfund/policy/cercla.htm. 2011
6 Superfund and Green Remediation. US EPA Superfund Office. http://www.epa.gov/superfund/greenremediation/.
2011

Nguyen 7
combustion of this fuel can emit large quantities of greenhouse gases, as well as hazardous and
criteria air pollutants into the atmosphere. Within the ambient environment, these air pollutants
can lead to significant human health impacts.
In its Superfund Green Remediation Strategy, the US EPA defines green remediation as the
practice of considering all environmental effects of remedy implementation and incorporating
options to minimize the environmental footprints of cleanup actions.7 This includes taking all
necessary steps to minimize the footprint of a prescribed site cleanup, while remediating
contamination to a level that is protective of human health and the environment. With more than
1,200 NPL sites and 3,000 contaminated sites that have yet to reach a final assessment decision,
reducing the environmental impact of cleanup actions can cumulatively benefit the natural
environment.
The best opportunities for emissions reductions are expected to come from optimizing the
efficiency of long-term operations. This includes targeting operations that are energy intensive
and place a lot of pressure on the consumption of natural resources. Efforts are currently
underway by projection managers to use more renewable energy resources, aligning with
guidelines such as Executive Order 13514: Federal Leadership in Environmental, Energy, and
Economic Performance.8 Thus with careful planning to link green remediation with sustainable
development practices, the overall impact of cleanup projects will be reduced. As stated by the
US EPA,
“The combined planning and practices provide a basis for a greener approach to land
revitalization and help ensure that all socioeconomic groups of affected communities can
benefit from the improved environmental outcome of site cleanup.”9
7 Ibid
8 Executive Order 13514: Federal Leadership in Environmental, Energy, and Economic Performance. The White
House. http://www.whitehouse.gov/assets/documents/2009fedleader_eo_rel.pdf. 2009
9 Superfund Green Remediation Strategy. US EPA Superfund. http://www.epa.gov/superfund/greenremediation/sf-
gr-strategy.pdf. 2010
Nguyen 8
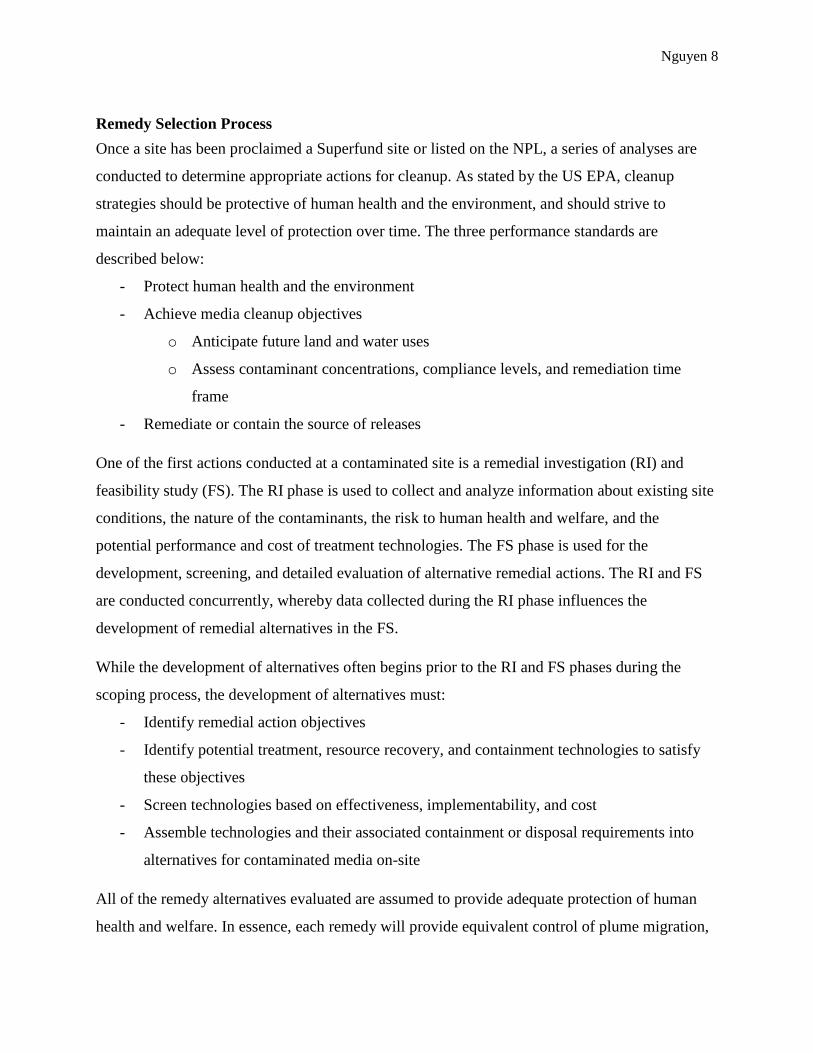
Remedy Selection Process
Once a site has been proclaimed a Superfund site or listed on the NPL, a series of analyses are
conducted to determine appropriate actions for cleanup. As stated by the US EPA, cleanup
strategies should be protective of human health and the environment, and should strive to
maintain an adequate level of protection over time. The three performance standards are
described below:
- Protect human health and the environment
- Achieve media cleanup objectives
o Anticipate future land and water uses
o Assess contaminant concentrations, compliance levels, and remediation time
frame
- Remediate or contain the source of releases
One of the first actions conducted at a contaminated site is a remedial investigation (RI) and
feasibility study (FS). The RI phase is used to collect and analyze information about existing site
conditions, the nature of the contaminants, the risk to human health and welfare, and the
potential performance and cost of treatment technologies. The FS phase is used for the
development, screening, and detailed evaluation of alternative remedial actions. The RI and FS
are conducted concurrently, whereby data collected during the RI phase influences the
development of remedial alternatives in the FS.
While the development of alternatives often begins prior to the RI and FS phases during the
scoping process, the development of alternatives must:
- Identify remedial action objectives
- Identify potential treatment, resource recovery, and containment technologies to satisfy
these objectives
- Screen technologies based on effectiveness, implementability, and cost
- Assemble technologies and their associated containment or disposal requirements into
alternatives for contaminated media on-site
All of the remedy alternatives evaluated are assumed to provide adequate protection of human
health and welfare. In essence, each remedy will provide equivalent control of plume migration,

Nguyen 9
restore the aquifer and soil to beneficial use, and prevent direct exposure to the public and
surrounding environment.
Once alternatives have been developed, they are evaluated in detail with respect to the US EPA’s
nine evaluation criteria. This process is often referred to as the Detailed Analysis phase, which
determines if the alternatives are in accordance with CERCLA regulations. The nine criteria
consist of:
- Overall protection of human health and welfare
- Compliance with Applicable or Relevant and Appropriate Requirements (ARARs)
- Short-term effectiveness
- Long-term effectiveness and permanence
- Reduction of toxicity, mobility, or volume
- Implementability
- Cost
- State acceptance
- Community acceptance
The nine assessment criteria are critical in the selection of alternatives, but fail to consider
sustainability as a factor in driving decision-making. As the concept of green remediation is
becoming more prevalent at cleanup sites, decision-makers should look for ways to identify
additional sustainability benefits at all stages of site cleanup. Thus, decision-makers can combine
the use of LCA with the nine CERCLA assessment criteria to make better-informed decisions
based on science. This aligns with the current Administration’s goal to:
“Base our public policies in the soundest science…that we are open and honest with the
American people about the science behind our decisions. That is how we will harness the
power of science to achieve our goals- to preserve our environment and protect our
national security.”10
10
Marcus, Michael. Public Knowledge. http://www.publicknowledge.org/node/2024. 2009

Nguyen 10
Life Cycle Assessment
The International Organization for Standardization (ISO) identifies two standards for life cycle
assessment: ISO 14040 and ISO 14044. As defined by these two standards, LCA is the
compiling and evaluation of the inputs and outputs and the potential environmental impacts of a
product system during a product’s lifetime.11
In other words, LCA provides a holistic assessment
of raw material production, manufacture, distribution, use, and eventual disposal of a product.
For this particular study, LCAs will be used to evaluate the environmental footprint of processes
rather than individual products. The goal of conducting the three LCAs is to compare the full
range of environmental impacts attributable to all materials and services for each remedial
alternative, and subsequently pinpoint areas where additional environmental benefits can be
attained.
Applied to this study and for broader remedial activities, LCA can help decision-makers:
- Develop a systematic evaluation of the environmental consequences associated with a
given product
- Analyze the environmental trade-offs associated with one or more specific
products/processes to help gain stakeholder (state, community, etc.) acceptance for a
planned action.
- Quantify environmental releases to air, water, and land in relation to each life cycle stage
and/or major contributing process.
- Assist in identifying significant shifts in environmental impacts between life cycle stages
and environmental media.
- Assess the human and ecological effects of material consumption and environmental
releases to the local community, region, and world.
- Compare the health and ecological impacts between two or more rival products/processes
or identify the impacts of a specific product or process.
- Identify impacts to one or more specific environmental areas of concern.
11
Building LCA. GaBi Software PE International. http://www.gabi-software.com/solutions/building-lca/. 2011

Nguyen 11
The LCAs will be conducted using GaBi, a program designed for life cycle inventory and
modeling. Using the available data, it is possible to compare the relative impact of each remedial
alternative through the documentation of all inputs and outputs associated with each process.
This is also referred to as calculating an impact potential, which evaluates the contribution of all
processes in terms of global greenhouse gas emissions.
Producing a high quality LCA is also heavily dependent on the collection of Life Cycle
Inventory (LCI) data. Also referred to as the data collection portion of an LCA, LCI databases
provide data necessary to convert energy usage, materials usage, and various services associated
with a particular activity into an environmental footprint. While this information is not available
for all processes, a majority of LCI data was gathered from preloaded GaBi datasets, the
National Renewable Energy Laboratory (NREL), and the US LCI Database. When LCI data was
not publicly available, a separate inventory was created for each unit process. This is because
most inventory data is privately held and not made publicly available. This can result in
transparency issues and the general lack of available LCI data makes it difficult to verify results
or key findings. The study also requires site-specific data on specific remediation techniques,
which was acquired through the US EPA.
In order to provide the most accurate LCA, only data from the past five years was used in the
analysis. While not all datasets were readily available or updated within the previous five years,
conservative estimates were used in cases where limited LCI data could influence the validity of
the LCA. As described above, LCA is normally used for evaluation of products, but will be used
in this context as a tool to optimize the way US EPA conducts Superfund, Brownfield, and
Corrective Action remediation. Thus, it is expected that standardizing LCA for all waste sites in
combination with green clean-up technologies will ultimately help decision-makers implement
the necessary steps to reduce the environmental footprint created from remediation.
Site Background
Romic is a 12.6-acre former hazardous waste management facility located in East Palo Alto,
California. Operations at the facility included solvent recycling, fuel blending, wastewater
treatment, and hazardous waste storage and treatment. Attributed to the historical waste
Nguyen 12
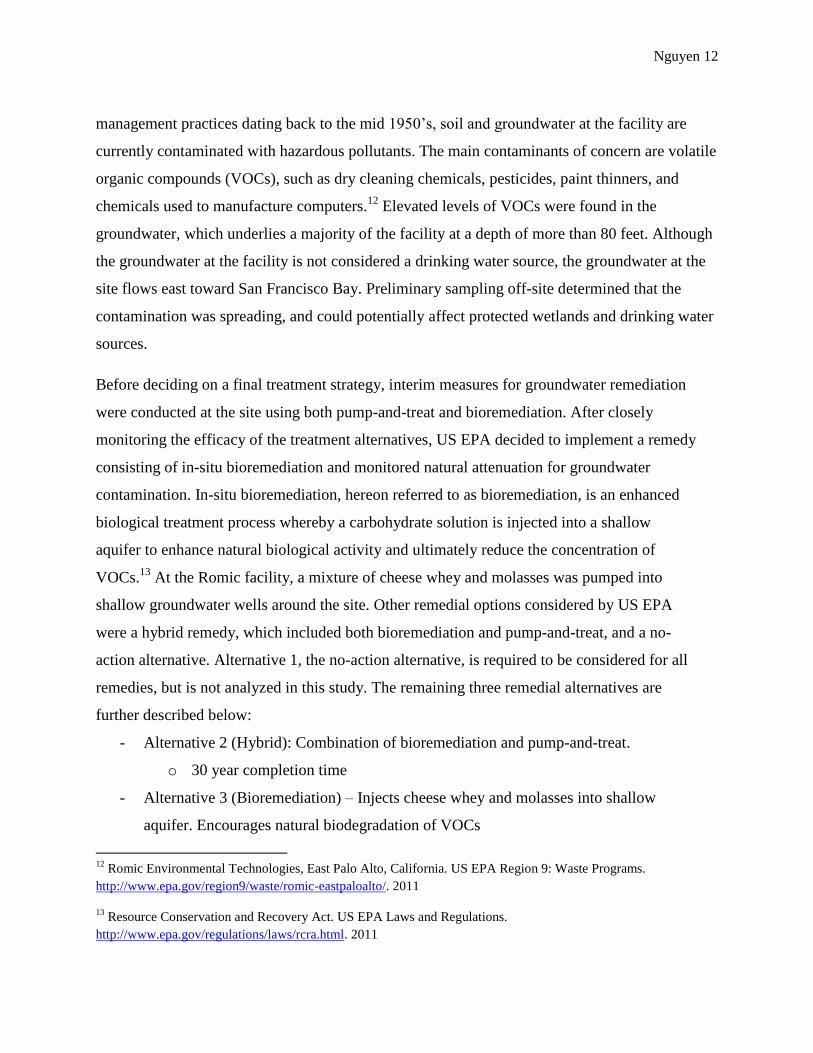
management practices dating back to the mid 1950’s, soil and groundwater at the facility are
currently contaminated with hazardous pollutants. The main contaminants of concern are volatile
organic compounds (VOCs), such as dry cleaning chemicals, pesticides, paint thinners, and
chemicals used to manufacture computers.12
Elevated levels of VOCs were found in the
groundwater, which underlies a majority of the facility at a depth of more than 80 feet. Although
the groundwater at the facility is not considered a drinking water source, the groundwater at the
site flows east toward San Francisco Bay. Preliminary sampling off-site determined that the
contamination was spreading, and could potentially affect protected wetlands and drinking water
sources.
Before deciding on a final treatment strategy, interim measures for groundwater remediation
were conducted at the site using both pump-and-treat and bioremediation. After closely
monitoring the efficacy of the treatment alternatives, US EPA decided to implement a remedy
consisting of in-situ bioremediation and monitored natural attenuation for groundwater
contamination. In-situ bioremediation, hereon referred to as bioremediation, is an enhanced
biological treatment process whereby a carbohydrate solution is injected into a shallow
aquifer to enhance natural biological activity and ultimately reduce the concentration of
VOCs.13
At the Romic facility, a mixture of cheese whey and molasses was pumped into
shallow groundwater wells around the site. Other remedial options considered by US EPA
were a hybrid remedy, which included both bioremediation and pump-and-treat, and a no-
action alternative. Alternative 1, the no-action alternative, is required to be considered for all
remedies, but is not analyzed in this study. The remaining three remedial alternatives are
further described below:
- Alternative 2 (Hybrid): Combination of bioremediation and pump-and-treat.
o 30 year completion time
- Alternative 3 (Bioremediation) – Injects cheese whey and molasses into shallow
aquifer. Encourages natural biodegradation of VOCs
12
Romic Environmental Technologies, East Palo Alto, California. US EPA Region 9: Waste Programs.
http://www.epa.gov/region9/waste/romic-eastpaloalto/. 2011
13 Resource Conservation and Recovery Act. US EPA Laws and Regulations.
http://www.epa.gov/regulations/laws/rcra.html. 2011

Nguyen 13
o 10 year completion time
- Alternative 4 (Pump-and-Treat) – Extracts groundwater and pumps water to treatment
plant
o 40 year completion time
Pump and Treat Alternative
Pump-and-treat technology is typically selected in cleanups where there is groundwater
contamination. The remedy uses pumps to bring up polluted groundwater to the surface where it
can be treated more easily. The extraction system is equipped with several pumps that are used to
divert water into a preliminary holding tank and then to a treatment system for cleaning. At these
treatment plants, the contaminants are either destroyed or removed for proper disposal. The
cleaned water is eventually pumped back into the ground, sewer, or pond to replenish the water
table.14
The goal of pump-and-treat is to contain contamination and restore an aquifer to
beneficial use.
Due to the nature of contamination, pump-and-treat remedies are required to operate for
prolonged periods of time and can last several decades. Successful cleanup of the groundwater
contamination at Romic using solely pump-and-treat is expected to take 40 years. As a result,
operation of a pump-and-treat system can contribute significantly to the environmental footprint
of a remedy.
Bioremediation
Bioremediation of VOCs requires a sufficient population of microorganisms to degrade
contaminants over a prolonged period of time. At the site, the remedy proposes to inject a
mixture of cheese whey, molasses, and freshwater into the shallow aquifer. Unlike pump-and-
treat, bioremediation treats the contamination below the surface and does not require pumps for
extraction. Injecting the mixture into the aquifer enhances the natural breakdown of the
contaminants. The cheese whey and molasses mixture acts as a food source for microbes that live
in the subsurface. These microbes break down the VOCs, cheese whey, and molasses into carbon
14
Pump and Treat Remediation for Groundwater Remediation. US EPA OSWER.
http://www.epa.gov/superfund/health/conmedia/gwdocs/pum_tre.htm. 2011

Nguyen 14
dioxide, water, and salt. The estimated treatment time for the remedy is expected to take 10 years
to complete.
Hybrid Alternative
The hybrid alternative is a combination of both bioremediation and pump-and-treat technology.
Part of the subsurface contamination will be addressed by treating the groundwater at a
treatment plant, while other sections of the plume will be treated using bioremediation. This
alternative is expected to take 30 years to complete.
Methods
The following study was conducted after bioremediation was chosen as the preferred remedy at
Romic. As preliminary remedy implementation began in 2002, the results of this study are
independent of any decisions made during the remedy selection process. Deployment of
bioremediation is currently in the design phase and has not been fully implemented as of the
preparation of this report.
Accounting for the impacts of remediation requires a methodology to quantify environmental
releases. By analyzing all stages of remediation from raw material extraction, material
acquisition, manufacturing, operation and maintenance, and decommissioning, a standardized
range of environmental impacts can be quantified and compared for each alternative. As such,
three streamlined LCAs will be conducted for this study. The LCAs will be conducted using
GaBi, an LCA software developed by PE International.
Since remedial design information is not publicly available for the site, the study uses
information derived from a preliminary footprint report published by the US EPA. The report
includes conceptualized design information and assumptions regarding operation and
management of the three treatment alternatives. This data was provided by both the agency and
the remedial action team, which oversees all treatment operations at the site. The information
will be used to develop LCI data to estimate the amount of resources and raw materials required
for each unit process.
Aside from the data sources listed above, a data request was sent to the US EPA Waste
Management Office. The data request solicited information on all materials and quantities of

Nguyen 15
materials used for bioremediation, pump-and-treat, and the hybrid alternative. Although much
of the information was supplemented by the initial footprint assessment, specific information for
each remedial alternative was necessary to quantify inputs and outputs associated with each
proposed technology. The data gathered included the number of injection and extraction wells
on-site, estimates regarding the amount of soil to be excavated, quantities of cheese whey and
molasses injected into the wells, volume of groundwater extracted, and various processes
involved in wastewater treatment. As the quality of an LCA is heavily dependent on the quality
of the data, the level of detail of this information and the assumptions can significantly alter the
environmental footprint of an alternative. Other information gathered from US EPA’s report
includes design information regarding the water extraction process, specific data on the air
stripper used in pump-and-treat, and the quantities of granular activated carbon (GAC) expected
to be used.
Using this information, LCI data was generated and collected for the three remedial alternatives.
When applicable, localized LCI datasets were used in the analysis. As LCI data for many unit
processes are available in many countries, US datasets were chosen to provide for a more
accurate analysis. The data will be used to assess all on-site activities, transportation, non-
transportation off-site activities, as well as the major remedial components in each alternative.
This includes information gathered from the RI phase and a potential decommissioning or waste
scenario. Thus, the LCI databases developed for each process contains information pertaining to
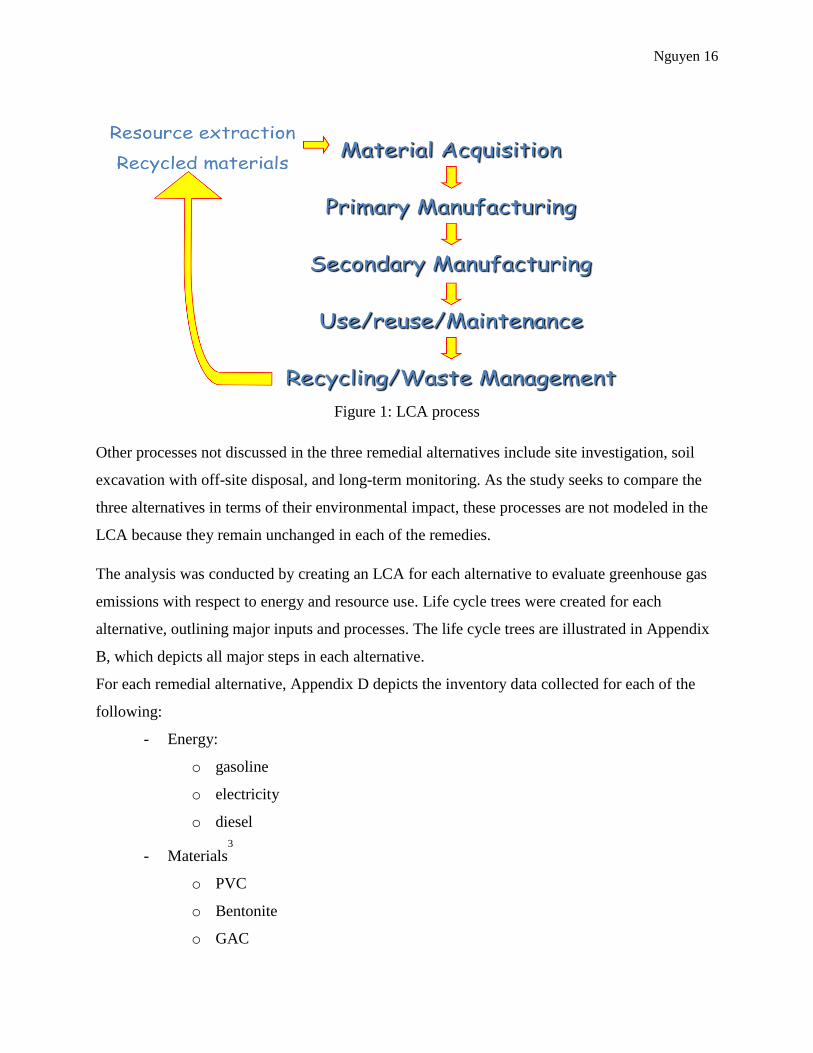
energy usage, materials usage, and services on or off-site. Figure 1 depicts the “cradle-to-
grave” thought process used in conducting an LCA, starting with resource extraction to eventual
waste management. In certain cases, the waste management scenario phase includes a recycling
scenario, whereby the lifecycle of a product can be extended.
Nguyen 16
Figure 1: LCA process
Other processes not discussed in the three remedial alternatives include site investigation, soil
excavation with off-site disposal, and long-term monitoring. As the study seeks to compare the
three alternatives in terms of their environmental impact, these processes are not modeled in the
LCA because they remain unchanged in each of the remedies.
The analysis was conducted by creating an LCA for each alternative to evaluate greenhouse gas
emissions with respect to energy and resource use. Life cycle trees were created for each
alternative, outlining major inputs and processes. The life cycle trees are illustrated in Appendix
B, which depicts all major steps in each alternative.
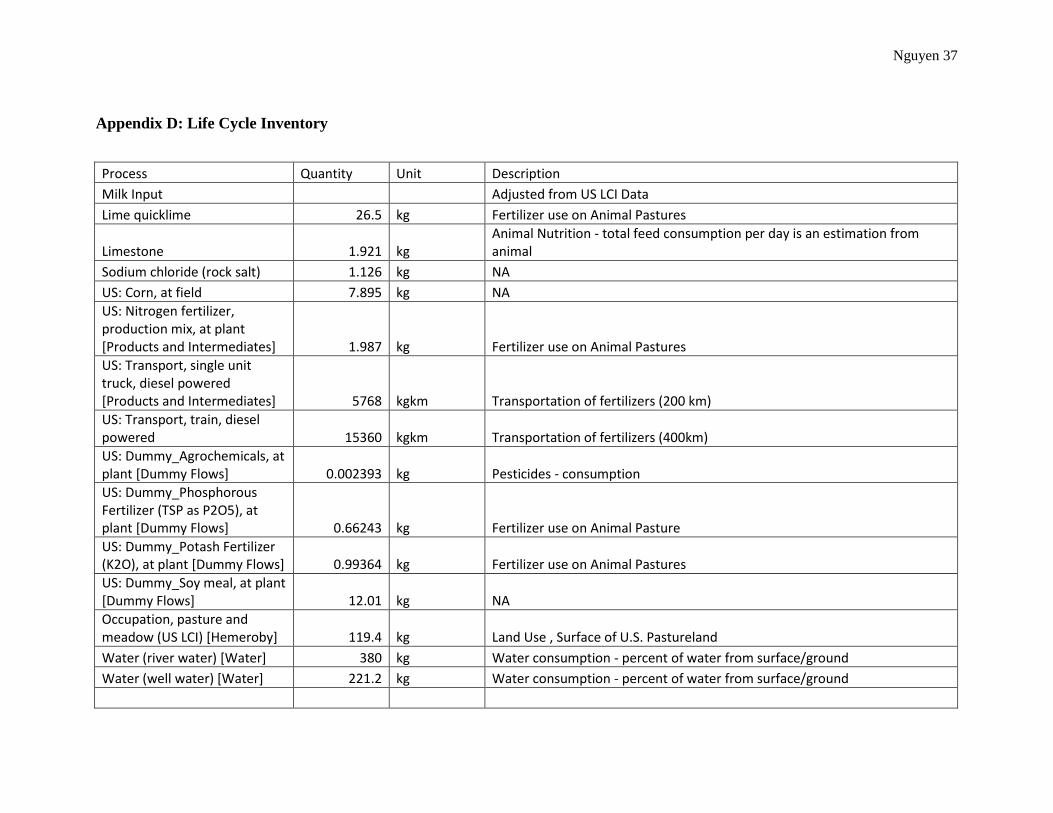
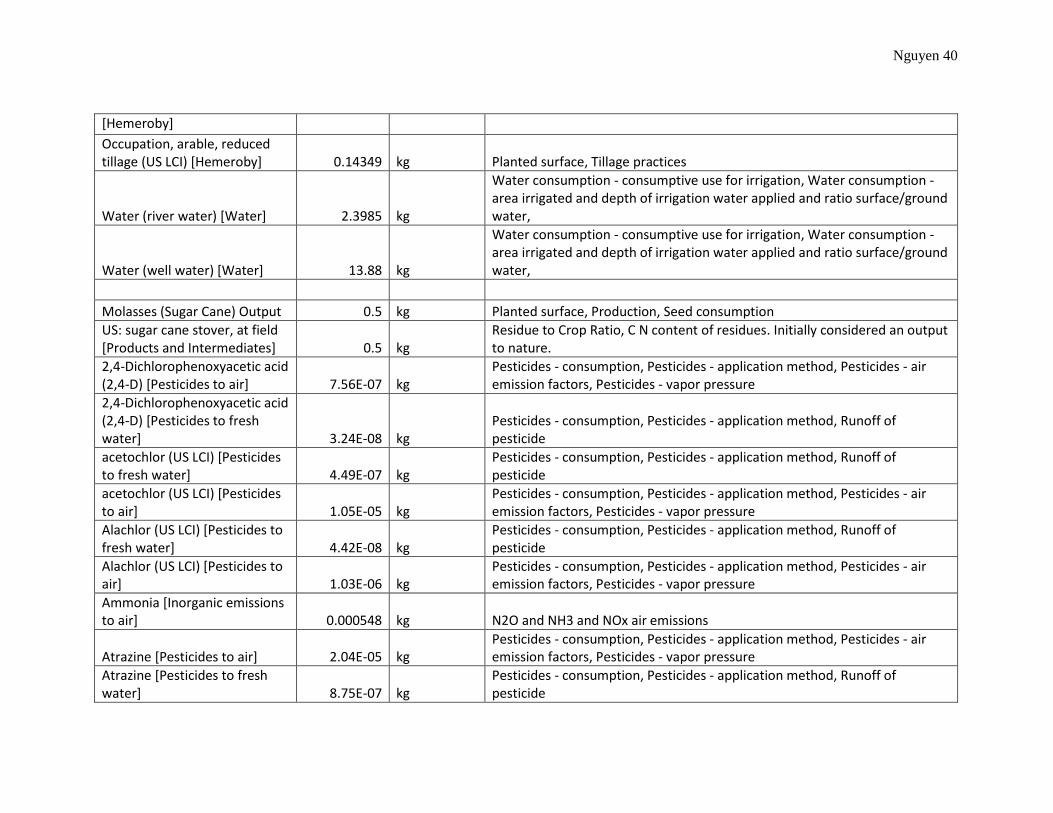
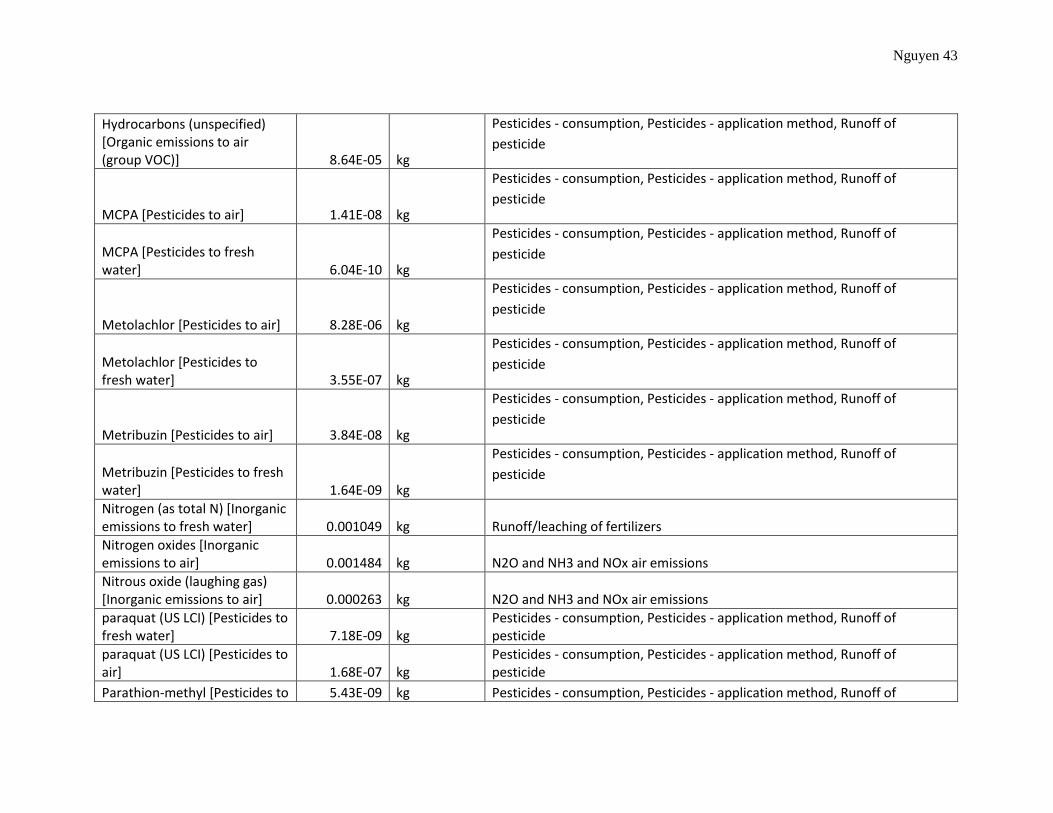
For each remedial alternative, Appendix D depicts the inventory data collected for each of the
following:
- Energy:
o gasoline
o electricity
o diesel
- Materials3
o PVC
o Bentonite
o GAC

Nguyen 17
o Molasses
o Cheese whey
o Portland Cement
- Water
- Off-site services
o Solid waste disposal
o Hazardous waste disposal
o Water treatment
The items listed above are expected to contribute to the environmental footprint for each
alternative. However, this list is not exhaustive of all processes involved in the LCAs. The list
reflects larger processes that are expected to significantly impact the study. Publicly available
LCI data used for this study as well as the LCI data created can be found in Appendix C.
The parameters were analyzed using several assessment methodologies, including the Tool for
the Reduction and Assessment of Chemical and Other Environmental Impacts (TRACI). TRACI
was developed specifically for assessments in the United States, measuring a variety of impact
categories not limited to global warming potential (GWP), acidification, eutrophication, and
respiratory effects. The study looked at TRACI’s global warming impact category, which can be
used to quantify greenhouse gas emissions. This category includes carbon dioxide, methane, and
nitrous oxide.15
Results
Using the data collected and available LCI databases, three LCAs were conducted to evaluate the
total amount of greenhouse gas emissions for each alternative. The results are outlined in tables
and charts below.
The results are displayed in carbon dioxide equivalents (CO2), which is used as a proxy for all
global greenhouse gas emissions including methane and nitrous oxides. The amount of CO2 is
15
Tool for the Reduction and Assessment of Chemical and Other Environmental Impacts (TRACI). US EPA
Systems Analysis Research. http://www.epa.gov/nrmrl/std/sab/traci/. 2011

Nguyen 18
presented in tons, which was obtained by multiplying the mass and the global warming potential
of the gas.
Table 1: Greenhouse Gas Emissions from Remedies
Treatment Alternative CO2 Equivalents Emitted (tons)
Pump-and-Treat 22,586
Bioremediation 5,435
Hybrid 11,281
As seen in Table 1, implementation of the pump-and-treat alternative would emit 22,586 tons of
CO2 into the atmosphere. Bioremediation would contribute 5,435 tons of CO2 and the hybrid
alternative would release 11,281 tons of CO2 over the course of its lifetime. Based on these
results, bioremediation results in the least impact to the environment.
Figure 3: Comparison of alternatives
Comparatively, bioremediation emits roughly 24 percent of the amount of CO2 as pump-and-
treat. The hybrid alternative emits approximately 50 percent of the amount of CO2 as pump-and-
treat.
0
5,000
10,000
15,000
20,000
25,000
Pump-and-Treat Bioremediation Hybrid
Comparison of CO2 Emissions from Alternatives (tons)

Nguyen 19
While the pump-and-treat alternative would release the greatest amount of greenhouse gases into
the atmosphere, the contributing processes can be analyzed individually to determine where the
highest emissions would result. As shown in Table 2, the granular activated carbon used in the
filtration process accounts for a majority of the CO2 emissions in the remedy.
Table 2: Greenhouse Gas Emissions from Major Pump-and-Treat
Processes
Process CO2 Equivalents Emitted (tons)
Granular activated carbon (GAC) 9,777
Water treatment 4,931
Electricity 3,814
Diesel 986
GAC alone accounted for 43 percent of the CO2 emissions in the pump-and-treat alternative.
Aside from the footprint generated from GAC, water treatment, electricity, and diesel, emissions
from materials use and manufacture also contributed to the overall remedy footprint. However,
their emissions were negligible compared to the four main processes presented in Table 2.
Figure 4: Major emissions from pump-and-treat alternative
0
2,000
4,000
6,000
8,000
10,000
GAC Water treatment
Electricity Diesel
CO2 Emissions from Major Contributing Processes in Pump-and-Treat (tons)
Nguyen 20
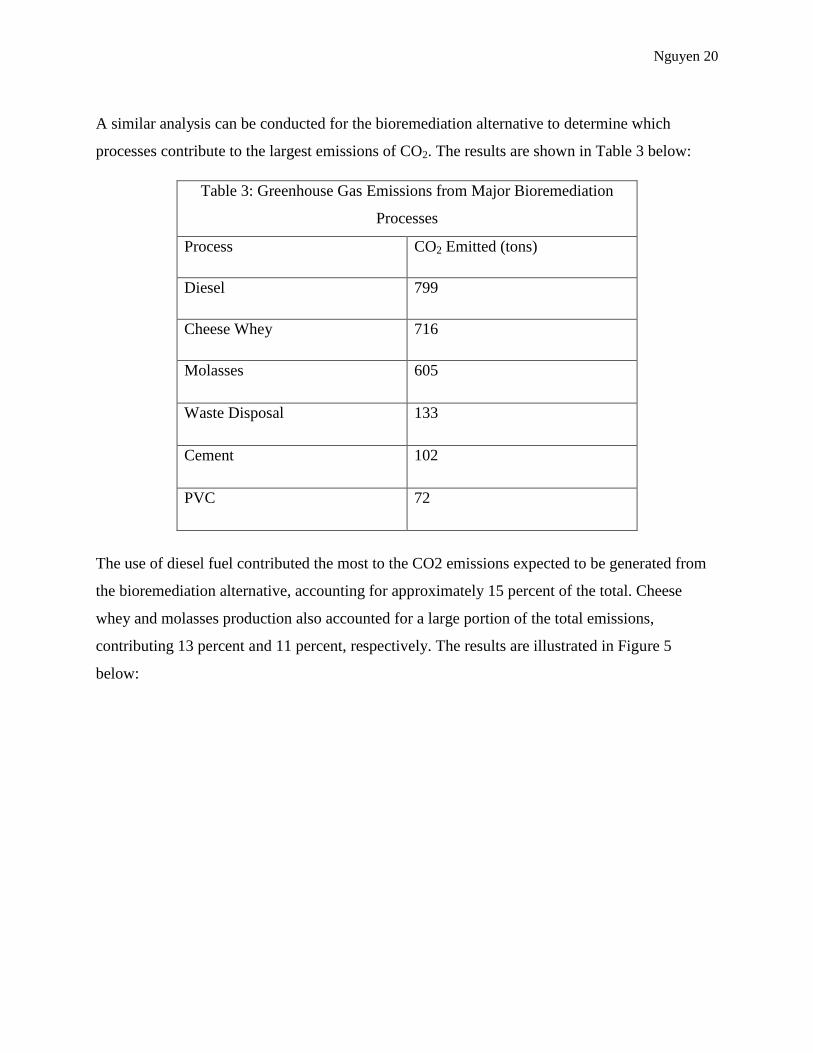
A similar analysis can be conducted for the bioremediation alternative to determine which
processes contribute to the largest emissions of CO2. The results are shown in Table 3 below:
Table 3: Greenhouse Gas Emissions from Major Bioremediation
Processes
Process CO2 Emitted (tons)
Diesel 799
Cheese Whey 716
Molasses 605
Waste Disposal 133
Cement 102
PVC 72
The use of diesel fuel contributed the most to the CO2 emissions expected to be generated from
the bioremediation alternative, accounting for approximately 15 percent of the total. Cheese
whey and molasses production also accounted for a large portion of the total emissions,
contributing 13 percent and 11 percent, respectively. The results are illustrated in Figure 5
below:

Nguyen 21
Figure 5: Major emissions from bioremediation alternative
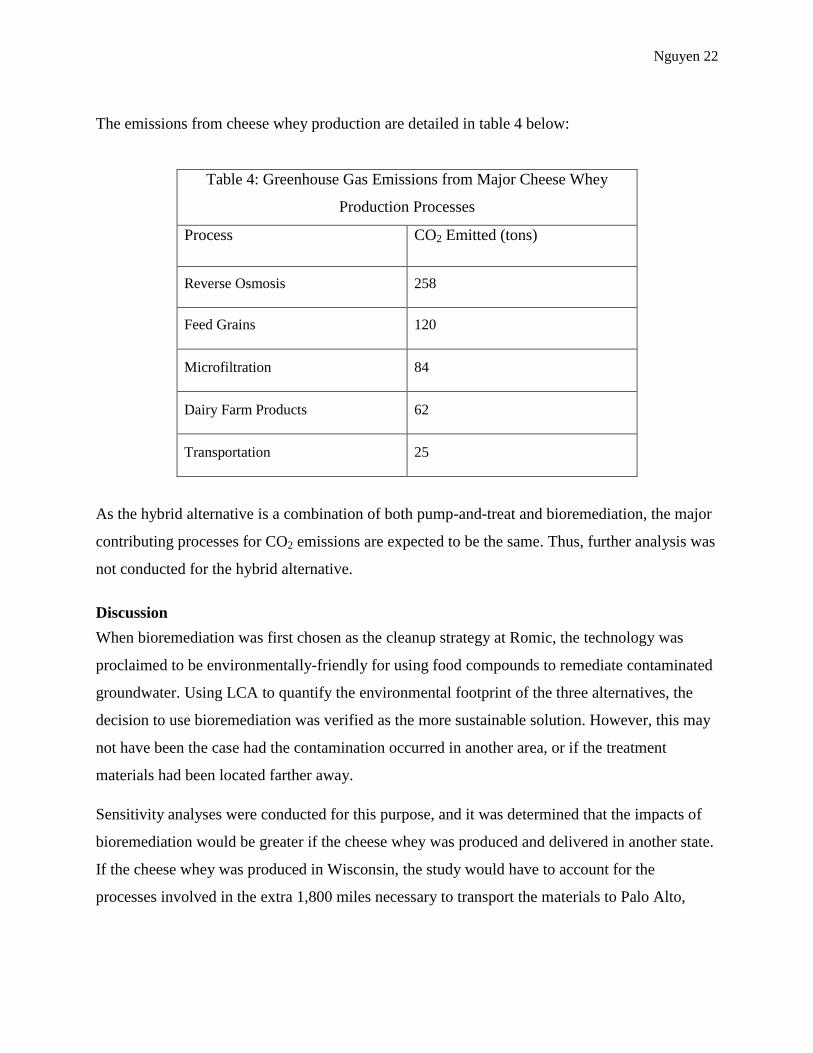
The intermediate steps for cheese whey production can also be optimized using LCA. As seen in
Figure 6, reverse osmosis is responsible for a majority of the greenhouse gas emissions, which is
followed by feed grain production, microfiltration, and dairy farm operations.
Figure 6: Major emissions from cheese whey production
0
100
200
300
400
500
600
700
800
Diesel Cheese Whey
Molasses Waste Disposal
Cement PVC
CO2 Emissions from Major Contributing Processes in Bioremediation (tons)
050
100150200250300
CO2 Emissions from Cheese Whey Production (tons)
Nguyen 22
The emissions from cheese whey production are detailed in table 4 below:
Table 4: Greenhouse Gas Emissions from Major Cheese Whey
Production Processes
Process CO2 Emitted (tons)
Reverse Osmosis 258
Feed Grains 120
Microfiltration 84
Dairy Farm Products 62
Transportation 25
As the hybrid alternative is a combination of both pump-and-treat and bioremediation, the major
contributing processes for CO2 emissions are expected to be the same. Thus, further analysis was
not conducted for the hybrid alternative.
Discussion
When bioremediation was first chosen as the cleanup strategy at Romic, the technology was
proclaimed to be environmentally-friendly for using food compounds to remediate contaminated
groundwater. Using LCA to quantify the environmental footprint of the three alternatives, the
decision to use bioremediation was verified as the more sustainable solution. However, this may
not have been the case had the contamination occurred in another area, or if the treatment
materials had been located farther away.
Sensitivity analyses were conducted for this purpose, and it was determined that the impacts of
bioremediation would be greater if the cheese whey was produced and delivered in another state.
If the cheese whey was produced in Wisconsin, the study would have to account for the
processes involved in the extra 1,800 miles necessary to transport the materials to Palo Alto,

Nguyen 23
California. Figure 7 depicts a revised comparison of the alternatives under the assumption that
cheese whey was transported from a dairy farm in Wisconsin.
Figure 7: Sensitivity analysis adjusted for bioremediation
The remediation at the Romic facility benefitted from the acquisition of cheese whey from a
local dairy in California to conduct bioremediation. However, an emissions scenario similar to
Figure 3 would be more realistic as the remedy is expected to take 10 years to complete, and it is
unclear how long the facility will be given localized shipments of cheese whey.
Conversely, future studies may benefit from substituting molasses and cheese whey with other
carbohydrates. As molasses production in the US is mainly relegated to South Florida, the
footprint created from molasses is largely attributed to transportation.16
Thus, decision-makers
looking to implement bioremediation should make an effort to use carbohydrates from sources
closer to the contaminated site to reduce the overall environmental impact.
For pump-and-treat remediation, GAC contributed significantly to the amount of greenhouse
gases emitted. Derived from charcoal, GAC is extremely porous and has a large surface area that
16
Bioactive Materials for Sustainable Soil Management. Organics and Sustainability.
http://www.bfa.com.au/Portals/0/BFAFiles/AUT05-bioactive-materials.pdf. 2005
0
5,000
10,000
15,000
20,000
25,000
Pump-and-Treat Bioremediation Hybrid
Comparison of CO2 Emissions from Alternatives (tons)
Nguyen 24
is used for adsorption and water treatment.17
However, the initial process of making charcoal is
extremely energy intensive, and the subsequent activation of charcoal to create activated carbon
releases even larger amounts of GHGs into the atmosphere. While there are several ways to
make activated carbon including physical reactivation and chemical activation, no data was
available specifying the type of GAC used at the Romic facility. If the GAC used on-site utilized
chemical activation, the emissions footprint for pump-and-treat would be lower because
chemical activation uses lower temperatures and requires less time to activate compared to
physical reactivation.18
Accounting for the possibility that the GAC was chemically activated,
the footprint from pump-and-treat would decrease by approximately 500 tons. Compared to
bioremediation, this change is negligible in terms of overall greenhouse gas emissions and would
not impact the final result.
Other methods to optimize pump-and-treat should consider replacing GAC with a more
sustainable filtration system, or use renewable energy for the water treatment process.
Implementation of renewable energy is already being considered by the Superfund program, and
the US EPA has goals to maximize use of renewable energy in all processes and site operations
as part of its Superfund Green Remediation Strategy.19
The use of renewable energy for pump-
and-treat may reduce reliance on fossil-fuel based energy, and result in a smaller environmental
footprint.
Fuel use should also be considered for three alternatives. While switching to alternative fuels or
alternative fuel vehicles will result in decreased emissions, all three alternatives will benefit from
this decision. Thus, the use of alternative fuels will not make any one alternative more
environmentally-friendly than the other. However, this is an area where additional sustainability
benefits can be achieved and will ultimately contribute to all remediation strategies.
17
Granular Activated Carbon. Green Facts: Facts on Health and the Environment.
http://www.greenfacts.org/glossary/ghi/granular-activated-carbon.htm. 2011
18 Ibid
19 Superfund Green Remediation Strategy. US EPA Superfund. http://www.epa.gov/superfund/greenremediation/sf-
gr-strategy.pdf. 2010

Nguyen 25
LCA provides decision-makers with quantifiable information that can be used to determine how
to minimize an alternative’s footprint during the RI and FS phase, as well as the remedial design
phase. As demonstrated with this study, LCA was used to quantify an alternative’s
environmental impact, and identify which processes contributed the most to overall greenhouse
gas emissions. By performing LCA prior to implementing a remedy at a site, decision-makers
can ensure that the greenest remedy is being performed. Furthermore, LCA can also be used to
update existing operations where remedies are currently being conducted. As technology and
science changes, pre-planned actions or processes may no longer be optimal to remediate the
contamination. Thus, LCA should be considered for all cleanups in order to provide maximum
protection of public health and the environment
Conclusion
Based on the results of this study, the footprint created from bioremediation is significantly less
than the footprint generated from traditional pump-and-treat remediation. While it is not
expected that bioremediation will be the least impactful alternative in other assessment
categories, it can be assumed that the overall environmental footprint of implementing green
remediation will be less. As global greenhouse emissions for bioremediation were attributed
mainly to transportation, cheese whey, and molasses, project managers and decision-makers can
target these processes to optimize the remedy. Similarly, pump-and-treat can be optimized by
finding substitutes for GAC, or implementing renewable energy at treatment plants. Without
using LCA, it would be difficult to target these processes and demonstrate the benefits associated
with switching to more sustainable processes. Thus, US EPA should start implementing LCA
and greener remediation techniques nationally. Using the tool for all cleanups will reduce a
remedy’s environmental impact and subsequently provide for a more sustainable future.
Nguyen 26
Works Cited
Bioactive Materials for Sustainable Soil Management. Organics and Sustainability.
http://www.bfa.com.au/Portals/0/BFAFiles/AUT05-bioactive-materials.pdf. 2005
Building LCA. GaBi Software PE International. http://www.gabi- software.com/solutions/
building-lca/. 2011
CERCLA Overview. US EPA Superfund. http://www.epa.gov/superfund/policy/cercla.htm. 2011
Executive Order 13514: Federal Leadership in Environmental, Energy, and Economic
Performance. The White House. http://www.whitehouse.gov/assets/documents/
2009fedleader_eo_rel.pdf. 2009
Granular Activated Carbon. Green Facts: Facts on Health and the Environment.
http://www.greenfacts.org/glossary/ghi/granular-activated-carbon.htm. 2011
Green Cleanup Standard. CLU-IN EPA Green Remediation Focus. http://www.clu-
in.org/greenremediation/subtab_b5.cfm. 2011
Marcus, Michael. Public Knowledge. http://www.publicknowledge.org/node/2024. 2009
National Priorities List. US EPA Superfund Office. http://www.epa.gov/superfund/sites/npl/.
2011
Pump and Treat Remediation for Groundwater Remediation. US EPA OSWER.
http://www.epa.gov/superfund/health/conmedia/gwdocs/pum_tre.htm. 2011
Resource Conservation and Recovery Act. US EPA Laws and Regulations.
http://www.epa.gov/regulations/laws/rcra.html. 2011
Romic Environmental Technologies, East Palo Alto, California. US EPA Region 9: Waste
Programs. http://www.epa.gov/region9/waste/romic-eastpaloalto/. 2011
Superfund and Green Remediation. US EPA Superfund Office.
http://www.epa.gov/superfund/greenremediation/. 2011
Superfund Green Remediation Strategy. US EPA Superfund.
http://www.epa.gov/superfund/greenremediation/sf-gr-strategy.pdf. 2010
Superfund Sites. US EPA. http://www.epa.gov/superfund/. 2011
Tool for the Reduction and Assessment of Chemical and Other Environmental Impacts (TRACI).
US EPA Systems Analysis Research. http://www.epa.gov/nrmrl/std/sab/traci/. 2011
Nguyen 27
Appendices
Appendix A: Acronyms
ARAR- Applicable or Relevant and Appropriate Requirements
CO2- Carbon dioxide equivalents
DTSC- Department of Toxic Substances Control
FS- Feasibility study
GAC- Granular activated carbon
GHG- Greenhouse gases
GWP- Global warming potential
ISO- International Organization for Standardization
LCA- Life cycle assessment
LCI- Life cycle inventory
NPL- National Priorities List
NREL- National Renewable Energy Laboratory
NOx- Nitrogen oxides
PM- Particulate Matter
PVC- Polyvinyl chloride
RI- Remedial investigation
SOx- Sulfur oxides
TRACI- Tool for the Reduction and Assessment of Chemical and other Environmental Impacts
US EPA- United States Environmental Protection Agency
VOCs- Volatile organic compounds

Nguyen 28
Pump-and-Treat Life Cycle Tree
Pump-and-Treat
Well Construction
PVC Pipe Bentonite Gravel Portland Cement Drill Rig
Pump-and-Treat Processes
Air StripperGranular
Activated CarbonWastewater Treatment
Water Extraction Pump
Operation and Management
Waste Scenario
Drill Cuttings Carbon (GAC)
Appendix B: Life Cycle Trees

Nguyen 29
Bioremediation Life Cycle Tree
Bioremediation
Well Construction
PVC PipePortland Cement
Gravel Bentonite Drill Rig
Operation and Management
Bioremediation Processes
Molasses Cheese Whey Water
Waste Scenario
Drill Cuttings

Nguyen 30
Hybrid Life Cycle Tree
Hybrid
Well Construction
PVC Pipe Portland Cement Gravel Bentonite Drill Rig
Operation and Management
Bioremediation Processes
Molasses Cheese Whey Water
Pump-and-Treat Processes
Air StripperGranular Activated
CarbonExtraction Pump
Wastewater Treatment
Waste Scenario
Drill Cuttings Carbon (GAC)

Nguyen 31
Appendix C: Summary Spreadsheet Data
Pump-and-Treat Alternative
Process Quantity Units
Wastewater Treatment Plant Duration 40 yrs
Flow Rate 130 gpm
Total Extraction 2733120000 gallon
Operation/Maintenance Operation 1 visit/wk
Total Visits 2080 days
Water Treatment Electricity Pumps 31536 kwh/yr
Air Stripper 118260 kwh/yr
GAC heater 70956 kwh/yr
Fuel Use Diesel (on-site) 4639.4163 gal
Gasoline 445.2 gal
Diesel (off-site) 52570.983 gal
Gasoline (off-site) 24081.2 gal
Electricity 7619.44 mwh
Materials PVC 1.65 tons
Gravel 5636.7 tons
Cement 26.45 tons
Bentonite 0.3 tons
GAC 4180 tons
Extraction Well Logistics Zone A (20 feet depth) 10 wells
Zone B (50 feet depth) 8 wells
Zone C (80 feet depth) 4 wells
Materials distance from site GAC 600 miles
PVC 500 miles

Nguyen 32
Gravel 50 miles
Cement 50 miles
Bentonite 50 miles
Molasses 2400 miles
Cheese Whey 752 miles
Waste Disposal 50 miles
Well construction Construction 60 days
Total Electricity Extraction Pump 31536 kwh/yr
Transfer Pump 23652 kwh/yr
Air Stripper 788840 kwh/yr
GAC Process Heat 47304 kwh/yr
Decommissioning Cement 4.1 tons
Water for Cement 523 gallons
Gasoline-miles Traveled Site Investigation 1432 miles
Demolition 1592 miles
Excavation 414 miles
Capping 1066 miles
Extraction Well Install 9760 miles
Treatment Plant Construction 2760 miles
Operation/Management 205120 miles
Groundwater Management 14784 miles
Decommission 2880 miles
Diesel-miles Traveled Site Investigation 350 miles
Demolition 100 miles
Excavation 150 miles
Capping 100 miles
Extraction Well Instal 400 miles
Total Electricity (onsite) 7600 mwh
Nguyen 33
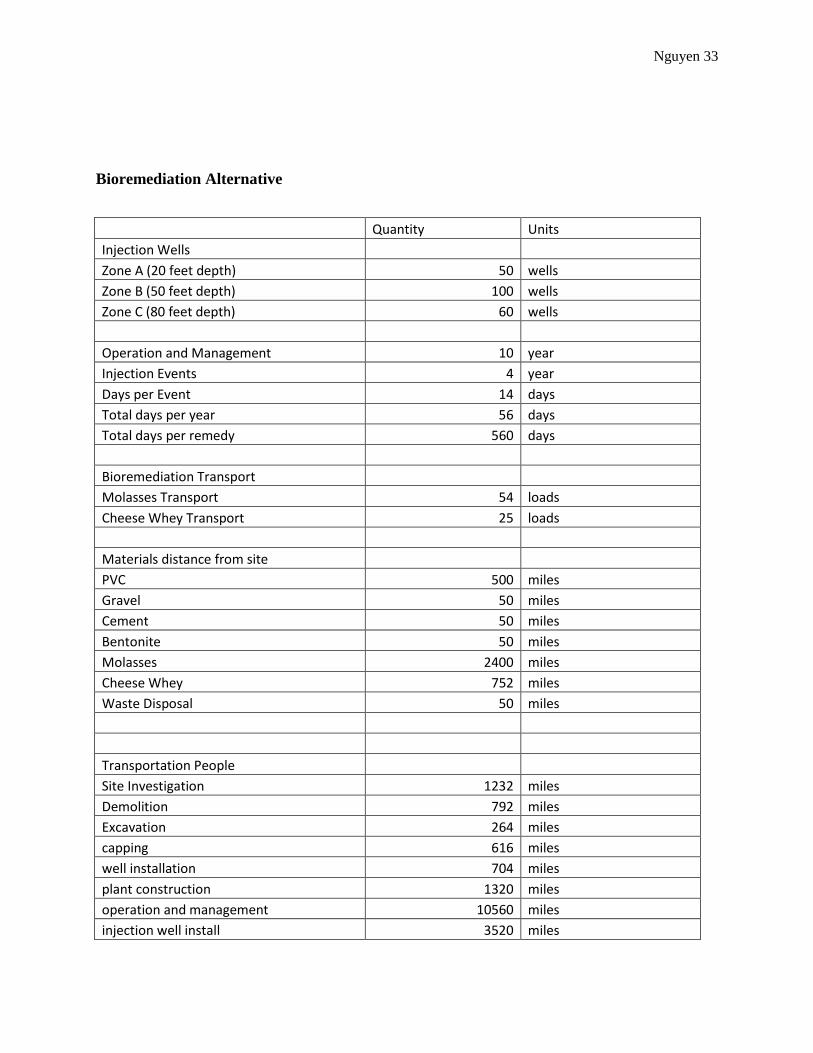
Bioremediation Alternative
Quantity Units
Injection Wells Zone A (20 feet depth) 50 wells
Zone B (50 feet depth) 100 wells
Zone C (80 feet depth) 60 wells
Operation and Management 10 year
Injection Events 4 year
Days per Event 14 days
Total days per year 56 days
Total days per remedy 560 days
Bioremediation Transport Molasses Transport 54 loads
Cheese Whey Transport 25 loads
Materials distance from site PVC 500 miles
Gravel 50 miles
Cement 50 miles
Bentonite 50 miles
Molasses 2400 miles
Cheese Whey 752 miles
Waste Disposal 50 miles
Transportation People Site Investigation 1232 miles
Demolition 792 miles
Excavation 264 miles
capping 616 miles
well installation 704 miles
plant construction 1320 miles
operation and management 10560 miles
injection well install 3520 miles

Nguyen 34
bioremediation op and m 49280 miles
decommission 880 miles
Transportation Materials PVC 2000 miles
Gravel 282375 miles
Bentonite 30 miles
Cement 3560 miles
Molasses 2594640 miles
Cheese Whey 373819.2 miles
Drilling Rig Fuel Drilling Rig Diesel Consumption 126000 gallons
Electricity Use Electricity (on-site) 2200 mwh
Water Use Water 5671000 gallons
injected water 23000 gallons
Waste Scenario Waste (non-hazardous) 505,000 tons
Recycling Materials 6280 tons
Drill Cuttings Waste 149.6 tons
Materials Use PVC 4.6645 tons
Gravel 5651 tons
Bentonite 1 tons
Cement 82 tons
Water for Cement 8540 tons
Cheese Whey 600.48 tons
Molasses 1306.044 tons
Decommissioning Cement 14.7 tons
Water for Cement 1877 gallons
Operation/Management Decom 60 days
Travel Decom 880 miles

Nguyen 35
Electricity total electricity (onsite) 13 mwh
total electricity (offsite) 590 mwh
Electricity use lifetime 13440 kwh
Transportation Miles Truck Trips (gasoline) 114,828 miles
Truck trips (diesel) 700,000 miles
Fuel Use Gasoline (onsite) 127.2 gallons
Gasoline (offsite) 11483 gallons
Diesel (onsite) 10299 gallons
Diesel (offsite) 63357 gallons
Hybrid Alternative
Operation/Maintenance Operation 1 visit/wk
Total Visits 2080 days
Water Treatment Electricity Pumps 31536 kwh/yr
Air Stripper 118260 kwh/yr
GAC heater 70956 kwh/yr
Fuel Use Diesel (on-site) 4639.4163 gal
Gasoline 445.2 gal
Diesel (off-site) 52570.983 gal
Gasoline (off-site) 24081.2 gal
Materials Use GAC 783 tons
PVC 4 tons
Gravel 5636.7 tons
Cement 71 tons
Bentonite 1 tons
Molasses 1081.1 tons
Cheese Whey 497.05 tons
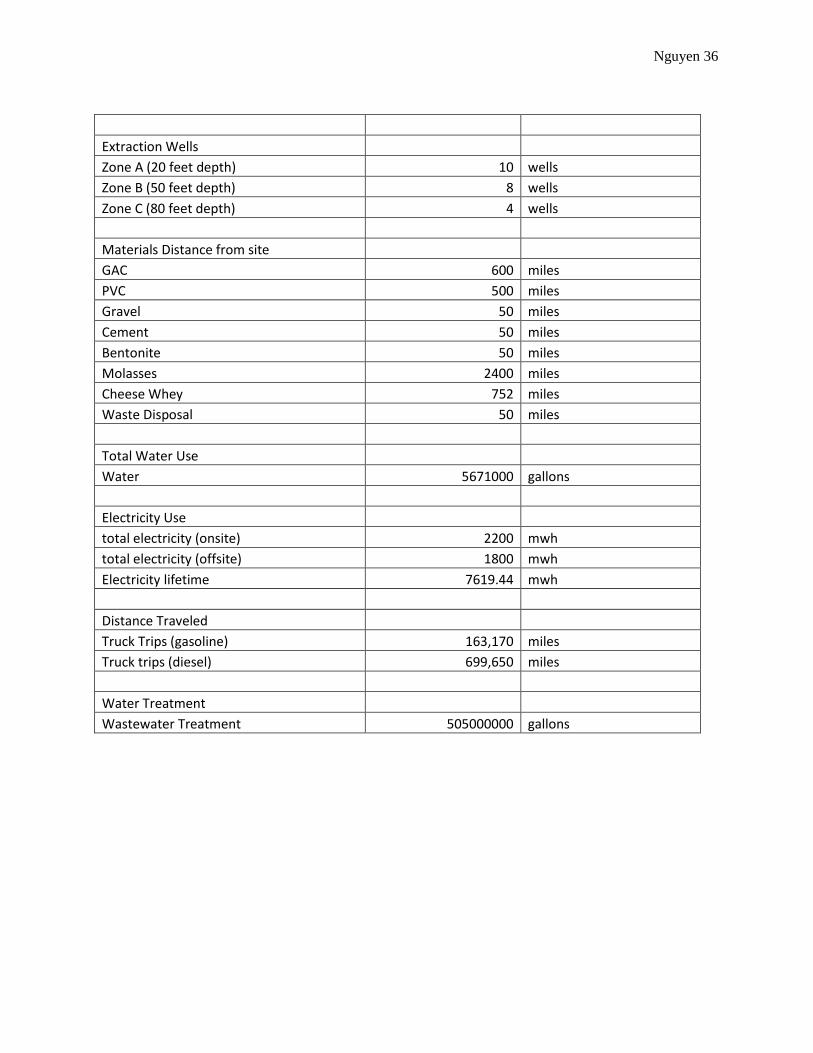
Nguyen 36
Extraction Wells Zone A (20 feet depth) 10 wells
Zone B (50 feet depth) 8 wells
Zone C (80 feet depth) 4 wells
Materials Distance from site GAC 600 miles
PVC 500 miles
Gravel 50 miles
Cement 50 miles
Bentonite 50 miles
Molasses 2400 miles
Cheese Whey 752 miles
Waste Disposal 50 miles
Total Water Use Water 5671000 gallons
Electricity Use total electricity (onsite) 2200 mwh
total electricity (offsite) 1800 mwh
Electricity lifetime 7619.44 mwh
Distance Traveled Truck Trips (gasoline) 163,170 miles
Truck trips (diesel) 699,650 miles
Water Treatment Wastewater Treatment 505000000 gallons
Nguyen 37
Appendix D: Life Cycle Inventory
Process Quantity Unit Description
Milk Input
Adjusted from US LCI Data
Lime quicklime 26.5 kg Fertilizer use on Animal Pastures
Limestone 1.921 kg Animal Nutrition - total feed consumption per day is an estimation from animal
Sodium chloride (rock salt) 1.126 kg NA
US: Corn, at field 7.895 kg NA
US: Nitrogen fertilizer, production mix, at plant [Products and Intermediates] 1.987 kg Fertilizer use on Animal Pastures
US: Transport, single unit truck, diesel powered [Products and Intermediates] 5768 kgkm Transportation of fertilizers (200 km)
US: Transport, train, diesel powered 15360 kgkm Transportation of fertilizers (400km)
US: Dummy_Agrochemicals, at plant [Dummy Flows] 0.002393 kg Pesticides - consumption
US: Dummy_Phosphorous Fertilizer (TSP as P2O5), at plant [Dummy Flows] 0.66243 kg Fertilizer use on Animal Pasture
US: Dummy_Potash Fertilizer (K2O), at plant [Dummy Flows] 0.99364 kg Fertilizer use on Animal Pastures
US: Dummy_Soy meal, at plant [Dummy Flows] 12.01 kg NA
Occupation, pasture and meadow (US LCI) [Hemeroby] 119.4 kg Land Use , Surface of U.S. Pastureland
Water (river water) [Water] 380 kg Water consumption - percent of water from surface/ground
Water (well water) [Water] 221.2 kg Water consumption - percent of water from surface/ground

Nguyen 38
Milk Output 1 kg Solids (suspended) [Particles
to fresh water] 236.8 kg Erosion
Phosphorus [Inorganic emissions to fresh water] 0.014255 kg Animal manure - N P composition, Runoff/leachate of fertilizers
Nitrous oxide (laughing gas) [Inorganic emissions to air] 0.11436 kg
Air emissions of N20 and CH4 from manure management, air emissions of NH3 and NOx and N2O from Fertilizer Application and Mature management
Nitrogen oxides [Inorganic emissions to air] 1.115 kg
Air emissions of NH3 and NOx and N2O from Fertilizer Application and Mature management
Nitrogen (as total N) [Inorganic emissions to fresh water] 0.64679 kg Animal manure - N P composition, Runoff/leachate of fertilizers
Methane [Organic emissions to air (group VOC)] 2403 kg
Enteric fermentation air emissions of N20 and CH4 from manure management
Ammonia [Inorganic emissions to air] 0.4122 kg
Air emissions of NH3 and NOx and N2O from Fertilizer Application and Mature management
2,4-Dichlorophenoxyacetic acid (2,4-D) [Pesticides to air] 0.000667 kg
Pesticides - consumption, Pesticides - application method - 100% surface application, 0% soil incorporation is PwC assumption similar to corn/wheat/soybeans/cotton, Pesticides - air emission factors
2,4-Dichlorophenoxyacetic acid (2,4-D) [Pesticides to fresh water] 2.86E-05 kg
Pesticides - consumption, Pesticides - application method - 100% surface application, 0% soil incorporation is PwC assumption similar to corn/wheat/soybeans/cotton, Runoff of pesticide
Quantity Unit Description
Sugar Cane Input
Adjusted from US LCI
Lime quicklime (lumpy) [Minerals] 0.015248 kg Fertilizers Ca
Power [Electric power] 0.021992 MJ Energy consumption
US: Diesel, combusted in industrial equipment [Products 3.43E-06 m3 Farm Tractor. Energy consumption

Nguyen 39
and Intermediates]
US: Gasoline, combusted in equipment [Products and Intermediates] 9.41E-07 m3 Farm tractor. Energy consumption
US: Liquefied petroleum gas, combusted in industrial boiler [Products and Intermediates] 2.44E-06 m3
Energy consumption. Was initially reported as MJ. Converted using following factors: 50.3 MJ/kg, 1.85L/kg
US: Natural gas, combusted in industrial boiler [Products and Intermediates] 0.001525 m3
Energy consumption. Initially reported as MJ. Converted using the following factor: 38.0 MJ/m3.
US: Nitrogen fertilizer, production mix, at plant [Products and Intermediates] 0.00844 kg Fertilizers. Manure - N, P brought to the field, Manure - composition N P
US: Transport, single unit truck, diesel powered [Products and Intermediates] 8.256 kgkm Transportation of fertilizers (200 km).
US: Transport, train, diesel powered [Products and Intermediates] 21.9855 kgkm Transportation of fertilizers (400km)
US: Dummy_Agrochemicals, at plant [Dummy Flows] 0.000144 kg Pesticides - consumption
US: Dummy_Phosphorous Fertilizer (TSP as P2O5), at plant [Dummy Flows] 0.002919 kg Fertilizers
US: Dummy_Potash Fertilizer (K2O), at plant [Dummy Flows] 0.003591 kg Fertilizers
Carbon dioxide [Renewable resources] 0.747 kg Carbon fixation through plant growth
Occupation, arable, conservation tillage (US LCI) [Hemeroby] 0.21375 kg Planted surface, Tillage practices
Occupation, arable, conventional tillage (US LCI) 0.234215 kg Planted surface, Tillage practices
Nguyen 40
[Hemeroby]
Occupation, arable, reduced tillage (US LCI) [Hemeroby] 0.14349 kg Planted surface, Tillage practices
Water (river water) [Water] 2.3985 kg
Water consumption - consumptive use for irrigation, Water consumption - area irrigated and depth of irrigation water applied and ratio surface/ground water,
Water (well water) [Water] 13.88 kg
Water consumption - consumptive use for irrigation, Water consumption - area irrigated and depth of irrigation water applied and ratio surface/ground water,
Molasses (Sugar Cane) Output 0.5 kg Planted surface, Production, Seed consumption
US: sugar cane stover, at field [Products and Intermediates] 0.5 kg
Residue to Crop Ratio, C N content of residues. Initially considered an output to nature.
2,4-Dichlorophenoxyacetic acid (2,4-D) [Pesticides to air] 7.56E-07 kg
Pesticides - consumption, Pesticides - application method, Pesticides - air emission factors, Pesticides - vapor pressure
2,4-Dichlorophenoxyacetic acid (2,4-D) [Pesticides to fresh water] 3.24E-08 kg
Pesticides - consumption, Pesticides - application method, Runoff of pesticide
acetochlor (US LCI) [Pesticides to fresh water] 4.49E-07 kg
Pesticides - consumption, Pesticides - application method, Runoff of pesticide
acetochlor (US LCI) [Pesticides to air] 1.05E-05 kg
Pesticides - consumption, Pesticides - application method, Pesticides - air emission factors, Pesticides - vapor pressure
Alachlor (US LCI) [Pesticides to fresh water] 4.42E-08 kg
Pesticides - consumption, Pesticides - application method, Runoff of pesticide
Alachlor (US LCI) [Pesticides to air] 1.03E-06 kg
Pesticides - consumption, Pesticides - application method, Pesticides - air emission factors, Pesticides - vapor pressure
Ammonia [Inorganic emissions to air] 0.000548 kg N2O and NH3 and NOx air emissions
Atrazine [Pesticides to air] 2.04E-05 kg Pesticides - consumption, Pesticides - application method, Pesticides - air emission factors, Pesticides - vapor pressure
Atrazine [Pesticides to fresh water] 8.75E-07 kg
Pesticides - consumption, Pesticides - application method, Runoff of pesticide

Nguyen 41
Bentazone [Pesticides to air] 8.33E-08 kg
Pesticides - consumption, Pesticides - application method, Runoff of
pesticide
Bentazone [Pesticides to fresh water] 3.57E-09 kg
Pesticides - consumption, Pesticides - application method, Runoff of
pesticide
Bromoxynil [Halogenated organic emissions to fresh water] 4.72E-09 kg
Pesticides - consumption, Pesticides - application method, Runoff of
pesticide
Bromoxynil [Halogenated organic emissions to air] 1.83E-07 kg
Pesticides - consumption, Pesticides - application method, Runoff of
pesticide
Carbofuran [Pesticides to air] 1.56E-07 kg
Pesticides - consumption, Pesticides - application method, Runoff of
pesticide
Carbofuran [Pesticides to fresh water] 6.69E-09 kg
Pesticides - consumption, Pesticides - application method, Runoff of
pesticide
Chlorpyriphos [Pesticides to air] 1.20E-06 kg
Pesticides - consumption, Pesticides - application method, Runoff of
pesticide
Chlorpyriphos [Pesticides to fresh water] 5.15E-08 kg
Pesticides - consumption, Pesticides - application method, Runoff of
pesticide
Cyanazine [Pesticides to fresh water] 7.72E-09 kg
Pesticides - consumption, Pesticides - application method, Runoff of
pesticide
Cyanazine [Pesticides to air] 1.80E-07 kg
Pesticides - consumption, Pesticides - application method, Runoff of
pesticide
Dicamba [Pesticides to fresh water] 4.55E-08 kg
Pesticides - consumption, Pesticides - application method, Runoff of
pesticide Pesticides - consumption, Pesticides - application method, Runoff

Nguyen 42
of pesticide
Dicamba [Pesticides to air] 1.06E-06 kg
Pesticides - consumption, Pesticides - application method, Runoff of
pesticide
dimethenamid (US LCI) [Pesticides to fresh water] 1.07E-07 kg
Pesticides - consumption, Pesticides - application method, Runoff of
pesticide
dimethenamid (US LCI) [Pesticides to air] 2.51E-06 kg
Pesticides - consumption, Pesticides - application method, Runoff of
pesticide
Dipropylthiocarbamic acid S-ethyl ester (US LCI) [Other emissions to fresh water] 4.44E-08 kg
Pesticides - consumption, Pesticides - application method, Runoff of
pesticide
Dipropylthiocarbamic acid S-ethyl ester (US LCI) [Other emissions to air] 1.72E-06 kg
Pesticides - consumption, Pesticides - application method, Runoff of
pesticide
Disulfothon [Pesticides to fresh water] 2.65E-09 kg
Pesticides - consumption, Pesticides - application method, Runoff of
pesticide
Diuron [Pesticides to fresh water] 7.44E-10 kg
Pesticides - consumption, Pesticides - application method, Runoff of
pesticide
Dust (unspecified) [Particles to air] 1.73E-07 kg
Pesticides - consumption, Pesticides - application method, Runoff of
pesticide
Glyphosate [Pesticides to fresh water] 9.65E-08 kg
Pesticides - consumption, Pesticides - application method, Runoff of
pesticide
Glyphosate [Pesticides to air] 2.25E-06 kg
Pesticides - consumption, Pesticides - application method, Runoff of
pesticide
Nguyen 43
Hydrocarbons (unspecified) [Organic emissions to air (group VOC)] 8.64E-05 kg
Pesticides - consumption, Pesticides - application method, Runoff of
pesticide
MCPA [Pesticides to air] 1.41E-08 kg
Pesticides - consumption, Pesticides - application method, Runoff of
pesticide
MCPA [Pesticides to fresh water] 6.04E-10 kg
Pesticides - consumption, Pesticides - application method, Runoff of
pesticide
Metolachlor [Pesticides to air] 8.28E-06 kg
Pesticides - consumption, Pesticides - application method, Runoff of
pesticide
Metolachlor [Pesticides to fresh water] 3.55E-07 kg
Pesticides - consumption, Pesticides - application method, Runoff of
pesticide
Metribuzin [Pesticides to air] 3.84E-08 kg
Pesticides - consumption, Pesticides - application method, Runoff of
pesticide
Metribuzin [Pesticides to fresh water] 1.64E-09 kg
Pesticides - consumption, Pesticides - application method, Runoff of
pesticide
Nitrogen (as total N) [Inorganic emissions to fresh water] 0.001049 kg Runoff/leaching of fertilizers
Nitrogen oxides [Inorganic emissions to air] 0.001484 kg N2O and NH3 and NOx air emissions
Nitrous oxide (laughing gas) [Inorganic emissions to air] 0.000263 kg N2O and NH3 and NOx air emissions
paraquat (US LCI) [Pesticides to fresh water] 7.18E-09 kg
Pesticides - consumption, Pesticides - application method, Runoff of pesticide
paraquat (US LCI) [Pesticides to air] 1.68E-07 kg
Pesticides - consumption, Pesticides - application method, Runoff of pesticide
Parathion-methyl [Pesticides to 5.43E-09 kg Pesticides - consumption, Pesticides - application method, Runoff of

Nguyen 44
fresh water] pesticide
Parathion-methyl [Pesticides to air] 1.27E-07 kg
Pesticides - consumption, Pesticides - application method, Runoff of pesticide
Pendimethalin [Pesticides to fresh water] 3.69E-08 kg
Pesticides - consumption, Pesticides - application method, Runoff of pesticide
Pendimethalin (US LCI) [Pesticides to air] 8.61E-07 kg
Pesticides - consumption, Pesticides - application method, Runoff of pesticide
Permethrin [Pesticides to fresh water] 3.32E-09 kg
Pesticides - consumption, Pesticides - application method, Runoff of pesticide
Permethrin [Pesticides to air] 7.74E-08 kg Pesticides - consumption, Pesticides - application method, Runoff of pesticide
phorate (US LCI) [Pesticides to fresh water] 1.03E-09 kg
Pesticides - consumption, Pesticides - application method, Runoff of pesticide
phorate (US LCI) [Pesticides to air] 3.97E-08 kg
Pesticides - consumption, Pesticides - application method, Runoff of pesticide
Phosphorus [Inorganic emissions to fresh water] 1.90E-05 kg Runoff/leaching of fertilizers
Simazine [Pesticides to air] 5.44E-07 kg Pesticides - consumption, Pesticides - application method, Runoff of pesticide
Simazine [Pesticides to fresh water] 2.33E-08 kg
Pesticides - consumption, Pesticides - application method, Runoff of pesticide
Solids (suspended) [Particles to fresh water] 0.411015 kg Erosion
terbufos (US LCI) [Pesticides to fresh water] 3.50E-08 kg
Pesticides - consumption, Pesticides - application method, Runoff of pesticide
Terbufos (US LCI) [Pesticides to air] 1.35E-06 kg
Pesticides - consumption, Pesticides - application method, Runoff of pesticide
Process Quantity Unit Description

Nguyen 45
Portland Cement
Adjusted from US LCI
Power [Electric power] 0.519728 MJ NA
US: Bituminous coal, combusted in industrial boiler [Products and Intermediates] 0.10749 kg NA
US: Gasoline, combusted in equipment [Products and Intermediates] 1.33E-07 m3 NA
US: Liquefied petroleum gas, combusted in industrial boiler [Products and Intermediates] 1.43E-08 m3 NA
US: Natural gas, combusted in industrial boiler [Products and Intermediates] 0.005568 m3 NA
US: Residual fuel oil, combusted in industrial boiler [Products and Intermediates] 4.42E-08 m3 NA
US: Dummy_Bottom ash, unspecified origin [Dummy Flows] 0.010089 kg NA
US: Dummy_Cement bags, at plant [Dummy Flows] 0.00068 kg NA
US: Dummy_Chains, at plant [Dummy Flows] 2.01E-05 kg NA
US: Dummy_Disposal, cement kiln dust, in residual material landfill [Dummy Flows] 0.0373 kg NA
US: Dummy_Explosives, at plant [Dummy Flows] 0.000295 kg NA
US: Dummy_Filter bags, at plant [Dummy Flows] 1.92E-05 kg NA
US: Dummy_Fly ash, unspecified origin [Dummy 0.013458 kg NA
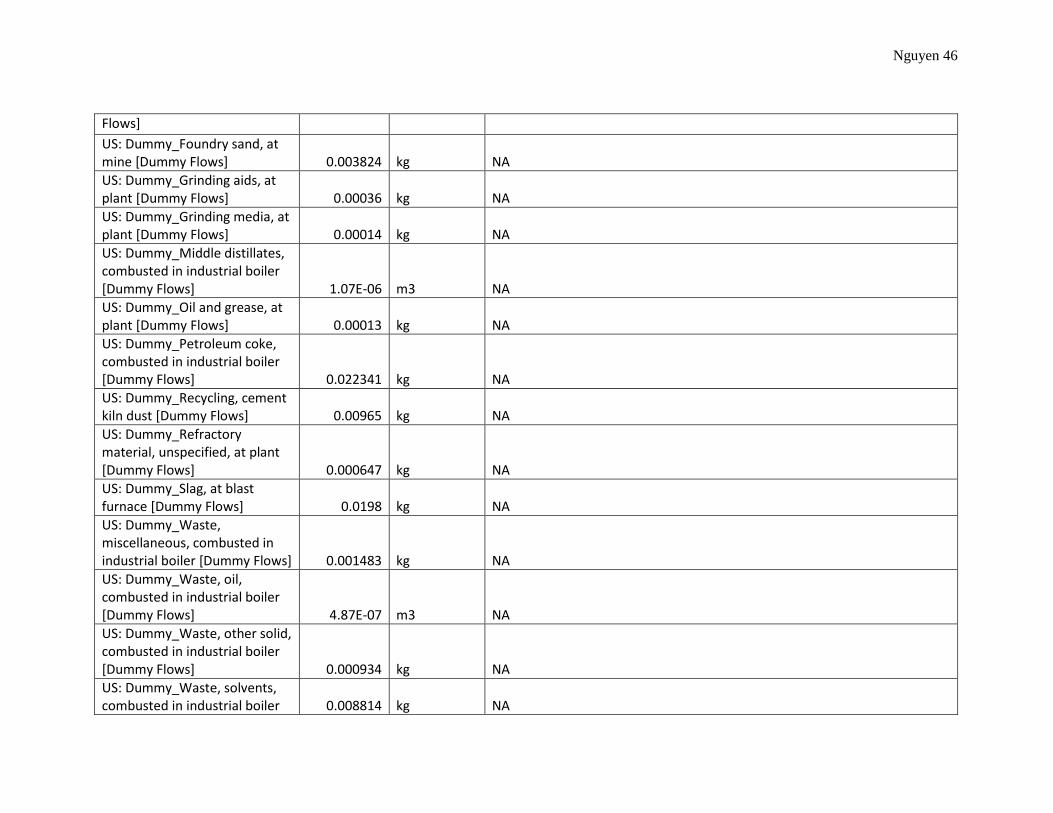
Nguyen 46
Flows]
US: Dummy_Foundry sand, at mine [Dummy Flows] 0.003824 kg NA
US: Dummy_Grinding aids, at plant [Dummy Flows] 0.00036 kg NA
US: Dummy_Grinding media, at plant [Dummy Flows] 0.00014 kg NA
US: Dummy_Middle distillates, combusted in industrial boiler [Dummy Flows] 1.07E-06 m3 NA
US: Dummy_Oil and grease, at plant [Dummy Flows] 0.00013 kg NA
US: Dummy_Petroleum coke, combusted in industrial boiler [Dummy Flows] 0.022341 kg NA
US: Dummy_Recycling, cement kiln dust [Dummy Flows] 0.00965 kg NA
US: Dummy_Refractory material, unspecified, at plant [Dummy Flows] 0.000647 kg NA
US: Dummy_Slag, at blast furnace [Dummy Flows] 0.0198 kg NA
US: Dummy_Waste, miscellaneous, combusted in industrial boiler [Dummy Flows] 0.001483 kg NA
US: Dummy_Waste, oil, combusted in industrial boiler [Dummy Flows] 4.87E-07 m3 NA
US: Dummy_Waste, other solid, combusted in industrial boiler [Dummy Flows] 0.000934 kg NA
US: Dummy_Waste, solvents, combusted in industrial boiler 0.008814 kg NA

Nguyen 47
[Dummy Flows]
US: Dummy_Waste, tire derived, combusted in industrial boiler [Dummy Flows] 0.00337 kg NA
Clay [Non renewable resources] 0.059691 kg NA
Gypsum (natural gypsum) [Non renewable resources] 0.061461 kg Was initially reported as "Gypsum, anhydrite", at 0.0486kg/kg cement
Iron ore (56,86%) [Non renewable resources] 0.013525 kg NA
Limestone (calcium carbonate) [Non renewable resources] 1.372 kg
Also includes gravel and marl (representing together 15% by mass), all approximated to limestone.
Raw material, unspecified (US LCI) [Material resources] 0.026419 kg NA
sand [Non renewable resources] 0.040497 kg NA
Shale [Non renewable resources] 0.052229 kg NA
Slate [Non renewable resources] 0.001134 kg NA
Water [Water] 0.840608 kg NA
Portland Cement 1 kg NA
Aluminum (+III) [Inorganic emissions to fresh water] 8.60E-07 kg NA
Ammonia [Inorganic emissions to air] 4.76E-06 kg NA
Ammonium / ammonia [Inorganic emissions to fresh water] 9.48E-07 kg NA
Carbon dioxide [Inorganic emissions to air] 0.92703 kg NA
Carbon monoxide [Inorganic 0.001105 kg NA

Nguyen 48
emissions to air]
Chloride [Inorganic emissions to fresh water] 0.000727 kg NA
Dust (PM2,5 - PM10) [Particles to air] 0.000296 kg NA
Dust (unspecified) [Particles to air] 0.00235 kg NA
Hydrogen chloride [Inorganic emissions to air] 6.49E-05 kg NA
Mercury (+II) [Heavy metals to air] 6.24E-08 kg NA
Methane [Organic emissions to air (group VOC)] 3.95E-05 kg NA
Nitrate [Inorganic emissions to fresh water] 5.90E-06 kg NA
Nitrogen oxides [Inorganic emissions to air] 0.002503 kg NA
Oil (unspecified) [Hydrocarbons to fresh water] 7.52E-06 kg NA
Phenol (hydroxy benzene) [Hydrocarbons to fresh water] 2.20E-08 kg NA
Phosphorus [Inorganic emissions to fresh water] 5.51E-09 kg NA
Polychlorinated dibenzo-p-dioxins (2,3,7,8 - TCDD) [Halogenated organic emissions to air] 9.98E-11 kg NA
Solids (suspended) [Particles to fresh water] 0.000234 kg NA
Sulphate [Inorganic emissions to fresh water] 0.000616 kg NA
Sulphide [Inorganic emissions to fresh water] 6.61E-08 kg NA

Nguyen 49
Sulphur dioxide [Inorganic emissions to air] 0.001662 kg NA
Total dissolved organic bounded carbon [Analytical measures to fresh water] 1.38E-05 kg NA
VOC (unspecified) [Organic emissions to air (group VOC)] 5.02E-05 kg NA
Zinc (+II) [Heavy metals to fresh water] 3.31E-08 kg NA
Process Quantity Unit Description
Diesel Truck Input
Adjusted from US LCI
Diesel [Crude oil products] 0.048859 kg NA
Diesel Truck Output 1000 kgkm NA
Carbon dioxide [Inorganic emissions to air] 0.17111 kg NA
Carbon monoxide [Inorganic emissions to air] 0.000246 kg NA
Dust (PM2,5 - PM10) [Particles to air] 2.35E-05 kg NA
Methane [Organic emissions to air (group VOC)] 4.13E-06 kg NA
Nitrogen oxides [Inorganic emissions to air] 0.001219 kg NA
Nitrous oxide (laughing gas) [Inorganic emissions to air] 6.19E-06 kg NA
Sulphur dioxide [Inorganic emissions to air] 3.77E-05 kg NA

Nguyen 50
VOC (unspecified) [Organic emissions to air (group VOC)] 8.42E-05 kg NA
Process Quantity Unit Description
Gasoline Truck Input (Trans) 0.04288 kg NA
Gasoline Truck Output (Trans) 1000 kgkm NA
Carbon dioxide [Inorganic emissions to air] 0.13245 kg NA
Carbon monoxide [Inorganic emissions to air] 0.002377 kg NA
Dust (PM2,5 - PM10) [Particles to air] 3.79E-06 kg NA
Methane [Organic emissions to air (group VOC)] 2.85E-05 kg NA
Nitrogen oxides [Inorganic emissions to air] 0.000775 kg NA
Nitrous oxide (laughing gas) [Inorganic emissions to air] 5.58E-06 kg NA
Sulphur dioxide [Inorganic emissions to air] 3.16E-05 kg NA
VOC (unspecified) [Organic emissions to air (group VOC)] 0.000177 kg NA
Process Quantity Unit Description
Wastewater Treatment Input
Adjusted from US LCI

Nguyen 51
Hydrated lime 0.0011429 kg GaBi
Iron chloride 0.00057086 kg GaBi
Phosphoric acid 6.26E-08 kg GaBi
Power [Electric power] 0.0028572 MJ GaBi
Steam (MJ) [Thermal energy] 0.10213 MJ GaBi
Waste water - untreated 1 kg GaBi
Wastewater Treatment Output 1 kg NA
Ammonia 1.00E-06 kg NA
Arsenic (+V) 1.00E-06 kg NA
Biological oxygen demand (BOD) 1.00E-06 kg NA
Cadmium (+II) 1.00E-06 kg NA
Chemical oxygen demand (COD) 1.00E-06 kg NA
Chromium (+III) 1.00E-06 kg NA
Chromium (+VI) 1.00E-06 kg NA
Cobalt 1.00E-06 kg NA
Copper (+II) 1.00E-06 kg NA
Lead (+II) 1.00E-06 kg NA
Manganese (+II) 1.00E-06 kg NA
Mercury (+II) 1.00E-06 kg NA
Nickel (+II) 1.00E-06 kg NA
Nitrate 1.00E-06 kg NA
Nitrogen 1.00E-06 kg NA
Phosphate 1.00E-06 kg NA
Phosphorus 1.00E-06 kg NA
Thallium 1.00E-06 kg NA
Zinc (+II) 1.00E-06 kg NA

Nguyen 52
Process Quantity Unit Description
PVC Pipe Input Industrial waste (incineration) 0.126003945 MJ Literature Review
Municipal waste 0.023907194 kg Literature Review
Air 0.43111634 kg Literature Review
Bauxite 9.72E-06 kg Literature Review
Bentonite 2.62E-05 kg Literature Review
Biomass 0.009658805 kg Literature Review
Carcass meal 2.33E-11 kg Literature Review
Chalk (Calciumcarbonate) 2.78E-31 kg Literature Review
Chromium 2.74E-06 kg Literature Review
Clay 1.84E-06 kg Literature Review
Copper 9.68E-05 kg Literature Review
Crude oil 0.51458028 kg Literature Review
Dolomite 1.97E-05 kg Literature Review
Feldspar (aluminum silicates) 4.97E-17 kg Literature Review
Ferro manganese 1.47E-06 kg Literature Review
Fluorspar (calcium fluoride; fluorite) 2.16E-06 kg Literature Review
Granite 2.08E-13 kg Literature Review
Gypsum (natural gypsum) 2.56E-06 kg Literature Review
Hard coal 0.287836442 kg Literature Review
Heavy spar (BaSO4) 0.000206752 kg Literature Review
Hydrogen 0.003785618 kg Literature Review
Iron 0.00161589 kg Literature Review
Lead 2.84E-06 kg Literature Review
Lignite 0.000658426 kg Literature Review
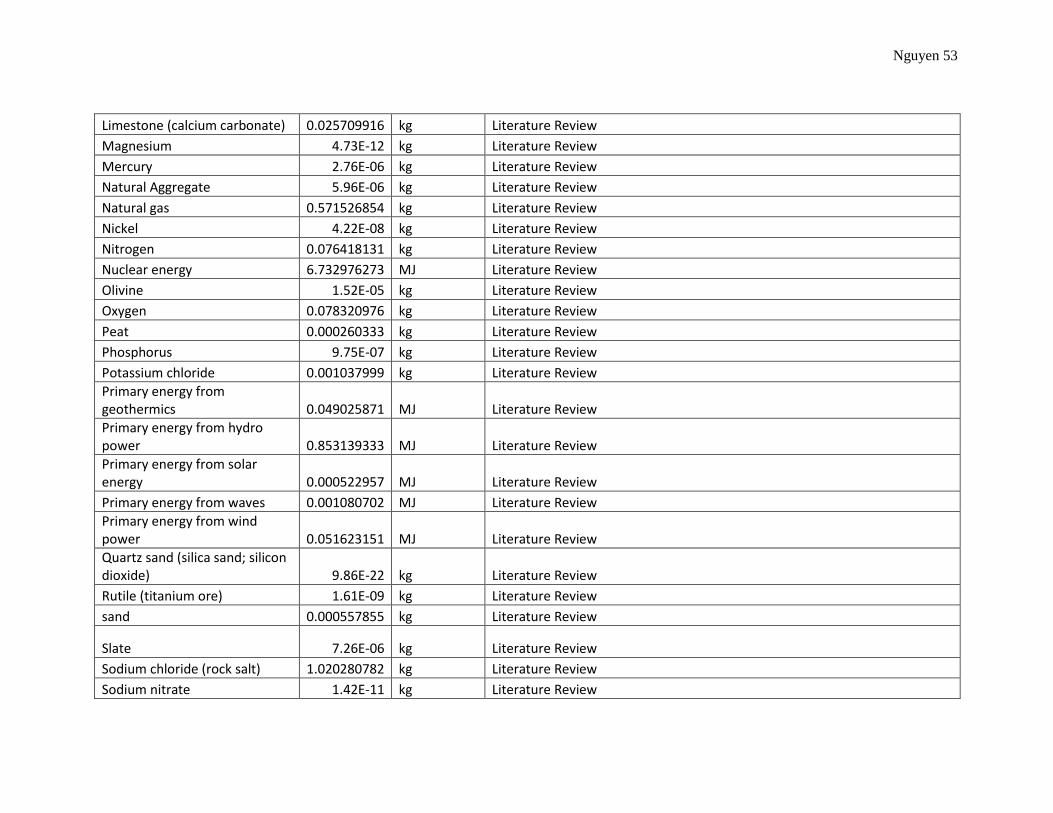
Nguyen 53
Limestone (calcium carbonate) 0.025709916 kg Literature Review
Magnesium 4.73E-12 kg Literature Review
Mercury 2.76E-06 kg Literature Review
Natural Aggregate 5.96E-06 kg Literature Review
Natural gas 0.571526854 kg Literature Review
Nickel 4.22E-08 kg Literature Review
Nitrogen 0.076418131 kg Literature Review
Nuclear energy 6.732976273 MJ Literature Review
Olivine 1.52E-05 kg Literature Review
Oxygen 0.078320976 kg Literature Review
Peat 0.000260333 kg Literature Review
Phosphorus 9.75E-07 kg Literature Review
Potassium chloride 0.001037999 kg Literature Review
Primary energy from geothermics 0.049025871 MJ Literature Review
Primary energy from hydro power 0.853139333 MJ Literature Review
Primary energy from solar energy 0.000522957 MJ Literature Review
Primary energy from waves 0.001080702 MJ Literature Review
Primary energy from wind power 0.051623151 MJ Literature Review
Quartz sand (silica sand; silicon dioxide) 9.86E-22 kg Literature Review
Rutile (titanium ore) 1.61E-09 kg Literature Review
sand 0.000557855 kg Literature Review
Slate 7.26E-06 kg Literature Review
Sodium chloride (rock salt) 1.020280782 kg Literature Review
Sodium nitrate 1.42E-11 kg Literature Review

Nguyen 54
Sulphur -0.00041456 kg Literature Review
Sulphur (bonded) 7.79E-08 kg Literature Review
Talc 2.13E-26 kg Literature Review
Water 34.86862467 kg Literature Review
Water (feed water) 2.413372336 kg Literature Review
Water (river water) 36.18123001 kg Literature Review
Water (sea water) 5.843067494 kg Literature Review
Water (well water) 0.845665251 kg Literature Review
Wood 0.027562903 kg Literature Review
Zinc 6.25E-07 kg Literature Review
PVC Pipe Output
Modified from US LCI
Polyvinylchloride-tube (PVC) 1 kg Literature Review
Chemicals (unspecified) 0.004587309 kg Literature Review
Demolition waste (deposited) 9.07E-05 kg Literature Review
Incineration good 0.004171964 kg Literature Review
Industrial waste for municipal disposal
-0.003832005 kg Literature Review
Inert chemical waste 0.004870431 kg Literature Review
Mineral waste 0.009135966 kg Literature Review
Municipal waste -0.02255401 kg Literature Review
Organic waste 1.72E-07 kg Literature Review
Overburden (deposited) 0.061282668 kg Literature Review
Packaging waste (metal) 0.000120304 kg Literature Review
Packaging waste (plastic) 9.14E-12 kg Literature Review
Plastic (unspecified) 0.004866734 kg Literature Review
Production residues (unspecified) 0.000656549 kg Literature Review
Slag 0.032247449 kg Literature Review

Nguyen 55
Tailings 0.003862758 kg Literature Review
Toxic chemicals (unspecified) 0.003797819 kg Literature Review
Waste (unspecified) 0.001574714 kg Literature Review
Waste paper 0.000929821 kg Literature Review
Wood 0.000932017 kg Literature Review
Wooden pallet (EURO) 4.94E-11 kg Literature Review
Acid (calculated as H+) 1.46E-05 kg Literature Review
Adsorbable organic halogen compounds (AOX) 1.37E-06 kg Literature Review
Aldehyde (unspecified) 4.15E-10 kg Literature Review
Aluminum (+III) 2.18E-07 kg Literature Review
Ammonia 1.21E-05 kg Literature Review
Ammonium 1.83E-05 kg Literature Review
Antimony 2.88E-12 kg Literature Review
Aromatic hydrocarbons (unspecified) 2.01E-05 kg Literature Review
Arsenic (+V) 4.02E-09 kg Literature Review
Arsenic (+V) 2.63E-10 kg Literature Review
Benzene 6.60E-14 kg Literature Review
Benzene 4.47E-10 kg Literature Review
Biological oxygen demand (BOD) 0.000127983 kg Literature Review
Bromate 4.15E-07 kg Literature Review
Cadmium (+II) 1.25E-09 kg Literature Review
Cadmium (+II) 1.01E-11 kg Literature Review
Calcium (+II) 0.000346703 kg Literature Review
Carbon dioxide 2.511506514 kg Literature Review
Carbon disulphide 2.47E-09 kg Literature Review
Carbon monoxide 0.003058311 kg Literature Review

Nguyen 56
Carbonate 0.000773679 kg Literature Review
Chemical oxygen demand (COD) 0.013395058 kg Literature Review
Chlorate 0.00024092 kg Literature Review
Chloride 0.046266104 kg Literature Review
Chlorine 0.000124854 kg Literature Review
Chlorine (dissolved) 3.18E-06 kg Literature Review
Chromium (unspecified) 1.35E-07 kg Literature Review
Chromium (unspecified) 3.06E-12 kg Literature Review
Copper (+II) 1.60E-06 kg Literature Review
Copper (+II) 3.09E-08 kg Literature Review
Cyanide 1.51E-10 kg Literature Review
Dichloroethane (ethylene dichloride) 4.84E-05 kg Literature Review
Dichloroethane (ethylene dichloride) 2.03E-06 kg Literature Review
Dichloromethane (methylene chloride) 3.13E-07 kg Literature Review
Dioxins (unspec.) 2.93E-10 kg Literature Review
Dust (PM10) 0.001355619 kg Literature Review
Dust (PM2.5) 4.79E-11 kg Literature Review
Ethene (ethylene) 1.45E-05 kg Literature Review
Ethyl benzene 9.56E-11 kg Literature Review
Fluoride 7.55E-09 kg Literature Review
Fluorine 4.17E-09 kg Literature Review
Halogenated hydrocarbons (unspecified) 1.48E-05 kg Literature Review
Hydrocarbons (unspecified) 3.26E-06 kg Literature Review
Hydrocarbons (unspecified) 0.00224449 kg Literature Review
Hydrogen 0.004392122 kg Literature Review

Nguyen 57
chloride 0.000182426 kg Literature Review
Hydrogen cyanide (prussic acid) 3.95E-19 kg Literature Review
Hydrogen fluoride 4.73E-06 kg Literature Review
Hydrogen sulphide 1.21E-07 kg Literature Review
Iron 4.99E-07 kg Literature Review
Lead (+II) 1.20E-07 kg Literature Review
Lead (+II) 7.54E-09 kg Literature Review
Magnesium (+III) 5.25E-07 kg Literature Review
Manganese (+II) 4.44E-11 kg Literature Review
Mercaptan (unspecified) 2.30E-08 kg Literature Review
Mercury (+II) 3.19E-07 kg Literature Review
Mercury (+II) 2.19E-08 kg Literature Review
Metals (unspecified) 3.62E-06 kg Literature Review
Metals (unspecified) 4.04E-05 kg Literature Review
Methane 0.028884719 kg Literature Review
Nickel (+II) 1.06E-06 kg Literature Review
Nickel (+II) 1.85E-07 kg Literature Review
Nitrate 6.22E-06 kg Literature Review
Nitrogen 1.46E-05 kg Literature Review
Nitrogen dioxide 0.005977083 kg Literature Review
Nitrous oxide (laughing gas) 4.77E-12 kg Literature Review
NMVOC (unspecified) 3.98E-05 kg Literature Review
Oil (unspecified) 8.54E-06 kg Literature Review
Organic chlorine compounds 1.03E-05 kg Literature Review
Organic chlorine compounds (unspecified) 6.26E-07 kg Literature Review
Organic compounds (dissolved) 1.94E-05 kg Literature Review
Organic compounds (unspecified) 0.000157505 kg Literature Review

Nguyen 58
Oxygen 1.42E-06 kg Literature Review
Phenol (hydroxy benzene) 5.27E-07 kg Literature Review
Phosphorus 3.18E-05 kg Literature Review
Polychlorinated dibenzo-p-dioxins (2,3,7,8 - TCDD) 6.60E-09 kg Literature Review
Polycyclic aromatic hydrocarbons (PAH) 1.27E-09 kg Literature Review
Potassium 3.26E-05 kg Literature Review
Propene (propylene) 8.06E-07 kg Literature Review
Selenium 1.10E-11 kg Literature Review
Silicon dioxide (silica) 2.43E-20 kg Literature Review
Silver 5.29E-10 kg Literature Review
Sodium (+I) 0.026695309 kg Literature Review
Solids (dissolved) 0.020380824 kg Literature Review
Solids (suspended) 0.00659119 kg Literature Review
Strontium 5.45E-08 kg Literature Review
Styrene 7.74E-14 kg Literature Review
Sulphate 0.003332345 kg Literature Review
Sulphur 9.83E-08 kg Literature Review
Sulphur dioxide 0.009708465 kg Literature Review
Sulphuric acid 3.55E-14 kg Literature Review
Tin (+IV) 9.56E-09 kg Literature Review
Toluene (methyl benzene) 2.45E-10 kg Literature Review
Total dissolved organic bounded carbon 1.14E-05 kg Literature Review
Vinyl chloride (VCM; chloroethene) 7.84E-05 kg Literature Review
Vinyl chloride (VCM; chloroethene) 9.56E-06 kg Literature Review
VOC (unspecified) emissions to 6.87E-05 kg Literature Review

Nguyen 59
air
Xylene (dimethyl benzene) 1.59E-10 kg Literature Review
Zinc (+II) 7.67E-08 kg Literature Review
Zinc (+II) 1.25E-08 kg Literature Review
Process Quantity Unit Description
Gravel Input
Adjusted with US LCI
Air 0.012743 kg NA
Barium sulphate 2.53E-16 kg NA
Basalt 3.07E-06 kg NA
Bauxite 1.83E-08 kg NA
Bentonite 6.06E-07 kg NA
Calcium chloride 2.59E-14 kg NA
Carbon dioxide 4.64E-05 kg NA
Chromium ore (39%) 9.63E-09 kg NA
Clay 2.53E-07 kg NA
Colemanite ore 1.37E-09 kg NA
Copper - Gold - Silver - ore (1,0% Cu; 0,4 g/t Au; 66 g/t Ag) 2.59E-08 kg NA
Copper - Gold - Silver - ore (1,1% Cu; 0,01 g/t Au; 2,86 g/t Ag) 1.57E-08 kg NA
Copper - Gold - Silver - ore (1,16% Cu; 0,002 g/t Au; 1,06 g/t Ag) 8.89E-09 kg NA
Copper - Molybdenum - Gold - Silver - ore (1,13% Cu; 0,02% Mo; 0,01 g/t Au; 2,86 g/t Ag) 2.17E-08 kg NA

Nguyen 60
Copper ore (0.14%) 2.70E-07 kg NA
Copper ore (1.2%) 2.68E-09 kg NA
Copper ore (4%) 1.70E-18 kg NA
Copper ore (sulphidic, 1.1%) 2.02E-15 kg NA
Crude oil USA 1.79E-07 kg NA
Dolomite 1.02E-10 kg NA
Ferro manganese 1.23E-18 kg NA
Fluorspar (calcium fluoride; fluorite) 1.28E-10 kg NA
Gypsum (natural gypsum) 1.05E-07 kg NA
Hard coal USA 1.95E-05 kg NA
Heavy spar (BaSO4) 1.46E-06 kg NA
Inert rock 0.009634 kg NA
Iron 2.03E-14 kg NA
Iron ore (65%) 1.72E-09 kg NA
Kaolin ore 2.46E-09 kg NA
Lead 2.47E-18 kg NA
Lead - zinc ore (4.6%-0.6%) 1.18E-07 kg NA
Lignite USA 5.42E-07 kg NA
Limestone (calcium carbonate) 2.88E-05 kg NA
Magnesium carbonate 2.47E-12 kg NA
Magnesium chloride leach 2.21E-06 kg NA
Manganese ore 5.48E-09 kg NA
Molybdenite 1.33E-08 kg NA
Natural Aggregate 1.590774 kg NA
Natural gas USA 1.24E-06 kg NA
Nickel ore 2.53E-08 kg NA
Nitrogen 1.54E-12 kg NA
Olivine 1.36E-17 kg NA

Nguyen 61
Oxygen -3.33E-05 kg NA
Peat 1.25E-05 kg NA
Phosphate ore 7.84E-12 kg NA
Phosphorus minerals 4.81E-12 kg NA
Phosphorus ore 4.94E-17 kg NA
Pit gas 2.81E-15 kg NA
Pit Methane 3.95E-06 kg NA
Potassium chloride 1.25E-12 kg NA
Precious metal ore 5.95E-10 kg NA
Primary energy from geothermics 0.000107 MJ NA
Primary energy from hydro power 0.002668 MJ NA
Primary energy from solar energy 0.000447 MJ NA
Primary energy from wind power 0.000517 MJ NA
Quartz sand (silica sand; silicon dioxide) 1.67E-07 kg NA
Raw pumice 2.39E-10 kg NA
Renewable fuels 1.09E-16 kg NA
Slate [Non renewable resources] 2.28E-17 kg NA
Sodium chloride 5.57E-08 kg NA
Sodium sulphate 1.00E-13 kg NA
Soil 0.310761 kg NA
Sulphur 7.04E-13 kg NA
Talc 4.20E-11 kg NA
Tin ore 2.19E-17 kg NA
Titanium ore 9.19E-09 kg NA

Nguyen 62
Uranium natural 3.90E-08 kg NA
Water 1.89E-05 kg NA
Water (surface water) 0.020807 kg NA
Wood 1.81E-08 kg NA
Zinc - copper ore 4.21E-08 kg NA
Zinc - lead - copper ore 2.17E-08 kg NA
Zinc - lead ore 5.81E-19 kg NA
Zinc ore 2.05E-17 kg NA
Gravel Output 1 kg NA
CaF2 (low radioactice) 4.41E-09 kg NA
Demolition waste (deposited) 7.93E-06 kg NA
Highly radioactive waste 1.32E-08 kg NA
Medium and low radioactive wastes 1.56E-08 kg NA
Overburden (deposited) 0.175685 kg NA
Plutonium as residual product 2.62E-11 kg NA
Radioactive tailings 7.73E-06 kg NA
Slag (deposited) 0.025675 kg NA
Slag (Uranium conversion) 2.92E-08 kg NA
Spoil (deposited) 0.18244 kg NA
Treatment residue (mineral, deposited) 0.020238 kg NA
Uranium depleted 3.02E-08 kg NA
Waste radioactive 2.62E-08 kg NA
1,2-Dibromoethane 2.02E-16 kg NA
Acenaphthene 3.05E-12 kg NA
Acetaldehyde (Ethanal) 4.65E-10 kg NA
Acetic acid 1.38E-10 kg NA

Nguyen 63
Acetone (dimethylcetone) 4.56E-10 kg NA
Acid (calculated as H+) 1.17E-10 kg NA
Acrolein 2.42E-13 kg NA
Acrylonitrile 1.13E-13 kg NA
Adsorbable organic halogen compounds (AOX) 3.98E-10 kg NA
Aldehyde (unspecified) 1.48E-10 kg NA
Alkane (unspecified) 9.02E-09 kg NA
Alkene (unspecified) 7.40E-09 kg NA
Americium (Am241) 4.59E-05 Bq NA
Ammonia 2.53E-08 kg NA
Ammonium 3.31E-14 kg NA
Anthracene 3.43E-14 kg NA
Antimony 2.34E-11 kg NA
Antimony (Sb124) 1.61E-08 Bq NA
Antimony (Sb124) 4.78E-07 Bq NA
Antimony (Sb125) 3.25E-07 Bq NA
Argon (Ar41) 0.101617 Bq NA
Aromatic hydrocarbons (unspecified) 3.13E-11 kg NA
Arsenic (+V) 6.68E-11 kg NA
Arsenic trioxide 8.34E-17 kg NA
Barium 3.01E-09 kg NA
Benzene 6.39E-10 kg NA
Benzo{a}anthracene 1.72E-14 kg NA
Benzo{a}anthracene 8.02E-15 kg NA
Benzo{a}pyrene 2.18E-13 kg NA
Benzo{ghi}perylene 1.54E-14 kg NA
Benzofluoranthene 3.07E-14 kg NA

Nguyen 64
Benzofluoranthene 2.33E-15 kg NA
Beryllium 4.79E-12 kg NA
Beryllium 4.16E-12 kg NA
Biological oxygen demand (BOD) 2.08E-09 kg NA
Boron 2.39E-09 kg NA
Boron compounds (unspecified) 6.74E-09 kg NA
Bromide 7.47E-12 kg NA
Bromine 9.10E-14 kg NA
Butadiene 3.27E-14 kg NA
Butane 3.19E-08 kg NA
Cadmium (+II) 1.62E-11 kg NA
Cadmium (+II) 3.81E-11 kg NA
Calcium (+II) 4.03E-07 kg NA
Carbon (C14) 0.04662 Bq NA
Carbon dioxide 0.003234 kg NA
Carbon disulphide 3.75E-14 kg NA
Carbon monoxide 4.52E-06 kg NA
Carbon, organically bound 1.71E-09 kg NA
Carbonate 1.89E-07 kg NA
Cesium (Cs134) 1.28E-05 Bq NA
Chemical oxygen demand (COD) 6.76E-07 kg NA
Chloride 1.50E-05 kg NA
Chlorinated hydrocarbons (unspecified) 1.08E-18 kg NA
Chlorine 8.84E-14 kg NA
Chloromethane (methyl chloride) 9.67E-13 kg NA
Chromium (+III) 8.10E-14 kg NA

Nguyen 65
Chrysene 4.23E-14 kg NA
Cobalt 7.29E-11 kg NA
Copper (+II) 1.07E-10 kg NA
Cresol (methyl phenol) 2.42E-15 kg NA
Cresol (methyl phenol) 1.85E-15 kg NA
Curium (Cm alpha) 6.09E-05 Bq NA
Cyanide 3.98E-12 kg NA
Cyanide (unspecified) 1.33E-11 kg NA
Cyclohexane (hexahydro benzene) 8.59E-13 kg NA
Dibenz(a)anthracene 9.58E-15 kg NA
Dichloromethane (methylene chloride) 1.00E-17 kg NA
Dichloropropane 1.54E-18 kg NA
Diethylamine 8.28E-19 kg NA
Dioxins (unspec.) 6.17E-19 kg NA
Dust (> PM10) 4.90E-07 kg NA
Ethane 1.06E-07 kg NA
Ethanol 1.04E-09 kg NA
Ethene (ethylene) 1.16E-11 kg NA
Fluoranthene 8.00E-13 kg NA
Fluorene 3.54E-13 kg NA
Fluoride 1.32E-09 kg NA
Fluorine 9.98E-14 kg NA
Formaldehyde (methanal) 8.68E-09 kg NA
Halogenated hydrocarbons (unspecified) 4.93E-18 kg NA
Heavy metals to air (unspecified) 5.40E-13 kg NA
Helium 1.42E-11 kg NA

Nguyen 66
Heptane (isomers) 7.80E-10 kg NA
Hexamethylene diamine (HMDA) 1.92E-15 kg NA
Hydrocarbons (unspecified) 3.04E-10 kg NA
Hydrogen 2.66E-08 kg NA
Hydrogen arsenic (arsine) 6.92E-15 kg NA
Hydrogen bromine (hydrobromic acid) 6.57E-12 kg NA
Hydrogen chloride 2.94E-07 kg NA
Hydrogen chloride 9.41E-14 kg NA
Hydrogen cyanide (prussic acid) 2.91E-13 kg NA
Hydrogen fluoride 2.34E-08 kg NA
Hydrogen iodide 7.24E-15 kg NA
Hydrogen phosphorous 1.04E-15 kg NA
Hydrogen sulphide 4.02E-08 kg NA
Hydroxide 5.66E-12 kg NA
Indeno[1,2,3-cd]pyrene 1.14E-14 kg NA
Iron 3.92E-11 kg NA
Krypton (Kr85) 1716.167 Bq NA
Krypton (Kr85m) 0.00175 Bq NA
Lead (+II) 4.42E-10 kg NA
Lead dioxide 1.21E-15 kg NA
Magnesium 5.28E-11 kg NA
Manganese (+II) 2.92E-10 kg NA
Manganese (Mn54) 0.001552 Bq NA
Mercaptan (unspecified) 3.70E-11 kg NA
Mercury (+II) 6.03E-11 kg NA
Metals 3.68E-15 kg NA
Methane 5.49E-06 kg NA

Nguyen 67
Methanol 8.55E-10 kg NA
Molybdenum 2.79E-12 kg NA
Naphthalene 3.60E-12 kg NA
Nickel (+II) 5.60E-10 kg NA
Nitrogen dioxide 1.35E-15 kg NA
Nitrogen monoxide 2.90E-14 kg NA
Nitrogen organic bounded 4.26E-09 kg NA
Nitrogen oxides 1.64E-05 kg NA
NMVOC (unspecified) 1.34E-06 kg NA
Octane 4.29E-10 kg NA
Organic chlorine compounds 1.06E-15 kg NA
Phenol (hydroxy benzene) 2.00E-10 kg NA
Phosphate 5.79E-10 kg NA
Potassium 1.28E-10 kg NA
Potassium (+I) 6.65E-09 kg NA
Propane 1.48E-07 kg NA
Propene (propylene) 6.65E-10 kg NA
Selenium 1.35E-10 kg NA
Silicate particles 8.18E-15 kg NA
Silver [Heavy metals to air] 1.16E-19 kg NA
Sulphur dioxide 1.49E-05 kg NA
Total organic bounded carbon 2.82E-10 kg NA
Vinyl chloride (VCM; chloroethene) 2.86E-12 kg NA
VOC (unspecified) 3.14E-10 kg NA
Waste heat 0.029089 MJ NA
Wood (dust) 3.89E-14 kg NA