Optimization of Food wastage Report
68
Indian Intitute of Space Science and Technology Thiruvananthapuram B.Tech. Economics Project A study report on Analysis and Optimization of Food Wastage in IIST Submitted by B.Tech. in Aerospace 2015 Batch Group Number: 10 October of 2016 Department of Humanities i
-
Upload
uttam-jodawat -
Category
Engineering
-
view
60 -
download
3
Transcript of Optimization of Food wastage Report
Indian Intitute of Space Science and TechnologyThiruvananthapuram
B.Tech. Economics Project
A study report on
Analysis and Optimization of Food Wastage in IIST
Submitted by
B.Tech. in Aerospace 2015 Batch
Group Number: 10
October of 2016
Department of Humanities
i
Indian Intitute of Space Science and TechnologyThiruvananthapuram
B.Tech. Economics Project
A study report on
Analysis and Optimization of Food Wastage in IIST
Submitted by
B.Tech. in Aerospace 2015 Batch
Group Number: 10
ByChundru Madhu Swapnika
Nayan RawatNaveen Jangir
Akash KanaujiyaUttam Jodawat
October of 2016
Department of Humanities
ii
Declaration
This project report titled “Analysis and Optimization of Food Wastage in IIST”
is a presentation of our original research work. Wherever contributions of oth-
ers are involved, every effort is made to indicate this clearly, with due respect to
the literature, and acknowledgement of collaborative research and discussions.
Date: 22th October, 2016.
Name Signature
1. Chundru Madhu Swapnika ....................
2. Nayan Rawat .....................
3. Naveen Jangir .....................
4. Akash Kanaujiya .....................
5. Uttam Jodawat .....................
iii
ACKNOWLEDGEMENT
The value of a college education is not the learning of many facts but the
training of the mind to think.
Albert Einstein
In the present world, there is a high competition in which, those who are
willing to move forward inspite of all hurdles, succeed. A Project, in this aspect
serves as a bridge between theoretical and practical working. Hence we take
this oppurtunity to express our deep sense of gratitude to Dr.Shaijumon C.S.for his exemplary guidance, monitoring and constant encouragement.
We are extremely thankful to Mr. K. P. Vinod Kaimal for being patient with
us and helping us with whatever we needed.
We also use this oppurtunity to express our heartfelt thanks to all the people
who participated in the survey and gave their valuable suggestions.
Last but not least, we would like to thank all those people out there who
helped us complete this project on time.
iv
ABSTRACT
As the title suggests, this report aims to analyse all the factors responsible
for the difference between food supply and consumption in IIST, thus leading to
its wastage.Further it explores all the ways possible to optimize the wastage of
food. This is done by conducting a survey in the premises of the college. The
surveys done include the likes and dislikes of the students for various dishes
provided and the days that students likely choose other than mess for eating
food. Further we have gathered all the opinions and suggestions given by the
students regarding food provided by the mess and about its wastage . We
then arrived at suitable conclusions from our findings. We also mentioned the
ways possible to optimize food wastage. Thus, we tested the validity of our
hypotheses.
v
Contents
1 Introduction 11.1 Area of study . . . . . . . . . . . . . . . . . . . . . . . . . . . . . 1
1.2 Topic of study . . . . . . . . . . . . . . . . . . . . . . . . . . . . . 2
1.3 Importance of the Topic . . . . . . . . . . . . . . . . . . . . . . . 3
1.4 Objective of the Study . . . . . . . . . . . . . . . . . . . . . . . . 5
1.5 Plan of the Study . . . . . . . . . . . . . . . . . . . . . . . . . . . 5
1.6 Methodology of the Study . . . . . . . . . . . . . . . . . . . . . . 6
1.7 Hypotheses . . . . . . . . . . . . . . . . . . . . . . . . . . . . . . 7
1.8 Limitations of the Study . . . . . . . . . . . . . . . . . . . . . . . 8
2 Literature Review 10
3 Opinions 28
4 Survey 32
5 Opinion Poll 38
6 Statistics 46
7 Analysis 48
8 Suggestive measures 52
9 Conclusion 55
10 Appendix 57
11 Bibliography 5911.1 List of Internet sources with internet adresses . . . . . . . . . . . 59
11.2 List of books with author and publishers . . . . . . . . . . . . . . 60
vi
List of Figures
2.1 Total agricultural production (FBS) vs. food wastage volumes . . 12
2.2 Food wastage volumes, at world level by phase of the food sup-
ply chain . . . . . . . . . . . . . . . . . . . . . . . . . . . . . . . . 12
2.3 Contribution of each region to food wastage and carbon footprint 13
2.4 A picture showing damagaed sacks at a storage facility. . . . . . 15
2.5 A picture showing a child eating from garbage. . . . . . . . . . . 20
4.1 Figure showing the preferences chosen for Breakfast . . . . . . . 35
4.2 Figure showing the preferences chosen for Lunch . . . . . . . . 35
4.3 Figure showing the preferences chosen for snacks . . . . . . . . 36
4.4 Figure showing the preferences chosen for Dinner . . . . . . . . 36
4.5 Figure showing the preferences chosen for Non-veg food . . . . 37
5.1 Poll on the extension of breakfast timings . . . . . . . . . . . . . 38
5.2 Poll on the oil present in puri and vada . . . . . . . . . . . . . . . 39
5.3 Poll on the removal of mixed pickles from the menu . . . . . . . . 39
5.4 Poll on chnge of lunch menu . . . . . . . . . . . . . . . . . . . . 40
5.5 Poll on the requirement of more fruits . . . . . . . . . . . . . . . 40
5.6 Poll on the replacement of chapathy in the afternoon . . . . . . . 41
5.7 Poll on the usage of variety of vegetables to make curry . . . . . 41
5.8 Poll on the improvement of sambhar . . . . . . . . . . . . . . . . 42
5.9 Poll on the availability of coffee and milk during snacks . . . . . 42
5.10 Poll on the quantity of snacks available . . . . . . . . . . . . . . . 43
5.11 Poll on the quality of noodles . . . . . . . . . . . . . . . . . . . . 43
5.12 Poll on the quality of curd . . . . . . . . . . . . . . . . . . . . . . 44
5.13 Poll on the quality of curry . . . . . . . . . . . . . . . . . . . . . . 44
5.14 Poll on the individual wastage of food . . . . . . . . . . . . . . . . 45
vii
List of Tables
4.1 Preferences selected for Breakfast . . . . . . . . . . . . . . . . . 33
4.2 Preferences selected for Lunch . . . . . . . . . . . . . . . . . . . 33
4.3 Preferences selected for Snacks . . . . . . . . . . . . . . . . . . 34
4.4 Preferences selected for Dinner . . . . . . . . . . . . . . . . . . . 34
4.5 Preferences selected for Non-vegetarians . . . . . . . . . . . . . 34
6.1 Statistics of food wastage . . . . . . . . . . . . . . . . . . . . . . 47
8.1 Approved Bulk list with quantity and rates . . . . . . . . . . . . . 54
10.1 Major Ratings given by students . . . . . . . . . . . . . . . . . . 58
viii
Chapter 1
Introduction
Earth provides enough to satisfy every man’s need,
but not every man’s greed.
Mahatma Gandhi
1.1 Area of study
Ever since the earth was inhabited, humans and other life formshave depended on things that exist freely in nature to survive.Natural resources like air, water, land etc. are all connected ina way. Therefore if one is taken away, it will affect the supply orquality of all others. Research says that:
The world economy uses around 60 billion tonnes of resourceseach year to produce the goods and services which we all con-sume. On the average, a person in Europe consumes about 36kgof resources per day; a person in North America consumes about90kg per day, a person in Asia consumes about 14kg and a per-son in Africa consumes about 10kg of resources per day. 1
Factors like over population, pollution, deforestation pose a threatto the natural resources. But now-a-days in addition to this the
1http://www.foe.co.uk/sites/default/files/downloads/overconsumption.pdf
1
wastage of the resources have also started being a threat. Butbefore we dive deeper into this topic, it is important to know whatexactly waste means.
According to the Basel Convention of 1989, “’Wastes’ are sub-stance or objects, which are disposed of or are intended to bedisposed of or are required to be disposed of by the provisions ofnational law”. 2
Wastage of resources often leads to problems not only envi-ronmentally but also socially and economically. For a developingcountry like India, this is a serious threat. Hence, optimization ofwastage is important and is a major concern for the growth of theeconomy. This project considers this aspect of study.
Resources like water are wasted each and every minute by oneor the other person across the world. This may be in severalforms, for instance, washing clothes in the river, excessive use ofwater for chores like bathing, brushing and all other house activi-ties. This excessive misuse of resources will prove to be a banefor the future generations. For the survival of mankind it is notonly necessary to renew the resources but also make sure theyare not wasted. This is the only way the development of a countryis possible in each and every aspect.
1.2 Topic of study
The scope of this project is to analyze the factors responsiblefor the wastage of food resources in IIST.The definition of “FoodWastage” as said by FAO is mentioned here:
2www.basel.int
2
Food loss refers to a decrease in mass (dry matter) or nutri-tional value (quality) of food that was originally intended for humanconsumption.Food waste refers to food appropriate for human consumptionbeing discarded, whether or not after it is kept beyond its expirydate or left to spoil.Food wastage refers to any food lost by deterioration or waste.Thus, the term wastage encompasses both “food loss and foodwaste”.
We further research on the various ways that are available andin the scope of the college to optimize the food wastage. Wealso provide a few suggestions on the process of waste disposalin IIST. Based on the hypotheses selected, suitable surveys andopinion polls are taken. From these surveys and polls a generalconclusion is drawn. Further necessary graphs and figures havebeen added to make the matter of this project more easily under-standable.
1.3 Importance of the Topic
The importance of this topic comes from the fact that food is oneof the primary necessity of life. And its wastage might lead to var-ied problems not only environmentally, socially but also econom-ically. While certain people are wasting the food given to them,certain other people are dying due to starvation and malnutrition.
As per the World Health Organisation (WHO) growth standard,the percentage of malnourished and severely malnourished chil-dren in Kerala is 36.92% and 0.08% respectively as on March2011.
3
FAO estimates that avoidable food waste in the US alone, yearlyexceeds a staggering 55 million metric tonnes, nearly 29% of an-nual production.
As much as 1,94,502 metric tonnes of food grain worth croresof rupees was wasted in India due to various reasons between2005 and March 2013.
According to the United Nations Development Programme, upto 40% of the food produced in India is wasted. About 21 milliontonnes of wheat are wasted in India and 50% of all food acrossthe world meets the same fate and never reaches the needy. Infact, according to the agriculture ministry, Rs. 50,000 crore worthof food produced is wasted every year in the country.
India ranks 63 among 88 countries in Global Hunger Index.Thenumber of hungry people in India has increased by 65 millionmore than the population of France. According to a survey byBhook (an organization working towards reducing hunger) in 2013,20 crore Indians sleep hungry on any given night. About 7 millionchildren died in 2012 because of hunger/malnutrition.
25% of fresh water used to produce food is ultimately wasted,even as millions of people still dont have access to drinking water.
The Saumitra Chaudhuri Committee, constituted by the Plan-ning Commission in 2012, has estimated the countrys cold stor-age requirement as 61.3 million tonne as against the present ca-pacity of around 29 million tonne which ultimately leads to wastageof food.
4
All the above facts explain the importance of analysing the fac-tors behind the wastage and trying to optimize it. The optimizationof food wastage in IIST will not lead to the complete abolishmentof the wastage problems in the world but it might prove to be astart for the cause. Knowing the factors, one can always makesure to provide alternative ways to reduce the wastage. It is notonly in terms of ethical way, the eradication of this problem is nec-essary but also because it leads to economic problems in the col-lege. Being a government college IIST should be a role-model forthe other private colleges in Kerala. Also the funds issued to thecollege should be used judiciously so that the college developsin every way possible. A wastage for something unwanted mightreult in losing something wanted.
1.4 Objective of the Study
The objective of this study is to come up with an altogethernew form of food menu in IIST which tries to take into accountatleast the majority of the suggestions given by the students with-out any degradation of its nutritional value. Also it tries to explainthat dumping the wastage into bio-gas plants or sending it awayto farms is not the only solution available. There are further moresolutions for this problem and any one of them can be considered.The project just presents an overview of the state of situation anddoes not by any means demand for the suggestions to be en-forced.
1.5 Plan of the Study
Official data on the production of food and its wastage is ob-tained fron the canteen office. In accordance with, a survey istaken which helps in verifying whether the factors are responsible
5
or not. Also opinions and suggestions of the students are takenin order to form a new plan for food menu. The data obtainedfrom the canteen office helps in the verification of the hypothesesprovided with the help of suitable assumptions.
1.6 Methodology of the Study
A set of 100 students were taken for the survey. Care is takenthat these 100 number include the students from all the yearspresent and also from different states.The same group of studentsare considered for the opinion poll also. A series of questionswere asked and this is done by preparing a questionnaire before-hand. 35% of the set consisted of girls and rest all were boys.
The survey consisted of the students rating the dish providedon a scale of 1 to 10 and also ticking the days when they wouldlikely prefer eating outside. This provides in understanding howthe tastes and better alternatives of the students would serve asfactors. Further opinion polls on time schedule, the taste of thefood and regarding the suggestions for the improvement of food.General suggestions given by the students are also considered.The opinion poll consisted of the following questions:
1. What is your opinion regarding the time schedule for break-fast, lunch,dinner and snacks?
2. How frequent do you dump the food in your plate in the bins?
3. What is your opinion on the food provided in IIST?
4. Do you think any of the dishes provided needed to be re-placed?
The survey took into consideration the dishes provided duringbreakfast, lunch, snacks and dinner. Columns were provided forthe students to rate the dish. The next part is consisted of the
6
days in a week against mess, cafeteria, paratha shop and city.The rating is on a scale of 1 to 10, 1 being the leat liked and 10being very good.
Few assumptions were made during this study. They include:
1. The person who dislikes a certain dish, if in case turns up,wastes atleastt some of it.
2. The food is cooked with the assumption that every dish pro-vided will be taken atleast in some quantity.
The assumptions provided above are taken out of logic. Thefirst one appeared to be logically correct when the survey is con-sidered. The second one is considered because of the logic be-hind it that people tend to taste food that is not cooked in theirplaces out of mere curiosity.
From the data obtained from the canteen mess, analysis wasdone to find the whether the factors are indeed responsible ornot. This is done by plotting graphs and using pie-charts to qual-itatively argue the responsibility of these factors.At the end, con-clusions were drawn to prove the validity of hypotheses.
1.7 Hypotheses
Two hypotheses were considered. They are:
1. The supply of food and its consumption are not in equilibriumdue to factors like taste of individual, time schedule of mess,the quality of food, potential of the students, better alterna-tives and other factors.
7
2. The disposal of waste food or left-over food into bio-gas orto the farms is not the only solution to treat this problem effi-ciently.
It is known though the food is liked by everyone, some of it, saya minimum quantity will be wasted. But the reasons behind thiswastage are quite interesting if one digs deeper into it. This hy-potheses takes, what maybe the major factors, into account. Theseveral major factors pertaining to this wastage are as mentionedin the hypotheses. The other factors include all sorts of minorreasons which lead to wastage of food.
There are several ways to reduce the food wastage. But, notall of those might be in the scope of this college economically.But,it is also certain that the above mentioned ways are not the mostefficient solutions possible on a large scale. Therefore it is neces-sary to check whether the hypotheses would prove to be right ina relatively small economy like IIST.
1.8 Limitations of the Study
The official data obtained from the mess is for a span of oneweek. The days considered do not necessarily consist of all widerange of possibilities possible. But, it may be said that the devia-tion obtained by considering all the days of a semester would notbe sufficiently great since, a normal week, where five of the daysare the usual working days and two of them are weekends areconsidered for this project.
Another limitation would be the number of students taken forthis project. Although the total population is not considered, keep-ing in mind the aim of this project, which is the qualitative analysisof the validity of the above mentioned factors, it is considered that
8
the deviation would not be sufficiently large to jeopardize the re-sults.
9
Chapter 2
Literature Review
Willful waste brings woeful want.Thomas Fuller
As mentioned in the introduction, this project comes under thescope of “Wastage of resources”. It is certain that some or theother idea comes into mind when this topic is heard, but then,people tend to grasp the importance of reducing the wastage ofresources when they see it quantitatively. So, certain articlesaare mentioned to help gain a better understanding. A start inthis process is done by looking into the summary report on “FoodWastage Footprint: Impacts on Natural Resources” by FAO.
Food and Agricultural Organization. Retrieved fromhttp://www.fao.org:http://www.fao.org/nr/sustainability/food-loss-and-waste/en/
Food Wastage Footprint: Impacts on Natural Resources -A Summary Report
Posted by Food and Agricultural Organization
FAO estimates that each year, approximately one-third of all food
10
produced for human consumption in the world is lost or wasted.This food wastage represents a missed opportunity to improveglobal food security,but also to mitigate environmental impactsand resources use from food chains.The global volume of foodwastage is estimated to be 1.6 Gtonnes of primary product equiv-alents,while the total wastage for the edible part of food is 1.3Gtonnes. This amount can be weighed against total agriculturalproduction (for food and non-food uses), which is about 6 Gtonnes.
Without accounting for GHG emissions from land use change,the carbon footprint of food produced and not eaten is estimatedto 3.3 Gtonnes of CO2 equivalent: as such, food wastage ranksas the third top emitter after USA and China.Produced but un-eaten food vainly occupies almost 1.4 billion hectares of land;thisrepresents close to 30% of the worlds agricultural land area.
The loss of land, water and biodiversity, as well as the negativeimpacts of climate change, represent huge costs to society thatare yet to be quantified. The direct economic cost of food wastageof agricultural products (excluding fish and seafood),based on pro-ducer prices only, is about USD 750 billion, equivalent to the GDPof Switzerland. Hence food wastage reduction would not onlyavoid pressure on scarce natural resources but also decrease theneed to raise food production by 60% in order to meet the 2050population demand.
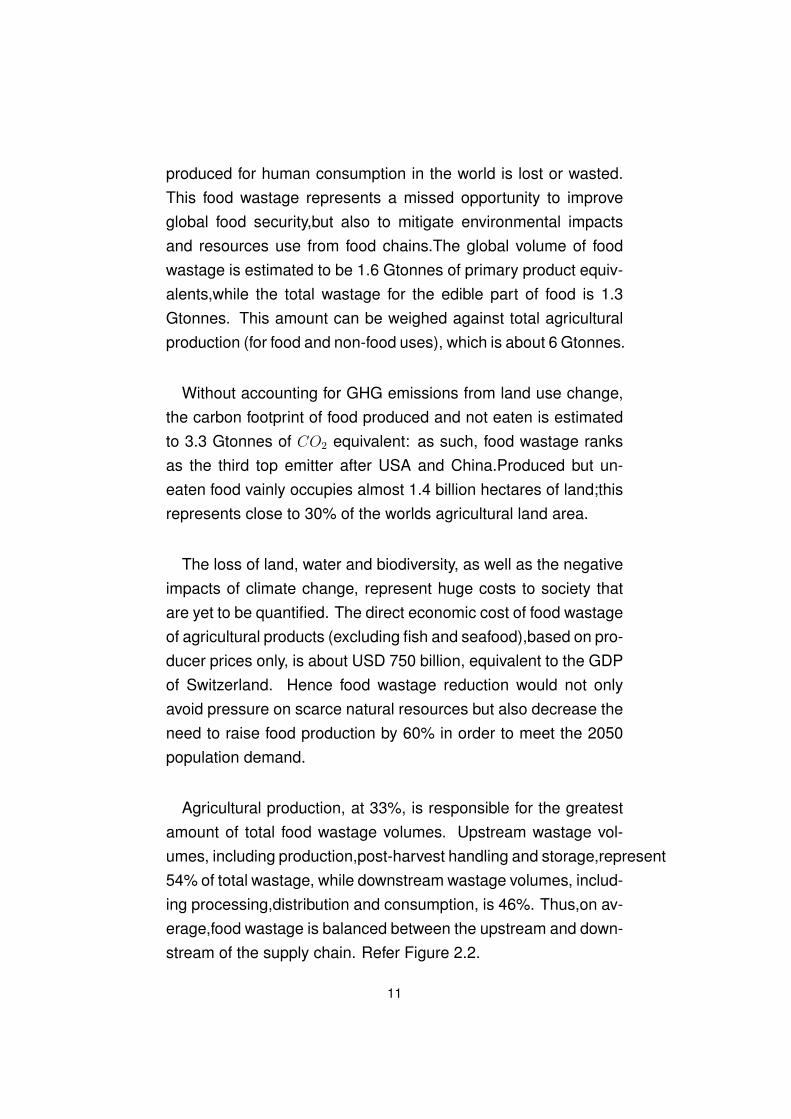
Agricultural production, at 33%, is responsible for the greatestamount of total food wastage volumes. Upstream wastage vol-umes, including production,post-harvest handling and storage,represent54% of total wastage, while downstream wastage volumes, includ-ing processing,distribution and consumption, is 46%. Thus,on av-erage,food wastage is balanced between the upstream and down-stream of the supply chain. Refer Figure 2.2.
11
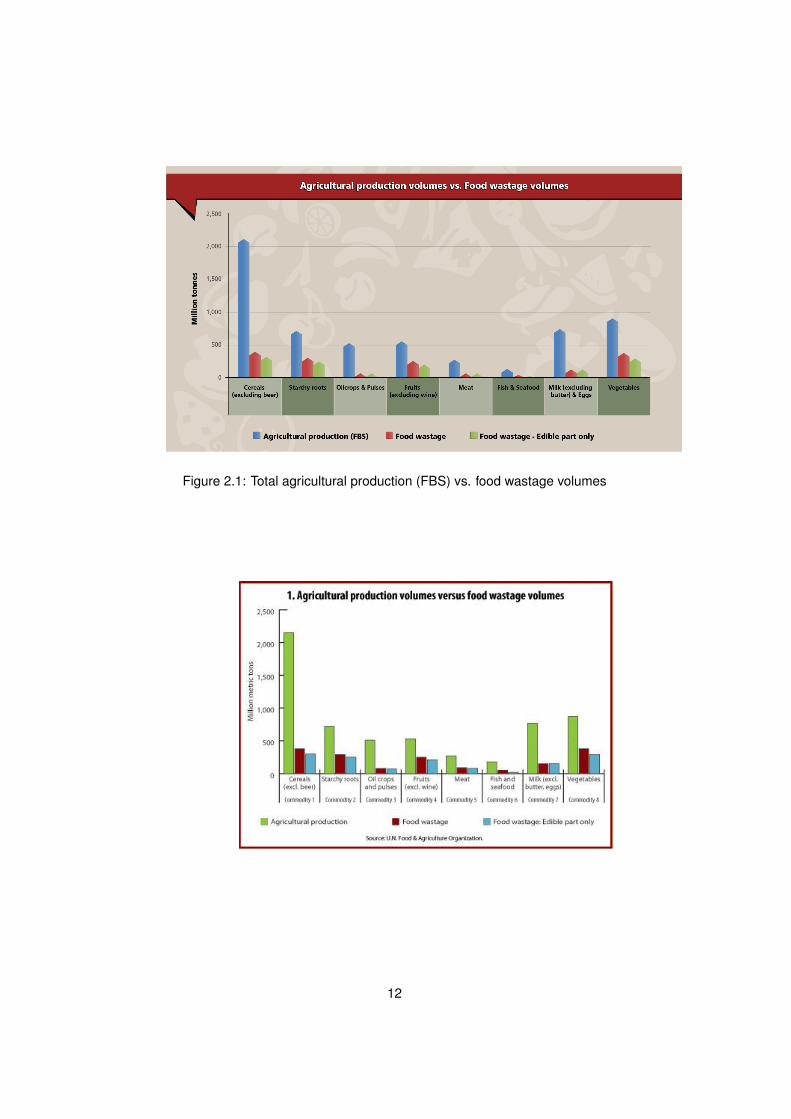
Figure 2.1: Total agricultural production (FBS) vs. food wastage volumes
Figure 2.2: Food wastage volumes, at world level by phase of the food supply
chain
12
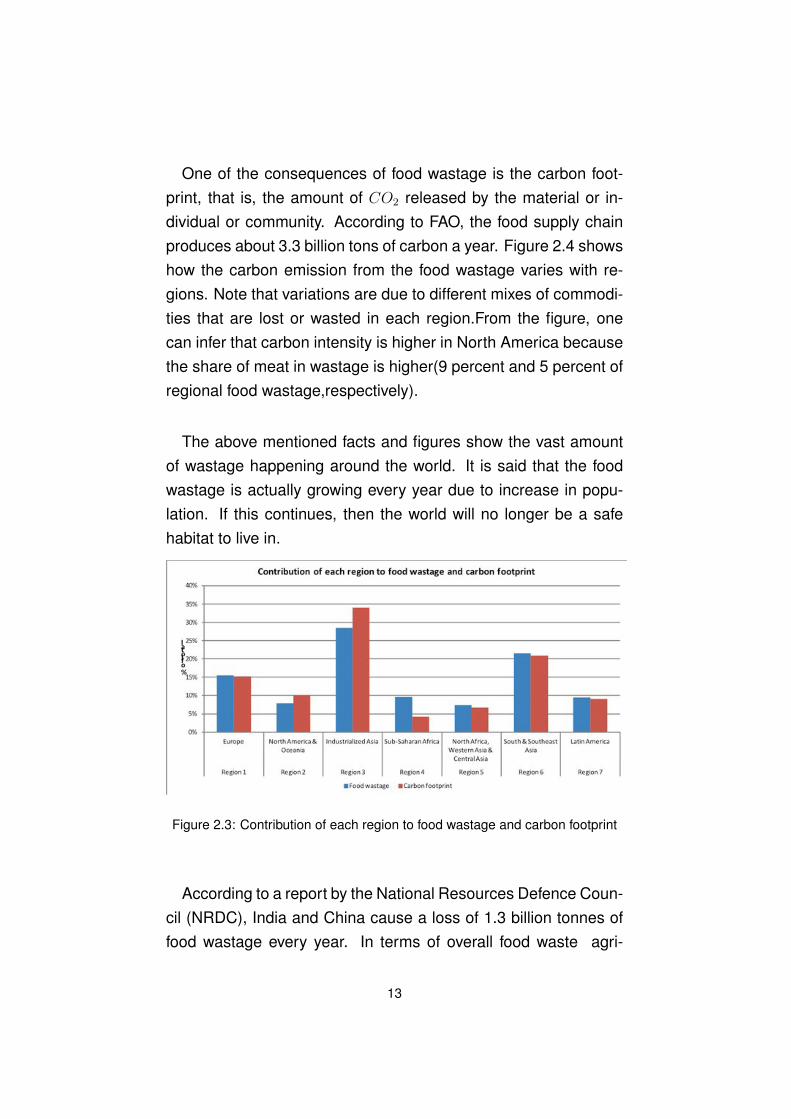
One of the consequences of food wastage is the carbon foot-print, that is, the amount of CO2 released by the material or in-dividual or community. According to FAO, the food supply chainproduces about 3.3 billion tons of carbon a year. Figure 2.4 showshow the carbon emission from the food wastage varies with re-gions. Note that variations are due to different mixes of commodi-ties that are lost or wasted in each region.From the figure, onecan infer that carbon intensity is higher in North America becausethe share of meat in wastage is higher(9 percent and 5 percent ofregional food wastage,respectively).
The above mentioned facts and figures show the vast amountof wastage happening around the world. It is said that the foodwastage is actually growing every year due to increase in popu-lation. If this continues, then the world will no longer be a safehabitat to live in.
Figure 2.3: Contribution of each region to food wastage and carbon footprint
According to a report by the National Resources Defence Coun-cil (NRDC), India and China cause a loss of 1.3 billion tonnes offood wastage every year. In terms of overall food waste agri-
13
cultural produce, poultry and milk India ranks seventh, with theRussian Federation at the top of the list.
Further a recent study conducted by Indian Institute of Manage-ment, Kolkata, revealed that only 10% of foods get cold storagefacility in India, this factor, accompanied by inappropriate supplychain management, has resulted in India becoming a significantcontributor towards food wastage.
The following articles about the food wastage in India give acrystal clear view of the wastage in India.
Deccan Herald. (Saturday 29 October 2016). Retrieved fromhttp://www.deccanherald.com/: http://www.deccanherald.com/india-wastes
India wastes Rs 44,000 cr worth food every year.
Posted on Saturday 29 October 2016, 6:49 PM IST.
Despite millions of Indians going to bed on a hungry stomach,the country is letting food worth a whopping Rs 44,000 crore gowaste each year due to lack of adequate storage infrastructure.
While the wasted fruits and vegetables alone was estimated atRs 13,300 crore, other food products like rice, wheat, serials andmeat are also allowed to perish without consumption.
14
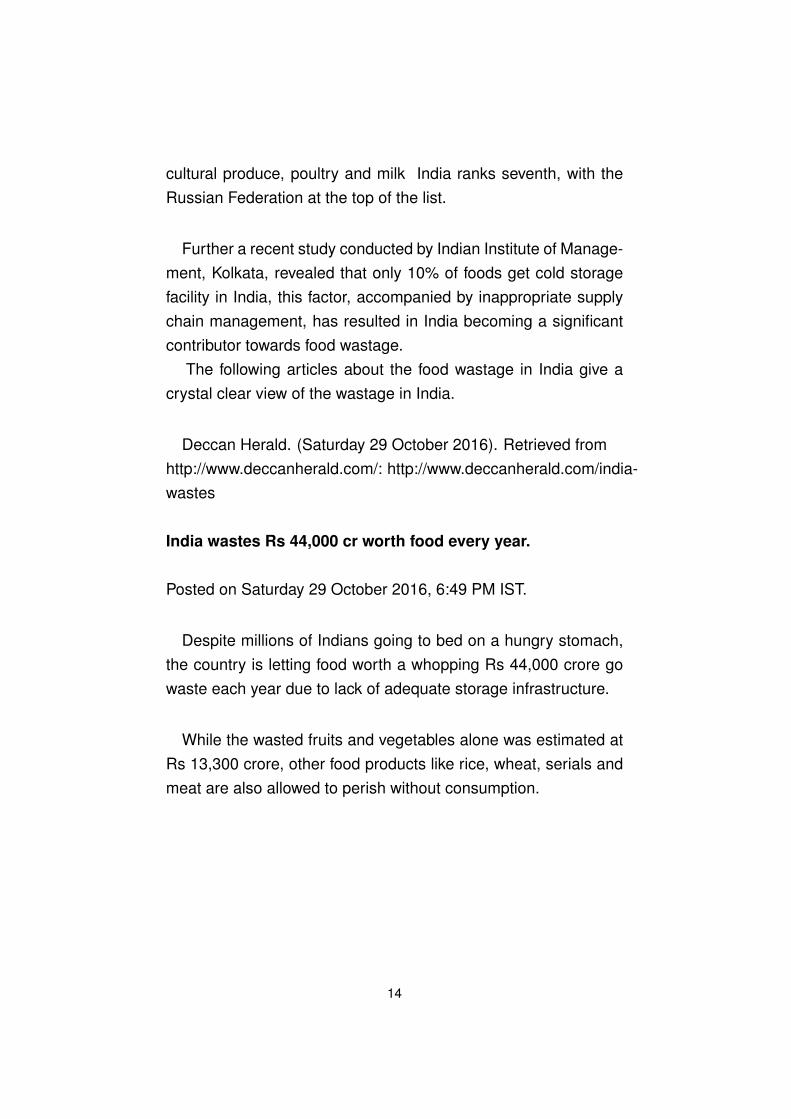
Figure 2.4: A picture showing damagaed sacks at a storage facility.
The minister claimed that the government has taken many stepsto encourage creation of additional storage capacity and compli-mented states that had taken more interest in efficient food stor-age. Despite these, he insisted that requirement for cold stor-age remains very high.The Saumitra Chaudhuri Committee, con-stituted by the Planning Commission in 2012, has estimated thecountrys cold storage requirement as 61.3 million tonne as againstthe present capacity of around 29 million tonne.
Food Minister K V Thomas told Deccan Herald that nearly 30%of the country’s fruits and vegetables perish due to lack of cold-storage facilities, while thousands of tons of food-grain rot in ill-equipped warehouses. Between 15 and 20% of cooked food
15
at weddings, parties or restaurants is wasted as well. ThoughThomas mooted the idea of introducing guest control system inmarriages to prevent wastage of food, it failed to take off due toaccusation from several quarters. India produces around 250 mil-lion tonne of foodgrain in a year, but its annual consumption re-mains far lower at 220 million to 225 million tonne. The countryhas failed to take advantage of the higher production levels as it isreported that more than 250 million people go to bed hungry eachday.Yet an another article shows the effect of food wastage on theeconomy of India.
The Hindu. (February 12, 2014). Retrieved fromhttp://www.thehindu.com/: http://www.thehindu.com//news/national/fci-admits-194-lakh-mt-foodgrain-wasted-between-200513.
FCI admits 1.94 lakh MT foodgrain wasted between 2005-13.
Posted on February 12, 2014, 17:00 IST.
As much as 1,94,502 metric tonnes of food grain worth croresof rupees was wasted in India due to various reasons between2005 and March 2013. The Food Corporation of India (FCI) hasgiven this information in reply to an RTI query sought by a city-based activist Om Prakash Sharma. He had filed an RTI querylast month and sought information about the food grain wastagein India, which he got on Tuesday.
The reply provided details of the region-wise and commoditywise stock accrued as non issuable (damaged) for each of theyears separately for the 23 regions in the country. The damagedstock which stood at 95,075 MT in 2005-06 came down to 3,148MT in 2012-13. The wastage was at 25,353 MT in 2006-07, 4,426
16
MT in 2007-08, and 20,114 MT in 2008-09, the report said. It alsosaid that of the damaged stock, around 84% (1,63,576 MT) wasrice and 14% wheat (26,543 MT).
Punjab with a total damage stock of 98,200 MT recorded 50% ofthe total damages, while Maharashtra recorded a total of 20,067MT of damaged stock, accounting for 10% of the total loss, thereport added.
The above articles shows the government’s inability to controlthe food wastage. It further shows the irresponsibility of citizenstowards the development of the country. These contributes notonly to the down-fall of the economy but also makes the standardof living of the poorer sections diminish.
Laws have been passed against wastage of food by SupremeCourt of India. The following article provides the information aboutthe law passed.
Tarun Jain. (September 5, 2010). Retrieved fromhttp://www.legalsperspective.blogspot.in/: http://legalsperspective.blogspot.in//no-food-waste-by-rotting.
No Food Waste by Rotting: Supreme Court.
Posted on September 5, 2010.
Don’t waste food by making it rot in the godown; better give itto the poor who don’t get a daily meal. This advice, even thoughquiet logical and sensible, has to come from no one less thanthe Supreme Court of the country in order for the Government toshake the slumber and think over it. Justive Dalveer Bhandari and
17
Justive Deepak Verma last week had to put the order in specificterms to ensure that the Government takes the directions seri-ously and not sit over it as a mere suggestion to the executive.The Bench specifically noted that “about 50,000 M.T. of wheathave already been deteriorated and is not fit for human consump-tion” and not just that but also that “several lakhs of Metric Tonnesof wheat which has been procured has not been properly pre-served”.
Justice Wadhwa, in the report of State of Orissa has mentionedthat the system of storage agency is one of the main thrust of di-version of PDS food-grains. This system should end forth-with.The State Corporation has adequate storage facilities and suffi-cient reserves. Some of the godowns which are owned by theCorporation have let out to storage agents. The Panchayat RajDepartment has six godowns of 15 M.T. Capacity and 300 godownsof 1000 M.T. Capacity. The Panchayat Raj Department and alsothe Urban Development Department may have more godowns ifrequired. This suggestion may also be considered by Union ofIndia and they must respond to it on the next date of hearing. Ac-cording to the report of the Food Commissioner, lakhs of boguscards are in circulation. According to a recent report of Times ofIndia, more than 2,50,000 bogus cards are in circulation in theState of Orissa alone. By a newspaper advertisement, a warn-ing be issued asking all the bogus card holders to surrender thebogus cards forthwith, in any event, within two weeks of the dateof advertisement, otherwise criminal prosecution may be initiatedagainst the bogus card holders.
It is necessary that we strive to develop a culture of zero toler-ance corruption. If urgent steps are not taken, the ultimate effectwill be on the poorest citizen who is deprived of legitimate enti-tlement for food-grains. We must ensure that every poor person
18
is provided with two square meals per day. Right now, one canonly hope that the Government will take note of the order and dowhat is necessary to ensure that food is, atleast, not wasted inthis country.
Speaking of consequences, one that comes instantly to mind ismalnutrition and starvation. Statistics of malnutrition and hungerin India describe the situation faced by the below poverty line peo-ple. As already said, no citizen, mainly a child should be subjectedto malnutrition. The following article speaks about the malnutritionand starvation in India and in kerala particularly.
Nazar Valiyedath. (November 4, 2015). Mathrubhumi. Re-trieved fromhttp://english.mathrubhumi.com/:http://english.mathrubhumi.com/news/kerala/tribal-kids-consuming-waste.
Tribal kids consuming waste: Probe ordered.
Posted on November 4, 2015, 6:47 PM IST.
Despite the Central and state governments spending crores forthe development of the community, Mathrubhumi had reportedthat the tribal kids were visiting the waste management centrein search of food.
According to the article, Minister P K Jayalakshmi has orderedthe District Scheduled Caste Development Department to conductan enquiry into the reports of tribal children consuming waste.
19
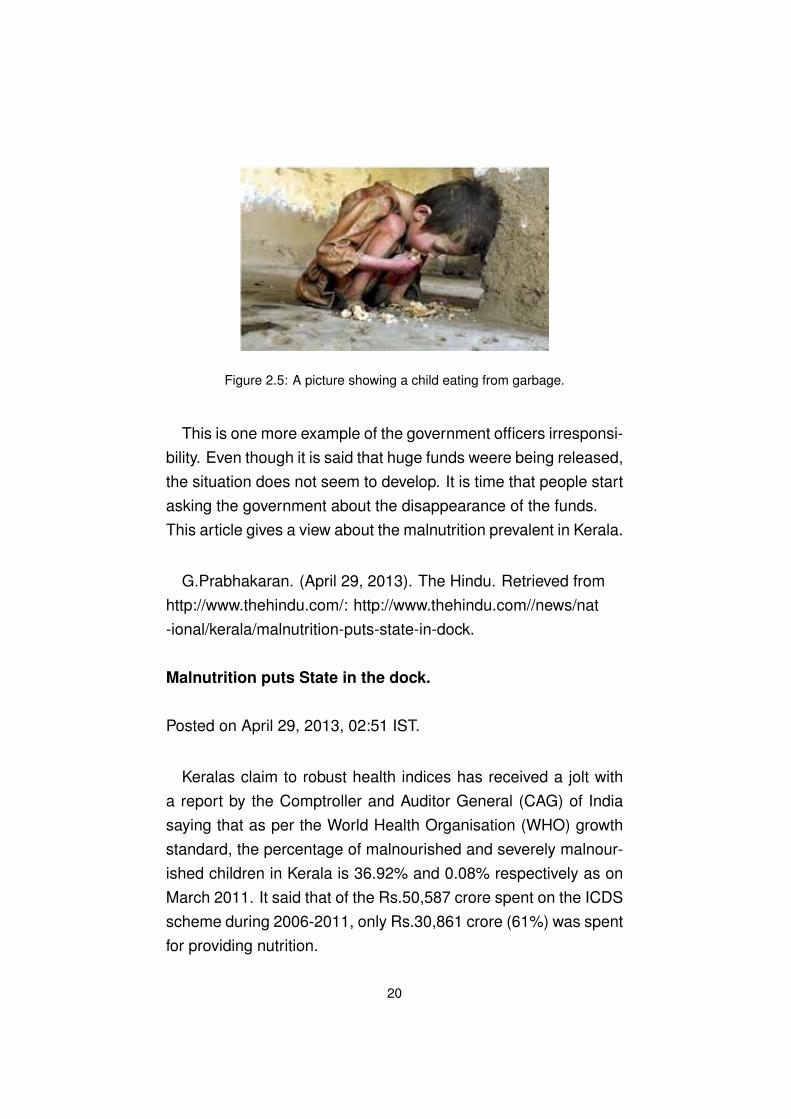
Figure 2.5: A picture showing a child eating from garbage.
This is one more example of the government officers irresponsi-bility. Even though it is said that huge funds weere being released,the situation does not seem to develop. It is time that people startasking the government about the disappearance of the funds.This article gives a view about the malnutrition prevalent in Kerala.
G.Prabhakaran. (April 29, 2013). The Hindu. Retrieved fromhttp://www.thehindu.com/: http://www.thehindu.com//news/nat-ional/kerala/malnutrition-puts-state-in-dock.
Malnutrition puts State in the dock.
Posted on April 29, 2013, 02:51 IST.
Keralas claim to robust health indices has received a jolt witha report by the Comptroller and Auditor General (CAG) of Indiasaying that as per the World Health Organisation (WHO) growthstandard, the percentage of malnourished and severely malnour-ished children in Kerala is 36.92% and 0.08% respectively as onMarch 2011. It said that of the Rs.50,587 crore spent on the ICDSscheme during 2006-2011, only Rs.30,861 crore (61%) was spentfor providing nutrition.
20
When studies were done on the children living in coastal vil-lage and non-coastal village in Kerala, it was found that both thecommunities suffer growth retardation. As mentioned in the re-search paper Nutrition Status of Children in Kerala. S.Rajasree.C.R.Soman the deficit in the weight of the body ranged from 3kg for non-coastal children to over 5 kg for the coastal children atthe age of 5 years. Further it was found out that the malnutritionstatus in the coastal part was worse.
Continuing with the literature, it is time we move onto our topicof consideration.As our study is restricted to our college, it is timethat the wastage in colleges are explored. We therefore presentthe following article showing the food statistics in a reputed col-lege. The statistics show that in the realm of this wastage evencolleges and educational institutions play a major role.
Yogita Rao. (November 27, 2015). The Times of India.Retrieved fromhttp://www.thetimesofindia.com/: http://www.thetimesofindia.com//city/mumbai/IIT-B-students-waste-around-950-kg-of-food-every-day.
’IIT-B students waste around 950 kg of food every day.
Posted on November 27, 2015, 11.14 PM IST.
Over 950 kg of food is wasted on an average in a day at IIT-Bombay, stated a report by the students’ magazine. The students,through an NGO, found the amount wasted at the institute dailycan feed 300 children. The report mainly blamed the wastage on“miscalculated estimates by caterers” and “students’ hopefulnessfor tasty food which more often than not turns out to be tasteless”.
21
Data compiled by the institute from 2011, which students quotedin the report, states the institute wasted 952 kg of food daily onan average. After 2011, most hostel messes were privatised, sowastage should have gone down. But with addition of two newhostels, it remains almost the same. The report added the ’it’s notmy problem’ attitude of students was responsible for the wastage.
It is usually thought that education brings great wisdom. Butthis article proves otherwise. When a uneducated person wastesfood, it can be thought of as the ignorance of that person. Butwhen the same thing happens with the so called youth, it is hardto digest. India is first in terms of the number of youth in the world,but the above article shows that this position is just for namesake.
A college student has various reasons not to turn up for mess.But the reason we normally hear is “The food is not tasty”. Itshould be kept in mind that “not tasty” does not imply that thequality of the food is bad. It is just that that person did not like it.It is also an other known fact that the present generation choosefast food over home made food. Hence it is necessary to showsome facts about the canteens and the ill effects they have.
August 1, 2013. India Today. Retrieved fromhttp://www.indiatoday.in/: http://www.indiatoday.in//story/kerala-co-llege-students-fall-ill-after-eating-canteen-food.
Kerala college students fall ill after eating canteen food.
Posted on August 1, 2013, 14:23 IST.
Food safety officials said the students of LBS Institute of Tech-nology for Women started vomiting and developed nausea after
22
eating lunch at the canteen.Thirty-one college students of LBSInstitute of Technology for Women were admitted to the hospitalon Thursday after they ate food at their college canteen.The offi-cials inspected the canteen and ordered a temporary closure as itwas found functioning under unhygienic conditions.
This shows the danger of eating food outside. It is a fashionthese days to eat junk food and fast food. They claim that theyare tasty, but less they know about the hygienic conditions in thatplace. A variety of ingredients are added to make the food tastyand that is what matters. This fashinable attitude has lead tohealth problems like obesity, acidity, stones in the kidney at a veryearly age.
The University grants Comission, popularly known as UGC, hasissued that the college canteens should follow certain rules andregulations. The following article gives a quick view regarding thismatter.
October 27, 2016. The Times of India. Retrieved fromhttp://www.thetimesofindia.com/: http://www.thetimesofindia.com//city/goa/College-canteens-must-meet-food-safety-rules-UGC/.
College canteens must meet food safety rules: UGC.
Posted on October 27, 2016, 03:01 IST.
The University Grants Commission (UGC) has issued a newcircular to state universities, asking them to ensure that canteen,messes and other food establishments in affiliated colleges meetthe provisions of the Food Safety and Standards Act 2006. Therequirement of the Act includes that the college canteens and
23
messes hold a valid license. Universities have also been asked toconduct training for food handlers in the college canteens in asso-ciation with the Food Safety and Standards Authority of India onthe importance of serving safe and wholesome food to studentsin colleges.
In 2012, when inspectors of directorate of food and drugs ad-ministration raided 10 college canteens, they found that neitherthe canteens nor the kitchens had the desired hygiene standardsand most operated without the mandatory food safety licence.
In 2015, when raids were done by Food Safety and StandardsAuthority of India (FSSAI) on some prominent bakeries, it wasfound that they are using banned food colours in their food prod-ucts.Raids revealed that these bakeries were adding monosodiumglutamate (MSG) in bakery products beyond permitted levels. Am-monium chloride was seized from certain bakeries. It was sus-pected to have been added to food products for longer shelf life.The chemical is not permitted for use in food articles and is harm-ful to health.
The recent news of Maggi making to the headlines because ofcontaining lead beyond permitted levels is yet another example.When the body stays fit, so will the mind. The mention of theabove articles does not in any way protest against food other thanhome made one. They are provided only with the view that not allthe food available out there is good for health. That the so calledtasty food need not be a quality one.
Having spent the past one year in this college, we could say withcertainity that the food provided in the mess does have quality,better than what is available outside. It might not be tasty in its
24
own way, but the problems faced by the students in other collegesare atleast not prevalent here. Providing quality food, free of cost,on the funds provided by government is something to appreciate.
Before concluding the literature review, an article is presentedon the initiative taken by a certain college in optimizing the foodwastage.
Swathi Chandra. (August 13, 2013). The Times of India.Retrieved fromhttp://www.thetimesofindia.com/: http://www.thetimesofindia.com//city/c/articleshow/21809181.
BHU students come up with ’Save Food’ initiative.
Posted on August 13, 2013, 11.15 PM IST.
Showing their concern over the food wasted as left over in plateswhich could otherwise be used as meal for millions of people, theIITians at Banaras Hindu University (BHU) have come up with a’Save Food’ initiative.Under this initiative, the students, throughtheir newly formed ’Green Club’ of the institute, will calculate thequantity of food wasted in the hostel mess of the institute everyday after lunch and dinner.
The statistics collected, henceforth till October 21, (along withflowcharts, diagrams and charts) will be displayed by the club inthe campus on October 22 during the commemoration of GreenDay by the club. The statistics prepared by the students will alsoinclude the number of under privileged people who could satisfytheir hunger from the amount of food that was wasted,“ the mem-bers informed.
25
According to the members, the aim behind this initiative was todecrease the amount of food wasted by students. ”Our main focusis on the food leftover in the already eaten platter. The untouchedfood left in the mess is eaten by the people of mess but the foodleft in the plates goes wasted and is served to cattle near thecampus. We are also making posters urging students to not wastethe food by taking only the amount of food that they would eat. Thedo’s and don’ts regarding food wastage will be communicated toeach students in the institute hostel,“ said the members.
It is not for sure that above said method will reduce the foodwastage in a significant amount. But it might be the foundation forsomething huge. It is important to bring awareness to studentsabout this food wastage. When awareness is brought people dofeel guilty when they dump their food.
All the literature mentioned so far gives information about thewastage of resources. In the present world, with such a high pop-ulation, it is necessary to use the reources efficiently and pro-ductively. The economic growth of a country depends on the ef-ficiency with which we use the resources. As mentioned in thetextbook for Economics, Economics is defined as
”The study of how societies use scarce resources to produce valu-able goods and services and distribute them among different indi-viduals“.
Given unlimited wants, it is important that an economy makesthe best use of its limited resources. Hence our study on thisproject has its own pupose both economically and ethically.
This kind of study might have been conducted in other collegestoo. But our study has a significat difference from the others. It is
26
said that when you earn, you know the pain behind spending lav-ishly. This applies for the other colleges.The studies done mightbe about the qualitative return of whatever they are spending. IISTprovides everything free of cost. The government provides fundsto the college. So speaking logically, it is the work of the govern-ment to ensure whether the funds are used judiciuosly or not. Butour motive is different from this point. We plan to provide the stu-dents with a new alternative so that the wastage can be reducedto some extent. This we are doing with the help of suggestions,surveys,opinion polls, informal interviews etc. This way we aretrying to help use the money lost because of wastage in someother necessary field. It is not that, that the contribution from thisfield will help in the construction of new hostels. But that someor other minor fields which are lagging behind due to insufficientfunds can be fulfilled.
27
Chapter 3
Opinions
Feel what it’s like to truly starve, and I guarentee that you’llforever think twice before wasting food.
Criss Jami
An informal interview is taken to know the opinions of the stu-dents about food. A set of 20 girls were taken with 5 studentscomprising from each year. Equal priority is given for both vege-tarians and non-vegetarians. Equal priority is considered for NorthIndians and South Indians also. In the same way, a set of 20 boyswere taken. The following list shows the opinions given by differ-ent students.
The majority of the opinions are as follows:
1. I don’t like to skip breakfast. But sometimes I skip lunch anddinner. This happens on thursdays mostly. I find that the foodsometimes is not cooked properly.
2. The breakfast time should be prolonged atleast upto 8.45 AMduring working days and 9.30 AM during weekends. Some-times I do come early but there will be a lot of queue due towhich I have to skip my breakfast.
28
3. Milk should be provided in the evenings also. During exams,breakfast timing should be extended upto 8.45 AM. Vadashould be replaced with some other snacks. I usually try tocomplete whatever food is in my plate.
4. Rawa kesari should be replaced. Dal is watery. Food shouldbe made more spicy. I dump the food in the bins if I dont likeit after tasting it.
5. I am cool with the time schedule. Although I think it would begreat if fruits are provided atleast thrice a week. I dump thefood which is left off in my plate after I am full.
6. I became bored with the food they are providing on the north-indian side. Kerala food is much more better. They have toincrease the number of people to atleast to 150. Curd tastessour most of the times. I seldom dump food in the bin.
7. Lunch should contain more varieties. Sambhar should be re-placed. I wake up late in the mornings. So I usually skipbreakfast during working days and have something in myroom only.
8. I do not see any other vegetables other than cauliflower, potato,ladies-finger in the curries. They need to provide other veg-etables also. Jilebi does not taste good.I do not take into myplate the items which I don’t like.
9. Leafy vegetables are not at all seen. The butter milk they givetastes spicy. I don’t take into my plate the food I don’t like.
10. Paneer curry can be done better. The chappathy they providein the afternoons is hard to eat. I dump the food when it doesnot taste good.
11. Carrots are not provided these days. Raitha also tastes soursome days. And this is why I might have to dump food.
29
12. The dal they provide on sundays does not have any taste.Bhindi fry is also not nice. It should be replaced. Pickles donot taste good. I often dump the food because some or theother curry is left untouched.
13. kerala parathas should be given twice a week. I hate comingto lunches. Mostly I prefer to eat outside for lunch. Koftacurry should be replaced.
14. Sometimes the idli tastes bad. Instead of butter, jam shouldbe there everyday. Sometimes I take food with the idea ofeating them, but at the end I cross my potential and I will bedumping them.
15. When i take kerala food, I usually don’t eat the curries theyprovide initially. And they serve too much sometimes. Once Icross my potential, I will dump them.
16. I like the custard they provide. Payasam should be providedtwice a week. Fruits other than banana should be providedon sundays alternatively.
17. The sweets they provided last year taste much better than theones they give now. In snacks, mysore bhaji has to replaced.And there’s just too much oil in vada.
18. Thursday menu should be changed. Other than that I am finewith the food they provide other days. I usually dump the foodleft after I am full.
19. The curry they provide on sunday should be provided twice aweek. Chappathy should be much more softer.
20. Gulab jamun is not cooked properly sometimes. Laddu shouldbe replaced.
21. Banana chips should be prrovided in the snacks.Sunday dosais not at all good.
30
22. On holidays, the mess timings should be extended.Pineappleshould not be there in the sweets. Food menu for lunchshould be changed.
23. Vegetarian special also contains only cauliflower. The pa-neer curry they provide in this category should be replaced.Noodles are watery most of the times. Salads should bechanged.
24. Coffee should be provided during snacks also. Sambharshould contain more vegetables. I dont like dumping food.I take into plate what I want only.
25. If carrots are not provided regularly, atleast they should bemade into a curry or added into one. Pickles are not good.Curries taste sweet sometimes.
The opinions listed above were considered for making a pie-chart. Opinions expressed ranged widely. Some of the studentswere also found to be pretty good with the food they get. But a lotof them agreed to dumping the food due to various reasons likethose expressed above.
31
Chapter 4
Survey
A survey is conducted to find out the likes and dislikes of thestudents regarding the food provided in the mess. A set of 60 stu-dents are taken for this purpose. 40 of them were non-vegetariansand 20 of them were vegetarians. Students from all the years andall the states are considered to get diversified views.
Students who undertook the survey are asked to rate the fooditems provided in the mess on a scale of 1 to 10 which then ismade into three parts for the survey. Food products which wererated between 1 to 5 were considered to be disliked by them.While those equal to 5 and between 5 to 7 were considered tobe average in their taste and given the category of no opinion.Ratings which are equal to 7 and greater are considered to beliked by those rated.
Students were asked to mention the frequency of their eatingfood outside otherr than mess. It is found that 80% of the peopleprefer to eat food in the mess. While the rest complained aboutthe lunch, breakfast, dinner not being good on certain days andhence choosed food other than the one provided in mess. Al-though there are other reasons like waking up late in the morn-ings, some unforeseen urgent work etc. But the statistics are
32
not completely up to their mark because only 60 students wereconsidered and there might certainly be a large deviation in thisaspect.
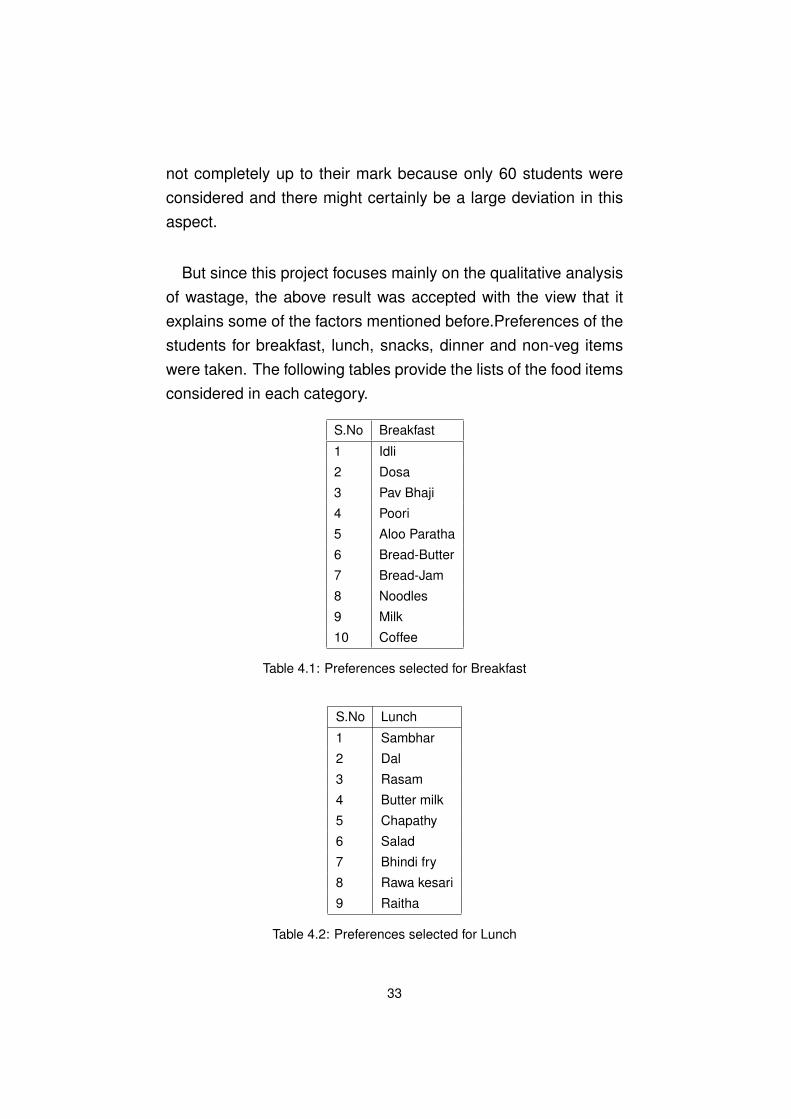
But since this project focuses mainly on the qualitative analysisof wastage, the above result was accepted with the view that itexplains some of the factors mentioned before.Preferences of thestudents for breakfast, lunch, snacks, dinner and non-veg itemswere taken. The following tables provide the lists of the food itemsconsidered in each category.
S.No Breakfast
1 Idli
2 Dosa
3 Pav Bhaji
4 Poori
5 Aloo Paratha
6 Bread-Butter
7 Bread-Jam
8 Noodles
9 Milk
10 Coffee
Table 4.1: Preferences selected for Breakfast
S.No Lunch
1 Sambhar
2 Dal
3 Rasam
4 Butter milk
5 Chapathy
6 Salad
7 Bhindi fry
8 Rawa kesari
9 Raitha
Table 4.2: Preferences selected for Lunch
33
S.No Snacks
1 Tea
2 Burger
3 Bhel puri
4 Veg puff
5 Chilli/Banana pakoda
6 Samosa
7 Vada
8 Mysore bhaji
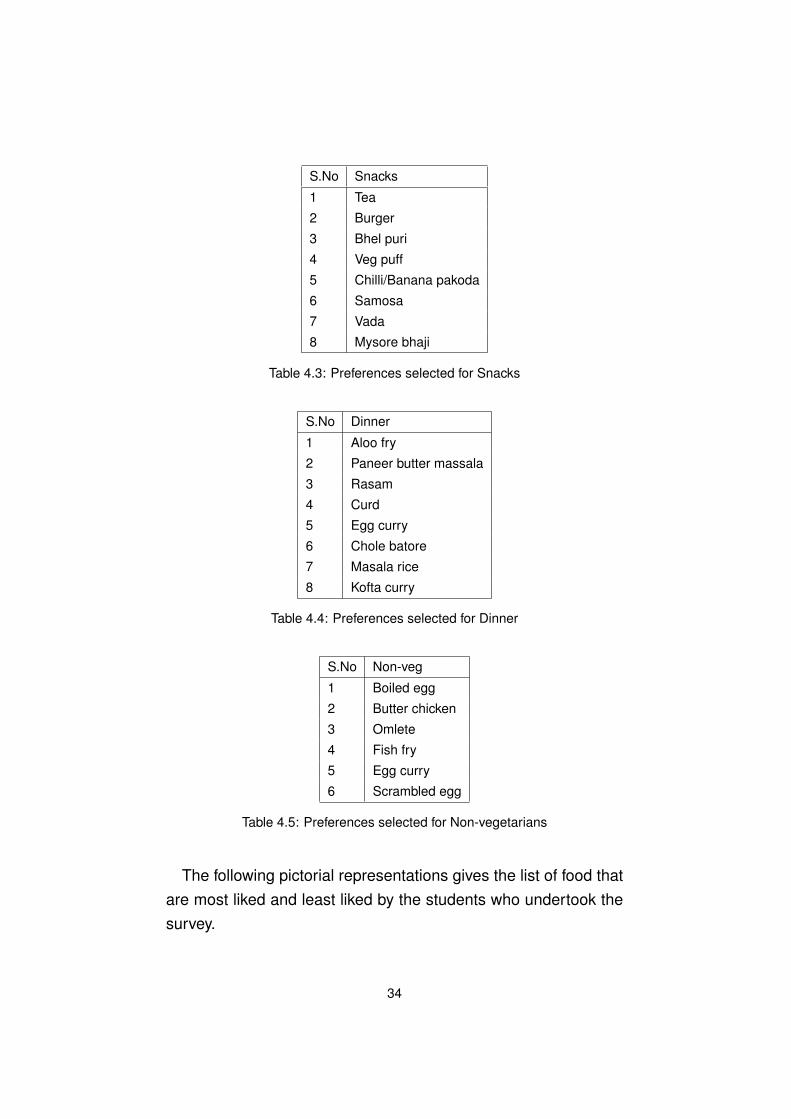
Table 4.3: Preferences selected for Snacks
S.No Dinner
1 Aloo fry
2 Paneer butter massala
3 Rasam
4 Curd
5 Egg curry
6 Chole batore
7 Masala rice
8 Kofta curry
Table 4.4: Preferences selected for Dinner
S.No Non-veg
1 Boiled egg
2 Butter chicken
3 Omlete
4 Fish fry
5 Egg curry
6 Scrambled egg
Table 4.5: Preferences selected for Non-vegetarians
The following pictorial representations gives the list of food thatare most liked and least liked by the students who undertook thesurvey.
34
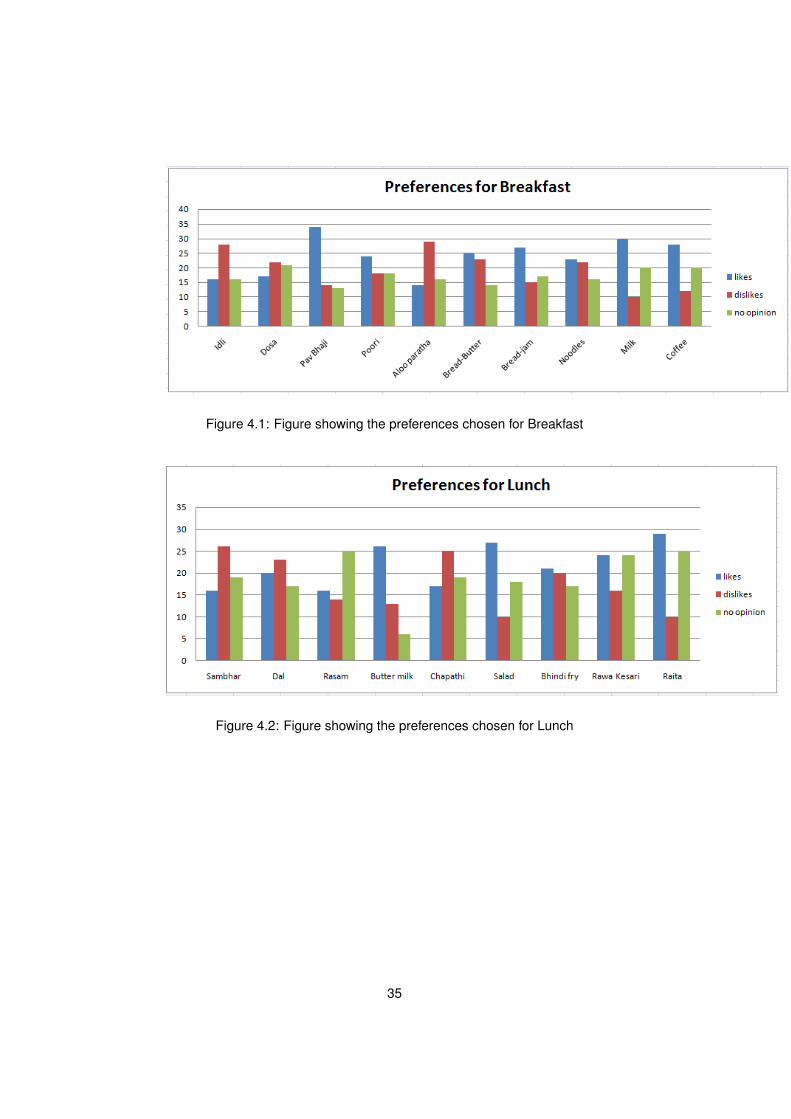
Figure 4.1: Figure showing the preferences chosen for Breakfast
Figure 4.2: Figure showing the preferences chosen for Lunch
35
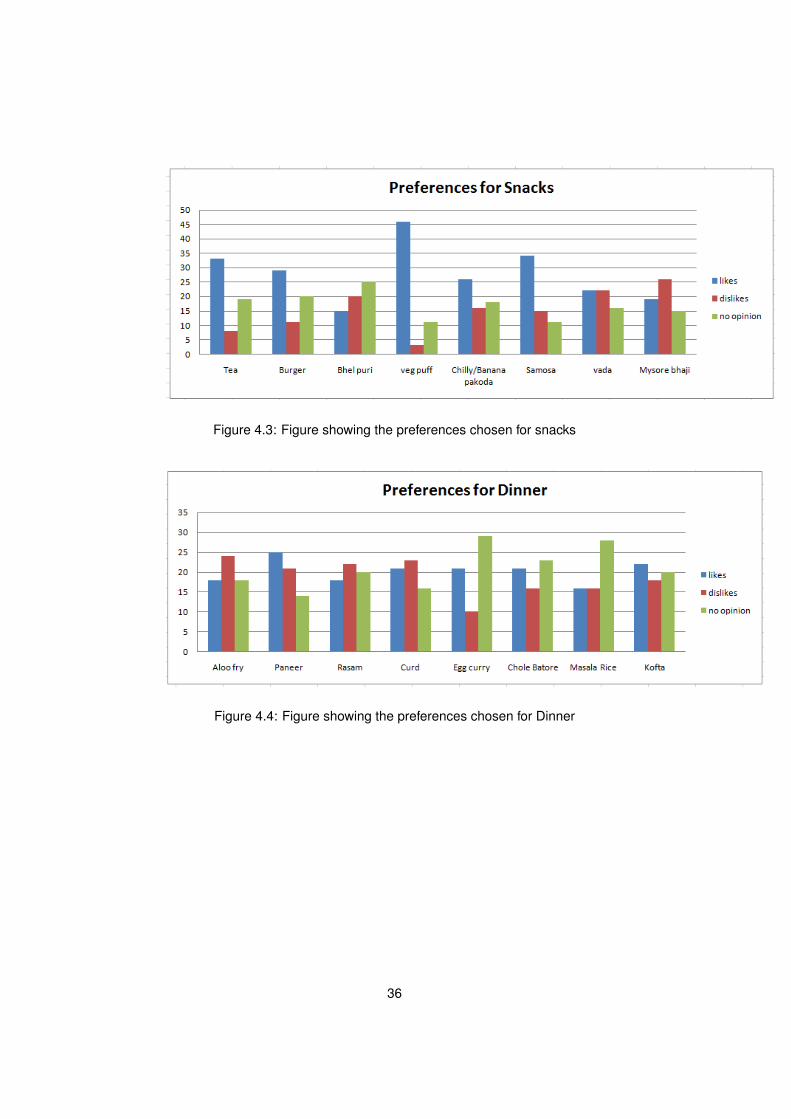
Figure 4.3: Figure showing the preferences chosen for snacks
Figure 4.4: Figure showing the preferences chosen for Dinner
36
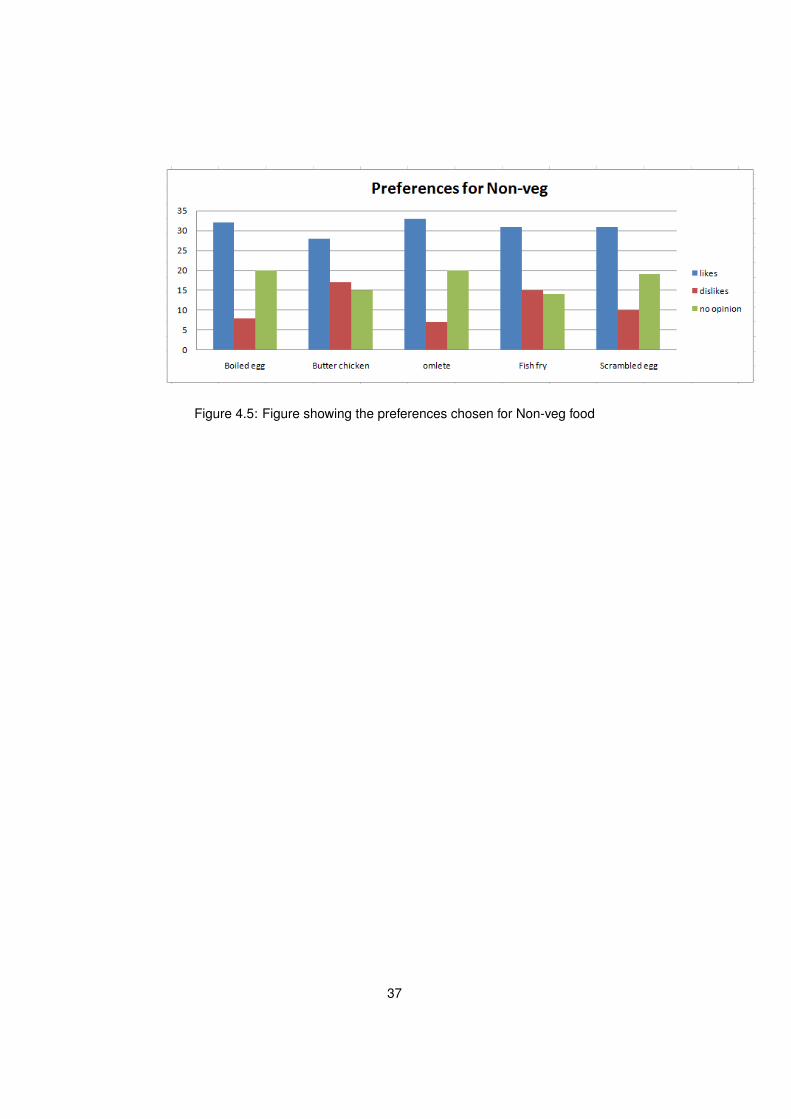
Figure 4.5: Figure showing the preferences chosen for Non-veg food
37
Chapter 5
Opinion Poll
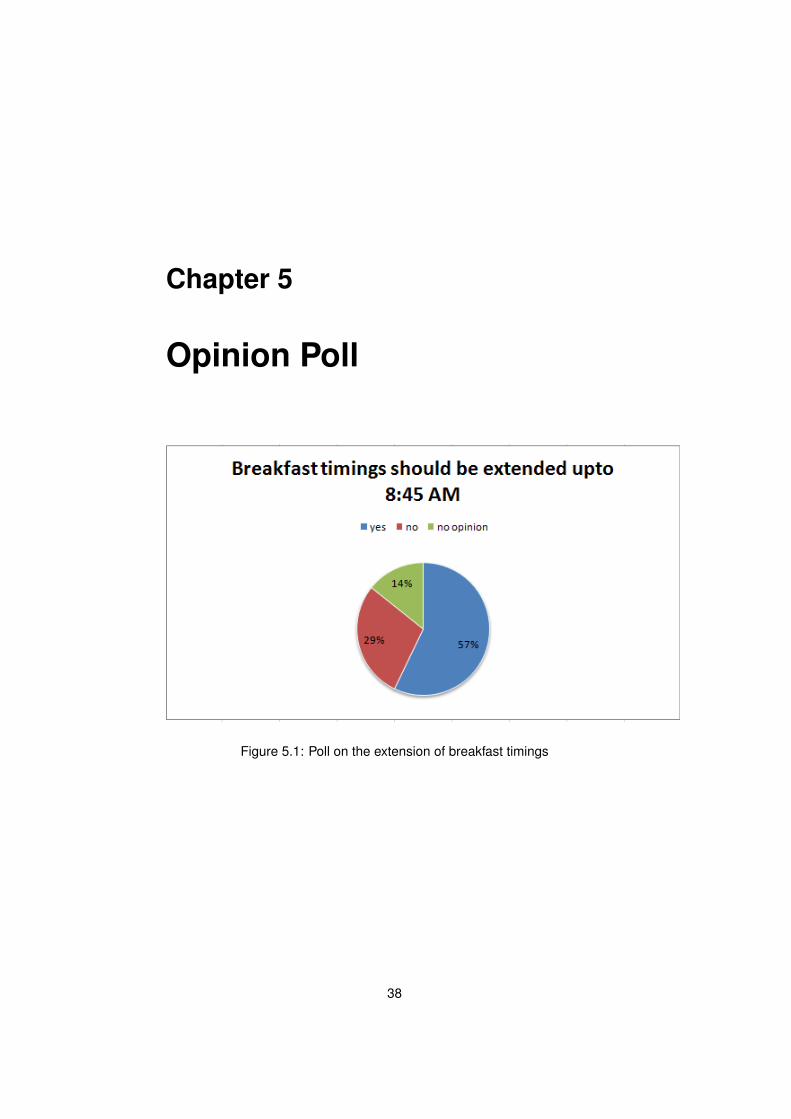
Figure 5.1: Poll on the extension of breakfast timings
38
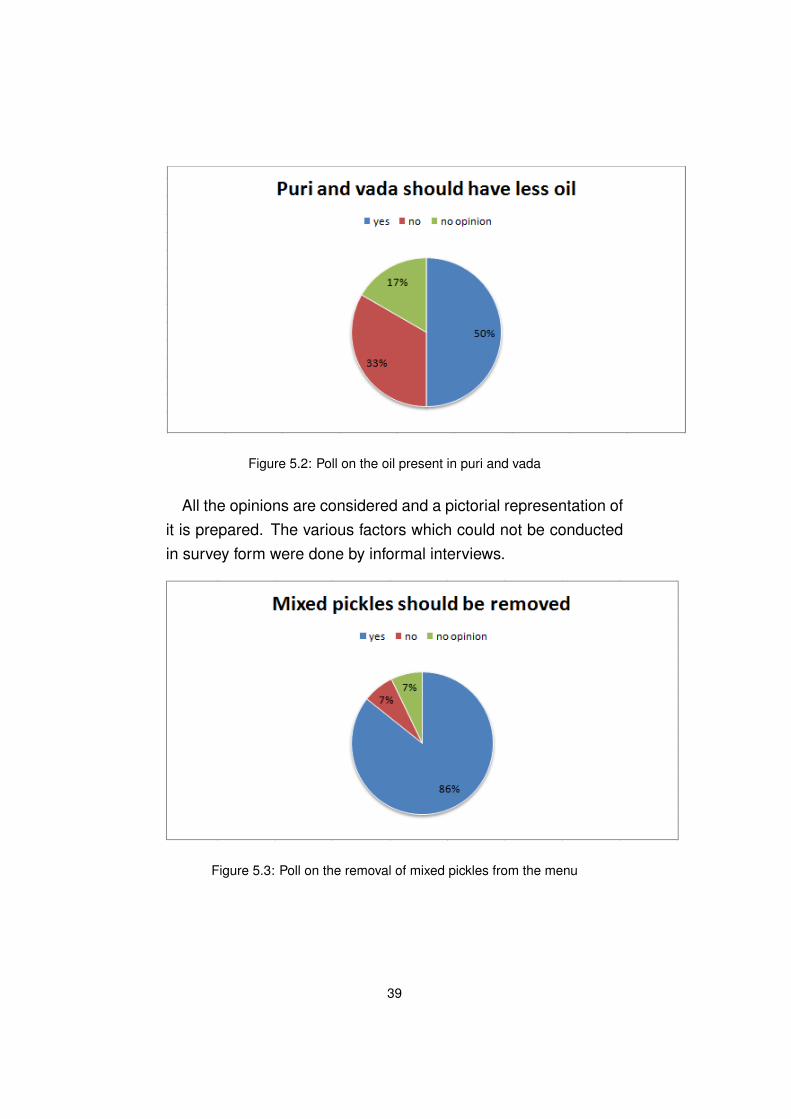
Figure 5.2: Poll on the oil present in puri and vada
All the opinions are considered and a pictorial representation ofit is prepared. The various factors which could not be conductedin survey form were done by informal interviews.
Figure 5.3: Poll on the removal of mixed pickles from the menu
39
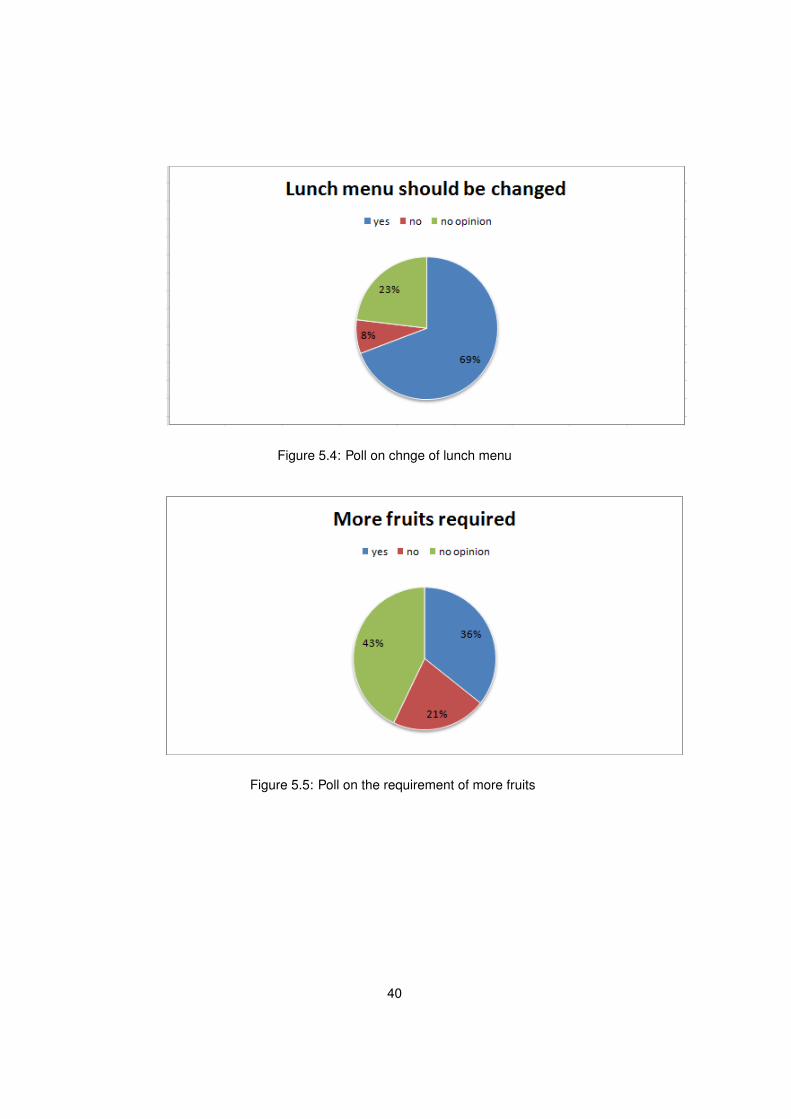
Figure 5.4: Poll on chnge of lunch menu
Figure 5.5: Poll on the requirement of more fruits
40
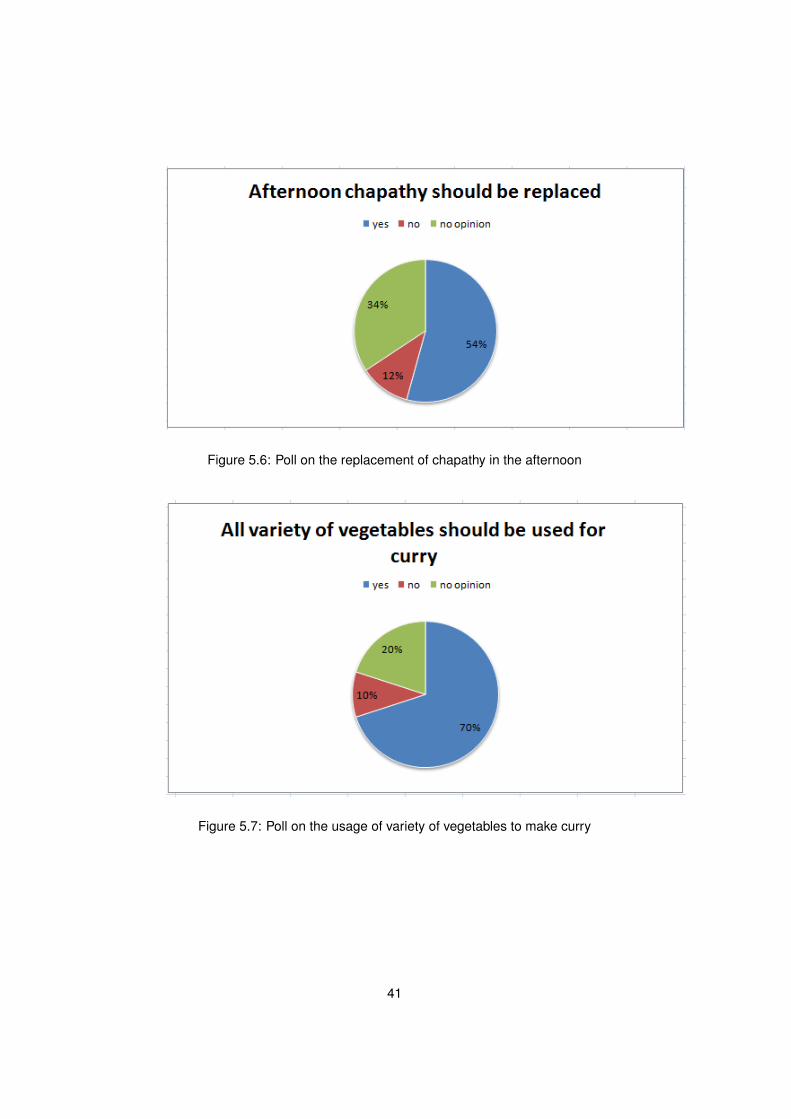
Figure 5.6: Poll on the replacement of chapathy in the afternoon
Figure 5.7: Poll on the usage of variety of vegetables to make curry
41
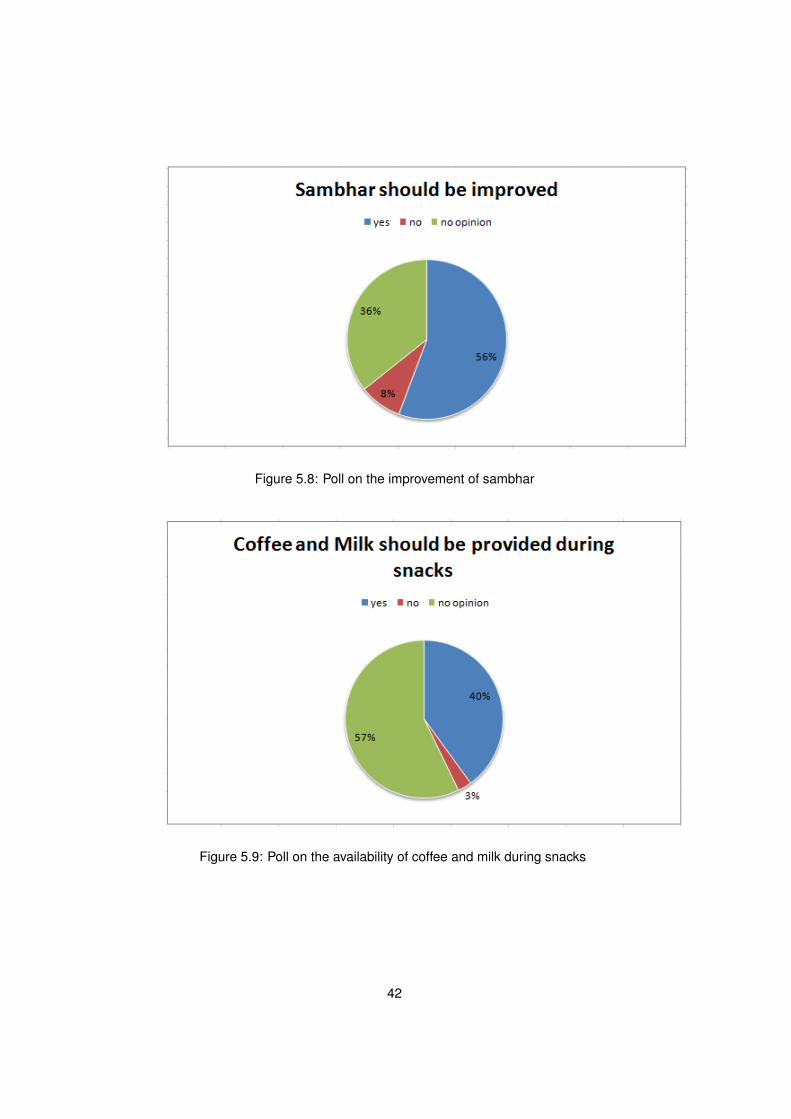
Figure 5.8: Poll on the improvement of sambhar
Figure 5.9: Poll on the availability of coffee and milk during snacks
42
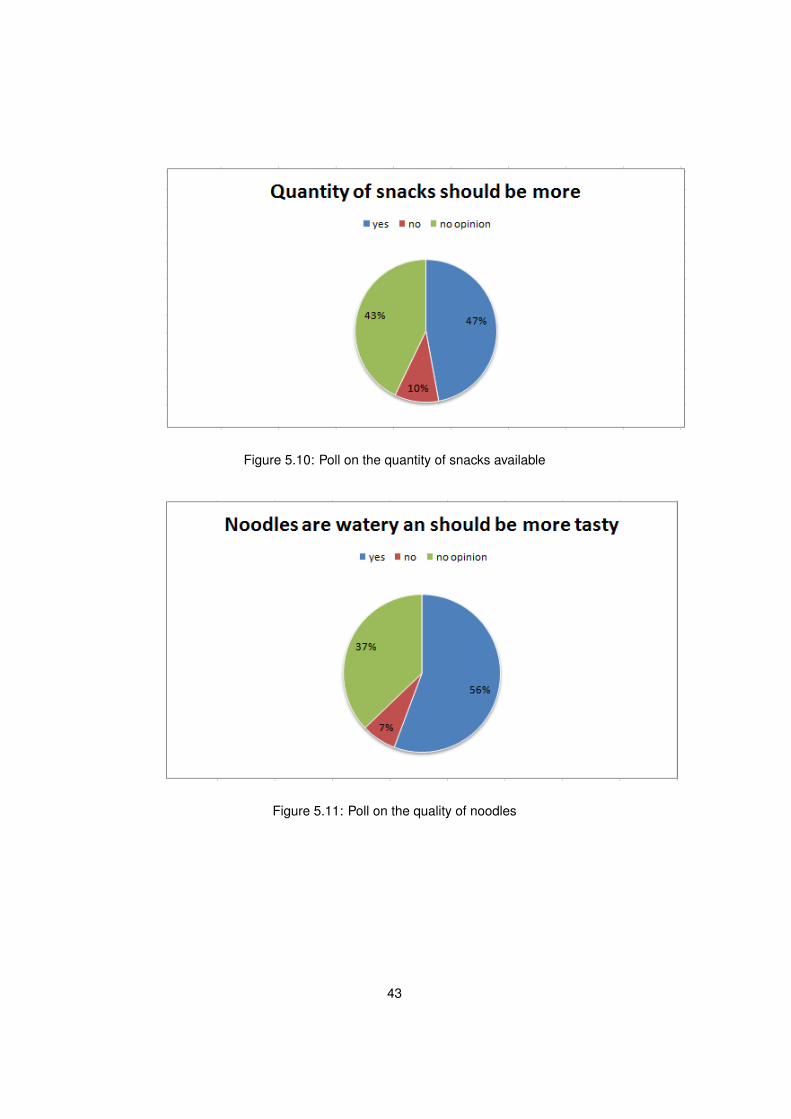
Figure 5.10: Poll on the quantity of snacks available
Figure 5.11: Poll on the quality of noodles
43
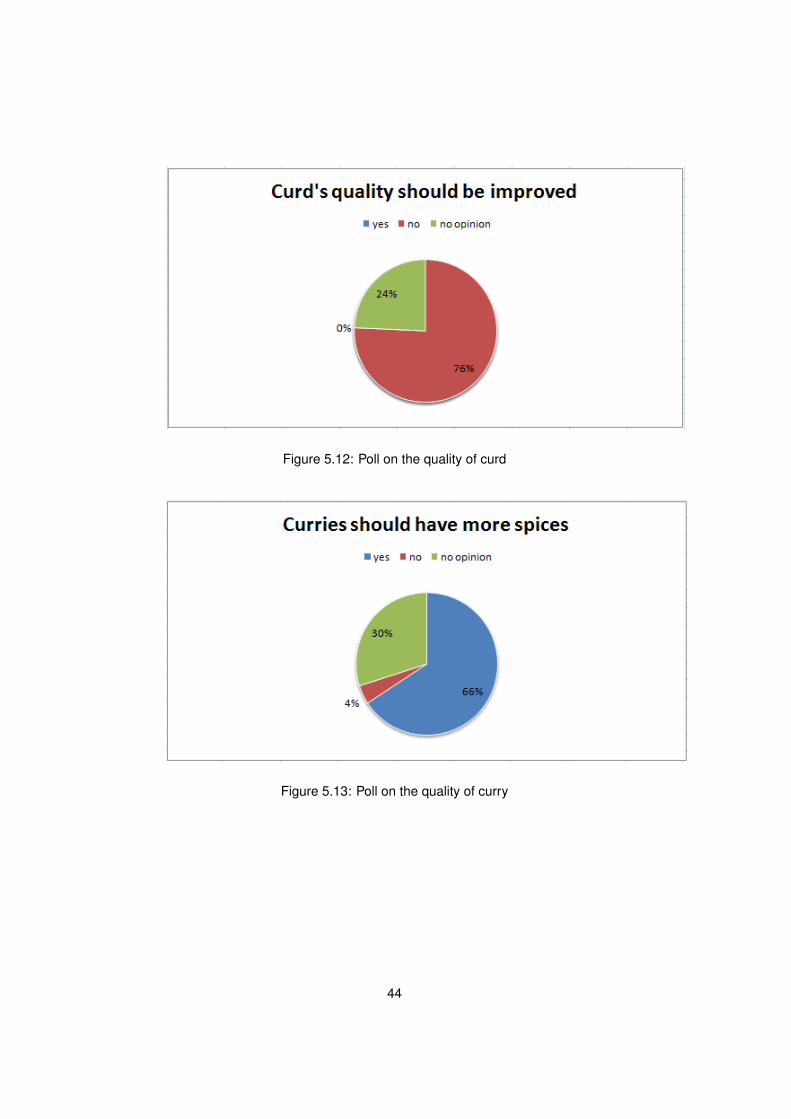
Figure 5.12: Poll on the quality of curd
Figure 5.13: Poll on the quality of curry
44
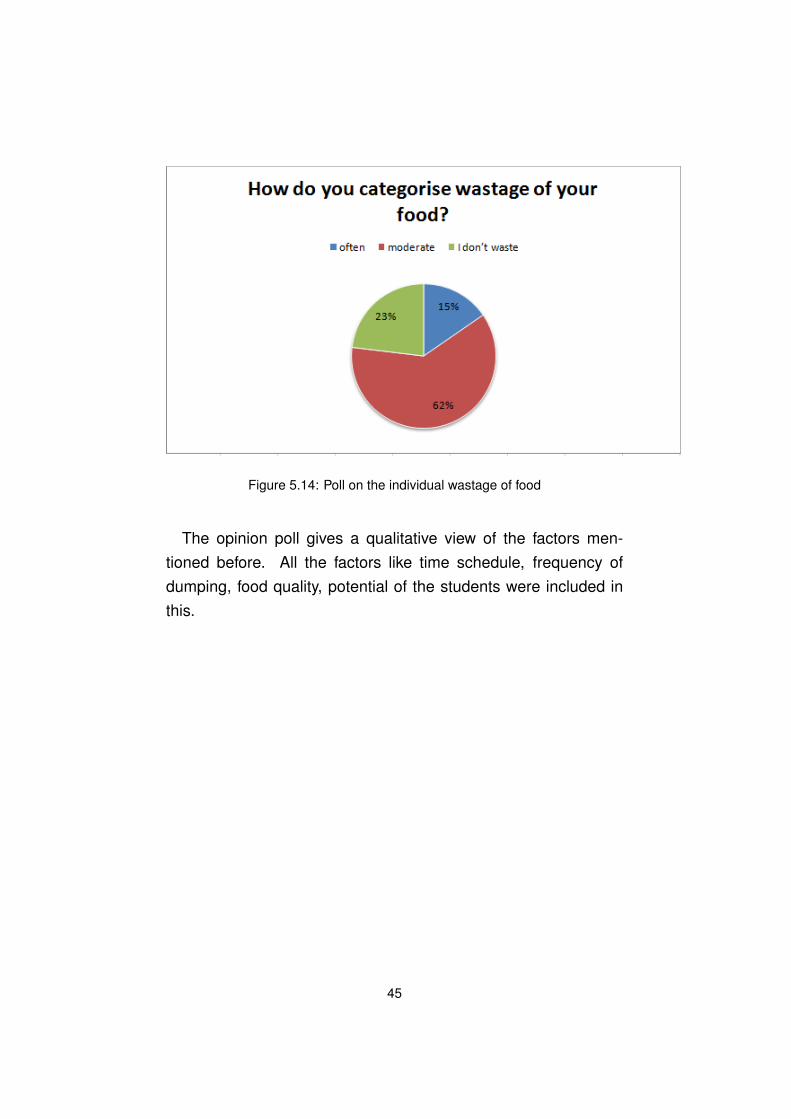
Figure 5.14: Poll on the individual wastage of food
The opinion poll gives a qualitative view of the factors men-tioned before. All the factors like time schedule, frequency ofdumping, food quality, potential of the students were included inthis.
45
Chapter 6
Statistics
The following table provides the statistics of food wastage inmess on some of the days. this shows that wastage of food ispresent. Only a normal working week was taken into considera-tion.
46
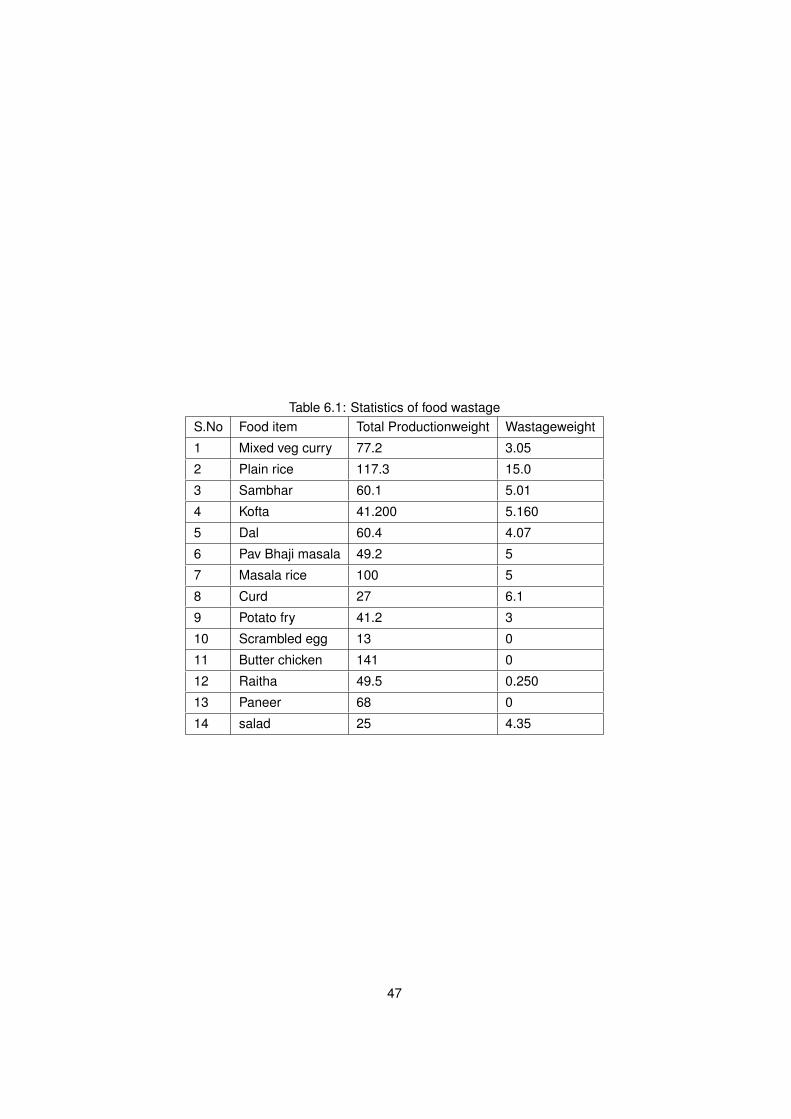
Table 6.1: Statistics of food wastageS.No Food item Total Productionweight Wastageweight
1 Mixed veg curry 77.2 3.05
2 Plain rice 117.3 15.0
3 Sambhar 60.1 5.01
4 Kofta 41.200 5.160
5 Dal 60.4 4.07
6 Pav Bhaji masala 49.2 5
7 Masala rice 100 5
8 Curd 27 6.1
9 Potato fry 41.2 3
10 Scrambled egg 13 0
11 Butter chicken 141 0
12 Raitha 49.5 0.250
13 Paneer 68 0
14 salad 25 4.35
47
Chapter 7
Analysis
The analysis of the surveys obtained give some interesting views.When opinion poll was taken, majority of them complained aboutparticularly the lunch menu in IIST. Students expressed their grievanceon the breakfast timing. It was found that even though there werelarge number of dislikes for certain dishes, people did turn up tohave some amount of breakfast, may be in the form of bread andmilk. The wastage in breakfast would spring from the reason ofpeople getting up late. When enquired about the reason behindthis, the major reason was found to be the workload given eachday. Reasons like regular sleeping habits were also heard. Thishabit was most particularly seen during holidays and exams.
Dinner was said to be moderate. But people had their opin-ions on dishes provided certain days in dinner like some said theyprefer to eat outside on thursday nights. This was the reason ofwastage in food. Saturdays and sundays people preferred to eatoutside like in paratha shops. Strangely, 25% of the people chosethe preference of hostel cooking than eating in the mess. 28% ofthe people prefered to eat in canteen, paratha shop during work-ing days.
48
The surveys included all the years. But first years were includedmore. When their responses were analysed many of them pref-ered to eat in the mess. But when the second year students re-sponse was seen, many of them chose paratha shop, hostel cook-ing, canteen over mess. Also when the first years rated the dishesfrom 5 to 10. Second years and the other senior years hardly gaveratings from 5 to 10. Such a sudden deviation from the ratings injust one year might be due to the fact that people got ored of thefood provided. This was because when they were new to the col-lege, since many of the dishes are unknown to them before, theytook a liking to it. Also students in first year dont know much aboutthe other alternatives present. This was not the case with senioryears. Hence the deviation in ratings.
Analysing the preference for breakfast first, Idli was said to bedisliked more. It had likes and no opinion on the same level. Whenasked about their opinions on Idli, many people complained aboutthe chutney and sambhar provided. Also some times the idli wasfound to be of different taste.
Strangely, dosa was disliked more than it was liked. Almostsame number was between dislikes and no opinion. Dossas pro-vided on sunday were very thin and some of them were burntexcessively. Hence the deviation.
Interestingly, poori also was liked more and it had a tie betweendislikes and no opinion. as mentioned before, students from firstyear gave a high preference for poori when it was quite oppositewith senior years. As assumed, aloo paratha was disliked more.Bread-butter and Noodles had almost the same number in termsof likes, dislikes and no opinions. it should be noted that thoughthere were opinions on noodles being watery, it had more likes
49
than dislikes. Bread-jam, Milk and coffee had more number oflikes.
Sambhar, dal and chapathi had more dislikes than likes. Onthe other hand rasam had more number of no opinions in its list.Strangely, people were comfortable with rawa kesari. Bhindi frywas also seen to be almost equal in its three preferences.
Snacks other than vadda and mysore bhaji were seen to beliked more. Vada had equal likes and dislikes. But mysore bhajiwas seen to be disliked more. People complained that it is sweetand it is hard to tear it also. Some even joked it of having ”highYoung’s modulus“.
Dinner was seen with 50% of the dishes being registered withno opinions. As assumed curd had dislikes more than likes. Com-plaints were heard on this aspect that quite often the curd wassour in taste. Aloo fry was also dislike more than it was liked.There were opinions that it does not go with rice. Strangely rasamencountered more number of dislikes than likes. Although samerasam was provided in afternoon and evening, there were differ-ences in opinions. All the non-vegetarian items were liked more.
From the statistics of food wastage in the mess, it is evident thatsambhar, dal were being wasted. Non- veg items encountered aminimal percent of wastage. Paneer had a minimal amount ofwastage.
Analysing opinion poll, larger percentage voted for breakfasttimings to be extended till 8:45 AM. While there was larger perce-natge of no opinion for more fruits to be present. 70% of the peo-ple opted for more variety of vegetables to be used for curry. Also
50
56% voted for the imrovement of sambhar. 76% collectively votedfor the quality of curd to be improved, while 0% spoke againstit. All in all the opinions and survey showed the negatives andpositives of food in the mess.
51
Chapter 8
Suggestive measures
The following table shows the quantity of food items and theirrates on 04/10/2016 in IIST. Refer table 8.1.
From the table, it is evident that a large quantity of food itemswere bought to college. On an average, 1 kg of rice can be eatenby 7 people. Therefore, it is necessary that left over food not besent to bio-gas plant.
An Amarak study in 2008 found when college dining halls gotrayless for a day, food waste is decreased 25 to 30 percent perperson. The study also found that going trayless lowers not onlyfood waste removal costs, but also the cost of water, energy, andcleaning supplies used when cleaning the trays.
Another food waste study in 2013this time by a group of LeanSix Sigma students at the Rose-Hulman Institute of Technolo-gyshares a few other tips to reduce food waste on college cam-puses. The students found that simply educating students andstaff about food waste, providing smaller serving utensils, pre-dishing more foods, and limiting the number of dishes the stu-dents uses can reduce each students food waste by 2.66 ouncesper mealtotaling 145.4 pounds less food waste per lunch period.
52
That one-third of the food produced annually for human con-sumption is wasted is in itself unconscionable in a world where870 million, or one in eight people, go hungry every day. The left-over food can be packed into bags and sent to nearby orphan-ages/ old age homes ratherr than making them into a compost.This is a tire some practice, but places nearby the college can beselected for this purpose or a contract with an organization canalso be done. As food is cooked at that moment, it remains freshfor a certain time. The same is true for the salads and the curries.
For food to be not sent to bio-gas plant or to farms, the first stepshould be the decrease in the left-over food. This can be doneby having a feed-back every semester about the opinions of thestudents on food and implementing the most possible cases. Assaid in the articles above providing small size plates can also bea solution. An other way, can be, asking the B.Tech students topay for their mess fees atleast. This is because as the M.Techstudents pay for their mess fess and the relative wastage for themis seen for them is less.
An other way, can be by having a contract with the paratha shopperson or the canteen person to serve food in the mess for a cer-tain day also decreases the food wastage and keeps in check thehealth of the students. As a famous quote says,”If there is a will,there is a way“, only if the college takes initiative, then the foodwastage can be reduced. This might be hard in the starting butlater the results will be fruitful.
53
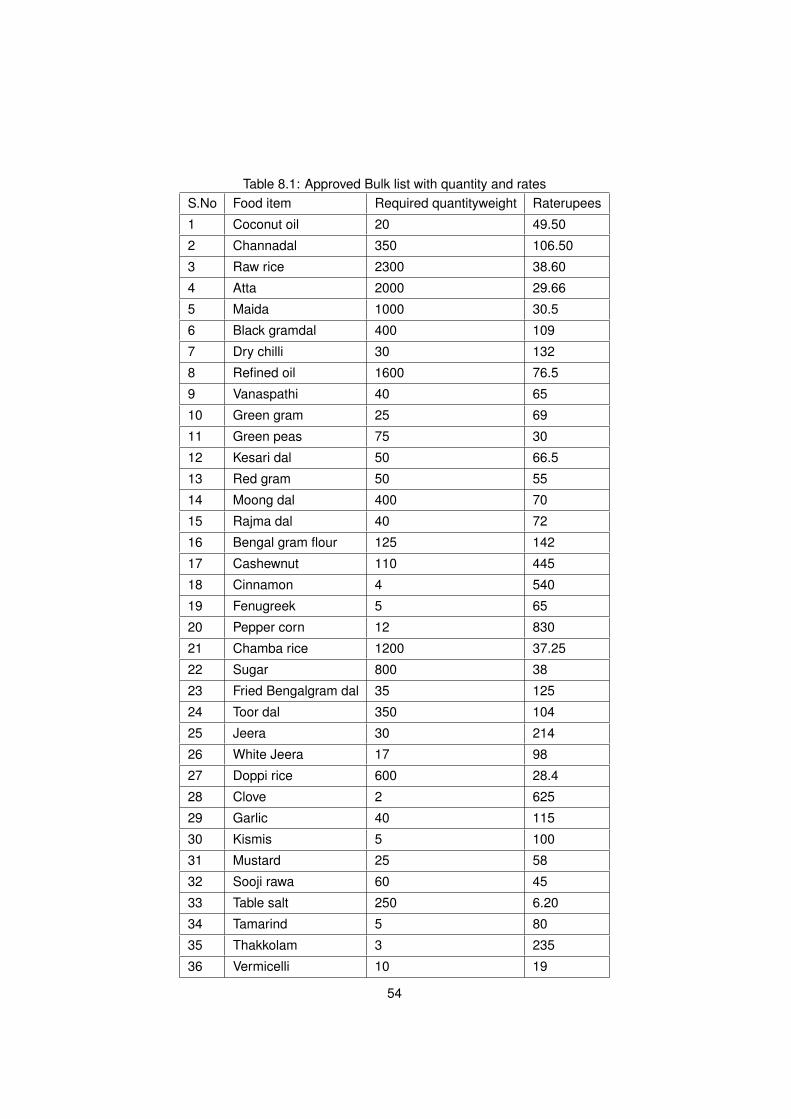
Table 8.1: Approved Bulk list with quantity and ratesS.No Food item Required quantityweight Raterupees
1 Coconut oil 20 49.50
2 Channadal 350 106.50
3 Raw rice 2300 38.60
4 Atta 2000 29.66
5 Maida 1000 30.5
6 Black gramdal 400 109
7 Dry chilli 30 132
8 Refined oil 1600 76.5
9 Vanaspathi 40 65
10 Green gram 25 69
11 Green peas 75 30
12 Kesari dal 50 66.5
13 Red gram 50 55
14 Moong dal 400 70
15 Rajma dal 40 72
16 Bengal gram flour 125 142
17 Cashewnut 110 445
18 Cinnamon 4 540
19 Fenugreek 5 65
20 Pepper corn 12 830
21 Chamba rice 1200 37.25
22 Sugar 800 38
23 Fried Bengalgram dal 35 125
24 Toor dal 350 104
25 Jeera 30 214
26 White Jeera 17 98
27 Doppi rice 600 28.4
28 Clove 2 625
29 Garlic 40 115
30 Kismis 5 100
31 Mustard 25 58
32 Sooji rawa 60 45
33 Table salt 250 6.20
34 Tamarind 5 80
35 Thakkolam 3 235
36 Vermicelli 10 19
54
Chapter 9
Conclusion
The first hypotheses considered was ”The supply of food andits consumption are not in equilibrium due to factors like taste ofindividual, time schedule of mess, the quality of food, potential ofthe students, better alternatives and other factors“.
The survey and opinion polls justify this fact clearly. Basedon the statistics obtained from the mess it is clear that there iswastage in food. And also the survey and opinion polls clearlyshow this fact. Hence we can conclude from this fact that all thefactors listed do play an important role in the wastage of food.
The second hypotheses considered was ”The disposal of wastefood or left-over food into bio-gas or to the farms is not the onlysolution to treat this problem efficiently.
This is proven by the suggestive measures listed. But for this tohappen the mess officials have to take an initiative. It is evidentthat there are certain ways which can be possible like the feedback everry semester. This sure does reduce the food wastage ina significant amount. When the food is utilised properly and cor-rect measures are taken, then there will be no need to send it to
55
the farms. In this way, there can be two profits, one the food beingeaten properly. Two, the development of the college happening.
This is but a small veenture taken by us in order to make ourcollege more developed. There can be many more possible waysto solve this problem and move in the path of development.
56
Chapter 10
Appendix
The appendix consists of the majority of the ratings given bystudents for the dishes selected on a sacle of 1 to 10 with 1 beingthe least liked one by the student and 10 being the most liked bythat student. The following table provides the detail.
57
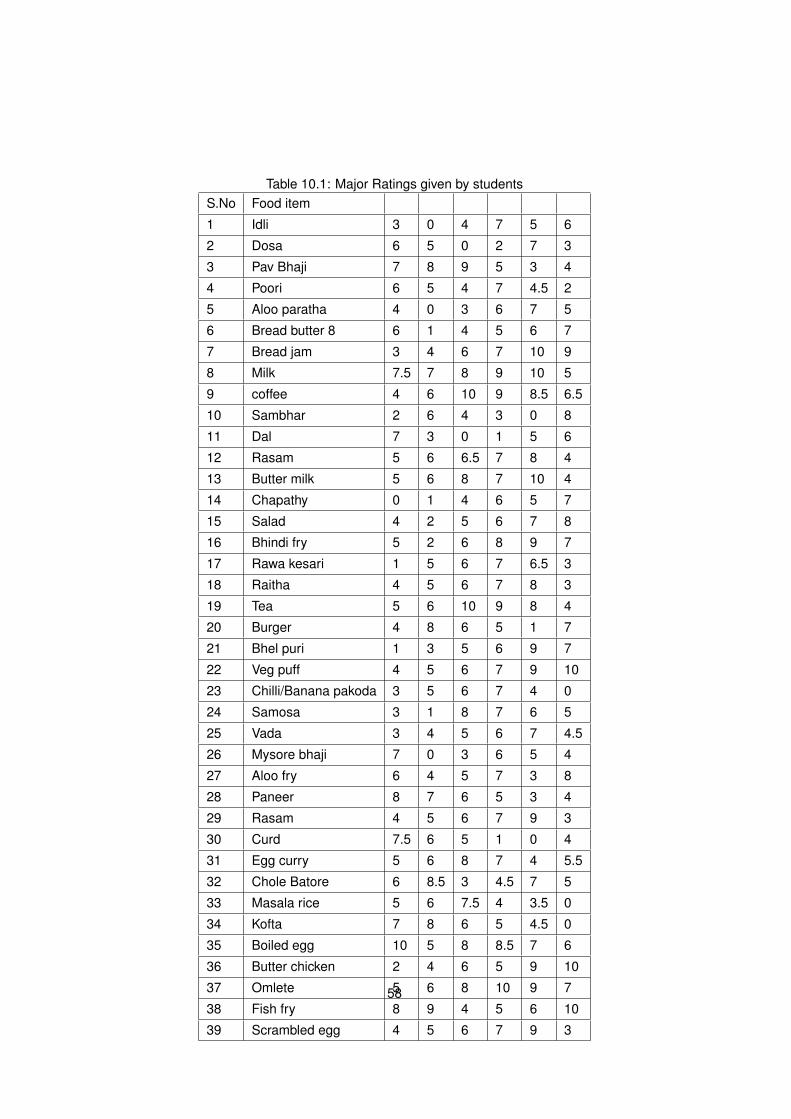
Table 10.1: Major Ratings given by studentsS.No Food item
1 Idli 3 0 4 7 5 6
2 Dosa 6 5 0 2 7 3
3 Pav Bhaji 7 8 9 5 3 4
4 Poori 6 5 4 7 4.5 2
5 Aloo paratha 4 0 3 6 7 5
6 Bread butter 8 6 1 4 5 6 7
7 Bread jam 3 4 6 7 10 9
8 Milk 7.5 7 8 9 10 5
9 coffee 4 6 10 9 8.5 6.5
10 Sambhar 2 6 4 3 0 8
11 Dal 7 3 0 1 5 6
12 Rasam 5 6 6.5 7 8 4
13 Butter milk 5 6 8 7 10 4
14 Chapathy 0 1 4 6 5 7
15 Salad 4 2 5 6 7 8
16 Bhindi fry 5 2 6 8 9 7
17 Rawa kesari 1 5 6 7 6.5 3
18 Raitha 4 5 6 7 8 3
19 Tea 5 6 10 9 8 4
20 Burger 4 8 6 5 1 7
21 Bhel puri 1 3 5 6 9 7
22 Veg puff 4 5 6 7 9 10
23 Chilli/Banana pakoda 3 5 6 7 4 0
24 Samosa 3 1 8 7 6 5
25 Vada 3 4 5 6 7 4.5
26 Mysore bhaji 7 0 3 6 5 4
27 Aloo fry 6 4 5 7 3 8
28 Paneer 8 7 6 5 3 4
29 Rasam 4 5 6 7 9 3
30 Curd 7.5 6 5 1 0 4
31 Egg curry 5 6 8 7 4 5.5
32 Chole Batore 6 8.5 3 4.5 7 5
33 Masala rice 5 6 7.5 4 3.5 0
34 Kofta 7 8 6 5 4.5 0
35 Boiled egg 10 5 8 8.5 7 6
36 Butter chicken 2 4 6 5 9 10
37 Omlete 5 6 8 10 9 7
38 Fish fry 8 9 4 5 6 10
39 Scrambled egg 4 5 6 7 9 3
58
Chapter 11
Bibliography
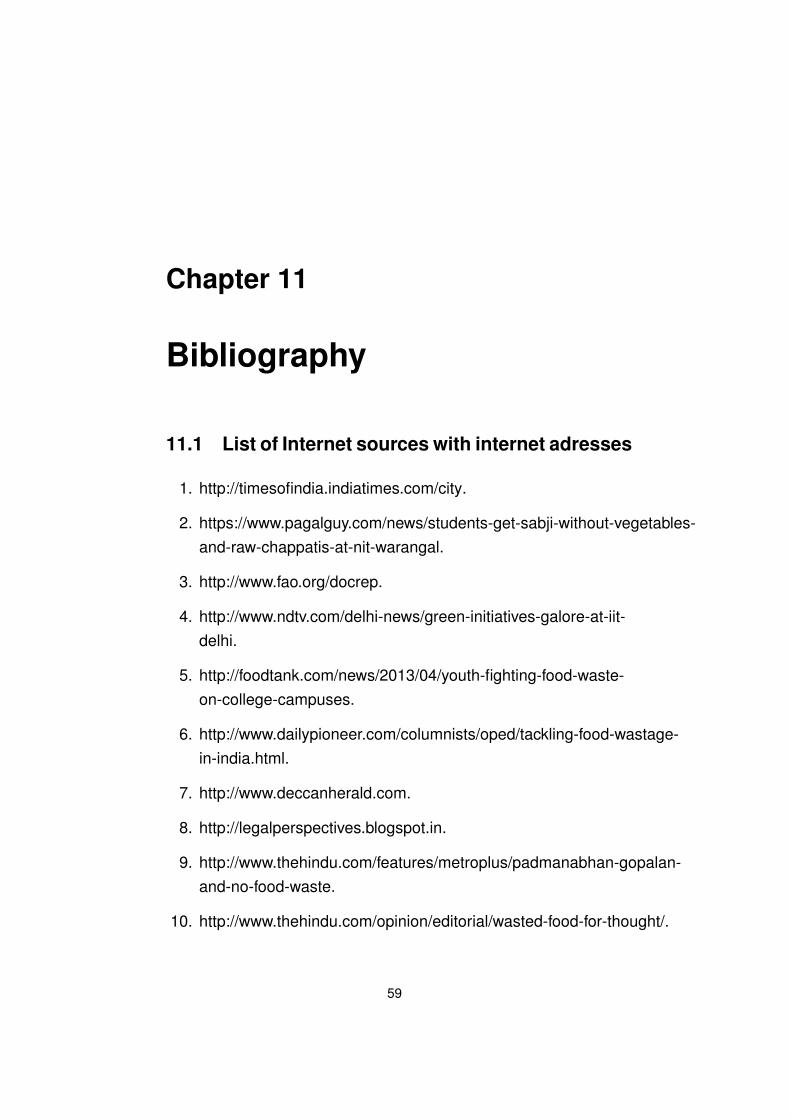
11.1 List of Internet sources with internet adresses
1. http://timesofindia.indiatimes.com/city.
2. https://www.pagalguy.com/news/students-get-sabji-without-vegetables-and-raw-chappatis-at-nit-warangal.
3. http://www.fao.org/docrep.
4. http://www.ndtv.com/delhi-news/green-initiatives-galore-at-iit-delhi.
5. http://foodtank.com/news/2013/04/youth-fighting-food-waste-on-college-campuses.
6. http://www.dailypioneer.com/columnists/oped/tackling-food-wastage-in-india.html.
7. http://www.deccanherald.com.
8. http://legalperspectives.blogspot.in.
9. http://www.thehindu.com/features/metroplus/padmanabhan-gopalan-and-no-food-waste.
10. http://www.thehindu.com/opinion/editorial/wasted-food-for-thought/.
59
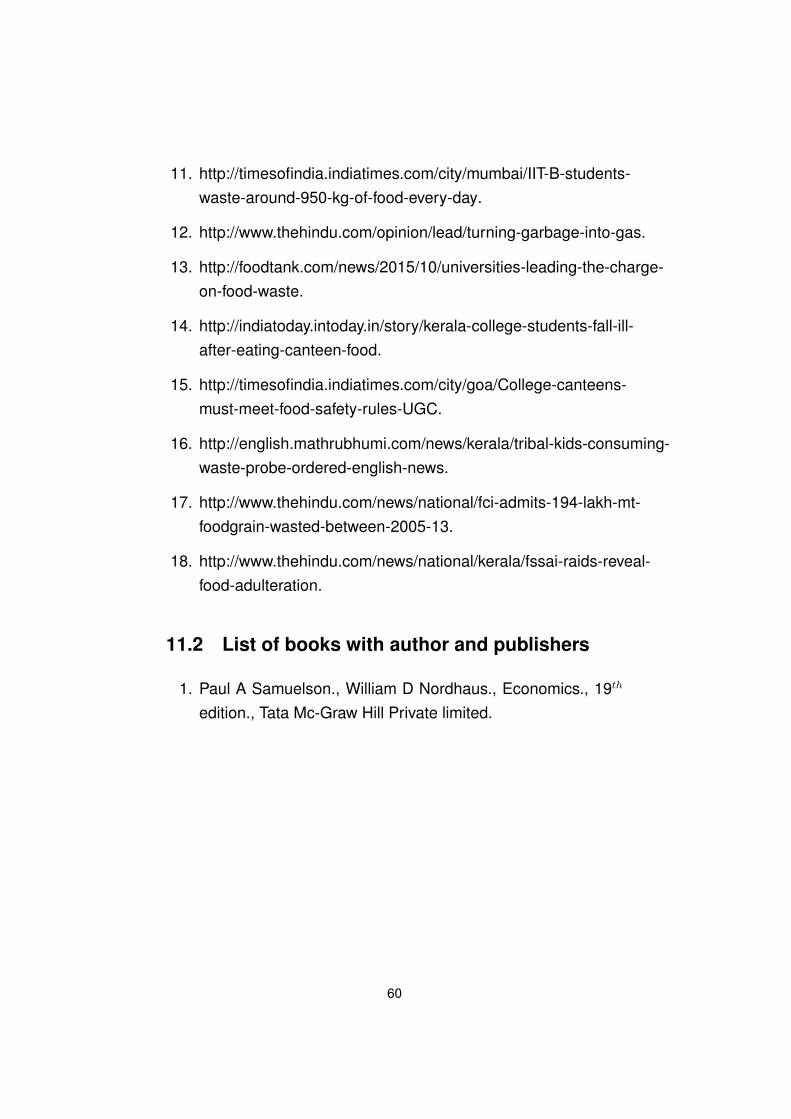
11. http://timesofindia.indiatimes.com/city/mumbai/IIT-B-students-waste-around-950-kg-of-food-every-day.
12. http://www.thehindu.com/opinion/lead/turning-garbage-into-gas.
13. http://foodtank.com/news/2015/10/universities-leading-the-charge-on-food-waste.
14. http://indiatoday.intoday.in/story/kerala-college-students-fall-ill-after-eating-canteen-food.
15. http://timesofindia.indiatimes.com/city/goa/College-canteens-must-meet-food-safety-rules-UGC.
16. http://english.mathrubhumi.com/news/kerala/tribal-kids-consuming-waste-probe-ordered-english-news.
17. http://www.thehindu.com/news/national/fci-admits-194-lakh-mt-foodgrain-wasted-between-2005-13.
18. http://www.thehindu.com/news/national/kerala/fssai-raids-reveal-food-adulteration.
11.2 List of books with author and publishers
1. Paul A Samuelson., William D Nordhaus., Economics., 19th
edition., Tata Mc-Graw Hill Private limited.
60