
Optimization of Fermentation Medium for the Production … Reddy Mallu, Sandeep Vemula, Srinivasa...
7
© 2015 Maheswara Reddy Mallu et al. This is an open access article distributed under the terms of the Creative Commons Attribution License -NonCommercial- ShareAlikeUnported License (http://creativecommons.org/licenses/by-nc-sa/3.0/). Journal of Applied Pharmaceutical Science Vol. 5 (12), pp. 014-020, December, 2015 Available online at http://www.japsonline.com DOI: 10.7324/JAPS.2015.501203 ISSN 2231-3354 Optimization of Fermentation Medium for the Production of Recombinant Human Antithrombin III from Saccharomyces cerevisiae through Statistical Experimental Designs Maheswara Reddy Mallu, Sandeep Vemula, Srinivasa Reddy Ronda* KLE F University, Centre for Bioprocess Technology, Department of Biotechnology, Guntur-522 502, Andhra Pradesh, India. ARTICLE INFO ABSTRACT Article history: Received on: 05/10/2015 Revised on: 23/10/2015 Accepted on: 08/11/2015 Available online: 27/12/2015 This work, for the first time reports the optimization of recombinant human antithrombin (rhAT) production in Saccharomyces cerevisiae BY4741 using statistical experimental designs. Most applications of design of experiments (DoE) have concerned optimization of the composition of growth and production culture media. The typical objective is to identify a best selection and quantitative composition of significant medium supplements. In the present study, Plackett-Burman (PB) design followed by central composite design has been employed to evaluate and optimize the suitable culture medium for rhAT production. Influence of raffinose, glutamic acid and vitamin mixture were screened to be significant variables by PB design. The significant nutritional variables were further optimized using central composite design (CCD) for maximum production of rhAT. Central composite design (CCD) has been selected to explain the interaction effect of the three significant variables such as raffinose, glutamic acid, and vitamin mixture. The multiple regression equation (R 2 =0.9967) was used to optimize significant impact of medium component values to maximize rhAT formation. The optimized values were found to be 23.09765 g/L, 8.01816 g/L and 77.2056 mg/L for raffinose, glutamic acid and vitamin mixture, respectively. The maximum yield of rhAT of 38.97 μg/mL was obtained experimentally using CCD and was very close to the predicted response of 38.93 μg/mL. Key words: Optimization; Placket- Barman design; Central composite design; Antithrombin; Saccharomyces cerevisiae. INTRODUCTION Antithrombin is a glycolprotein having 432 amino acid residues, 4 glucosamine-based oligosaccharide side units, and 3 disulfide bridges (Franzen et al., 1980 and Petersen et al., 1979). It is produced in the liver and has a plasma level of approximately 150 mg/L (Murano et al., 1980). Recombinant human antithrombin (rhAT) is the most significant inhibitor of thrombin family and activated factor X (FXa). Although, antithrombin acts mainly as the most significant plasma inhibitor of thrombin and antithrombin has also strong inhibitory effects on variety of active serine proteases, including IXa, Xa, Xia, XIIa, and FVIIa factors (Damus et al., 1973 and Travis et al., 1983). This is demonstrated by the fact that individuals with * Corresponding Author Srinivasa Reddy Ronda, K L E F University, Centre for Bioprocess Technology, Department of Biotechnology, Guntur-522 502, Andhra Pradesh, India. Email: [email protected] antithrombin deficiency are predisposed to thrombotic events and difficiency of antithrombin is a hereditary disorder that is connected with recurrent thrombophlebitis, aortic thromiosis and thromo embolism (Egeberg 1965). Besides being involved in regulating coagulation, antithrombin has been shown to have anti inflammatory properties (Wiedermann et al., 2002). rhAT is useful to cure diseases such as Transient Ischemic Attack, Thrombosis, Thrombocytosis and Cerebrovascular diseases are the main causes of death and disability around the globe (De Stefano et al., 2008). Because of these properties, antithrombin is useful as a therapeutic agent to treat diseases and hence rich source of extremely purified and active rhAT might be supportive for clinical and model validation studies (Linhardt et al., 2003). rhAT is achieving increasing attention due to their possible use in clinical and model validation studies. The use of recombinent proteins at a commercial scale is constrained by the ability to gain the product in higher yields from microbial processes (Freigassner et al., 2009).
Transcript of Optimization of Fermentation Medium for the Production … Reddy Mallu, Sandeep Vemula, Srinivasa...

© 2015 Maheswara Reddy Mallu et al. This is an open access article distributed under the terms of the Creative Commons Attribution License -NonCommercial-ShareAlikeUnported License (http://creativecommons.org/licenses/by-nc-sa/3.0/).
Journal of Applied Pharmaceutical Science Vol. 5 (12), pp. 014-020, December, 2015
Available online at http://www.japsonline.com
DOI: 10.7324/JAPS.2015.501203
ISSN 2231-3354
Optimization of Fermentation Medium for the Production of
Recombinant Human Antithrombin III from Saccharomyces
cerevisiae through Statistical Experimental Designs Maheswara Reddy Mallu, Sandeep Vemula, Srinivasa Reddy Ronda*
KLE F University, Centre for Bioprocess Technology, Department of Biotechnology, Guntur-522 502, Andhra Pradesh, India.
ARTICLE INFO
ABSTRACT
Article history:
Received on: 05/10/2015
Revised on: 23/10/2015
Accepted on: 08/11/2015
Available online: 27/12/2015
This work, for the first time reports the optimization of recombinant human antithrombin (rhAT) production in
Saccharomyces cerevisiae BY4741 using statistical experimental designs. Most applications of design of
experiments (DoE) have concerned optimization of the composition of growth and production culture media. The
typical objective is to identify a best selection and quantitative composition of significant medium supplements.
In the present study, Plackett-Burman (PB) design followed by central composite design has been employed to
evaluate and optimize the suitable culture medium for rhAT production. Influence of raffinose, glutamic acid and
vitamin mixture were screened to be significant variables by PB design. The significant nutritional variables were
further optimized using central composite design (CCD) for maximum production of rhAT. Central composite
design (CCD) has been selected to explain the interaction effect of the three significant variables such as
raffinose, glutamic acid, and vitamin mixture. The multiple regression equation (R2=0.9967) was used to
optimize significant impact of medium component values to maximize rhAT formation. The optimized values
were found to be 23.09765 g/L, 8.01816 g/L and 77.2056 mg/L for raffinose, glutamic acid and vitamin mixture,
respectively. The maximum yield of rhAT of 38.97 µg/mL was obtained experimentally using CCD and was very
close to the predicted response of 38.93 µg/mL.
Key words:
Optimization; Placket-
Barman design; Central
composite design;
Antithrombin;
Saccharomyces cerevisiae.
INTRODUCTION
Antithrombin is a glycolprotein having 432 amino acid
residues, 4 glucosamine-based oligosaccharide side units, and 3
disulfide bridges (Franzen et al., 1980 and Petersen et al.,
1979). It is produced in the liver and has a plasma level of
approximately 150 mg/L (Murano et al., 1980). Recombinant
human antithrombin (rhAT) is the most significant inhibitor of
thrombin family and activated factor X (FXa). Although,
antithrombin acts mainly as the most significant plasma inhibitor
of thrombin and antithrombin has also strong inhibitory effects
on variety of active serine proteases, including IXa, Xa, Xia,
XIIa, and FVIIa factors (Damus et al., 1973 and Travis et al.,
1983). This is demonstrated by the fact that individuals with
* Corresponding Author
Srinivasa Reddy Ronda, K L E F University, Centre for Bioprocess
Technology, Department of Biotechnology, Guntur-522 502, Andhra
Pradesh, India. Email: [email protected]
antithrombin deficiency are predisposed to thrombotic events and
difficiency of antithrombin is a hereditary disorder that is
connected with recurrent thrombophlebitis, aortic thromiosis and
thromo embolism (Egeberg 1965). Besides being involved in
regulating coagulation, antithrombin has been shown to have anti
inflammatory properties (Wiedermann et al., 2002). rhAT is useful
to cure diseases such as Transient Ischemic Attack, Thrombosis,
Thrombocytosis and Cerebrovascular diseases are the main causes
of death and disability around the globe (De Stefano et al., 2008).
Because of these properties, antithrombin is useful as a therapeutic
agent to treat diseases and hence rich source of extremely purified
and active rhAT might be supportive for clinical and model
validation studies (Linhardt et al., 2003). rhAT is achieving
increasing attention due to their possible use in clinical and model
validation studies.
The use of recombinent proteins at a commercial scale is
constrained by the ability to gain the product in higher yields from
microbial processes (Freigassner et al., 2009).
Mallu et al. / Journal of Applied Pharmaceutical Science 5 (12); 2015: 014-020 015
The growing demand for therapeutic products calls for
robust production hosts, capable expression systems and
appropriate cultivation conditions. The limitation is often in terms
of obtaining upmost quantities at sufficiently low cost to allow for
marketing. Yeast is a single-celled, eukaryotic microbe that can
grow speedily in complex or defined media (doubling time is
typically 2.5 h in glucose-containing medium) and is simple and
economical to use for r-DNA based protein production than insect
and other mammalian cell lines (Bill 2001). The main advantage
of yeast expression systems is the capacity to perform strict quality
control and post-translational modifications (Demain et al., 2009).
To achieve high product yields, media composition is
one of the important parameter. The optimal culture medium
depends on many factors, including host metabolism, potential
inhibitory products, target proteins, etc, and the development of
the optimal medium is often a trial and error process (Shojaosadati
et al., 2008). On one hand, it is desirable from the cost perspective
to make the medium as simple as possible by reducing the amount
of non essential carbon and nitrogen sources. It is prerequisite to
evaluate and optimize positive impact of medium components in
an efficient fermentation process.
Statistical experimental designs are useful tools in
bioprocess development to screen out an effective real variable
with significance impact (Weuster-Botz, 2000; Mandenius et al.,
2008; Box et al., 2005). The application of statistical experimental
designs in optimization can give better biomass yields, decreased
process variability, closer confirmation of the response to nominal,
target requirements, reduced time and overall costs (Brereton et
al., 2003).
Usual practice of single factor optimization by
maintaining other factors involved an undetermined steady point
does not show the pooled effect of all the factors involved (Vaidya
et al., 2003).
To make a full factorial search, which would study each
possible combination of independent variable at suitable levels
could require a big number of experiments and is a time
consuming process, which is unreliable. Industrially the aim is to
carry out the minimum number of experiments to analyze optimal
conditions. These limitations of a single factor optimization
process can be removed by PB design to examine more than five
variables (Ahuja et al., 2004), the PB design is used to evaluate the
most important variables for the better cell growth and product
formation.
The next stage of medium optimization would be to find
the optimum level of each effective independent variables which
has been recognized by the Placket-Burman design. This may be
done by using most popular central composite design (CCD) under
response surface methodology (RSM) technique. The CCD is used
to optimize the relative significance of several affecting factors
even in the presence of complex interactions and to estimate the
coefficients of quadratic model (Rao et al., 2000 and Bezerra et
al., 2008). In the present study, this communication reports an
effort to evaluate and optimize highly effective medium
components with significance impact on rhAT production by P-B
design followed by RSM.
MATERIALS AND METHODS
Strains and chemicals
Saccharomyces cerevisiae BY4741 with pYES2/CT
expression vector was used as the host for production of rhAT
(ATCC 4040002, USA). Yeast nitrogen base (YNB) without
uracil, aspartic acid, Raffinose, Galactose, complete supplement
mixture and vitamin mix were procured from Himedia, India.
Surose, Starch, Fructose, Glutamic acid, Soy peptone, Peptone and
ammonium nitrate were procured from Merck (CA, USA). SDS
loading dye was purchased from Thermo Scientific, USA and
coomassie brilliant blue (CBB-250) and Bovine serum albumin
(BSA) were obtained from Bio-Rad Inc, USA.
Culture conditions
For inoculum development, a single colony of yeast was
used to grow the overnight seed culture. For optimization
experiments, the seed culture at 10% (v/v) was transferred to 100
mL YNB-URA media containing flasks and incubated for 24 h at
30 °C. The cultures were induced with galactose (20%) and
raffinose (10%) induction medium.
SDS-PAGE analysis of rhAT
Equal cell density was maintained by changing the
optical density to 1.0 with the growth media and the pellets were
collected through centrifugation. To remove the media traces and
membrane surface proteins, cells were resuspended in the sterile
distilled water. The cell pellets were then collected through
centrifugation at 30,000 g for 15 min at 4oC and stored at -20
oC for
further analysis.
The cells were treated with SDS loading dye (Thermo
Scientific, USA) and lysed with frequent vortexing followed by
heating at 100oC. The samples were directly loaded and resolved
with the 12% acrylamide sodium dodecyl sulphate polyacrylamide
gel electrophoresis (SDS-PAGE). The gels were stained with
coomassie brilliant blue (CBB-250, Bio-Rad Inc, USA) solution
for 8 h.The intensity and rhAT bands were analyzed with ImageJ
v1.48 software against the standard protein (Bovine serum
albumin, BSA) (Vemula et al., 2015).
Experimental design and optimization
PB Design analysis for rhAT production
PB Design was employed for screening the most
significant medium components affecting rhAT production by
Sacharomyces cerevisiae. In the present study, a 12 run PB Design
have been applied to evaluate 11 variables in which two were
dummy variables to obtain an estimate of error. Each independent
variable was tested at two levels, low and high, which were
denoted by (+) and (-) respectively (Table. 1). Table. 2 shows the
details of the experimental design and yields of rhAT.

016 Mallu et al. / Journal of Applied Pharmaceutical Science 5 (12); 2015: 014-020
Response surface Methodology (RSM)
Response surface methodology is an experimental
statistical model employed to explain the nature of response
surface in the optimum region. To find out the optimum response
of cells and for multiple regression analysis with results obtained
from experimental design to solve multivariable equations
simultaneously for better yield of rhAT under a broad choice of
process variable conditions. A range of coded and un-coded
variables was given in Table 3. In this study, a five level and three
factors CCD requiring 20 experiments was performed (Table 4).
The CCD consists of a 2k factorial runs with 2k axil runs and x0
number of center points (six replicates). The number of
experimental runs was determined from the following equation:
N=2k+2k+x0 …..(1)
where N is the number of experimental runs required, k is the total
number of nutritional variables and x0 is the total number of
central points. Total number of experimental runs were estimated
to be 20 (k=3 and x0=6).
The relationships of nutritional variables were evaluated by fitting
a second order polynomial equation to information of 20
experiments. The quadratic model was established as follows
Ŷ = β0+ β𝑘𝑖=1 iAi+ β𝑘
𝑖=1 ii (Ai)2 + 𝑖 𝑗βijAiAj … (2)
where Ŷ is the predicted response (rhAT production) β0 is a
constant, βi linear terms coefficients, βii quadratic terms coefficient
and βij interaction coefficients. The relationship between coded
and uncoded form of the variables is given as follows.
Ai= ((Zi- (Zi)*)/ΔZi /…(3)
where Ai is the coded value of the variable, Zi is the real value of
an independent variable (un coded), (Zi)* is the center point value
and ΔZi is the step change between the levels.
RESULTS AND DISCUSSION
Screening of significant nutritional variables for rhAT
Production using PB design
Statistical design for media optimization has proved to be
a powerful and practical tool for bioprocess engineering. An
attempt has been made to improve the composition of the medium
formulation by simultaneous comparison between two levels of
several factors through PB design. In the present work, a study has
been performed to analyze the significant effect of various
nutritional variables such as raffinose, sucrose, starch, fructose,
glutamic acid, ammonium nitrate, peptone, soy peptone and
vitamin mix. on rhAT yield. The effects of these components on
the rhAT production and maximum rhAT concentration (17.5
µg/mL) were shown in Table 2. Fig.1 shows pareto chart of the
most important factors determining the rhAT production and
response values of raffinose, glutamic acid and vitamin mixture,
Table 1: PB design showing the low (-) and high (+) values of the coded nutritional variables.
Coded variables Name of the variables Low value (-) High value (+)
A Raffinose (g/L) 10 20
B Sucrose (g/L) 10 20 C Starch (g/L) 10 20
D Fructose (g/L) 10 20
E Dummy variable-1(g/L) 5 10 F Glutamic acid (g/L) 2 8
G Soy peptone (g/L) 2 8
H Dummy variable-2 (g/L) 5 10 J Peptone (g/L) 2 8
K Ammonium nitrate (g/L) 2 8
L Vitamin mixture (mg/L) 20 80
Table 2: PB design for medium optimization and measured response for rhAT yield (µg/mL).
Process variables
Run A B C D E F G H J K L rhAT yield(µg/mL)
1 1 1 -1 1 1 1 -1 -1 -1 1 -1 16.3 2 -1 1 -1 1 1 -1 1 1 1 -1 -1 11.1
3 -1 -1 -1 -1 -1 -1 -1 -1 -1 -1 -1 12.2
4 -1 1 1 1 -1 -1 -1 1 -1 1 1 13.1 5 -1 -1 1 -1 1 1 -1 1 1 1 -1 14.3
6 1 1 -1 -1 -1 1 -1 1 1 -1 1 17.1
7 1 1 1 -1 -1 -1 1 -1 1 1 -1 13.2 8 -1 1 1 -1 1 1 1 -1 -1 -1 1 16.2
9 -1 -1 -1 1 -1 1 1 -1 1 1 1 16.3
10 1 -1 -1 -1 1 -1 1 1 -1 1 1 17.5 11 1 -1 1 1 -1 1 1 1 -1 -1 -1 16.5
12 1 -1 1 1 1 -1 -1 -1 1 -1 1 14.8
Table 3: Coded and uncoded values of central composite design experimental variables.
Levels of variables
Variables Coded variables -2 -1 0 +1 +2 Step change value(ΔZi)
Raffinose (g/L) A1 10 15 20 25 30 5 Glutamic acid (g/L) A2 2 4 6 8 10 2
Vitamin mix (mg/L) A3 20 40 60 80 100 20

Mallu et al. / Journal of Applied Pharmaceutical Science 5 (12); 2015: 014-020 017
which were above the ‘‘Bonferroni limit. From the results, it has
been observed that the nutritional variables which show significant
effect were considered to have greater effect on rhAT yield.
Table 5 shows Analysis of variance (ANOVA) outcome
with significant F-value (30.5) and Prob > F value (less than 0.05).
The goodness of the fit of the model was examined by the multiple
correlation coefficient (R2 = 0.9937). The adjusted multiple
correlation value (adj R2 = 0.9656) is in reasonable correlation
with the predicted multiple correlation (pred R2 = 0.7750). Adeq
Precision investigates the signal to noise ratio, a ratio of 18.102
indicates an adequate signal. The coefficient of variance (CV =
2.87%), which is comparatively low value, indicates a better
reliability and precision. A first order model was used to build
predictions about the response to the given level of each factor
which is defined by the following equation:
rhAT =14.88+1.02 * A -0.38 * B -0.2* C -0.2* D+1.23* F+0.25 *
G -0.42* J-0.23 * K+0.95 * L … (4)
where A = raffinose, B = sucrose, C = starch, D =fructose,
F=glutamic acid, G = Soy peptone, J= peptone, K = Ammonium
nitrate and L = vitamin mixture. From the results it has been
observed that , the rhAT yield was mainly due to three significant
factors such as raffinose, glutamic acid and vitamin mixture,
which were not reported in previous reports of media optimization.
These three significant nutritional variables have shown the
potentiality for the biomass and rhAT yield. Of the different
carbon sources tested, raffinose showed the maximum positive
effect when compared to other sources such as sucrose, starch and
fructose (Fig.1). On the other hand, glutamic acid (F) showed
considerable effect and while other nitrogen sources (peptone, soy
peptone and ammonium nitrate) showed no significant effect on
rhAT yield (Fig.1). The yield of rhAT has been controlled by the
required concentration of nitrogen in the medium. The optimum
nitrogen level can simulate rhAT production, whereas high
nitrogen level represses it. The supplementation of the nutrient
medium with an appropriate vitamin mixture maximized the yield
of rhAT. In the present study, vitamin mixture (L) also showed a
significant effect (Fig.1) on rhAT yield. The addition of vitamin
mixture in the growth medium had a optimistic impact on rhAT
production. From the PB design analysis, it can be seen that
raffinose, glutamic acid and vitamin mixture were screened to
have a significant effect on rhAT production and the same were
used for further experiments.
Estimation of the optimal Concentrations and Interactive
Effects of the important factors on rhAT production using
CCD
RSM was adapted to find out a proper direction by
increasing or decreasing the concentrations of fermentation
variables according to the results of PB design. Table 4 shows full
factorial central composite design and their observed values of
rhAT production. A regression model having R2
value more than
0.9 was considered to be having a very high correlation. Hence,
the present R2 value reflected a very good fit between the observed
and predicted responses of rhAT, and implied that the present
model is consistent for rhAT production. The F-test also shows a
high significance for the regression model. Each of the observed
value is evaluated with a predicted value (Table. 4) and residuals
with the residual variance indicates that none of the individual
residues exceed twice the square root of the residual variance. All
of these considerations specify a better adequacy of the regression
model. Table 6 shows the ANOVA of the regression model with
respect to rhAT. The goodness of fit of the model was examined
by several criteria. A P value of less than 0.0001 indicates that the
model terms are significant. The fitness of the model was tested by
the coefficient of determination R2, which was found to be 0.9967
representing that the simple variation of 99.67% was attributed to
the variables and only less than 0.33% of the total variance could
not be explained by the model.
Rank
Fig. 1: Effect of medium supplements on rhAT production as shown in pareto chart. A = raffinose, B = sucrose, C = starch, D =fructose, F=glutamic acid,
G = Soy peptone, J= peptone, K = Ammonium nitrate and L = vitamin mixture.
0.00
3.70
7.39
11.09
14.78
1 2 3 4 5 6 7 8 9 10 11
Pareto Chart
Rank
t-
Va
lue
o
f |E
ffe
ct| Bonf erroni Limit 14.7818
t-Value Limit 4.30265
F-F
A-AL-L
J-JB-B
G-G K-KC-C D-D

018 Mallu et al. / Journal of Applied Pharmaceutical Science 5 (12); 2015: 014-020
Table 4: Full factorial central composite design and their observed responses
for rhAT production.
Coded variables rhAT yield (µg/ml)
Run
Raf
fin
ose
(g/L
): A
1
Glu
tam
ic a
cid
(g/L
): A
2
Vit
amin
mix
(mg
/L):
A3
Act
ual
dat
a
(X)
Pre
dic
ted d
ata
(Y)
Res
idu
al
val
ue
(X-Y
)
1 10 6 60 27.35 27.51 -0.16
2 20 6 140 35.93 35.11 0.82 3 15 4 20 27.09 26.93 0.16
4 25 4 100 35.9 35.84 0.06
5 20 6 60 36.8 36.62 0.18 6 20 6 60 36.44 36.62 -0.18
7 20 6 -20 27.11 27.25 -0.14
8 15 8 20 32.33 32.19 0.14
9 15 8 100 35.5 35.34 0.16
10 15 4 100 31.16 31.1 0.06
11 20 10 60 37.3 37.44 -0.14 12 20 6 60 36.22 36.62 -0.4
13 20 6 60 36.39 36.62 -0.23
14 20 6 60 37.25 36.62 0.63 15 25 8 100 38.97 38.93 0.04
16 20 2 60 29.02 29.08 -0.06
17 25 4 20 30.29 30.25 0.04 18 20 6 60 36.39 36.62 -0.23
19 30 6 60 34.38 34.42 -0.04
20 25 8 20 34.5 34.36 0.14
Table 5: Analysis of variance for factorial model through PB Design. Source Sum of Squares df Mean Square F-value Prob>F
Model 47.7 9 5.3 35.33 0.0278 A 12.4 1 12.4 82.69 0.0119
B 1.76 1 1.76 11.76 0.0756
C 0.48 1 0.48 3.2 0.2155 D 0.48 1 0.48 3.2 0.2155
F 18.25 1 18.25 121.69 0.0081
G 0.75 1 0.75 5 0.1548 J 2.08 1 2.08 13.89 0.0651
K 0.65 1 0.65 4.36 0.1722
L 10.83 1 10.83 72.2 0.0136 Residual 0.3 2 0.15
Core total 48 1
df = Degrees of freedom
Table 6: Analysis of variance for regression model by central composite design.
Source Sum of squares df Mean square F –Value P-value
Model 273.56 9 30.40 336.61 0.0001
Lack of fit 0.18 5 0.037 0.26 0.9192 Error 0.72 5 0.14
Cor Total 274.46 19
R2=0.9967, Adj-R2=0.9937, CV=0.89 %
From the Table 7, it can be seen that the variables with
higher effect were linear terms and squared terms of A1, A2 and A3
followed by interaction between raffinose (A1) and vitamin
mixture (A3). The higher significance of the linear terms and
squared terms of A1, A2 and A3 over corresponding interaction
terms (A1A3, A1A2, and A2A3) shows that the optimal values for
rhAT production reclines within the experimental values chosen.
From these observations, raffinose (A1), glutamic acid (A2) and
vitamin mixture (A3) were shown to be significant.
The adjusted determination coefficient (adj R2=0. 9937)
was also acceptable to confirm the significance of the present
model. Finally, the lower value of coefficient of variation
(CV=0. 89%) shows that the experiments were exact and reliable.
The rhAT response model was analyzed as follows
Ŷ=36.62+1.73*A1+2.09*A2+2.18*A3-0.29*A1A2+0.36* A1A3-
0.25* A2A3-1.41*(A1)2-0.84*(A2)
2-1.25*(A3)
2 …
(5)
The above response model can be converted into the un-coded unit
where
A1= (Z1-20) /5 … (6)
A2= (Z2-6) /2 … (7)
A3= (Z3-60) /20 … (8)
In order to get a better understanding of significant medium
supplements effect on rhAT production, the predicted model was
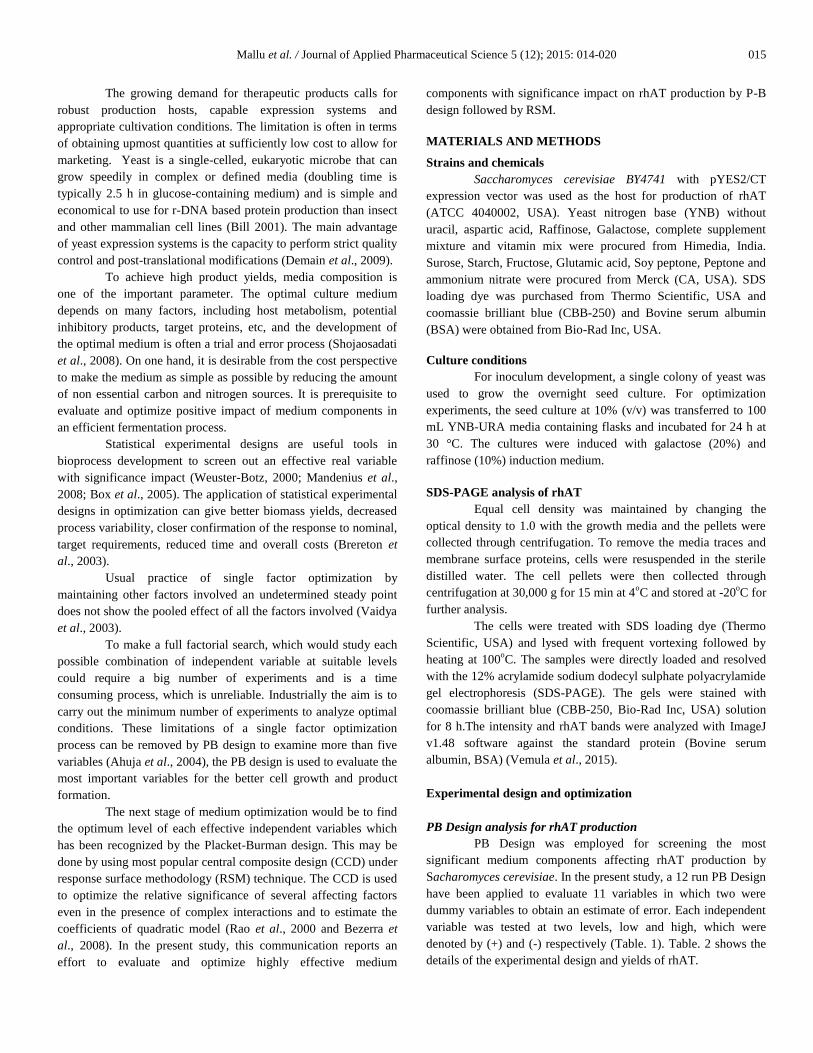
presented as response surface graphs. The interaction between the
effective medium components can be seen in the response surface
(3D) and counter (2D) plots (Figs 2a-c).
The interaction between nutritional factors indicates that
the change in level of one factor affects the level of remaining
factor for a fixed level of rhAT yield. Fig 2a-c shows the suitable
level of rafinose, glutamic acid and vitamin mixture to get utmost
production of rhAT.
Table 7: Regression coefficients and their importance for response surface
model.
Fac
tor
Coef
fici
ent
of
esti
mat
e
df
Sta
ndar
d
erro
r
F-V
alue
p-v
alu
e
(Pro
b >
F)
Intercept 36.62 1 0.12 A1-raffinose 1.73 1 0.075 528.77 0.0001
A2-glutamicacid 2.09 1 0.075 773.04 0.0001
A3-vitaminmix 2.18 1 0.075 845.93 0.0001 A1A2 -0.29 1 0.11 7.32 0.0221
A1A3 0.36 1 0.11 11.16 0.0075
A2A3 -0.25 1 0.11 5.76 0.0373 (A1)
2 -1.41 1 0.06 555.35 0.0001
(A2)2 -0.84 1 0.06 195.77 0.0001
(A3)2 -1.25 1 0.06 434.03 0.0001
A study has also been conducted to analyze the effect of
the maximum and minimum principle of differential calculus on
maximization of the equation (5) with respect to individual tested
nutritional variables. The values of second order partial
differential equations with respect to A1, A2 and A3 obtained are -
2.82*A1 ,-1.68 and -2.5. The negative values of second order
partial differential equations specify the absence of local
maximum and applicability of rhAT maximization. First order
partial differential model response equation 5 with respect A1, A2
and A3 are equated to zero and A1, A2 and A3 values were solved
with the maximum rhAT response.
1.73-2.82*A1-0.29*A2+0.36*A3=0 .… (9)
2.09-0.29*A1-1.68*A2-0.25*A3=0 ….(10)
2.18+0.36*A1-0.25*A2-2.5*A3=0 …. (11)
The numerical solution to the above equations (9-11) were A1=
0.61953, A2=1.00908 and A3=0.86028. Uncoded values of
Z1,=23.09765 g/L, Z2=8.01816 g/L and Z3=77.2056 mg/L were
estimated using equation 6-8. At these optimum concentrations,
the maximum rhAT yield was estimated to be 38.97 µg/ml. An
improvement (2.3folds) of rhAT from 17.5µg/ml (PBD) to38.97
µg/ml was achieved after optimization using CCD.
Mallu et al. / Journal of Applied Pharmaceutical Science 5 (12); 2015: 014-020 019
CONCLUSIONS
The recombinant AT has gained enormous significance
in the healthcare sector. Design expert analysis is the functional
tool to optimize process variables for the production of
recombinant proteins and provide valuable information on
nutritional variable interactions.
In the present work, the effective variables on the rhAT
production using PB design were screened. Three significant
medium components screened from the PB design were raffinose,
glutamic acid and vitamin mixture. The suitable concentrations of
selected variables were optimized using CCD under response
surface methodology.
The maximum predicted rhAT yield (38.97 µg/mL) from
the CCD was achieved with raffinose (23.09765 g/L), Glutamic
acid (8.01816 g/L) and vitamin mix (77.2056 mg/L). The proper
use of media supplements can influence bioprocess economics at a
large scale production of commercially value added therapeutic
recombinant proteins.
ACKNOWLEDGMENTS
The authors are grateful to the Department of
Biotechnology and management of K L E F University for
providing all the financial assistance and laboratory facilities
during execution of the work.
A
B
C
Fig. 2: Three dimension (3D) and two dimension (2D) response surface plots showing the effects of variables on rhAT production by S. cerevisiae. A)
Interaction of raffinose (g/L) and glutamic acid (g/L) (A1A2); (B) raffinose (g/L) and vitamin mix (mg/L) (A1A3); (C) glutamic acid and vitamin mix (A2A3).
Design-Expert® SoftwareFactor Coding: Actualr-Antithrombin (µg/ml)
Design points above predicted valueDesign points below predicted value38.97
27.09
X1 = A: SucroseX2 = B: Ammonium sulphate
Actual FactorC: vitamin mixture = 60
2
4
6
8
10
10
14
18
22
26
30
15
20
25
30
35
40
rhAT
(µg/
ml)
A: Raffinose (g/L)B: Glutamic acid (g/L)
Design-Expert® SoftwareFactor Coding: Actualr-Antithrombin (µg/ml)
Design Points38.97
27.09
X1 = A: SucroseX2 = B: Ammonium sulphate
Actual FactorC: vitamin mixture = 60
10 14 18 22 26 30
2
4
6
8
10rhAT (µg/ml)
A: Raffinose (g/L)
B: G
luta
mic
acid
(g/L
)
20
25
30
30
35
35
6
Design-Expert® SoftwareFactor Coding: Actualr-Antithrombin (µg/ml)
Design points above predicted valueDesign points below predicted value38.97
27.09
X1 = A: SucroseX2 = C: vitamin mixture
Actual FactorB: Ammonium sulphate = 6
20
40
60
80
100
10
14
18
22
26
30
20
25
30
35
40
rhAT
(µg/
ml)
A: Raffinose (g/L)C: vitamin mix (mg/L)
Design-Expert® SoftwareFactor Coding: Actualr-Antithrombin (µg/ml)
Design Points38.97
27.09
X1 = A: SucroseX2 = C: vitamin mixture
Actual FactorB: Ammonium sulphate = 6
10 14 18 22 26 30
20
40
60
80
100rhAT (µg/ml)
A: Raffinose (g/L)
C: v
itam
in m
ixt (m
g/L)
26
2830 32
32
34
36
38
6
Design-Expert® SoftwareFactor Coding: Actualr-Antithrombin (µg/ml)
Design points above predicted valueDesign points below predicted value38.97
27.09
X1 = B: Ammonium sulphateX2 = C: vitamin mixture
Actual FactorA: Sucrose = 20
20
40
60
80
100
4
5
6
7
8
26
28
30
32
34
36
38
40
rhAT
(µg/
ml)
B: Glutamic acid (g/L)C: vitamin mixture (mg/L)
Design-Expert® SoftwareFactor Coding: Actualr-Antithrombin (µg/ml)
Design Points38.97
27.09
X1 = B: Ammonium sulphateX2 = C: vitamin mixture
Actual FactorA: Sucrose = 20
2 4 6 8 10
20
40
60
80
100rhAT (µg/ml)
B: Glutamic acid (g/L)
C: v
itam
in m
ix (m
g/L)
26
28
30
3234
36
38
6
020 Mallu et al. / Journal of Applied Pharmaceutical Science 5 (12); 2015: 014-020
REFERENCES
Ahuja S; Ferreira G Moreira A. Application of Plackett‐ Burman design and response surface methodology to achieve exponential
growth for aggregated shipworm bacterium. Biotechnology and
Bioengineering, 2004; 85: 666-67.
Bezerra M A; Santelli R E; Oliveira E P; Villar L S Escaleira
L A. Response surface methodology (RSM) as a tool for optimization in
analytical chemistry. Talanta, 2008; 76 : 965-977.
Bill R M. Yeast–a panacea for the structure–function analysis of
membrane proteins? Current genetics. 2001;40: 157-171.
Box G E; Hunter J S , Hunter W G. Statistics for experimenters:
design, innovation, and discovery. AMC, 2005; 10 12.
Brereton R G. 2003. Chemometrics: data analysis for the
laboratory and chemical plant; John Wiley & Sons.
Damus P S; Hicks M Rosenberg R D. Anticoagulant action of
heparin. Nature, 1973; 246: 355-7.
Demain A L Vaishnav P. Production of recombinant proteins by
microbes and higher organisms. Biotechnology Advances, 2009; 27:297-
306.
De Stefano V; Za T; Rossi E; Vannucchi A M; Ruggeri M;
Elli E; Micò C; Tieghi A; Cacciola R R Santoro C. Recurrent
thrombosis in patients with polycythemia vera and essential
thrombocythemia: incidence, risk factors, and effect of treatments.
Haematologica, 2008; 93: 372-380.
Egeberg O. Inherited Antithrombin Deficiency Causing
Thrombophilia. Thromb Diath Haemorrh, 1965;13:516-30.
Franzen L E; Svensson S Larm O. Structural studies on the
carbohydrate portion of human antithrombin III. J Biol Chem, 1980; 255:
5090-3.
Freigassner M; Pichler H Glieder A. Tuning microbial hosts
for membrane protein production. Microb Cell Fact, 2009;8:69.
Linhardt R J. 2003 Claude S. Hudson Award address in
carbohydrate chemistry. Heparin: structure and activity. J Med Chem,
2003; 46: 2551-2564.
Mandenius C F, Brundin A. Bioprocess optimization using
design‐of‐experiments methodology. Biotechnology Progress, 2008;24:
1191-1203.
Murano G; Williams L; Miller-Andersson M; Aronson D King
C. Some properties of antithrombin-III and its concentration in human
plasma. Thrombosis Research, 1980; 18: 259-262.
Petersen T; Dudek-Wojciechowska G; Sottrup-Jensen L
Magnusson S. 1979. Primary structure of antithrombin III (heparin
cofactor). Partial structure of antithrombin III (heparin cofactor). Partial
homology between a1-antitrypsin and antithrombin III. The physiological
inhibitors of blood coagulation and fibrinolysis. Elsevier Biomedical
Press, Amsterdam. pp. 43-54.
Rao K J; Kim C-H Rhee S-K. Statistical optimization of
medium for the production of recombinant hirudin from Saccharomyces
cerevisiae using response surface methodology. Process Biochemistry,
2000; 35: 639-647.
Shojaosadati S A; Varedi Kolaei S M; Babaeipour V Farnoud
A M. Recent advances in high cell density cultivation for production of
recombinant protein. Iranian J Biotechnol, 2008; 6: 63-84.
Travis J Salvesen G S. Human plasma proteinase inhibitors.
Annu Rev Biochem, 1983; 52:655-709.
Vemula S; Dedaniya A; Bandaru R; Mallu M R; Settaluri V S
Ronda S R. Production of Recombinant Human Granulocyte-Colony
Stimulating Factor in Escherichia coli Using Novel Media Supplements
Through Integrated Statistical Optimization Designs. Int J Peptide Res
Therap, 2015; 21: 1-14.
Vaidya R; Vyas P Chhatpar H. Statistical optimization of
medium components for the production of chitinase by Alcaligenes
xylosoxydans. Enzyme and Microbial Technology, 2003;33:92-96.
Weuster-Botz D. Experimental design for fermentation media
development: statistical design or global random search? J Biosci Bioeng,
2000; 90: 473-483.
Wiedermann C J , Römisch J. The Anti‐Inflammatory Actions
of Antithrombin–A Review. Acta Medica Austriaca, 2002; 29: 89-92.
How to cite this article:
Maheswara Reddy Mallu, Sandeep Vemula, Srinivasa Reddy
Ronda. Optimization of Fermentation Medium for the Production
of Recombinant Antihrombin III from Saccharomyces cerevisiae
through Statistical Experimental Designs. J App Pharm Sci, 2015; 5
(12): 014-020.


