Optimization of a transferred arc reactor for metal ... · PDF fileRESEARCH PAPER Optimization...
11
RESEARCH PAPER Optimization of a transferred arc reactor for metal nanoparticle synthesis Matthias Stein . Frank Einar Kruis Received: 3 February 2016 / Accepted: 8 August 2016 / Published online: 29 August 2016 Ó The Author(s) 2016. This article is published with open access at Springerlink.com Abstract The demand for metal nanoparticles is increasing strongly. Transferred arc synthesis is a promising process in this respect, as it shows high production rates, good quality particles and the ability of up-scaling. The influence of several process parameters on the performance of the process in terms of production rate and particle size is investigated. These parameters are the electrode design and adjust- ment, the gas flow rate and power input. A novel feeding mechanism allows process operation over an extended time period. It is shown that the process is capable of producing pure metal nanoparticles with variable primary particle sizes and comparatively high production rates. Optimal process conditions for a single transferred arc electrode pair are found, which allow further scale-up by numbering up. Keywords Metal nanoparticles Á Transferred arc Á Plasma synthesis Á Crucible design Á Production rate Introduction Metal nanoparticles are used in numerous applications and products (Jain et al. 2007; Luo et al. 2006; Feldheim and Foss 2002). To mention just a few applications, copper nanoparticles are used to increase the thermal conductivity of nanofluids (Liu et al. 2006) and nickel particles are used for the catalytic purposes (Kim et al. 2005). The number of applications and related products is steadily increasing as well as the number of scientific reports and patents. As the industry is increasing its application of metal nanopar- ticles in their commercial products, the demand for high-quality metal nanoparticles is rapidly increasing. However, the state of the art does not offer a process which fully answers this increasing demand. A promising way to produce pure metal nanoparticles in larger amounts is the transferred arc synthesis (Mahoney and Andres 1995; Celik et al. 2002). It can deliver potentially a high output of nanoparticles, without using any hazardous or expensive precursors. A further advantage is the cost-effective power supply, as an off-the-shelf TIG welder can be used to ignite and maintain the arc (Chen et al. 2006). The carrier gas composition has a marked influence on the production rate and particle size in transferred arc nanoparticle synthesis (Murphy et al. 2009). For non-nitride-forming metals, it has been found that nitrogen is by far the most efficient carrier gas (Stein et al. 2013a). This is a result of the enhanced arc power of nitrogen and a bubble formation effect resulting M. Stein Á F. E. Kruis (&) Institute of Technology for Nanostructures (NST) and Center for Nanointegration Duisburg-Essen (CENIDE), University of Duisburg-Essen, Bismarckstr.81, 47057 Duisburg, Germany e-mail: [email protected] URL: http://www.uni-due.de/nst 123 J Nanopart Res (2016) 18:258 DOI 10.1007/s11051-016-3559-y
Transcript of Optimization of a transferred arc reactor for metal ... · PDF fileRESEARCH PAPER Optimization...
RESEARCH PAPER
Optimization of a transferred arc reactor for metalnanoparticle synthesis
Matthias Stein . Frank Einar Kruis
Received: 3 February 2016 / Accepted: 8 August 2016 / Published online: 29 August 2016
� The Author(s) 2016. This article is published with open access at Springerlink.com
Abstract The demand for metal nanoparticles is
increasing strongly. Transferred arc synthesis is a
promising process in this respect, as it shows high
production rates, good quality particles and the ability
of up-scaling. The influence of several process
parameters on the performance of the process in terms
of production rate and particle size is investigated.
These parameters are the electrode design and adjust-
ment, the gas flow rate and power input. A novel
feeding mechanism allows process operation over an
extended time period. It is shown that the process is
capable of producing pure metal nanoparticles with
variable primary particle sizes and comparatively high
production rates. Optimal process conditions for a
single transferred arc electrode pair are found, which
allow further scale-up by numbering up.
Keywords Metal nanoparticles � Transferred arc �Plasma synthesis � Crucible design � Production rate
Introduction
Metal nanoparticles are used in numerous applications
and products (Jain et al. 2007; Luo et al. 2006;
Feldheim and Foss 2002). To mention just a few
applications, copper nanoparticles are used to increase
the thermal conductivity of nanofluids (Liu et al. 2006)
and nickel particles are used for the catalytic purposes
(Kim et al. 2005). The number of applications and
related products is steadily increasing as well as the
number of scientific reports and patents. As the
industry is increasing its application of metal nanopar-
ticles in their commercial products, the demand for
high-quality metal nanoparticles is rapidly increasing.
However, the state of the art does not offer a process
which fully answers this increasing demand. A
promising way to produce pure metal nanoparticles
in larger amounts is the transferred arc synthesis
(Mahoney and Andres 1995; Celik et al. 2002). It can
deliver potentially a high output of nanoparticles,
without using any hazardous or expensive precursors.
A further advantage is the cost-effective power supply,
as an off-the-shelf TIG welder can be used to ignite
and maintain the arc (Chen et al. 2006).
The carrier gas composition has a marked influence
on the production rate and particle size in transferred
arc nanoparticle synthesis (Murphy et al. 2009). For
non-nitride-forming metals, it has been found that
nitrogen is by far the most efficient carrier gas (Stein
et al. 2013a). This is a result of the enhanced arc power
of nitrogen and a bubble formation effect resulting
M. Stein � F. E. Kruis (&)
Institute of Technology for Nanostructures (NST) and
Center for Nanointegration Duisburg-Essen (CENIDE),
University of Duisburg-Essen, Bismarckstr.81,
47057 Duisburg, Germany
e-mail: [email protected]
URL: http://www.uni-due.de/nst
123
J Nanopart Res (2016) 18:258
DOI 10.1007/s11051-016-3559-y

frommolecular gas attributes. The production rates of,
e.g. copper nanoparticles, nitrogen exceeds one of the
copper nanoparticles in argon by several magnitudes.
Reactive transferred arc synthesis can also be used,
e.g. to synthesize ceramic nanoparticles (Kiesler et al.
2015).
The cost efficiency of the setup makes the process
scalable by numbering up, as the TIG welder power
supplies are much more affordable than dedicated
high-power plasma sources. This numbering up is
necessary, as an increase of production rate for a single
arc by increased power input leads to too large
particles (Uda et al. 1983). However, before number-
ing up, the basic process of one electrode pair needs to
be understood well and to work as efficiently as
possible. This study investigates the optimization of a
single transferred arc process, which can be used then
for scale-up by numbering up. Optimization is done in
terms of production rate, specific electricity consump-
tion and primary particle size, and is mainly done by
means of an optimization of the crucible design as well
as the process parameters plasma current and gas flow
rate.
Experimental setup
Figure 1 shows the experimental setup. The heart of
the setup is the reactor chamber (1), in which the
particle formation takes place. The experimental
setup, including the reactor chamber and its functional
principle, has been discussed in more detail before
(Stein et al. 2013a). For this process, patent applica-
tions have been filed (DE102014220817A1, US
2016/0101402A1, EP3009187A1).
The reactor chamber is evacuated by a vacuum
pump (4) prior synthesis and refilled by two gas flows,
adjusted by mass flow controllers (3). The process
pressure is atmospheric. During processing, one gas
flow is used as carrier gas flow (Q1) and the other one
as a quench gas flow (Q2). The arc is ignited by a
commercial TIG welder (2) between a tungsten rod
cathode and a graphite crucible anode, which carries
the material to be evaporated by the arc. The crucible
serving as anode is a crucial part of the transferred arc
synthesis. Multiple crucible designs and electrode
arrangements are therefore tested. All crucibles are
made of a massive graphite rod. A cylindrical recess
with a diameter of 20 mm and a depth of 10 mm is
used to fill in the feedstock material to be evaporated.
On the other side, a recess with a diameter of 21 mm
allows to place it on top of a tungsten rod serving as
crucible carrier. The crucible is not cooled in order to
minimize the energy losses and to keep the reactor
chamber as simple as possible.
The aerosol formed when the metal vapour cools
down is led into a filter (7) in which the particles are
separated from the gas and collected as a powder. This
powder can be used for BET measurement in order to
determine the primary particle size of the produced
Fig. 1 Experimental setup
258 Page 2 of 11 J Nanopart Res (2016) 18:258
123

particles. Before the filter, a measurement line is
installed, which allows the adaption of several mea-
surement devices to characterize further particles
attributes. As measurement equipment, gravimetric
measurements (8), an Electrostatic Precipitator (ESP)
for microscope measurements (9), and a combination
of several online measurements are arranged.
A Tapered Element Oscillating Microbalance
(TEOM, 11) is used to determine the aerosol mass
load. A combination of Scanning Mobility Particle
Sizer (SMPS, 12) and Electrical Low Pressure
Impactor (ELPI, 13) is used to obtain information
about agglomerate size and structure and also the
primary particle size. The online measurement proce-
dure is discussed in detail elsewhere (Stein et al.
2013b).
At the top of the chamber, a feeding mechanism (6)
is installed, which replenishes the material loss from
the crucible. By keeping the crucible filled and
therefore the distance between the electrodes constant,
a stable production over time can be realized. The
feeder is designed to refill the crucible with bulk metal
with minimal vacuum leakage. Therefore, it is
integrated into standard ISO-KF 40 flanges, which
guarantee full vacuum capability at minimal costs. An
electric motor drives a cylinder, with a small drill
inside (Fig. 2). While the drill is filled with shots on
the reservoir side, it is emptied on the other side, where
shots drop into the crucible. It is also designed to
prevent wedging of feeding material inside the mech-
anism and therefore can be used with a variety of
forms and shapes of feedstock materials. Typically,
shots of the desired metal with sizes of 1–2 mm are
used. By this method, the feed amount is given by the
volume of the reservoir and number of rotations,
which is adjusted to the evaporation rate of the
material. Here, the feeding mechanism is initiated at
regular intervals accommodating the amount of mate-
rial loss.
The online measurement devices are used through-
out this work in order to get information about particle
and agglomerate size, production rate and specific
electricity consumption in dependency of different
process parameters. The goal is therefore to increase
the production rate, while keeping the particle size on
the nanoscale. The investigated parameters and their
effect on the production are the electrode arrangement
and crucible design, the effect of carrier gas compo-
sition, gas flow and arc power. Furthermore, the long-
term stability of the process is investigated using the
dedicated feeding mechanism.
Results and discussion
Influence of crucible design and gas flow direction
This section describes the development of the crucible
design for optimal conditions of particle synthesis via
transferred arc. The reactor chamber allows due to its
design multiple arrangement possibilities, allowing to
test different crucible designs. The electrode arrange-
ment allows changing the position of the two
electrodes relative to each other, as well its position
relative to the direction of the gas flow.
Electrode arrangement
Figure 3 shows an exemplary electrode arrangement
of the transferred arc setup. The tungsten rod cathode
is placed in a 90� angle to the crucible. It has been
found that this arrangement is advantageous in com-
parison to other positions. With this cathode position,
the arc runs stable and is easy to ignite. Furthermore,
high power arcs can be used without any visible
cathode consumption as the arc is deflected upwards
and does not heat the cathode that strongly. TheFig. 2 Electrically controlled feeder
J Nanopart Res (2016) 18:258 Page 3 of 11 258
123
crucible anode carrying the feedstock is placed on top
of a crucible carrier at the bottom of the reactor
chamber. Gas flows coming from different directions
can be used: an axial flow Q1, which enters the reactor
chamber at the bottom flange streaming along the
crucible or a cross flow Q2, coming from the side
streaming along the cathode directed on the arc. The
aerosol outlet is the top flange of the reactor housing,
unless stated otherwise.
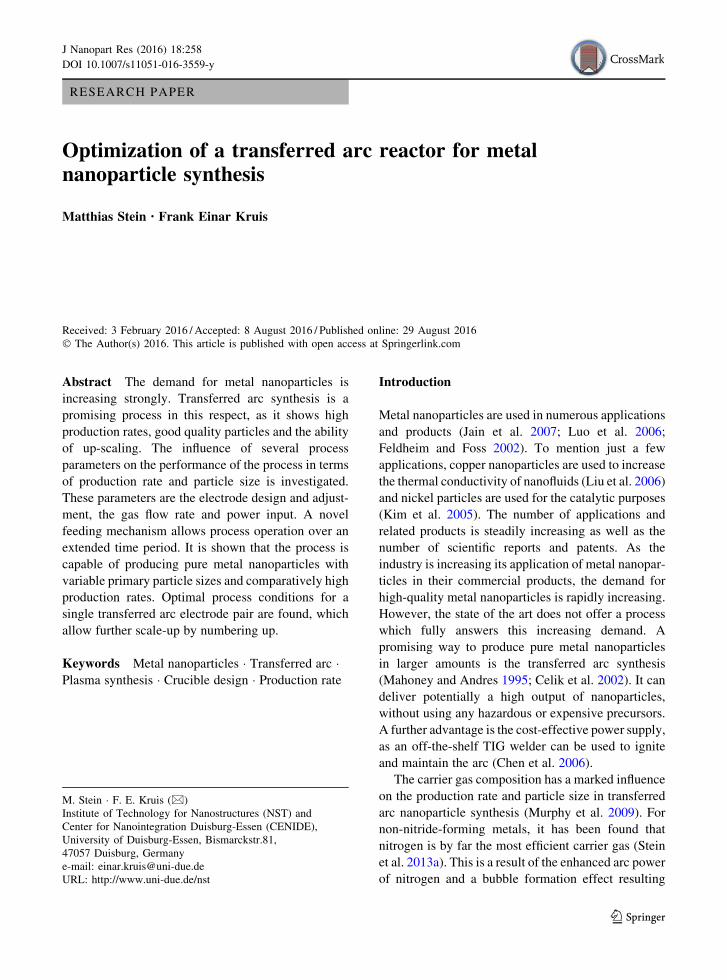
Figure 4 depicts the different crucible designs and
their effect on production rate (bars) and particle size
(asterisks) for copper nanoparticles. Designs for open
crucibles (1–3), open crucibles with guided aerosol
outlet (4), guided flow crucibles (5–6) and crucibles
with a funnel placed above them can be distinguished.
The gas flow direction is also shown: axial flow (Q1),
cross flow (Q2) or both gas flows combined
(Q1 ? Q2). The total gas flow (nitrogen, 15 l/min)
and the applied power (35A) are kept constant.
Open crucibles
Crucible 1 is the simplest to manufacture and leads to a
production rate of about 700 mg/h when using axial
flow, the production rate in the cross flow setup (Q2)
being much smaller. This can be explained by the fact
that a gas flowing in the same direction as the
buoyancy leads to less turbulences and therefore to
smaller particle losses. Another advantage of the axial
setup is a much more stable arc, which is especially for
lower electric currents useful.
Crucible 2 has a reduced diameter in the middle part
in order to reduce the heat losses towards the current
feedthrough, which results in a minor increase of
production rate and particle size. This approach is
continued during the design of crucible 3 where the
upper part of the crucible is conically shaped. Due to
the decreased effective diameter, the heat losses are
reduced even more, leading to a further increase in
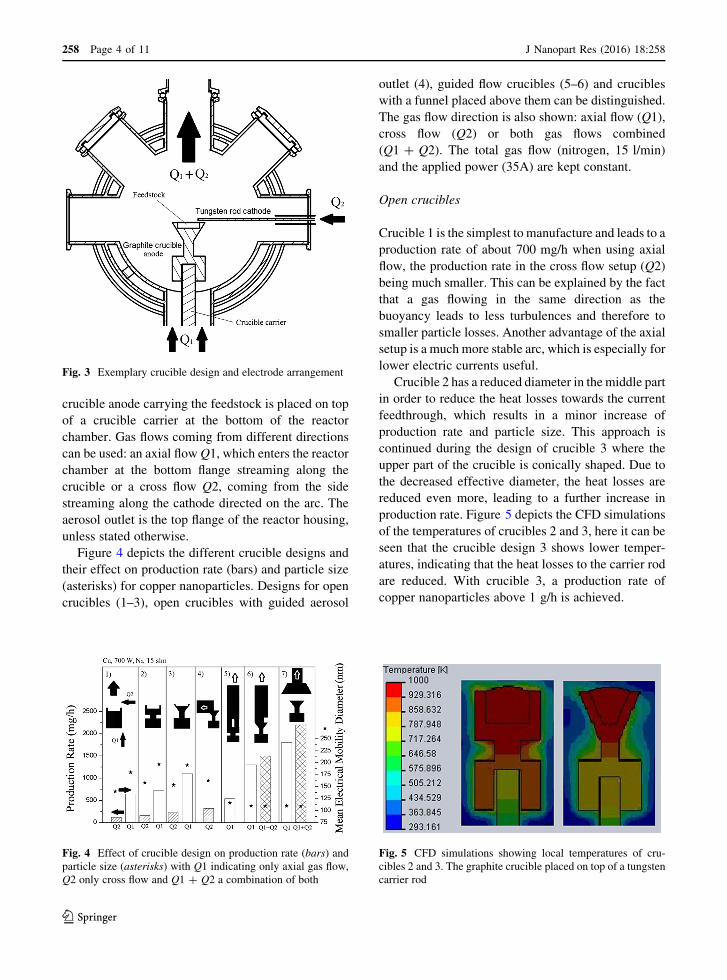
production rate. Figure 5 depicts the CFD simulations
of the temperatures of crucibles 2 and 3, here it can be
seen that the crucible design 3 shows lower temper-
atures, indicating that the heat losses to the carrier rod
are reduced. With crucible 3, a production rate of
copper nanoparticles above 1 g/h is achieved.
Fig. 3 Exemplary crucible design and electrode arrangement
Fig. 4 Effect of crucible design on production rate (bars) and
particle size (asterisks) with Q1 indicating only axial gas flow,
Q2 only cross flow and Q1 ? Q2 a combination of both
Fig. 5 CFD simulations showing local temperatures of cru-
cibles 2 and 3. The graphite crucible placed on top of a tungsten
carrier rod
258 Page 4 of 11 J Nanopart Res (2016) 18:258
123

Open crucible with guided aerosol outlet
Further crucible designs also have a reduced effective
diameter to minimize heat losses. The main goal of
optimization is to reduce the particle losses inside the
reactor chamber, as the water-cooled walls of the
reactor are a potential thermophoretic trap for the
particles formed. In crucible design 4, a graphite tube
guides the flow Q2 out of the reactor zone in a cross
flow orientation. However, the gas tends to flow
upwards as a result of the buoyancy so that many
particles do not enter the pipe directly. In comparison
to crucible 3, a small increase in production rate is
observed when using the cross flowmode (Q2), but the
production rate is much smaller than the axial flow
mode of crucible design 3.
Guided flow crucibles
The axial flow mode has been used in further crucible
designs, as this configuration showed in the preceding
investigations to be more productive. In these designs,
the aerosol flow is guided more directly out of the
reactor, avoiding flow recirculation within the reactor
chamber. This allows also gravity-based feeding of
feedstock material through the outlet into the crucible,
which is discussed in a following section. Crucible
design 5 has a graphite tube with four elongated gas
inlets placed above the integrated crucible which
should guide the aerosol directly out of the chamber.
However, the arc plasma tends to leave the graphite
tube through one of the holes opposite to the cathode at
higher currents. This design shows a significant
decrease in production rate in comparison to the axial
mode of crucible design 3 due to particles losses inside
the chamber. To overcome the problem of the arc
leaving the tube, the tube of crucible design 6 has only
one inlet. It shows an increased production rate
(1300 mg/h) at the axial flow mode (Q1). By adding
a cross flow Q2 to the main flow Q1, the production
rate is increased further, while the particle size is
reduced. The combination of cross and axial flow
appears to be an optimum solution to increase the
production rate up to 1.5 g/h, while keeping the
particle size in the desired nanoscale range. With this
setup, almost no particle deposition inside the chamber
is visible after synthesis. However, clogging at the
inside of the crucible tube occurs after some time
(Fig. 6). It seems that material splashed but not
evaporated from the melt deposits inside the tube,
acting also as a condensation trap for the metal vapour,
so that the tube is clogged after some time. A higher
gas flow rate Q1 (40 l/min) only leads to particle
deposition closer to the melt. A further problem of this
design is the thermal conductivity of the tube which
results in high temperatures at the outlet flange of the
reactor housing damaging the rubber sealing. Addi-
tional cooling of the flanges would require a new
design of the housing and might lead to increased
thermophoretic losses. Crucible design 6 is therefore
only suited for low-production rate processes where
the clogging does not present a problem.
Crucible with funnel
To surmount the clogging problem and the high
temperatures of the outlet flange, in crucible design 7,
the crucible is separated from the guided aerosol
outlet, here a 60-mm graphite hood with an opening of
52 mm and an angle of 62�. A hood above a particle
Fig. 6 Image of crucible 6 clogged with copper particles
J Nanopart Res (2016) 18:258 Page 5 of 11 258
123

forming zone to increase the particle yield has been
used, e.g. in flame reactors before (Mueller et al.
2003). Figure 7 shows the inner design of the setup
with crucible design 7, which is found to result in the
highest production rates and smallest primary particles
sizes of all the crucible designs. It shows no clogging
even after 8 h of copper nanoparticle production. This
setup has several advantages in comparison with the
former designs. First, clogging due to splashed
particles does not occur anymore. Second, the heat
losses to the outlet guidance are decreased signifi-
cantly due to the separation of crucible and hood, so
that production rates above 2 g/h are reached with this
setup. Due to the combination of axial and cross flow,
the particle size can be reduced to less than 100 nm.
The cross gas flow Q2 has a significant influence on
the primary particle size, but it also affects the arc
directly. At higher values (5 l/min), it deflects the arc
away from the centre (Fig. 8), but the diameter of the
funnel is larger than that of the crucible so that the
visible particle losses inside the reactor chamber are
not so significant. Figure 8 shows a photograph of the
plasma with crucible design 7 at two different cross
flows. The influence of the cross flow is investigated in
the following section.
Influence of power input and gas flow
on production rate and particle size
The power input has traditionally been used as a
controlling parameter for material evaporation in
transferred arc synthesis (Wei et al. 2006; Forster
et al. 2012). The higher the power of the arc, the more
energy is directed to the anode and hence to the
material to be evaporated. While a higher energy input
increases the temperature and therefore the evapora-
tion of material and so the particle production rate, it
increases the energy costs for the system as well.
Influence of power input on production rate
Former investigations show that a nitrogen arc has a
significantly higher production rate than the other
investigated arcs (Stein et al. 2013a). Therefore, for
non-nitride-forming metals, nitrogen is used for the
investigation of the influence of the power input and
gas flow on the particle production rate. For other
metals, argon is used instead. Figure 9 depicts the
influence of the applied electric current on the
production rate for the different metals, using crucible
design (CD) 6. It can be concluded that a higher
electric current leads to an increased production rate.
This increase levels off at higher currents, at which a
further rise in electric current does not increase the
Fig. 7 Setup with crucible design 7
Fig. 8 Deflection of the arc plasma due to cross flow over the cathode (left Q2 = 3 l/min, right Q2 = 5 l/min)
258 Page 6 of 11 J Nanopart Res (2016) 18:258
123

production rate. As the electric current is the control-
ling parameter of the power supply, the results are
shown as function of current and not of power. The
voltage varies only between 18 and 22 V over the
range of currents used, so that the power is more or less
proportional to current. The production rate is strongly
material dependent, the responsible parameter for that
however is difficult to determine, and is not just
dependent of the materials’ vapour pressure. Other
effects, such as thermal or electrical conductivity, heat
flux or bubble formation can affect the production rate
(Stein et al. 2013a). Of all investigated metals, zinc has
the highest production rate, owned to its high vapour
pressure. In nitrogen, a production rate[30 g/h has
been observed at 45 A. The production rate is
increased by a factor of approximately 70, by raising
the applied current from 5 to 45 A. The only other
metal which reaches a production rate of 1 g/h with
this setup is copper. At 45 A, nearly 2.2 g/h of copper
nanoparticles are produced in nitrogen. The increase
of production rate in dependency of the current is not
that strong in comparison to zinc.
The increase of production rate with current is the
least significant for silver and aluminium. The max-
imum production rate of silver is determined to be
around 0.4 g/h, even at 65 A, which is the maximum
limit of applied current for the setup, due to the strong
heat development. Aluminium is known to form
nitrides; hence, argon is used as carrier gas for
aluminium synthesis. At 65 A, the maximum attain-
able production rate is about 20 mg/h. If nitrogen is
used and aluminium nitride formed, the production
rate increases approximately by a factor 10. The
dependency of the current stays nearly the same. FeCr
shows strong dependency on the current, its produc-
tion rate nevertheless is the lowest of all investigated
metals. However, the feedstock composition of FeCr
cannot be transformed 1:1 into aerosol particles, as the
produced particle shows an excess of chromium.
Specific electricity consumption at different arc
currents
Figure 10 shows the specific electricity consumption.
Except for zinc, the specific electricity consumption is
constant for all metals over the range of electric
current applied. An increase in power (electric current)
leads to an increase in production rate, so that the
efficiency of the process stays constant, even for
higher production rates. Only zinc shows a non-
constant behaviour, which can be explained by strong
evaporation above 5 A. At 45 A, specific electricity
consumption of 25 kWh/kg is observed for zinc. As
the specific electricity consumption is almost constant
for the other metals in the investigated power range, it
appears that the production of nanoparticles by this
method can be increased by supplying more power to
the process.
Dependence of primary particle size on arc current
Figure 11 shows the primary particle size for zinc,
copper, silver, and aluminium as function of the arc
current (and therefore as function of input power). The
Fig. 9 Production rate of different metals in dependence of the
applied electric current (CD 6, Q1 = 20 l/min)
Fig. 10 Specific electricity consumption of different metals in
dependence of the applied electric current (CD 6, Q1 = 20 l/
min)
J Nanopart Res (2016) 18:258 Page 7 of 11 258
123

biggest particles are produced with zinc, due to its high
evaporation rate. The particle size ranges depending
on the input current between 78 and 220 nm. Silver
particles are produced in a size range of 76–144 nm
(primary particle size), and copper particles between
48 and 112 nm. The particle sizes of aluminium are
much smaller, as they are produced with argon as
carrier gas. It is remarkable that silver exceeds the
particle size of copper, although the production rate is
much higher for copper than for silver. This might be
consequence of the rapid sintering of silver even at low
temperatures, which favours the formation of bigger
primary particles and less agglomerates. However, the
primary particle size increases with the applied
electric current for all metals, eventually exceeding
the size of 100 nm. It means by definition that no
longer nanoparticles are produced. The point where
this limiting value is exceeded is material dependent.
Hence, an increase in production rate by simply
increasing the power input has an inherent limitation.
Influence of gas flow rates on production rate
and primary particle size
Further optimization of production rate in the
nanoscale size range can be realized by the amount
and direction of the gas flow, using CD 7. Figure 12
depicts the influence of the amount and direction of the
gas flow on the production rate and primary particle
size for copper particles at 35 A. It shows that the
production rate increases with the carrier gas flow Q1.
An explanation of this is that at higher gas flows, a
more efficient transport of particles out of the
formation zone occurs. Also particle losses in the
lines are decreased extensively at higher gas flows.
Nevertheless, volume flow higher than 40 l/min is not
used due to instabilities of the arc and excessive carrier
gas consumption. The second (cross) flow Q2 is also
beneficial in terms of production rate. By adding 3 l/
min from the side, the production rate can be increased
about 1 g/h (Q1 = 40 l/min), to a value of approxi-
mately 5.5 g/h. If the cross flow Q2 increased further
(dotted line), the production rate decreases signifi-
cantly. On the one hand, the arc gets unstable at a cross
flow = 5 l/min so that the production process is quite
discontinuous. On the other hand, much smaller
particles are formed at this flow. The particle size
decreases significantly with the cross flow Q2, as it
directly influences the residence time in the nucleation
and coagulation zone. The primary particle size is the
result of coagulation between particles (either spher-
ical or agglomerated) and sintering within agglomer-
ates if the local temperature is below the melting point.
Higher gas flow rates will lead to shorter residence
times, reducing not only the time molten particles that
might grow due to Brownian collisions, but also
reducing the time primary particles that can increase
their size due to solid-state diffusion or other sinter
mechanisms. The increased gas flow might also
decrease the total arc temperature and hence the
effective zone in which the primary particle can
increase their size due to the aforementioned mech-
anisms. Principally, one can adjust the primary
particles size of the copper nanoparticles in the range
from 60 to 130 nm by varying the nitrogen gas flow. In
order to reach the maximal production rate of metal
Fig. 11 Primary particle size of different metals in dependence
of the applied electric current (CD 6, Q1 = 20 l/min)
Fig. 12 Influence of amount and direction of gas flow on
production rate (left) and particle size (right) at 35 A (CD 7)
258 Page 8 of 11 J Nanopart Res (2016) 18:258
123

nanoparticles, a main carrier gas flow Q1 as high as
possible and a cross flowQ2 at about 3 l/min appear to
be optimal.
Optimal process parameters
Table 1 summarizes the optimal parameters to pro-
duce metal nanoparticles with the present reactor in
larger amounts keeping the particle size below 100 nm
(except for zinc). The applied parameters are strongly
material- and carrier gas-dependent. For most metals,
CD7 appears to be the best in terms of production rate,
which might be a consequence of the higher carrier gas
flows, which can be used with this setup. The mass
load per cubic centimetre stays almost constant, when
the gas flow is doubled, but the particle size decreases.
For aluminium and FeCr, the argon arcs with CD 6
seem to be most promising. The production rate is
comparatively low due to the use of argon in
comparison to the other metals. A further increase in
gas flow does not lead to an increased production rate.
In comparison to CD 7, CD 6 shows slightly decreased
particle losses to the reactor walls and is hence
preferred for metals with lower production rates. A
cross flow Q2 is advantageous for the synthesis with
CD 7. At a value of 3 l/min, the arc remains stable,
while significantly smaller particles can be produced.
The particle size of argon produced particles is much
smaller, so that an additional decrease of particle size
is not required. As discussed before, the applied
electric current impacts the production rate and hence
particle size strongly, which means that the highest
current is not automatically the optimal process
condition. The evaporation rates of copper and zinc
are very high even at lower currents. An increase in
current might lead to a marginal increase in
evaporation and production rate, but it is not beneficial
in terms of electricity consumption and particle size.
Due to the heat development at higher currents,
current values above 60 A have not been used.
Table 2 shows the production rate, specific elec-
tricity consumption, mobility size (agglomerates) and
primary particle size (BET) of the different metals
achieved with the optimal parameters of Table 1. Due
to its vapour pressure, zinc is the material with the
highest production rate and hence lowest specific
electricity consumption. More than 30 g/h of zinc
nanoparticles with a mean primary particle size of
180 nm can be produced. By the techniques discussed
before, the particle size can be reduced, but at the
expense of decreased production rate. Copper
nanopowder with a mean primary particle size of
83 nm can be produced with a rate of 5.5 g/h. The
specific electricity consumption of copper production
is approx. 180 kWh/kg. The maximum realized pro-
duction rate of silver has been approx. 1 g/h with a
particle size of 120 nm. The particle size at this
production rate seems rather large, especially when
compared to the values of copper. Also, the mobility
size of the produced silver agglomerates almost does
not differ from the primary particle size, which
indicates the formation of very dense agglomerates
consisting of only few, but larger particles due to
sintering. The production rates of aluminium and FeCr
are low, because argon has been used. The production
rates are in the milligram range (30 mg/h for alu-
minium, 20 mg/h for FeCr and chromium). The
specific electricity consumptions are hence signifi-
cantly higher than the ones produced by a nitrogen arc.
However, the particle sizes are very small, which can
make this synthesis procedure relevant for some
applications even at these low-production rates.
Table 1 Optimal
parameters for different
metals with the transferred
arc reactor
Metals Carrier gas CD Q1 (l/min) Q2 (l/min) Elect. current (A)
Zinc Nitrogen 7 40 3 25
Copper Nitrogen 7 40 3 35
Silver Nitrogen 7 40 3 60
Aluminium Nitrogen 6 20 0 60
FeCr Nitrogen 6 20 0 60
J Nanopart Res (2016) 18:258 Page 9 of 11 258
123

Crucible feeding and long-term process stability
In order to ensure that the process is indeed energy-
and cost-efficient, the system has to run as long as
possible with the minimal possible number of inter-
ruptions and operator actions. This section reports on
the long-term stability of the process, using a
dedicated crucible feeding mechanism, which fills
the evaporated amount of metal back into the crucible.
The production rate of the different metals at different
electric currents, determined by gravimetric measure-
ment, using CD 7 is plotted over a time span of 4 h as
shown in Fig. 13. Measurements are performed every
30 min during an interval of 90 s. As can be seen, the
production rate remains constant over the 4-h time
span. Longer runs (8 h) were also possible and ran
without any problems. BET measurements show
constant values of primary particle sizes over the 4-h
time span. The mean production rates over time differ
from the maximum values determined in the previous
section. The mean production rate of copper over time
is with 4 g/h almost 28 % below the production rate
reported earlier in this work, a possible explanation
might be the lower mean level of the melt over time as
compared to using a freshly filled crucible.
Conclusion
The production rate and particle size in transferred arc
synthesis are optimized by a variation of reactor
design and process conditions in comparison to a
previous setup. By optimizing the crucible design, an
increase of production rate by a factor of 4 as
compared to the earlier reported results (Stein et al.
2013a) has been realized. The increase of production
rate is a result of a minimization of the heat losses at
the crucible surface and therefore an increase in
evaporation rate and the minimization of particle
losses to the reactor chamber due to a guided aerosol
outlet. The optimization of the crucible design allows
furthermore an increase of carrier and quench gas
flows, which results in a better control and reduction of
particle size. It has been found that an increase of
carrier gas flow does not only lead to a reduced
primary particle size, but also to an increase of
effective production rate. This increase is a result of
the enhanced transport of material out of the particle
formation zone. It is well known that the increase of
power input results in an increase of production rate in
arc synthesis; however, in this study, also a direct
relation between production rate and particle size is
given. It shows that there is a limit to increasing the
production rate of the nanoparticles by increasing the
power input. Long-term process stability has been
obtained by the use of a dedicated feeding mechanism.
Process runs of up to 8 h are achieved. Summarizing,
it can be said that the performance in terms of
production rate and particle size of a single electrode
pair in transferred arc synthesis can be raised signif-
icantly. The limiting factor of production rate however
is the primary particle size, which will also increase
with production rate. Further increase of production
rate of nanoparticles not larger than 100 nm can only
be achieved by numbering up the optimized electrode
pairs.
Acknowledgments The research leading to these results has
received funding from the European Union’s Seventh
Framework Program under Grant Agreement No. 280765
(BUONAPART-E).
Table 2 Production rate (PR), specific electricity consumption
(SEC), agglomerate mobility diameter dm and primary particle
diameter dP of the different metals achieved with the optimal
parameters from Table 1
Metals PR (g/h) SEC (kWh/kg) dm (nm) dP (nm)
Zinc 36 12 212 180
Copper 5.5 179 144 83
Silver 1 1139 128 120
Aluminium 0.03 32,025 65 15
FeCr 0.02 41,017 63 18
Fig. 13 Production rate over time for different metals
258 Page 10 of 11 J Nanopart Res (2016) 18:258
123

Open Access This article is distributed under the terms of the
Creative Commons Attribution 4.0 International License (http://
creativecommons.org/licenses/by/4.0/), which permits unre-
stricted use, distribution, and reproduction in any medium,
provided you give appropriate credit to the original
author(s) and the source, provide a link to the Creative Com-
mons license, and indicate if changes were made.
References
Celik C, Addona T, Boulos MI, Chen G, Davis HJ (2002)
Method and transferred arc plasma system for production
of fine and ultrafine powders. United States Patent No.
6379419 B1
Chen J, Lu G, Zhu L, Flagan RC (2006) A simple and versatile
mini-arc plasma source for nanocrystal synthesis.
J Nanopart Res 9:203–212
Feldheim DL, Foss CA (2002) Metal nanoparticles: synthesis,
characterization, and applications. Decker, New York
Forster H, Wolfrum C, Peukert W (2012) Experimental study of
metal nanoparticle synthesis by an arc evaporation/con-
densation process. J Nanopart Res 14(7):1–16
Jain PK, Huang X, El-Sayed IH, El-SayedMA (2007) Review of
some interesting surface plasmon resonance-enhanced
properties of noble metal nanoparticles and their applica-
tions to biosystems. Plasmonics 2(3):107–118
Kiesler D, Bastuck T, Theissmann R, Kruis FE (2015) Plasma
synthesis of titanium nitride, carbide and carbonitride
nanoparticles by means of reactive anodic arc evaporation
from solid titanium. J Nanopart Res 17:152
Kim HS, Lee H, Han KS, Kim JH, Song MS, Park MS, Lee JY,
Kang JK (2005) Hydrogen storage in Ni-nanoparticle-
dispersed multiwalled carbon nanotubes. J Phys Chem
109:8983–8986
Liu MS, Lin MCC, Tsai CY, Wang CC (2006) Enhancement of
thermal conductivity with cu for nanofluids using chemical
reduction method. Int J Heat Mass Transf 49:3028–3033
Luo X, Morrin A, Killard AJ, Smyth MR (2006) Application of
nanoparticles in electrochemical sensors and biosensors.
Electroanalysis 18(4):319–326
Mahoney W, Andres RP (1995) Aerosol synthesis of nanoscale
clusters using atmospheric arc evaporation. Mater Sci Eng
A204:160–164
Mueller R,Madler L, Pratsinis SE (2003) Nanoparticle synthesis
at high production rates by flame spray pyrolysis. Chem
Eng Sci 58(10):1969–1976
Murphy AB, Tanaka M, Tashiro S, Sato T, Lowke JJ (2009) A
computational investigation of the effectiveness of differ-
ent shielding gas mixtures for arc welding. J Phys D Appl
Phys 42:115205
Stein M, Kiesler D, Kruis FE (2013a) Effect of carrier gas
composition on transferred arc metal nanoparticle synthe-
sis. J Nanopart Res 15:1400–1413
Stein M, Kiesler D, Kruis FE (2013b) Adjustment and online
determination of primary particle size in transferred arc
synthesis of copper nanoparticles. Aerosol Sci Technol
47:1276–1284
Uda M, Ohno S, Hoshi T (1983) Process for production fine
metal particles. US Patent No. 4376740
Wei Z, Xia T, Ma J, Dai J, Feng W, Wang Q, Yan P (2006)
Growthmechanism of Cu nanopowders prepared by anodic
arc plasma. Trans Nonferrous Met Soc China 16:168–172
J Nanopart Res (2016) 18:258 Page 11 of 11 258
123


![Performance assessment of tightly baffled long leg ... · X-point Target Divertor implemented in ARC [4] ARC divertor challenge: reactor-scale power in compact machine. • ARC divertor](https://static.fdocuments.in/doc/165x107/5e84395e19095c15aa76cb7d/performance-assessment-of-tightly-baffled-long-leg-x-point-target-divertor-implemented.jpg)