Optimization Methods Applied to Automotive Connecting Rod
20
SAE TECHNICAL PAPER SERIES 2013-36-0633 E RAFAEL AUGUSTO DE LIMA E SILVA Optimization Methods Applied to Automotive Connecting Rod Mechanical Design MARCO LÚCIO BITTENCOURT Downloaded from SAE International by Vellore Inst of Technology, Thursday, January 09, 2014 11:10:18 PM
description
Connecting Rod
Transcript of Optimization Methods Applied to Automotive Connecting Rod

SAE TECHNICALPAPER SERIES
2013-36-0633E
RAFAEL AUGUSTO DE LIMA E SILVA
Optimization Methods Applied to Automotive Connecting Rod Mechanical Design
MARCO LÚCIO BITTENCOURT
Downloaded from SAE International by Vellore Inst of Technology, Thursday, January 09, 2014 11:10:18 PM

The appearance of the ISSN code at the bottom of this page indicates SAE’s consent thatcopies of the paper may be made for personal or internal use of specific clients. This consent isgiven on the condition however, that the copier pay a
$ 7.00 per article copy fee through the Copyright Clearance Center, Inc. Operations Center,222 Rosewood Drive, Danvers, MA 01923 for copying beyond that permitted by Sections 107or 108 of U.S. Copyright Law. This consent does not extend to other kinds of copying such ascopying for general distribution, for advertising or promotional purposes, for creating newcollective works, or for resale.
SAE routinely stocks printed papers for a period of three years following date of publication.Direct your orders to SAE Customer Sales and Satisfaction Department.
Quantity reprint rates can be obtained from the Customer Sales and Satisfaction Department.
To request permission to reprint a technical paper or permission to use copyrighted
SAE publications in other works, contact the SAE Publications Group.
No part of this publication may be reproduced in any form, in an electronic retrieval system orotherwise, without the prior written permission of the publisher.
ISSN 0148-7191
Copyright © 2013 SAE International
Positions and opinions advanced in this paper are those of the author(s) and not necessarilythose of SAE. The author is solely responsible for the content of the paper. A process isavailable by which discussions will be printed with the paper if it is published in SAETransactions. For permission to publish this paper in full or in part, contact the SAEPublications Group.
Persons wishing to submit papers to be considered for presentation or publication throughSAE should send the manuscript or a 300 word abstract of a proposed manuscript to:Secretary, Engineering Meetings Board, SAE.
Downloaded from SAE International by Vellore Inst of Technology, Thursday, January 09, 2014 11:10:18 PM

Page 1 of 18
2013-36-0633
Optimization Methods Applied to Automotive Connecting Rod Mechanical Design
MSc. Rafael Augusto de Lima e Silva(1,2), Prof. Dr. Marco Lúcio Bittencourt(2) 1-ThyssenKrupp Metalúrgica Campo Limpo, 2-Universidade Estadual de Campinas
Copyright © 2013 SAE International
ABSTRACT
Nowadays, the mechanical design of automotive connecting rods is essentially guided by analytic calculations followed by numeric methods to assess the stresses, displacements, contact pressures, fatigue and buckling. The present work, applies an alternative methodology based on the method of topology optimization to design the connecting rod aiming mass reduction. Two connecting rods designs were developed using two different methodologies, which the methodology considering the topology optimization generated a 3% lighter connecting rod and with improved lubrication performance when compared with the conventional design obtained from the current design methodology.
Keywords: connecting, rod, mechanical, design, topology, optimization
INTRODUCTION
The mechanical design of ICE components is essentially guided by final customer’s requirements and by emission laws. There is a notable trend of specific power increasing on new engine developments following new vehicles releases. This is obtained, usually by the combustion pressure increase which results in undesirable side effects: NOX emissions and component load increases. Moreover, some markets demand low CO2 emissions directly by customers and law requirement, or even indirectly by the importance that customers give to fuel consumption.
The side effects of specific power increase can be solved by different engineering strategies. The NOX emissions are usually solved by combustion improvement and after treatment solutions as EGR and SCR. However, the CO2 emissions are not attenuated by the same strategies, thus it is pursued friction and mass reductions. Finally, the components loading increase can be solved by the use of higher grade materials and/or by components re-sizing. One can notice the
conflicting relation between the necessities of reduce components mass to attenuate CO2 emissions while it is critical to re-size the components in order to allow them to have higher load capability.
The motivation of the present work is to deal with these contradictory automotive industry demands by the use of modern optimization tools in order to achieve more competitive internal combustion engine components.
Internal combustion engines are composed by a sort of piston-rod-crank mechanisms. The connecting rod primary function is to provide the joint between the oscillating and the rotating components, the piston and the crankshaft, respectively. Its secondary function is to transmit the combustion load from the piston to the crankshaft. Therefore, for the connecting rod functions maintenance, it must support the stresses to ensure the joint between the piston and the crankshaft, transmitting the loads between them.
The most common assembly solution for internal combustion engines is the use of a bolted joint in the connecting rod split big end. The big end split was traditionally done by the serration and machining of the joint surfaces, but since the nineties the fracture split process is been applied in automotive connecting rods [1, 13, 14].
Finally, this work objective is to perform two mechanical designs of an automotive connecting rod to a Diesel internal combustion engine for Heavy Duty trucks by the wide use of optimization methods to reduce the final connecting rod mass.
MATERIALS AND METHODS
Object of Study
The object of study is a fracture split connecting rod for future Heavy Duty Trucks with new Diesel engine which characteristics are listed on Table 1.
Downloaded from SAE International by Vellore Inst of Technology, Thursday, January 09, 2014 11:10:18 PM

Page 2 of 18
Figure 1. Heavy duty Diesel connecting rod
Table 1. Engine data sheet
Current Future Displacement 15L 15L Cylinders 6 6 Bore 137mm 137mm Stroke 169mm 169mm Conrod Length 261.5mm 267mm Rated Power 600hp@2100rpm 680hp@2100rpm Peak Torque 2779N.m@1200rpm 3137N.m@1000rpm Overspeed 2625rpm 2625rpm Overspeed Peak 3150rpm 3150rpm PCP 190bar 240bar Oil Type SAE15W40 SAE15W40 Piston Mass 5.56kg 5.56kg Pin Mass 1.70kg 1.70kg Pin Diameter 64mm 60mm Pin Length 85mm 92mm Crank Diameter 94mm 106mm Crank Sidewall 58mm 62mm
Materials used
The connecting rod mechanical design was performed using the following materials:
PTC Pro-ENGINEER WildFire4.0 CAD software; ANSYS Workbench Structural 12.0 Software; FE Design TOSCA Structure 7.1.1 Software; LINDO Systems LINGO 12.0 Software; MAGNA FEMFAT Basic 4.8 Software; AVL EXCITE PowerUnit 2011.2.
Project Requirements
The conrod design must fulfill the project requirements:
Fatigue Safety Factor – SF>1.1 – After Statistical Factor; Mass – mb <= 7.26 kg – Piston and Pin Masses; Center of Gravity – LCG < 1/3 L – Conrod Length; Buckling Load XX – PcrX > 20FC – Max Compression; Buckling Load YY – PcrY > 5FC – Max Compression; Small End Press. – PACP < SY – Conrod Yield Limit; Big End Pressure – POFP < SY – Shell Yield Limit; Big End Oil Film – MOFT > 3 Rq – Shell Roughness; Equivalent Stress – σeqv < SY – Conrod Yield Limit; Split Joint Residual Pressure – Pr > 1 MPa; Bolt Head Pressure – PK < SY – Conrod Yield Limit; Bolt Fatigue Stress – σa < Sf – Bolt Fatigue Limit; Max Displacement – umax < 0.5 mm;
.
Conventional Mechanical Design
The conventional mechanical design of connecting rods is usually performed iteratively by the integration of CAD and CAE tools as shown in Fig. 2. Similar methodology was presented by [7] focused on fatigue analysis.
Figure 2. Conventional Methodology used on Conrods Mechanical Design
New Mechanical Design
A new methodology for connecting rods mechanical design is presented in Fig. 3, similar to the one discussed in [17] with exception of new optimization loop after CAE procedures that in the present work includes not only FEA, but also fatigue, buckling and EHL analyses.
Downloaded from SAE International by Vellore Inst of Technology, Thursday, January 09, 2014 11:10:18 PM

Page 3 of 18
Figure 3. New Methodology proposed for Conrods Mechanical Design
Dynamic Loads
The dynamic loads are calculated by traditional formulation according to [3] and [6]. It is performed an additional coordinate transformation in order to have the loads according to an inertial reference attached to the connecting rod. Two critical conditions must be calculated for stress and fatigue analyses:
Rated Power of 680hp@2100rpm Continuous Overspeed @2625rpm
Additionally, two other conditions must be calculated for connecting rod shank dimensioning: Peak Torque of 3137N.m@1000rpm Overspeed Peak @3150rpm
which force peaks can be estimated analytically considering that the crank-angle is equal to 0 in these conditions. The maximum compressive force is
)1(14
22 RmDPCPF pC
where PCP is the peak cylinder pressure, D is the cylinder diameter, R is the half-stroke, ω is the angular speed, λ is the R/L relation and mp is the piston and pin masses. While the maximum tensile force is
)2(11 22 RmL
LmRmL
LF bCG
pbCG
T
where L is the connecting rod length, LCG is its CG distance and mb is the connecting rod mass.
Figure 4. Conrod Dynamic Loads in Rated Power.
Figure 5. Conrod Dynamic Loads in Continuous Overspeed.
Downloaded from SAE International by Vellore Inst of Technology, Thursday, January 09, 2014 11:10:18 PM

Page 4 of 18
Sizing
It is necessary to perform an initial material selection for the connecting rod dimensioning. Knowing that the connecting rod is to be fractured split, the indicated material is the C70 Steel developed by [13] and studied by [1] that gathered the material data similar to the material data used in Table 2.
Table 2. C70 Steel data.
Young’s Modulus 200GPa Poisson Ratio 0.3 Density 7820g/cm3 Ultimate Tensile Strength 900MPa Yielding Limit 550MPa
I-Beam Optimization
The main dimensioning is related to the connecting rod shank where is commonly used the I-Beam section (Fig. 6) which planar properties are given by:
hBhbHBI
BhbhBHI
bhhHBA
yy
xx
333
333
121
)3(121
Figure 6. I-Beam section dimensions.
It is proposed the following optimization problem for the dimensioning of this I-Beam section:
BbbBBHhHH
II
IIAAas
IA
yyyy
xxxx
xx
min
max
max
min
000
)4(
:..
min
min
min
which the minimum area and moments of inertia must be defined from analytical fatigue and buckling model, respectively, while the maximum dimensions must be defined from an envelope analysis to understand the connecting rod clearances in the engine according to [10] as well as its manufacturing constraints.
The minimum required cross section area is defined from a fatigue model considering constant mean stresses as following:
: )5(2
)('minf
SFFSFA CT
in which SF is the shank fatigue safety factor, FT is the maximum tensile force over the entire engine running conditions, FC is the maximum compressive force and Sf’ is the corrected fatigue limit defined according to [12] and [15]:
)6(...... var'
fiousreltempsurfsizeload SCCCCCCSf
The minimum required moments of inertia of the section area are defined from the buckling model described by [8] considering one pivoted joint and buckling in two planes:
)7(10
10
2
212
2
212
min
min
ELFNB
I
ELFNBI
Cyyy
Cxxx
in which NB is the buckling safety factor, L is the connecting rod length and E is the elastic modulus of the material.
Bolts Sizing
The bolts sizing can be performed preliminary by the following iterative algorithm:
Downloaded from SAE International by Vellore Inst of Technology, Thursday, January 09, 2014 11:10:18 PM

Page 5 of 18
1. Calculate maximum tensile force from maximum engine speed - FT;
2. Estimate the number of bolts to be used – n; 3. Guess the bolt diameter – d; 4. Calculate the Tensile Strength(SR) and Yielding Limit(SY)
from bolts grades (8.8, 10.9 or 12.9); 5. Estimate the clamp load by:
)8(4
75.02dSF YM
6. Calculate bolt stress by:
)9(4422 dn
FdF TM
P
7. Check if the bolt stress is acceptable;
If RP S , return to 3, else, finish
One important remark is that after the conceptual phase, after the preliminary drawing is delivered, a design phase starts and it is suggested to verify the clamp loads more accurately according to [9] and [16].
CAD 3D Model
The connecting rod 3D model is prepared using any CAD system, for instance, the PTC Pro-Engineer Wildfire4.0 software, to describe the geometry and calculate the mass and its CG. It must be taken care to dimension the transition radii from the shank to the ends of the connecting rod. It is suggested to consider the maximum possible tangent radius in each of these features in order to avoid stress notches on the connecting rod. During this phase, it must be verified the engine clearances by envelop analysis, mainly, to evaluate the gap between the connecting rod and the cylinder liner at the maximum Conrod angle according to [10].
Finite Element Analysis (FEA)
Finite element modeling is performed in ANSYS to evaluate displacements, stresses, contact pressures, buckling and fatigue performance considering the engine loads. There are two main groups of FE models: one for big end analysis and other for small end analysis. This separation is done because the connecting rod is a component subjected to dynamic harmonic loads that are different between the two ends of the connecting rod: the small and big ends; this load unbalance causes the connecting rod acceleration.
The finite element models are constructed with the following assumptions:
1. Frictional contact model with gap in the crankpin/bearing shell and piston pin/conrod;
2. Frictional contact model in the bolt head/cap, bearing shell/conrod;
3. Rough contact model in the fractured joint face, i.e.: no sliding DOF;
4. Bonded contact model in the bolt thread/stem, in the engaged thread region;
5. No threads considered; 6. Symmetry of one half; 7. Small displacements; 8. Linear isotropic material models, i.e., no plasticity.
The connecting rod is meshed with second order 3D 10-node tetrahedral structural solid elements SOLID187 [2]. Moreover, the bolts, bearing shells and crankpin are meshed with second order 3D 20-node structural hexahedral solid elements SOLID186 [2]. Surface-to-Surface penetration contact models are configured with the standard element CONTA174 and its pair TARGE170 considering the asymmetric approach. In this way, the contact results are available only for contact (master)side with the CONTA174 elements, in this case, the cap of the connecting rod, the bolt head, crank pin, bearing shells and piston pin surfaces. The clamp load is modeled by using pretension elements PRETS179 [2] in the region of the bolt shank. The meshing strategy is carried out to better refine the contact surfaces with the CONTA174 elements.
Big End FEA
The big end analysis boundary conditions showed in Figure 7 include the bolt clamp load of 91,600N and subsequently, stepped compression of 287,348N from Rated Power and 71,174N from Continuous Overspeed on the crankpin, which has also a displacement constraint to avoid rotation. The same approach for tensile loads: stepped tensile of 65,418N from Rated Power and 108,971N from Continuous Overspeed. The symmetry boundary condition is applied and the small end bore surface is rigidly constrained.
Figure 7. Big End BC’s in Rated Power - Compression (Left) and Tensile (Right)
Downloaded from SAE International by Vellore Inst of Technology, Thursday, January 09, 2014 11:10:18 PM

Page 6 of 18
Small End FEA
The small end analysis boundary conditions showed in Figure 8 include the external stepped compression of 317,221N from Rated Power and 34,138N from Continuous Overspeed on piston pin surface which has also a displacement constraint to avoid rotation. The same approach for the tensile loads: stepped tensile of 34,726N from Rated Power and 61,013N from Continuous Overspeed. The symmetry boundary condition is applied and the big end bore surface is rigidly constrained.
Figure 8. Small End BC’s in Rated Power - Compression (Left) and Tensile (Right)
Linear Buckling FEA
Linear buckling analysis is performed with simplified boundary conditions, considering 1kN compressive load showed on Fig. 9. Rigid remote support and rigid remote force are applied in the bores of the connecting rod considering its overall length to evaluate the buckling. The first 5 buckling modes are calculated.
Figure 9. Linear Buckling BC’s
Fatigue Analysis
The numerically calculated stresses are post processed using FEMFAT Basic calculation using modified equivalent stresses in the critical plane criteria for constant mean stress. It is also considered the following influence factors:
Mean stress influence Stress gradient influence Surface roughness by FKM method Shot peen by FKM method Modified Haigh Diagram Statistical influence by Gauss for 99.999% reliability
The C70 Steel is modeled using TGL material generator, from the properties listed on Table 2, resulting in the Haigh Diagram (Fig. 10).
Figure 10. Haigh Diagram
Elasto-Hydrodynamic Lubrication (EHL)
The Elasto-Hydrodynamic Lubrication analysis is performed in AVL EXCITE PowerUnit software considering flexible conrod body condensed to reduce the number of DOF’s to 1069 DOF’s and 357 nodes, being the CG described by 1 node and 6DOF’s, the small end bore by 28x7 nodes and 588DOF’s and the big end bore with 32x5 nodes and 480DOF’s. The combustion loads are applied in the flexible piston pin described by 13nodes and 78DOF’s and the flexible crank pin is described by 5nodes and 30DOF’s with predefined circular motion. The flexible dynamics model shown in Fig. 11 will be solved by Newton-Raphson time integration.
Downloaded from SAE International by Vellore Inst of Technology, Thursday, January 09, 2014 11:10:18 PM

Page 7 of 18
Figure 11. Connecting rod flexible dynamics model
The connecting rod bearings are modeled by Reynolds Equation with constant viscosity and temperature, joint type EHD2 C-S [4]. The metal-to-metal contact is formulated by Greenwood/Tripp Model assuming that the average summit height is approximately half of the roughness. The Table 3 gathers all relevant data for EHL analysis.
Table 3. EHL input data
Small End Big End -Structural Mesh 28 x 7 32 x 5 -Fluid Mesh 140 x 28 128 x 20 -Radial Clearance 0.05mm 0.03mm -Housing Roughness 0.20μm 0.20μm -Shaft Roughness 0.15μm 0.20μm -Housing Young Modulus 200GPa 120GPa -Shaft Young Modulus 200GPa 200GPa -Friction Coefficient 0.15 0.10 -Oil Type SAE 15W40 SAE15W40 -Oil Temperature 130ºC 130ºC -Oil Supply Pressure 1.10atm 4.00bar -Oil Cavitation Pressure 0.10 bar 0.10bar
Initial Domain CAD 3D Model
The initial domain CAD 3D model showed in Fig. 12 is prepared using PRO Engineer Wildfire 4.0 software to describe the maximum possible volume that the connecting rod can have limited to the engine clearances from an envelope analysis according to [10].
Figure 12. Initial Domain 3D Model
Initial Domain FE Model
The initial domain is modeled by finite elements in ANSYS, as shown in Fig. 13, considering ½ symmetry. By limitation of the topology optimization method, there will be only 1 FE model instead of 2 models as described in FEA section. All contacts will be modeled as well as the bolt clamp loads. Two load conditions are imposed: tensile of 107,128N from Continuous Overspeed condition and compression of 317,221N from Rated Power condition according to Fig. 14.
Figure 13. Initial Domain FE Model
Downloaded from SAE International by Vellore Inst of Technology, Thursday, January 09, 2014 11:10:18 PM

Page 8 of 18
Figure 14. Initial Domain BC’s, Compression from Rated Power (Left) and Tensile from Continuous Overspeed (Right)
Topology Optimization
The topology optimization is performed in TOSCA Structure 7.1.1 using the classical formulation of minimum compliance subjected to a volume equality constraint calculated from the initial domain mass and the mass target, refer to [5] for theory and other applications. Because the compressive load from the Rated Power condition is 3 times bigger than the tensile load from Continuous Overspeed condition, a weight of 2 it’s applied in the strain energy of the Tensile BC solution, in order to have this critical BC considered by the Topo Controller optimizer based on the optimality criteria [18].
Shape Optimization
The shape optimization is performed considering FEMFAT fatigue analysis to minimize the fatigue damage using TOSCA with Shape Controller algorithm. The constraints will be only related to the design variables, in order to keep the BC regions and contact regions frozen to avoid un-convergence in non-linear FEA solution.
RESULTS
Dynamic Loads
The maximum compression occurs in the Peak Torque condition when the PCP is maximum of 24 MPa and ω is 104.72rad/s (1000rpm)
2675.84172.1040845.026.7137
424 22
CF
kNNFC 3453449306.88563.353787
The maximum tensile occurs during Overspeed Peak, when ω is 329.87rad/s (3150rpm)
11 22 RmL
LmRmL
LF bCG
pbCG
T
kNNFT 1571569482.1139602.42988
I-Beam Optimization
The bending fatigue limit of C70 steel was estimated according to [12] by
MPaSf
4509005.0
The tension-compression fatigue limit was estimated from eq. 06 considering that the shank region is subject to shot peen, therefore, no surface factor was considered:
MPaSf
315450.0.10.10.10.10.17.0'
The connecting rod minimum cross section area was calculated considering a fatigue safety factor of 1.5 according eq. 05:
2min 1195
)315(2)345000157000(5.1 mmA
The minimum moments of inertia was calculated from eq. 07.
4592
212
4592
212
1023.610200
267.0345000510
1049.210200
267.03450002010
min
min
mmI
mmI
yy
xx
The optimization proposed in eq. 04 was solved in LINGO 12:
BbmmmmB
HhmmH
mmI
mmImmAas
BhbhBHbhhHB
yy
xx
4.6320
0480
1023.6
1049.21195:..
12min
44
45
2
333
Resulting in the following:
Downloaded from SAE International by Vellore Inst of Technology, Thursday, January 09, 2014 11:10:18 PM

Page 9 of 18
44
45
2
10.50,9
10.90,21195
4.632
32.1348
mmI
mmImmA
mmbmmB
mmhmmH
yy
xx
Where it can be observed that the minimum relation of area to moment of inertia was obtained when the main dimensions H and B where in the maximum possible values while the minor thickness b was in minimum value possible. One can realize that the relief height–h can be dimensioned from the minimum area constraint as following:
bBABHh
bbBBHH
min
min
max
max
Bolts Sizing
The sizing of bolts was performed according the algorithm in the Materials and Methods section:
1. FT=157000N; 2. n=4; 3. d=12mm; 4. SR =1200MPa; SY =0.9x1200=1080MPa;
5. NFM 91600412108075.0
2
;
6. MPaP 1157124
157000412916004
22 ;
7. OK
CAD 3D Model
The 3D model was constructed using solid modeling approach securing that the shank cross section planar properties were achieved as previously calculated. The conrod is bushingless, therefore, only the bearing shells and bolts were modeled
Figure 15. Conrod Design from Conventional Method.
Topology Optimization
The topology optimization results after 14 iterations in Fig. 16 show the trend of removing mass in the center of the shank, which is exactly the region were the I-Beam profile has its weight relief. One can notice that the main dimensions were kept, which is very similar to the I-Beam optimization results, where the main dimensions B and H were kept in maximum values. Moreover, the final topology has a big hollow in the shank transition to the big end while the transition to small end has a small hollow that was starting to be designed by the topology optimizer (See appendix for optimizer report).
Figure 16. Elements Densities Before (left) and After (right) Topology Optimization.
Downloaded from SAE International by Vellore Inst of Technology, Thursday, January 09, 2014 11:10:18 PM

Page 10 of 18
Linear Buckling FEA
After CAD interpretation, buckling analysis was performed, and from these results it was decided to remove the hollow of the concept connecting rod. One can see in Fig. 18 that the hollow facilitates the buckling, reducing the critical load to 5301kN which was not acceptable according to the requirements. Therefore, hollow was removed, increasing the buckling load to 14175kN according to Fig. 19.
Figure 17. Conventional Conrod Linear Buckling Results
Figure 18. Hollowed Conrod Linear Buckling Results
Figure 19. Concept Conrod Linear Buckling Results
Shape Optimization
The shape optimization was performed after the removal of hollow interpreted from topology optimization with objective to minimize the maximum fatigue damage calculated by FEMFAT. The shape optimization result after 50 iterations is shown in Appendix. This result suggested rounding of some radii at the shank transition region that helped the final modeling of Concept Conrod in Fig 20.
Figure 20. Concept Conrod Design from Proposed Method.
Big End FEA
The Big end FEA displacement results in Fig. 21 and 23 are in accordance with the model described by [11]. One can notice the bearing clearances being closed after the external forces application. However, stress peaks were calculated on the bolts contacts that must be neglected since the connecting rod material Yield Limit is 550MPa. The stress fringes are shown only for Rated Power in appendix.
Downloaded from SAE International by Vellore Inst of Technology, Thursday, January 09, 2014 11:10:18 PM

Page 11 of 18
Figure 21. Displacements on Compression BC from Rated Power condition (100x magnification).
Figure 22. Conventional (upper) and Concept (lower) Conrod Big End Contact Pressures on Compression BC
from Rated Power condition.
The contact pressure results in the bearing shells show that the Concept Conrod distributes the compression load better than the Conventional Conrod leading to 17% lower peak pressure, as can be seen in Fig. 22.
Figure 23. Displacements on Tensile BC from Continuous Overspeed condition.(100x magnification)
Figure 24. Conventional (upper) and Concept (lower) Split Joint Contact Pressures on Tensile BC from Continuous Overspeed.
The split joint contact pressures in Fig. 24 show that both connecting rods kept the joint closed during the Overspeed loads. One can notice that the Residual Pressure, i.e., the minimum pressure on the interface is far higher than the minimum project requirement.
Downloaded from SAE International by Vellore Inst of Technology, Thursday, January 09, 2014 11:10:18 PM

Page 12 of 18
Small End FEA
The Small End FEA displacements in compression from Rated Power condition show that the piston pin deflection due to compression is critical for both connecting rods. One can realize that the pin deflection in the Concept Conrod is slightly higher than the Conventional Conrod (Fig. 25) while the contact pressure is slightly lower (Figs. 26 and 27). This is explained by the Concept Conrod lower shank stiffness of the due to its thin I-Beam elements. The von Mises stress fringes are shown only for Rated Power in appendix.
Figure 25. Conventional (Left) and Concept (Right) Conrod Displacements on Compression BC from Rated Power
condition (100x magnification).
Figure 26. Conventional Conrod Small End Contact Pressures on Compression BC from Rated Power condition
Figure 27. Concept Conrod Small End Contact Pressures on Compression BC from Rated Power condition.
Fatigue Analysis
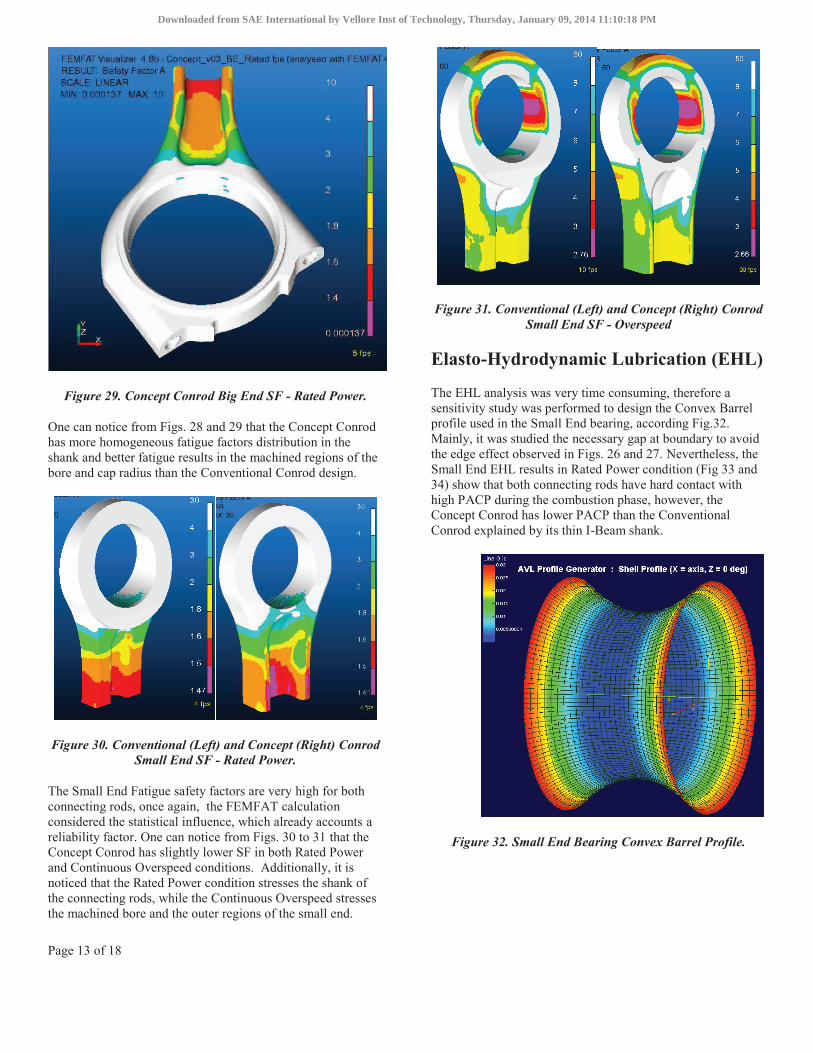
Considering that FEMFAT calculations already have reliability factor from statistical influence, the SF calculated for the big end are very high in both Rated Power and Continuous Overspeed conditions. The scale minimum must be neglected due to the bolts contacts, therefore, the big end SF is 1.4 on the shank for both rods (Figs. 28 and 29).
Figure 28. Conventional Conrod Big End SF - Rated Power.
Downloaded from SAE International by Vellore Inst of Technology, Thursday, January 09, 2014 11:10:18 PM
Page 13 of 18
Figure 29. Concept Conrod Big End SF - Rated Power.
One can notice from Figs. 28 and 29 that the Concept Conrod has more homogeneous fatigue factors distribution in the shank and better fatigue results in the machined regions of the bore and cap radius than the Conventional Conrod design.
Figure 30. Conventional (Left) and Concept (Right) Conrod Small End SF - Rated Power.
The Small End Fatigue safety factors are very high for both connecting rods, once again, the FEMFAT calculation considered the statistical influence, which already accounts a reliability factor. One can notice from Figs. 30 to 31 that the Concept Conrod has slightly lower SF in both Rated Power and Continuous Overspeed conditions. Additionally, it is noticed that the Rated Power condition stresses the shank of the connecting rods, while the Continuous Overspeed stresses the machined bore and the outer regions of the small end.
Figure 31. Conventional (Left) and Concept (Right) Conrod Small End SF - Overspeed
Elasto-Hydrodynamic Lubrication (EHL)
The EHL analysis was very time consuming, therefore a sensitivity study was performed to design the Convex Barrel profile used in the Small End bearing, according Fig.32. Mainly, it was studied the necessary gap at boundary to avoid the edge effect observed in Figs. 26 and 27. Nevertheless, the Small End EHL results in Rated Power condition (Fig 33 and 34) show that both connecting rods have hard contact with high PACP during the combustion phase, however, the Concept Conrod has lower PACP than the Conventional Conrod explained by its thin I-Beam shank.
Figure 32. Small End Bearing Convex Barrel Profile.
Downloaded from SAE International by Vellore Inst of Technology, Thursday, January 09, 2014 11:10:18 PM

Page 14 of 18
0
50
100
150
200
250
300
350
400Pr
essu
re [M
Pa]
720 810 900 990 1080 1170 1260 1350 1440Crank angle (deg)
POFP (MPa)PACP (MPa)Total Pressure (MPa)
Max Y372.541394.289394.39
at X111411071107
Mean Y (arith.)130.42539.5421144.225
Figure 33. Conventional Conrod Small End Joint EHL Results in Rated Power condition
0
50
100
150
200
250
300
350
400
Pres
sure
[MPa
]
720 810 900 990 1080 1170 1260 1350 1440Crank angle [º]
POFP (MPa)PACP (MPa)Total Pressure (MPa)
Max Y336.128322.178337.504
at X111310991113
Mean Y (arith.)126.91937.1291138.553
Figure 34. Concept Conrod Small End Joint EHL Results in Rated Power condition
Hydrodynamic Pressure at 1114.00 deg
-22.603
-12.603
-2.603
7.397
17.397
27.397
Bear
ing
Wid
th [m
m]
0 90 180 270 360Shell Angle (deg)
0
5e+007
1e+008
1.5e+008
2e+008
2.5e+008
3e+008
3.5e+008
4e+008Pressure (Pa)
Hydrodynamic Pressure at 1113.00 deg
-20.5
-15.5
-10.5
-5.5
-0.5
4.5
9.5
14.5
19.5
24.5
Bear
ing
Wid
th [m
m]
0 90 180 270 360Shell Angle (deg)
0
5e+007
1e+008
1.5e+008
2e+008
2.5e+008
3e+008
3.5e+008
4e+008Pressure (Pa)
Figure 35. Small End POFP in Rated Power for Conventional Conrod (upper) and Concept Conrod (lower)
The EHL results of the Big End Joint in the Rated Power condition show that although the MOFT of Concept Conrod is lower than the Conventional Conrod (Fig. 35), the last one distributes better compression loads from the combustion due to its lower stiffness, resulting in considerably lower POFP according to Figs. 36 and 37.
g
0
2
4
6
8
10
12
14
16
MO
FT (m
icro
n)
720 810 900 990 1080 1170 1260 1350 1440Crank angle [º]
Conventional conrod (micron)Concept conrod (micron)
Min Y0.9874630.563914
at X11011099
Figure 36. Big End MOFT in Rated Power for Conventional Conrod (red) and Concept Conrod (blue)
This is explained by the shank I-Beam shapes differences. In one hand, the Conventional Conrod has thick I-Beam elements with, therefore, the Hydrodynamic Pressure concentrates on the center of the bearing (Fig. 39). In other hand, the Concept Conrod has thin I-Beam elements, guiding the compression forces over the entire bearing width, loading the center and also the edges in way that the hydrodynamic pressures follows slightly the I-Beam shape as can be noticed in Fig. 39. However, the edge loading caused PACP peaks in the Concept Conrod as shown in Fig.38. It is necessary to remark that this peak is very low (26MPa) and occurs in a small fraction of the engine cycle, therefore, it is not a critical result.
g
0
20
40
60
80
100
120
140
160
180
Pres
sure
[MPa
]
720 810 900 990 1080 1170 1260 1350 1440Crank angle [º]
POFP (MPa)PACP (MPa)Total Pressure (MPa)
Max Y161.3440.111887161.344
at X109111011091
Mean Y (arith.)29.99370.0015369529.9937
Figure 37. Conventional Conrod Big End Joint EHL Results in Rated Power condition
g
0
20
40
60
80
100
120
140
160
180
Pres
sure
[MPa
]
720 810 900 990 1080 1170 1260 1350 1440Crank angle [º]
POFP (MPa)PACP (MPa)Total Pressure (MPa)
Max Y125.82926.3464125.829
at X109110991091
Mean Y (arith.)25.87350.68405425.8735
Figure 38. Concept Conrod Big End Joint EHL Results in Rated Power condition
Downloaded from SAE International by Vellore Inst of Technology, Thursday, January 09, 2014 11:10:18 PM

Page 15 of 18
Hydrodynamic Pressure at 1091.00 deg
-24.95
-14.95
-4.95
5.05
15.05
25.05Be
arin
g W
idth
[mm
]
0 90 180 270 360Shell Angle (deg)
02e+007
4e+0076e+007
8e+0071e+008
1.2e+0081.4e+008
1.6e+0081.8e+008
Pressure (Pa)
Hydrodynamic Pressure at 1091.00 deg
-24.95
-14.95
-4.95
5.05
15.05
25.05
Bear
ing
Wid
th [m
m]
0 90 180 270 360Shell Angle (deg)
0
2e+0074e+007
6e+0078e+007
1e+0081.2e+008
1.4e+0081.6e+008
1.8e+008Pressure (Pa)
Figure 39. Big End POFP in Rated Power for Conventional Conrod (upper) and Concept Conrod (lower)
Table 4. Results Summary
Conrod Conventional Concept Diff. Mass 6.83kg 6.62kg -3% CG 84.23mm 82.79mm -1.7% Rod Oscillating Mass 2.20kg 2.05kg -6.7% Rod Rotating Mass 4.63kg 4.57kg -1.3% Buckling Load XX 1794.1kN 2744.7kN +53% Buckling Safety XX 5.2 8.0 +53% Buckling Load YY 13613kN 14175kN +4.1% Buckling Safety YY 39.5 41.1 +4.1% Small End SF 1.47 1.41 -4.1% Big End SF 1.40 1.40 0% Small End Stress 130.8MPa 137.1MPa +4.8% Small End Pressure 269.2MPa 217.5MPa -26.5% Big End Stress >550MPa >550MPa 0% Big End Pressure 133.1MPa 110.5MPa -17% Joint Residual. Press. 36.3MPa 41.9MPa 15.4% Small End POFP 372.5MPa 336.1MPa -10% Small End PACP 394.3MPa 322.2MPa -18.3% Big End POFP 161.3MPa 125.8MPa -22% Big End MOFT 0.99μm 0.56 μm -43.4%
SUMMARY/CONCLUSIONS
The methodology based on topology optimization guided the development of a thin I-Beam Conrod Concept that is 3% lighter and has 6.7% less oscillating mass than the Conventional Conrod designed by conventional procedures.
Additionally, the Concept Conrod has 22% less POFP and 10% less PACP than Conventional Conrod due to its thinner I-Beam elements, suggesting that it can have better lubrication performance; The optimization techniques are fully applicable to connecting rods mechanical design; however, each one can be more useful on different Product Project phases:
The Topology Optimization Method presents good opportunities for the design and induces the engineers to test the limits of the component geometry; however, it does not deliver the final design automatically, thus it is recommended for conceptual phases. Furthermore, in the case of the Conrod, it resulted in a hollowed shank that was not feasible due to buckling requirements. This was identified as a limitation of the method.
The Shape Optimization was applied to minimize the maximum fatigue damage of the Concept Conrod. After 50 iterations, the results suggested radius rounding in the shank transitions to the ends that helped the modeling of the Concept Conrod. Therefore, this method is suggested to improve Products, mainly, after conceptual phases.
The Sensitivity Analysis can be applied to time consuming analysis. In this work it was used for the selection of the Convex Barrel profile gap at the edges of the in the small end bearing, that distributes the pressure avoiding edge contact. Therefore, this technique is recommended for optimization of Products, mainly, after design phase.
For future works, it is suggested to integrate the EHL and FEA models and run multi-objective optimization in a realistic conrod design. Finally, to solve the identified topology optimization limitation, it is suggested to develop algorithms that take into account the buckling modes and its critical loads.
REFERENCES
1. AFZAL, A. Fatigue behavior and life predictions of forged steel and powder metal connecting rods, Master Degree Thesis, The University of Toledo, Toledo, 2004, 241p.
2. ANSYS, Release 11.0 Documentation, ANSYS Inc., United States, 2007.
3. AVL, Excite Designer v2011 Theory, Austria, 2011. 4. AVL, Excite Power Unit v2011.1 Theory, Austria, 2011. 5. BENDSÖE M. P., SIGMUND O., Topology Optimization
– Theory, Methods and Applications. Springer, Berlim, 1st ed., 2004.
6. BOSCH, Automotive Handbook, SAE Society of Automotive Engineers, 4th ed., Germany, 1996.
7. CHACON H., Structural and fatigue numerical analysis for connecting rods development. SAE Technical Paper Series, v. 01, n. 2515, 2006. 11p.
Downloaded from SAE International by Vellore Inst of Technology, Thursday, January 09, 2014 11:10:18 PM

Page 16 of 18
8. GERE, J.M. Mecânica dos Materiais. Thompson Learning, São Paulo, 1 ed., 2003.
9. LIMA E SILVA R. A., Diesel engine connecting rod bolted joint opening analysis with analytic and finite element models, SAE Technical Paper Series, 2010-36-0244I, 2010, 21p.
10. LIMA E SILVA R. A. et. all., Automotive Connecting Rod Development: Oval Beam Design and Testing, SAE Technical Paper Series, 2012-36-0576, 2012, 14p.
11. LONDHE A., YADAV V., S.A. Finite element analysis of connecting rod and correlation with test. SAE Technical Paper Series, v. 01, n. 0816, 2009. 12p.
12. NORTON, R. L. Projeto de máquinas: uma abordagem integrada. Bookman, Porto Alegre, 2 ed., 2004.
13. ONARILAN, C. A; STICKELS, M. A. Separation of forged steel connecting rods and caps by fracture splitting, SAE Technical Paper Series, 93-0033, 1993, 8p.
14. REPGEN, B. Optimized connecting rods to enable higher engine performance and cost reduction, SAE Technical Paper Series, 98-0882, 1998, 7p.
15. SHIGLEY, M. Mechanical Engineering Design. McGraw-Hill, Singapore, 5 ed., 1989.
16. SPS METALAC, Comportamento das Juntas Rigidamente Fixadas por Parafusos, Training Material, SPS Metalac Indústria e Comércio Ltda, Brasil, 2008.
17. TOLEDO D. G. C. et. all, Design of a connecting rod of internal combustion engine by applying the Topology Optimization Method. 20th INTERNATIONAL CONGRESS OF MECHANICAL ENGINEERING, Gramado-RS, Brasil, 2009, 7p.
18. TOSCA, TOSCA Structure 7.1.1 Documentation, FE-DESIGN GmbH, Karlsruhe, Germany, 2011
CONTACT INFORMATION
MSc. Rafael Augusto de Lima e Silva(1,2) Phone: +55 (11) 4039-9294 E-mail: [email protected] Alternative: [email protected]
Prof. Dr. Marco Lúcio Bittencourt(2) Phone: +55 (19) 3521-3171 E-mail: [email protected]
1- Research & Development Engineering ThyssenKrupp Forging Group ThyssenKrupp Metalúrgica Campo Limpo Ltda Avenida Alfried Krupp, 1050 13231-900 Campo Limpo Paulista São Paulo – Brasil.
2- Mechanical Design Department School of Mechanical Engineering University of Campinas Caixa Postal: 6122-Barão Geraldo 12093-970 Campinas, São Paulo – Brasil.
ACKNOWLEDGMENTS
The author would like to thanks all people involved in this project: Alex Rodrigues, Robson Cruz, Giovanni Morais, Almir Atoatte, Pedro Ferreira, Sergio Villalva, Diogo Stuani and Wiliam Su. Finally, thanks to all institutions that supported the conduction of this project, specially ThyssenKrupp Metalúrgica Campo Limpo and UNICAMP. DEFINITIONS/ABBREVIATIONS
3D Tri Dimensional BC Boundary Condition CAD Computer Aided Design CAE Computer Aided
Engineering CG Center of Gravity Conrod Connecting Rod DOF Degree of Freedom EHL Elasto-Hydrodynamic
Lubrication EGR Exhaust Gas
Recirculation FEA Finite Element Analysis ICE Internal Combustion
Engine MOFT Minimum Oil Film
Thickness PACP Peak Asperity Contact
Pressure PCP Peak Cylinder Pressure POFP Peak Oil Film Pressure SCR Selective Catalytic
Reduction
Downloaded from SAE International by Vellore Inst of Technology, Thursday, January 09, 2014 11:10:18 PM

Page 17 of 18
APPENDIX
Figure A. Conventional (left) and Concept (right) Conrods Big End von Mises Stress from Compression BC at Rated Power.
.
Figure B. Conventional (left) and Concept (right) Conrods Big End von Mises Stress from Tensile BC at Rated Power.
Figure C. Conventional (left) and Concept (right) Conrods Small End von Mises Stress at Rated Power.
Downloaded from SAE International by Vellore Inst of Technology, Thursday, January 09, 2014 11:10:18 PM

Page 18 of 18
Table A. Topology Optimization Results
iter. MAX_STIFF DRES_COMP OBJ_COMP DRES_TENS OBJ_TENS VOLUME_C 19713.5 9858.932 9858.932 4520.444 9854.568 0.66 0 19713.5 9858.932 9858.932 4520.444 9854.568 0.9999813 1 24152.04 12445.31 12445.31 5370.061 11706.73 0.8521073 2 24229.1 12409.41 12409.41 5421.876 11819.69 0.823284 3 24739.52 12476.6 12476.6 5625.195 12262.92 0.7937187 4 25327.73 12946.94 12946.94 5679.263 12380.79 0.7714811 5 26119.11 13606.12 13606.12 5739.904 12512.99 0.7524201 6 26833.71 14164.8 14164.8 5811.426 12668.91 0.7347038 7 27373.71 14541.4 14541.4 5886.378 12832.31 0.7197742 8 27757.75 14830.64 14830.64 5929.865 12927.11 0.7061311 9 28025.65 15002.06 15002.06 5974.124 13023.59 0.6945658 10 28383.37 15208.78 15208.78 6043.39 13174.59 0.6849176 11 28443.54 15286.8 15286.8 6035.203 13156.74 0.6775242 12 28457.24 15294.09 15294.09 6038.143 13163.15 0.6714029 13 28472.51 15317.78 15317.78 6034.278 13154.73 0.6672053 14 28467.62 15331.19 15331.19 6025.888 13136.44 0.6651278
Figure D. Shape Optimization Results: Fatigue Damage in iteration 1 (left) and after 50 iterations (right)
Downloaded from SAE International by Vellore Inst of Technology, Thursday, January 09, 2014 11:10:18 PM