Optimization Evaluation: Lee Chemical Superfund … · 2015-06-08 · Optimization Evaluation Lee...
69
Office of Solid Waste and EPA-542-R-11-013 Emergency Response December 2011 (5102G) www.epa.gov/tio www.clu-in.org/optimization Optimization Evaluation Lee Chemical Superfund Site City Of Liberty, Clay County, Missouri
Transcript of Optimization Evaluation: Lee Chemical Superfund … · 2015-06-08 · Optimization Evaluation Lee...
Office of Solid Waste and EPA-542-R-11-013 Emergency Response December 2011 (5102G) www.epa.gov/tio
www.clu-in.org/optimization
Optimization Evaluation Lee Chemical Superfund Site
City Of Liberty, Clay County, Missouri

OPTIMIZATION EVALUATION
LEE CHEMICAL SUPERFUND SITE
CITY OF LIBERTY, CLAY COUNTY, MISSOURI
Report of the Optimization Evaluation Site Visit Conducted at the Lee Chemical Superfund Site
May 18, 2011
January 12, 2012

EXECUTIVE SUMMARY
Optimization Background
For more than a decade, the U.S. Environmental Protection Agency’s (EPA) Office of Superfund
Remediation and Technology Innovation (OSRTI) has provided technical support to the EPA Regional
offices through the use of third-party optimization evaluations. OSRTI has conducted more than 100
optimization studies at Superfund sites nationwide via Independent Design Reviews (IDR), Remediation
System Evaluations (RSE), and Long-Term Monitoring Optimization (LTMO) reviews.
OSRTI is now implementing its National Strategy to Expand Superfund Optimization from Remedial
Investigation to Site Completion (Strategy). The Strategy unifies previously independent optimization
efforts (i.e., RSE, LTMO, Triad Approach, and Green Remediation) under the singular activity and term
“optimization,” which can be applied at any stage of the Superfund project life cycle. The EPA’s working
definition of optimization as of June 2011 is as follows:
“A systematic site review by a team of independent technical experts, at any phase of a cleanup process,
to identify opportunities to improve remedy protectiveness, effectiveness, and cost efficiency, and to
facilitate progress toward site completion.”
An optimization review at the remedy stage, therefore, considers the goals of the remedy, available site
data, conceptual site model (CSM), remedy performance, protectiveness, cost-effectiveness, and closure
strategy. A strong interest in sustainability has also developed in the private sector and within Federal,
State, and Municipal governments. Consistent with this interest, optimization now routinely considers
environmental footprint reduction during optimization reviews. An optimization review includes
reviewing site documents, interviewing site stakeholders, potentially visiting the site for one day, and
compiling a report that includes recommendations in the following categories:
Protectiveness Cost-effectiveness Technical improvement Site closure Environmental footprint reduction
The recommendations are intended to help the site team identify opportunities for improvements in these
areas. In many cases, further analysis of a recommendation, beyond that provided in this report, may be
needed prior to implementation of the recommendation. Note that the recommendations are based on an
independent evaluation, and represent the opinions of the evaluation team. These recommendations do not
constitute requirements for future action, but rather are provided for consideration by the Region and
other site stakeholders.
i

Site-Specific Background
The Lee Chemical Superfund Site (site) is located along Missouri Highway 210 in Liberty, Missouri,
approximately 15 miles east of Kansas City, Missouri. Currently, the site is a vacant lot of approximately
2.5 acres in a flat alluvial plain. The City of Liberty (City) has a municipal well field located
approximately 0.40 miles southeast of the site. There are nine municipal water wells situated in a north-
south line in the alluvial aquifer at an approximately perpendicular angle to the site.
Historically, the City leased the land to the Lee Chemical Company, but then filed suit against Lee
Chemical Company in 1975 for nonpayment of rent. The City then found and removed approximately
300 abandoned 55-gallon drums containing chemicals and wastes. In 1979, low levels of trichloroethene
(TCE) were detected in the public water supply wells Subsequent EPA and State investigations revealed
contaminated groundwater and soil, and in 1982 the City and State identified the site as a source of TCE
contamination in the public water supply.
The current remedy in place for the Lee Chemical Superfund Site consists of the operation of an in situ
aqueous soil washing system, the extraction of groundwater from extraction wells (EX) EX-1 and PW-2,
and the discharge of the extracted groundwater from both extraction wells to a single, permitted outfall to
Town Branch Creek. This Remedial Action (RA) is continually monitored and reported on through
monthly and quarterly progress reports. The site remedy was considered Operational and Functional
(O&F) on March 26, 1994.
Summary of CSM
Volatile organic compound (VOC) contamination released at the surface infiltrated through soil to
groundwater resulting in TCE concentrations in soil up to 11,000 micrograms per kilogram (µg/kg), TCE
concentrations in on-site groundwater up to 851 micrograms per liter (µg/L), and TCE concentrations in
off-site groundwater up to 330 µg/L at PW-2 in the early to mid-1980s. Initial soil removal and
subsequent soil flushing has mobilized the contaminants over time, and extraction well EX-1 has captured
some of contamination that has leached to groundwater near the center of the site. The current mass flux
of contamination leaching to groundwater is sufficiently low and the groundwater flow sufficiently high
that the contamination leaching from the soil is diluted by the groundwater and is generally undetectable
with current sampling methods, except for occasional seasonal spikes. Soil contamination that can be
flushed by the soil flushing remedy has long since been removed, but soil contamination still remains and
may continue to be mobilized when the water table rises to historically high levels and/or remedy
pumping decreases substantially. The groundwater contaminant plume, when mobilized from the soil,
may be stable due to low levels of contamination, dispersion, and the potential for natural degradation of
TCE in groundwater. However, there is insufficient information to confirm a stable plume at this point.
Summary of Findings
The current monitoring program indicates that TCE has occasionally exceeded cleanup levels at EW-4
and EW-5. The extent of the EX-1 capture zone is not known, but it is possible that these two locations
are downgradient of it, which means that the observed contamination at EW-4 and EW-5 is not captured.
The extent of contamination off-site is unknown, particularly near the water table.
TCE is often detected in the discharge but remains below the permitted limit. No exceedances of the
permit conditions have occurred over the past 10 years.
ii

Summary of Recommendations
Recommendations are provided to improve remedy effectiveness, provide technical improvement, and
gain site closure. The recommendations in these areas are as follows:
Improving Protectiveness – improve understanding of groundwater flow, sample additional intervals in
wells with long screen intervals, sample for 1,4-dioxane, sample for monitored natural attenuation (MNA)
parameters, and consider additional potential locations for monitoring points.
Technical Improvement – submit blind field blank samples to the laboratory to evaluate potential for
laboratory contamination with acetonitrile and postpone soil vapor sampling until soil flushing has been
discontinued and the vadose zone is dewatered.
Site Closure – consider various approaches to proceeding with site remediation based on the information
collected from implementing the other recommendations. In addition, evaluate potential for soil vapor
intrusion (VI) using existing infrastructure.
No considerations were identified at this time for reducing cost, and no opportunities were identified at
this time for meaningful reduction of the remedy environmental footprint.
iii

NOTICE
Work described herein was performed by Tetra Tech GEO (TtGEO) for the EPA. Work conducted by
TtGEO, including preparation of this report, was performed under Work Assignment #1-58 of EPA
contract EP-W-07-078 with Tetra Tech EM, Inc., Chicago, Illinois. Mention of trade names or
commercial products does not constitute endorsement or recommendation for use.
iv

PREFACE
This report was prepared as part of a national strategy to expand Superfund optimization from remedial
investigation to site completion implemented by the United States Environmental Protection Agency
Office of Superfund Remediation and Technology Innovation (EPA OSRTI). The project contacts are as
follows:
Organization Key Contact Contact Information
U.S. EPA Office of Superfund
Remediation and Technology
Innovation
(OSRTI)
Kathy Yager U.S. EPA
Technology Innovation and Field Services
Division
11 Technology Drive (ECA/OEME)
North Chelmsford, MA 01863
phone: 617-918-8362
Tetra Tech EM, Inc.
(Contractor to EPA)
Jody Edwards, P.G. Tetra Tech EM Inc.
1881 Campus Commons Drive, Suite 200
Reston, VA 20191
phone: 802-288-9485
Tetra Tech GEO
(Contractor to Tetra Tech EM, Inc.)
Doug Sutton, PhD,
P.E.
Tetra Tech GEO
2 Paragon Way
Freehold, NJ 07728
phone: 732-409-0344
v

LIST OF ACRONYMS
% percent
AOC Administrative Order on Consent
ARAR Applicable or Relevant and Appropriate Requirement
bgs below ground surface
BTU British thermal unit
CERCLA Comprehensive Environmental Response, Compensation, and Liability Act
COC Contaminant of Concern
CSM Conceptual Site Model
DCA Dichloroethane
DCE Dichloroethene
DNAPL dense non-aqueous phase liquid
DPT direct-push technology
EPA United States Environmental Protection Agency
EW Extraction Well (previously installed for drinking water)
EX Extraction Well
ft feet
FS Feasibility Study
gpm gallons per minute
HP horsepower
IC Institutional Control
IDR Independent Design Review
ISCO In situ chemical oxidation
Koc Organic carbon partitioning coefficient
kWh kilowatt-hour
lbs pounds
L/kg liters per kilogram
LTMO Long-Term Monitoring Optimization
LTRA Long-Term Response Action
µg/kg micrograms per kilogram
µg/L micrograms per liter
mg/L milligrams per liter
MCL Maximum Contaminant Level
MDNR Missouri Department of Natural Resources
MGD Million gallons per day
MNA Monitored Natural Attenuation
MSOP Missouri State Operating Permit
MW monitoring well
NPDES National Pollutant Discharge Elimination System
NPL National Priorities List
O&M Operation and Maintenance
ORD Office of Research and Development
ORP Oxidation-reduction potential
OSRTI Office of Superfund Remediation and Technology Innovation
vi

OSWER Office of Solid Waste and Emergency Response
O&F Operational and Functional
OU Operable Unit
P&T pump and treat
PDB passive diffusion bag
ppm parts per million
PW Public Well
QAPP Quality Assurance Project Plan
RA Remedial Action
RAO Remedial Action Objective
RD/RA Remedial Design/Remedial Action
RI Remedial Investigation
ROD Record of Decision
RSE Remediation System Evaluation
SU Standard Units
SVE Soil Vapor Extraction
TCA Trichloroethane
TCE Trichloroethene
TtGEO Tetra Tech GEO
VI vapor intrusion
VOC Volatile organic compound
WQS Water Quality Standards
WSW Water Supply Well
vii

TABLE OF CONTENTS
EXECUTIVE SUMMARY ............................................................................................................. i NOTICE ......................................................................................................................................... iv PREFACE ........................................................................................................................................v LIST OF ACRONYMS………………………………………………………………………………………….……...…vi TABLE OF CONTENTS ............................................................................................................. viii
1.0 INTRODUCTION ................................................................................................................. 1
1.1 PURPOSE ............................................................................................................................ 1 1.2 TEAM COMPOSITION .......................................................................................................... 2 1.3 DOCUMENTS REVIEWED .................................................................................................... 2 1.4 QUALITY ASSURANCE ....................................................................................................... 3 1.5 PERSONS CONTACTED ....................................................................................................... 3
2.0 SITE BACKGROUND .......................................................................................................... 4
2.1 LOCATION ......................................................................................................................... 4 2.2 SITE HISTORY .................................................................................................................... 4
2.2.1 HISTORIC LAND USE AND FACILITY OPERATIONS ............................................... 4 2.2.2 CHRONOLOGY OF ENFORCEMENT AND REMEDIAL ACTIVITIES ........................... 4
2.3 POTENTIAL HUMAN AND ECOLOGICAL RECEPTORS ........................................................... 6 2.4 EXISTING DATA AND INFORMATION .................................................................................. 6
2.4.1 SOURCES OF CONTAMINATION ............................................................................ 6 2.4.2 GEOLOGY SETTING AND HYDROGEOLOGY .......................................................... 7 2.4.3 SOIL CONTAMINATION ........................................................................................ 8 2.4.4 SOIL VAPOR CONTAMINATION ............................................................................ 9 2.4.5 GROUNDWATER CONTAMINATION ...................................................................... 9 2.4.6 SURFACE WATER CONTAMINATION .................................................................. 11
3.0 DESRIPTION OF PLANNED OR EXISTING REMEDIES ............................................. 12
3.1 REMEDY AND REMEDY COMPONENTS ............................................................................. 12 3.2 RAOS AND STANDARDS .................................................................................................. 13 3.3 PERFORMANCE MONITORING PROGRAMS ........................................................................ 14
3.3.1 TREATMENT PLANT OPERATION STANDARDS ................................................... 15
4.0 CONCEPTUAL SITE MODEL .......................................................................................... 16
4.1 CSM OVERVIEW ............................................................................................................. 16 4.2 CSM DETAILS AND EXPLANATION .................................................................................. 17
4.2.1 INFLUENCE OF WATER TABLE ON GROUNDWATER CONTAMINATION ............... 17 4.2.2 ANALYSIS OF FLUSHING RATES ........................................................................ 18 4.2.3 EX-1 CAPTURE ZONE........................................................................................ 18 4.2.4 MASS FLUX ....................................................................................................... 19 4.2.5 ACETONITRILE .................................................................................................. 19
4.3 DATA GAPS ..................................................................................................................... 19
viii

4.4 IMPLICATIONS FOR REMEDIAL STRATEGY ....................................................................... 20
5.0 FINDINGS ........................................................................................................................... 21
5.1 GENERAL FINDINGS ......................................................................................................... 21 5.2 SUBSURFACE PERFORMANCE AND RESPONSE ................................................................. 21
5.2.1 PLUME CAPTURE ............................................................................................... 21 5.2.2 GROUNDWATER CONTAMINANT CONCENTRATIONS ......................................... 21
5.3 COMPONENT PERFORMANCE ................................................................................. 22 5.3.1 EXTRACTION SYSTEM ....................................................................................... 22 5.3.2 INFILTRATION FIELDS ....................................................................................... 22 5.3.3 DISCHARGE TO TOWN BRANCH CREEK ............................................................. 22
5.4 REGULATORY COMPLIANCE ............................................................................................ 23 5.5 COMPONENTS OR PROCESSES THAT ACCOUNT FOR MAJORITY OF ANNUAL COSTS ........ 23
5.5.1 UTILITIES .......................................................................................................... 23 5.5.2 NON-UTILITY CONSUMABLES AND DISPOSAL COSTS........................................ 23 5.5.3 LABOR .............................................................................................................. 23 5.5.4 CHEMICAL ANALYSIS ........................................................................................ 23
5.6 APPROXIMATE ENVIRONMENTAL FOOTPRINTS ASSOCIATED WITH REMEDY ................... 24 5.6.1 ENERGY, AIR EMISSIONS, AND GREENHOUSE GASES ........................................ 24 5.6.2 WATER RESOURCES .......................................................................................... 24 5.6.3 LAND AND ECOSYSTEMS ................................................................................... 24 5.6.4 MATERIALS USAGE AND WASTE DISPOSAL ...................................................... 24
5.7 SAFETY RECORD ............................................................................................................. 24
6.0 RECOMMENDATIONS ..................................................................................................... 25
6.1 RECOMMENDATIONS TO IMPROVE EFFECTIVENESS ......................................................... 25 6.1.1 SURVEY WELLS, MEASURE WATER LEVELS, AND PREPARE POTENTIOMETRIC
SURFACE MAPS TO CONFIRM GROUNDWATER FLOW DIRECTIONS .................... 25 6.1.2 SAMPLE ADDITIONAL INTERVALS IN EW-4, EW-5, AND MW 1-93 .................. 26 6.1.3 ANALYZE GROUNDWATER FOR 1,4-DIOXANE ................................................... 26 6.1.4 ANALYZE GROUNDWATER SAMPLES FOR MONITORED NATURAL ATTENUATION
PARAMETERS .................................................................................................... 26 6.1.5 EVALUATE NEED FOR ADDITIONAL MONITORING POINTS ................................ 27
6.2 RECOMMENDATIONS TO REDUCE COSTS ......................................................................... 27 6.3 RECOMMENDATIONS FOR TECHNICAL IMPROVEMENT ..................................................... 27
6.3.1 SUBMIT BLIND PDB BLANK SAMPLES FOR EACH SAMPLING EVENT ................ 27 6.3.2 POSTPONE SOIL AND SOIL VAPOR SAMPLING ................................................... 27
6.4 CONSIDERATIONS FOR GAINING SITE CLOSE OUT ........................................................... 28 6.4.1 POTENTIAL REMEDIAL APPROACHES FOR CONSIDERATION BY THE SITE
STAKEHOLDERS ................................................................................................ 28 6.4.2 EVALUATING POTENTIAL FOR SOIL VI .............................................................. 32
6.5 RECOMMENDATIONS RELATED TO FOOTPRINT REDUCTION ............................................ 33 6.6 SUGGESTED APPROACH TO IMPLEMENTING RECOMMENDATIONS ................................... 33
ix

List of Tables
Table 1: TCE Concentration in March 1984 Soil Samples ............................................................. 8 Table 2: Maximum Detected Contaminant Concentrations since 12/1993 .................................. 10 Table 3: Volume of Water Applied to Infiltration Fields and Extracted Annually ...................... 13 Table 4: Initial Groundwater RAOs .............................................................................................. 14 Table 5: Additional Groundwater RAOs ...................................................................................... 14 Table 6: Monitoring Sampling Schedule ...................................................................................... 15 Table 7: Surface Water Permit Standards ..................................................................................... 15 Table 8: Estimated Annual Cost Breakdown ................................................................................ 23 Table 9: Cost Summary Table ...................................................................................................... 34 Table 10: Summary Table Related to Footprint Reduction .......................................................... 35
List of Attachments
Attachment A: Figures
Figure 1 - Lee Chemical Site Location and Components
Figure 2 - Lee Chemical Site Monitoring Wells
Figure 3 - Cross Section Locations
Figure 4 - Cross Section A
Figure 5 - Cross Section B
Figure 6 - Cross Section C
Figure 7 - Infiltration Fields
Attachment B: 1990 Soil Bore TCE and TCA Concentrations
Attachment C: Soil Gas Concentration Contours
Attachment D: Bedrock Topography
Attachment E: TCE Concentration and Water Level Trends
Attachment F: Green Remediation Emission Conversion Factors
x

1.0 INTRODUCTION
1.1 PURPOSE
During fiscal years 2000 and 2001, independent reviews called Remediation System Evaluations (RSEs)
were conducted at 20 operating Fund-lead pump and treat (P&T) sites (i.e., those sites with P&T systems
funded and managed by Superfund and the States). Due to the opportunities for system optimization that
arose from those RSEs, the U.S. Environmental Protection Agency’s (EPA) Office of Superfund
Remediation and Technology Innovation (OSRTI) has incorporated RSEs into a larger post-construction
complete strategy for Fund-lead remedies as documented in the Office of Solid Waste and Emergency
Response (OSWER) Directive No. 9283.1-25, Action Plan for Ground Water Remedy Optimization.
Concurrently, the EPA developed and applied the Triad Approach to optimize site characterization and
development of a conceptual site model (CSM). The EPA has since expanded the definition of
optimization to encompass investigation stage optimization using the Triad Approach, optimization
during design, and RSEs. The EPA’s working definition of optimization as of June 2011 is as follows:
“A systematic site review by a team of independent technical experts, at any phase of a
cleanup process, to identify opportunities to improve remedy protectiveness,
effectiveness, and cost efficiency, and to facilitate progress toward site completion.”
As stated in the definition, optimization refers to a “systematic site review,” indicating that the site as a
whole is often considered in the review. Optimization can be applied to a specific aspect of the remedy
(e.g., focus on long-term monitoring optimization [LTMO] or focus on one particular operable unit
[OU]), but other site or remedy components are still considered to the degree that they affect the focus of
the optimization. An optimization evaluation considers the goals of the remedy, available site date, CSM,
remedy performance, protectiveness, cost-effectiveness, and closure strategy. A strong interest in
sustainability has also developed in the private sector and within Federal, State, and Municipal
governments. Consistent with this interest, OSRTI has developed a Green Remediation Primer
(http://cluin.org/greenremediation/), and now routinely considers green remediation and environmental
footprint reduction during optimization evaluations. The evaluation includes reviewing site documents,
potentially visiting the site for one day, and compiling a report that includes recommendations in the
following categories:
Protectiveness Cost-effectiveness Technical improvement Site closure Environmental footprint reduction
The recommendations are intended to help the site team identify opportunities for improvements. In many
cases, further analysis of a recommendation, beyond that provided in this report, may be needed prior to
implementation of the recommendation. Note that the recommendations are based on an independent
evaluation, and represent the opinions of the evaluation team. These recommendations do not constitute
requirements for future action, but rather are provided for consideration by the Region and other site
stakeholders.
1

The national optimization strategy includes a system for tracking consideration and implementation of the
optimization recommendations and includes a provision for follow-up technical assistance from the
optimization team as mutually agreed upon by the site management and EPA OSRTI.
The Lee Chemical Superfund Site (site) is on the Missouri Registry of Confirmed, Abandoned or
Uncontrolled Hazardous Waste Disposal Sites (Registry) and is also on the National Priorities List (NPL).
The site is located along Old Route 210 in Liberty, Missouri, approximately fifteen miles east of Kansas
City, Missouri. The on-site in situ aqueous soil washing system has been operated by the City of Liberty
during Long-Term Response Action (LTRA). EPA Region 7 and the Missouri Department of Natural
Resources (MDNR) agreed that an evaluation should be conducted to determine if there were any
optimization opportunities for this system. In addition, the MDNR Hazardous Waste Program conducted
a third Five-Year Review for the site in 2009 and identified certain issues relating to plume capture and
the remedy’s effectiveness. As a result, the Region proposed optimization of the system to EPA
Headquarters.
1.2 TEAM COMPOSITION
The optimization team consisted of the following individuals:
Name Affiliation Phone Email
Doug Sutton Tetra Tech GEO 732-409-0344 [email protected]
Sandra Goodrow Tetra Tech GEO 732-409-0344 [email protected]
In addition, the following individuals from EPA OSRTI and EPA Office of Research and Development
(ORD) participated in the RSE site visit.
Kathy Yager, EPA OSRTI
Dave Reisman, EPA ORD
Dave Burden, EPA ORD
1.3 DOCUMENTS REVIEWED
The following documents were reviewed. The reader is directed to these documents for additional site
information that is not provided in this report.
TCE Contamination Report (Layne-Western Co. Inc., March 1984)
Geophysical Investigation (Groundwater Management, Inc., December 31, 1986)
Liberty Progress Report No. 1 (Layne Geosciences, Inc. August 21, 1989)
Liberty RI/FS Phase II Report (Layne Geosciences, Inc., December 14, 1989)
Remedial Investigation Lee Chemical Site (Layne Geosciences, Inc., August 14, 1990)
Feasibility Study Lee Chemical Site (Layne Geosciences, Inc., December 1, 1990)
Record of Decision (US EPA Region 7, March 1991)
Risk Evaluation Lee Chemical Final Report (PRC Environmental Management, May 1991)
Final Lee Chemical Site Design Narrative (B&V Waste Science and Technology Corp.,
December 29, 1992) Final Remediation Action Report (February 11, 1994)
2

Superfund Preliminary Close Out Report (LTRA) (March 23, 1994)
Lee Chemical Site Remediation As-Built Drawing Set (Waste Science and Technology Corp.,
November 7, 1994)
Lee Chemical Land Use Change Request (Missouri Department of Natural Resources (MDNR),
January 5, 1995)
First Five-Year Review Report (MDNR and US EPA, May 1999) Second Five-Year Review Report (MDNR and US EPA, September 2004) Third Five-Year Review Report (MDNR and US EPA, July 1, 2009)
1.4 QUALITY ASSURANCE
This optimization evaluation utilizes existing environmental data to interpret the CSM, evaluate remedy
performance, and make recommendations to improve the remedy. The quality of the existing data are
evaluated by the optimization team prior to using the data for these purposes. The evaluation for data
quality includes a brief review of how the data were collected and managed (where practical, the site
Quality Assurance Project Plan [QAPP] is considered), the consistency of the data with other site data,
and the use of the data in the optimization evaluation. Data that are of suspect quality are either not used
as part of the optimization evaluation or are used with the quality concerns noted. Where appropriate, this
report provides recommendations made to improve data quality.
1.5 PERSONS CONTACTED
The following individuals associated with the site were present for the visit:
Name Affiliation Phone Email
Candice McGhee MDNR 573-751-1738 [email protected]
Tonya Howell US EPA Region 7 913- 551-7589 [email protected]
Brian Hess, PE City of Liberty 816-439-4502 [email protected]
MDNR=Missouri Department of Natural Resources
3

2.0 SITE BACKGROUND
2.1 LOCATION
The former Lee Chemical Superfund Site (site) is located in a rural industrial area on the south side of
Old Route 210, approximately one-half mile east of Missouri Highway 291 and approximately three miles
southeast of the City of Liberty (City) downtown area, in Clay County, Missouri. The property lies
between the Norfolk and Western Railroad to the south and Old Route 210 to the north, approximately 13
miles northeast of downtown Kansas City, Missouri. Currently, the site is a vacant lot of approximately
2.5 acres in a flat alluvial plain. Town Branch Creek is located approximately 0.20 miles west of the site,
and enters Shoal Creek approximately 0.40 miles southwest of the site. Shoal Creek enters the Missouri
River approximately 2.25 miles south-southeast of the site. The City has a municipal well field located
approximately 0.40 miles southeast of the site. The City currently has nine operating municipal wells
(PW-1, PW-4, PW-6, PW-7, PW-8, PW-9, PW-11, PW-13, and PW-14) situated in a north-south line in
the alluvial aquifer at an approximately perpendicular angle to the site. Groundwater flow for the site is
generally in the direction of the city’s well field.
2.2 SITE HISTORY
2.2.1 HISTORIC LAND USE AND FACILITY OPERATIONS
The site that Lee Chemical eventually occupied was purchased by the City in 1905 and served as the
initial water supply source, with two wells and a water treatment facility on-site. In the 1920s, three new
wells were added to the original two, and these served as the principal water supply for many years. In
1959, five exploratory test holes were drilled in the area of what was proposed as the Liberty well field.
As a result of test hole work, a new well (No. 5) was drilled in the area in 1962. The old treatment plant
was abandoned in 1962 in favor of a new plant constructed closer to the City.
According to the July 2009 Third Five-Year Review, the City leased the former water treatment plant
building to the Lee Chemical Company from 1965 to 1975. The Lee Chemical business consisted of
packaging and distributing commercial and industrial cleaning solvents and other chemicals. The Lee
Chemical Company also arranged for the disposal of chemicals from various commercial companies,
which resulted in the on-site stockpiling of numerous 55-gallon drums.
2.2.2 CHRONOLOGY OF ENFORCEMENT AND REMEDIAL ACTIVITIES
In 1975, the City filed suit against the Lee Chemical Company for nonpayment of rent. Upon settlement
of the suit, the City regained possession of its property and access to the site. The City found abandoned
containers of chemicals and wastes on-site. In 1977, as required by the EPA, the City removed and
disposed of approximately three hundred 55-gallon drums of waste off-site. In 1979, low levels of
trichloroethene (TCE) were detected in the public water supply wells. Subsequent EPA and State
investigations revealed contaminated groundwater and soil, and deteriorated drums and chemical
containers, and in 1982, the City and State identified the site as a source of TCE contamination in the
public water supply. In 1983, the on-site water treatment plant building and its contents were demolished
and disposed of off-site. Due to the groundwater flow and the impact of the City’s pumping municipal
4

wells, the on-site groundwater contamination migrated off-site, impacting all of the City’s municipal
wells.
According to the March 1991 Record of Decision (ROD), in 1984, in an effort to contain the
contaminated groundwater plume and reduce TCE levels in the water supply, the City discharged water
from the most highly contaminated of its municipal water wells through an abandoned sewer line to the
Missouri River and Shoal Creek. Later that year, an abandoned municipal well on-site was added to the
plume control measure and the discharge was diverted to an abandoned water main to nearby Town
Branch Creek. A Remedial Investigation (RI) was completed in August of 1990 and soil contamination
was identified as a continuing source of dissolved groundwater contamination.
A ROD was signed on March 21, 1991 specifying the following Remedial Action (RA) components:
Extraction of contaminated groundwater to remove contaminants from the aquifer of concern and
to control groundwater movement away from the site
Installation of an on-site in situ aqueous soil washing system consisting of infiltration
trenches to enhance the flushing of contaminants from site soils
Review of existing National Pollutant Discharge Elimination System (NPDES) permit limits in
the event that additional treatment of the discharge water becomes necessary to meet health-based
risk levels
A Third Five-Year Review was prepared in July of 2009, listing several recommendations and follow-up
actions. Among the recommendations/follow-up actions that are relevant to this RSE are the following:
Additional site characterization should be conducted to gather information and data that could be
applied to the re-evaluation of the operational (extraction and monitoring) systems, and potential
options for optimization or additional institutional controls (ICs).
Verify optimal passive diffusion bag (PDB) placement and pumping location in wells for
repeatable results and maximum extraction of volatile organic compounds (VOCs).
Implement optimization options; possible avenues include but are not limited to chemical
amendments, enhanced bioremediation, and soil removal.
Resample the impacted private well, near the site, to determine contamination status and future
use, closure or ICs.
1,4-dioxane should be included in at least two sampling events for each sampling location before
the initiation of the next Five-Year Review. This is an emerging VOC contaminant found in some
slow moving VOC plumes that has not been included in the list of VOCs sampled at the site.
To address contamination, an on-site groundwater extraction well and an on-site in situ aqueous soil
washing system that discharges the extracted groundwater under the terms and conditions of a NPDES
permit, a Missouri State Operating Permit (MSOP) to Town Branch Creek has been installed. A
contingency phase of the RA consisting of air stripping, or other methods of treatment of extracted
groundwater prior to discharge, was included in the selected remedy in the event that additional treatment
is necessary to meet either the NPDES permit/MSOP limits or other Applicable or Relevant and
Appropriate Requirements (ARARs).
This optimization evaluation focuses on verifying the long-term protectiveness of the RA to ensure that
plume contaminants do not migrate to create new exposure pathways. According to the Third Five-Year
Review Report, the current monitoring data indicates that the remedy is functioning as required to achieve
5

Remedial Action Objectives (RAOs), although the estimated time to reach these RAOs has already been
exceeded.
2.3 POTENTIAL HUMAN AND ECOLOGICAL RECEPTORS
Before the site was leased to the Lee Chemical Company, it was the site for the City’s drinking water
extraction and treatment operations. When demand increased, new wells located approximately 2,000 feet
(ft) to the south east were created and the drinking water operations were relocated. These new wells are
the most significant receptors of potential groundwater contaminants emanating from the Lee Chemical
grounds. The City has water supply wells PW-1 through PW-14 (A.K.A. WSW-1 through WSW-14).
PW-2 was taken offline when contamination was detected in it, and now acts solely as a purge well for
the remediation action. PW-3 was abandoned. In 2007, two new wells (PW-13 and PW-14) were added
along Shoal Creek, to the south and west of PW-11. Currently, only nine of these wells (PW-1, PW-4,
PW-6, PW-7, PW-8, PW-9, PW-11, PW-13, and PW-14) are operating.
A private well, located approximately 1,000 ft east of PW-1 and north of Old Route 210, was sampled in
2003 and found to contain elevated levels of vinyl chloride and trihalomethanes exceeding compliance
levels. This well is currently being used only for irrigation purposes and recommendations have been
made to resample at a future date.
Contamination that migrates past the production wells, if any, would discharge to either Shoal Creek or
the Missouri River.
2.4 EXISTING DATA AND INFORMATION
The information provided in this section is intended to represent interpretations of data already available
from existing site documents. The optimization team’s interpretation of this data is discussed in Sections
4.0 and 5.0 of this report.
2.4.1 SOURCES OF CONTAMINATION
TCE contamination was discovered in the City’s water supply system in 1982. The apparent source of the
TCE was leakage of waste material from the storage of numerous 55 gallon drums, stored at the old water
plant site, subsequently leased by the Lee Chemical Company. The drums were removed, but this leakage
had already contaminated the soils and the aquifer beneath the plant site.
According to the 1991 ROD, the soil sample locations and corresponding data indicate soil contamination
at highest levels immediately adjacent to the former Lee Chemical facility with decreasing levels away
from the site. TCE and trichloroethane (TCA), the most common constituents, were reported at
consistently greater values than other VOCs. In April 1983, the old water treatment plant building on the
site was demolished and only its foundation and adjacent concrete storage tank remained. Clean soil was
used to restore the surface of the site. Deeper unsaturated zone soil contamination was left in place to be
addressed by the soil flushing remedy described in Section 3.
6

2.4.2 GEOLOGY SETTING AND HYDROGEOLOGY
The Geophysical Investigation report prepared by Groundwater Management, Inc. in December 1986, and
the ROD signed in March 1991, provide descriptions of the site geology and hydrogeology. The
following description is based on the information provided in those documents.
The geology of the area consists of Pennsylvanian aged bedrock strata overlain by unconformed
Pleistocene and Recent unconsolidated alluvial deposits. The topographic relief of the outcropping
bedrock upland area can be as high as 200 ft. The topographic relief of the flood plain is approximately 30
ft. The site lies entirely on the Missouri River flood plain.
The bedrock formations that outcrop and subcrop in the vicinity of the site are, in ascending order, the
Pleasanton Group and Kansas City Group. Except for minor local structural features, the formations dip
gently to the west. The Kansas City and Pleasanton Groups are composed of interbedded layers of
limestone, sandstone, and shale. The unconformed surface that separates the bedrock from the alluvium
dips sharply to the east from the site to the well field.
A seismic and electrical resistivity survey was performed to more accurately detail the physical geology
of the site. The seismic survey did not suggest the presence of a direct channel in the bedrock surface
between the source of the contamination and the water supply well locations. The data indicated a
depression in the bedrock surface south of the existing monitoring well EW-4 and east of monitoring well
I-82. An area of higher bedrock appears to exist between this area and the City’s production wells.
Seismic velocities indicate this high area to be composed of shale while the depression and the area
around production well PW-2 is limestone. Depth to the limestone at the two locations indicates a dip to
the east.
Surface soil in the area consists primarily of the Haynie, Mondale, and Gillam silt loams. These soils are
moderately well-drained, moderately permeable soils. They have a clay content range of 15 to 35 percent
(%) and permeability ranges from 0.6 to 2.0 inches per hour.
Alluvial Aquifer
The principle aquifer in the area is the Missouri River alluvium. The regional flow of the aquifer within
the site area is to the east and is heavily influenced by the pumping of the City’s water supply well field.
The depth of groundwater in the site area is approximately 20 ft below ground surface (bgs). Hydraulic
conductivity of the material has been estimated to range from 2,000 to 5,000 gallons per day per square
foot (270 ft per day to 670 ft per day). The specific yield of the aquifer is estimated to range from 0.10 to
0.20 for the sediments encountered.
According to the 1990 Feasibility Study (FS), the natural hydraulic gradient in the area (without any
influence from the pumping wells) is to the south towards the Missouri River. The hydraulic gradient and
radius of influence, created by the pumping action of the wells in the Liberty well field, control
groundwater flow and contaminant transport in the area and have altered the direction of groundwater
flow from the site to the east rather than the south.
Surface Water Hydrology
The site is located within the Missouri River Basin, contributing runoff to Shoal Creek and the Town
Branch Creek. . The Shoal Creek discharges to the Missouri River, which is located 2.25 miles south-
southeast of the site.
7

The upper portion of the soils at the site is composed of silt with clay lenses and is somewhat compacted
around the infiltration fields. There is an unmapped stream/drainage ditch whose headwaters are located
west of the site. This small tributary to the Town Creek Branch discharges in the area of the downstream
surface water quality sampling site. It is undetermined at this time if this stream/drainage ditch is
ephemeral or is constantly fed by the exfiltration of groundwater.
2.4.3 SOIL CONTAMINATION
Investigation Conducted Prior to RI
In March of 1984, a TCE Contamination Report was prepared for the City by Layne-Western Co., Inc.
summarizing a July 1983 investigation. The investigation included the collection of soil samples from the
top 20 feet in the area of the old water treatment plant. It was concluded that the presence of TCE in the
unsaturated zone is contributing TCE to groundwater. The TCE concentration level determined to be
present in the soils during this investigation can be found in the following table.
Table 1: TCE Concentration in March 1984 Soil Samples
TCE Concentration in Soil Samples (µg/kg)
Depth Sample 1 Sample 2 Sample 3 Sample 4
2.5' 5 4,500 64 27
5.0' 310 400 11 4
7.5' 1,550 3,290 1,840 48
10.0' 52 610 730 82
15.5' 1,200 1,750 2,860 2,880
20.0' 3,400 30 57 48
(µg/kg = micrograms per kilogram)
This investigation also noted that the volume of TCE in the form of dense non-aqueous phase liquid
(DNAPL), if any, at the bottom of the unconsolidated sediments was undetermined at that time and
recommended that a full geophysical survey be performed.
Remedial Investigation
Soil samples collected during the RI phase provided the extent and depth of the contamination. The soil
sample locations that were immediately adjacent to the site had the highest levels of TCE and TCA
contamination with decreasing levels away from the site. This contamination extended from
approximately 1 ft bgs to the phreatic zone. The highest levels of TCE (11,000 µg/kg and 2,000 µg/kg)
were found at boring locations 2-89 (20 ft bgs) and 1-89 (5 ft bgs), respectively (Attachment B).
Additional Investigations
Soil and soil gas analyses have shown an isolated and immobile contaminant plume in the vadose zone
that is localized within the site.
8

2.4.4 SOIL VAPOR CONTAMINATION
A limited soil gas survey was conducted in March 1989 to investigate the presence of soil gas
contamination in the unsaturated zone near the monitoring wells just east of the sewage disposal ponds
(Figure 2). This investigation reported no measurable soil gas contamination in the area of DW 2-89 and
MW 2-89.
Soil gas sampling conducted in November 1989 identified two areas of high concentrations of TCE and
TCA (Contour maps, Attachment C). A high concentration area for TCE is generally located in the area
east of well EW-3 (approximately 50 ft). A high concentration of TCA is generally located northeast and
southwest of EW-3. Soil gas concentrations of TCE ranged from 1 part per million (ppm) at test location
27, located approximately 700 ft northeast of the site to 3,000 ppm in the immediate vicinity of the site.
Soil gas concentrations of TCA ranged from 1 ppm at test location 27 to 10,000 ppm at the center of the
site.
Additional Investigations
The Third Five-Year Review discussed the potential for vapor intrusion (VI) based on the levels of
contamination present at this site. It is noted, however, that an incomplete indoor pathway negates the
need to conduct VI samples at this time.
2.4.5 GROUNDWATER CONTAMINATION
Five Phase I monitoring wells were installed at the site in accordance with the 1988 work plan. The
locations of these monitoring wells, identified as DW 2-89, MW 2-89, TW 5-89, TW 3-89, and MW 1-89,
are presented in Figure 2. These wells were intended to monitor the path of the contamination as it
migrated away from the source area. Extraction wells previously installed for drinking water, including
EW-1, EW-4, and EW-5, were monitored along with MW 2-82, MW 1-83, MW 2-83, MW 3-83, and
MW 4-83 to track contaminant concentrations on the site. Monitoring wells north of the site surrounding
Douglas Chemical Co. (named as a landmark only) include MW 1-86, MW 2-86, and MW 3-86.
Groundwater contamination prior to 1990 is summarized in the August 14, 1990 RI report. The following
results are noteworthy and are representative of groundwater contaminant magnitude and extent:
The TCE concentration in groundwater from PW-2 in 1982 was 330 micrograms per liter (µg/L).
Concentrations decreased over time to 45 µg/L by 1990.
The TCE concentration in former water supply well WSW No. 3 was as high as 75.5 µg/L in
1986 and subsequently decreased to below 5 µg/L.
The TCE concentrations in the other water supply wells were substantially lower than those in
PW-2 and water supply well WSW No. 3.
TCE was monitored on-site in monitoring location EW-3 over time. The TCE concentration was
as high as 851 µg/L in 1984 and decreased gradually to below 50 µg/L by 1988. In 1989 and
1990 concentrations increased to over 100 µg/L.
Samples for TCE and other VOCs continue to be collected from the outfall discharge, downstream of the
outfall, from monitoring wells MW 1-83, MW 1-86, MW 1-93, EW-4, EW-5, and the purge wells, EX-1
and PW-2. The sampling record for all of these locations has been maintained since December 1993.
9

The following list shows the most recently detected contaminants and the maximum concentrations
detected.
Table 2: Maximum Detected Contaminant Concentrations since 12/1993
Contaminants of Concern (COC)
Cleanup
Levels
(WQS)
Maximum Concentration (µg/L)
(Current review period
12/1993 to 3/2011)
Trichloroethene (TCE) 5 µg/L 450 µg /L (EW-5) (2/15/94)
1,1-Dichloroethane (1,1-DCA) 70 µg/L 7.4 µg /L (EW-4) (12/1/06)
1,1-Dichloroethene (1,1-DCE) 7 µg/L 46 µg /L (EX-1) (12/2/93)
Trans-1,2-dichloroethene 100 µg/L 4.9 µg /L (EX-1) (2/15/94)
1,1,1-Trichloroethane (TCA) 200 µg/L 190 µg /L (EX-1) (12/2/93)
Cis-1,2-dichlorethene (1,2-DCE) 70 µg/L 680 µg /L (EW-5) (9/19/94)
1,2-dichloroethane (1,2-DCA) 5 µg/L <1 µg /L (all sampling sites)
Vinyl chloride 2 µg/L 9.1 µg /L (EW-4) (1/20/10)
Acetonitrile 200 µg/L 383 µg /L (EW-5) (2/17/10)
WQS = Maximum Contaminant Level/Water Quality Standards
Groundwater quality data has been collected by the City at the required intervals at designated monitoring
and pumping wells (Attachment A, Figure 3). VOC data collected at each of the sampling stations is
summarized below.
PW-2: This is the former water supply well that has been converted to a remedy well. It is sampled
quarterly. Since 1993 this well has had two samples with results that exceed the WQS. These exceedances
included a concentration of TCE of 15 µg/L in March 1995 and TCE of 13.8 µg/L in February 2001. The
only detections of site-related contaminants since 2009 have been three detections of cis-1,2
dichloroethene (cis-1,2-DCE) ranging in concentration between 1.2 and 2 µg/L, well below the cleanup
limit of 70 µg/L. No detections have been recorded for acetonitrile in this well.
MW 1-83: This well is located on the western edge of the former Lee Chemical Site (upgradient) and is
sampled quarterly. Since sampling began in 1993, three exceedances of the WQS have been documented:
2.1 µg/L of vinyl chloride in May 2005 (was not analyzed for prior to 2005), 228 µg/L of acetonitrile in
November 2008, and 321 µg/L of acetonitrile in February 2010. Acetonitrile was not detected in samples
from this well until May 2007.
MW 1-86: This well is located north of the former Lee Chemical Site across Old Route 210 (cross
gradient). It is sampled quarterly. Since sampling began in 1993, there have been six exceedances of
WQS. Four of these were for TCE and cis-1,2-DCE in 1994. The other two were 268 µg/L and 295 µg/L
of acetonitrile in 2010. Acetonitrile was first detected in 2007.
EX-1: This on-site extraction well is located near the center of the presumed source area and is sampled
monthly. Detections of TCE and other contaminants were above WQS for all samples into 2001. Sporadic
exceedances have occurred since 2001. No detections have been recorded for acetonitrile in this well.
MW 1-93: This monitoring well is sampled monthly. The most recent exceedance of WQS was
acetonitrile in 2008. Prior to that, there were seven exceedances of vinyl chloride in 2006 in which the
maximum vinyl chloride concentration was 3.5 µg/L. Prior to that, the last exceedance was for TCE in
2000.
10

EW-4: This on-site monitoring well immediately east of the source area is sampled monthly and has had
sporadic exceedances of WQS for TCE, cis-1,2-DCE, and vinyl chloride that are more prevalent in the
Spring. Acetonitrile was first detected in 2006.
EW-5: This on-site monitoring well is located near the eastern boundary of the former Lee Chemical
operation and is sampled monthly. Exceedances of TCE (some of the highest TCE detections measured at
the site since 1993) have been detected in samples from this well. However, TCE concentrations
exceeding 100 µg/L were generally limited to 1995 or earlier. The highest TCE concentration in samples
from this well since 2009 was 2.9 µg/L in May of 2009. Acetonitrile was first detected in 2006.
A private well located approximately 1,000 ft east of PW-1 and north of Old Route 210 was sampled in
2003 and found to contain elevated levels of vinyl chloride and trihalomethanes exceeding cleanup levels.
This well is currently being used only for irrigation purposes and recommendations have been made to
resample at a future date.
2.4.6 SURFACE WATER CONTAMINATION
Investigation Conducted Prior to RI
It is not evident that any surface water quality investigations have taken place.
The Town Branch Creek is the MSOP-permitted receiving water body for the discharge of the water
purged from the two remediation extraction wells. Data has been collected quarterly at the outfall site and
also at a water quality monitoring location established downstream (south of Old Route 210). These sites
are evaluated for permit compliance to be protective of the effects of this discharge.
Downstream: The surface water sampling station located downstream of the site location has had one
detection of TCE in surface water at 2.9 µg/L since 2009. In the previous 20 quarterly samples, a very
low detection of cis-1,2-DCE (well below MSOP compliance limits) was reported.
Outfall: Since 2009, 16 detections of TCE and four detections of cis-1,2-DCE in surface water were
reported, all below MCL/WQS. Before 2009, TCE was detected in 22 of the 52 monthly samples and
1,1,1-TCA was detected in three of the monthly samples, with no samples exceeding the compliance
limit.
11
3.0 DESRIPTION OF PLANNED OR EXISTING REMEDIES
3.1 REMEDY AND REMEDY COMPONENTS
According to the Third Five-Year Review, the City and the MDNR entered into an Administrative Order
on Consent (AOC) to conduct the Remedial Design/Remedial Action (RD/RA) on March 23, 1992. The
City agreed to complete the RD/RA activities and to reimburse all future response costs incurred by the
MDNR under the AOC. The RD/RA work plans were prepared by representatives of the City and
approved by the MDNR. Once the Final Lee Chemical Site Design Narrative and the accompanying
documents were received by the MDNR, which occurred on January 4, 1993, the construction of the new
on-site groundwater EX-1 well and the on-site in situ aqueous soil washing system was initiated.
The full remedy consists of an on-site in situ aqueous soil washing system, extraction of groundwater
from two extractions wells (EX-1 and PW-2), the discharge of the extracted groundwater from both
extraction wells to a single MSOP -permitted outfall to Town Branch Creek and the continued monitoring
and reporting of the RA system through monthly and quarterly progress reports. This remedy was
considered operational and functional on March 26, 1994.
The on-site in situ aqueous soil washing system that is currently in place was introduced in the 1992
Site Design Narrative. Potable water from the municipal water supply is pumped to four infiltration
galleries where the water infiltrates through the contaminated soil and flushes contamination to the
underlying groundwater, whereupon it is extracted by the remedy wells and discharged to Town Branch
Creek. The field sizing and site layout is illustrated in Attachment A, Figure 7. With four infiltration
fields as shown on the plans, the anticipated total infiltration rate was 6 to 60 gallons per minute (gpm) of
potable water from the City water supply. Each field distributes water through the use of perforated pipe
laterals embedded in a 9-inch layer of highly permeable crushed rock, all encased in a layer of geotextile
fabric. Laterals are perforated only above the springline. Each infiltration field is controlled from a valve
vault at each field. Each vault contains, in the direction of flow, a ball valve, a check valve, flow rate
meter with gauge read-out calibrated zero to 50 gpm, a flow rate totalizing meter calibrated to gallons, a
pressure reducing valve, and a globe valve.
The Third Five-Year Review detailed the major components of the groundwater RA alternative selected
in the ROD as including the following:
1. The on-site extraction well (EX-1) is located near the center of on-site contamination to extract
contamination in groundwater beneath the site. The groundwater extraction system continues to
use existing well PW-2, which was already being used as a groundwater extraction well for the
interim response action. Several other wells, located both on-site and off-site, are available for
use as extraction wells, should they be needed.
2. Contamination in groundwater extracted from the on-site groundwater wells EX-1 and PW-2 are
piped together to Town Branch Creek, where aeration and mixing occurs as the water flows over
riprap to the creek.
3. Groundwater and surface water monitoring are conducted to monitor the effectiveness of the RA
system.
12

A contingency phase of the RA consisting of air stripping, or other methods of treatment of extracted
groundwater prior to discharge, was included in the selected remedy in the event that additional treatment
of the extracted groundwater prior to discharge was necessary to meet either the NPDES permit/MSOP
limits or other ARARs.
The following table contains the total volume of water applied and extracted annually. These values were
calculated from data reported in the Appendix 3 of the Third Five-Year Review.
Table 3: Volume of Water Applied to Infiltration Fields and Extracted Annually
Year
Total Volume of Potable Total Volume of Total Volume of
Water Applied to Four Groundwater Extracted by Groundwater Extracted by
Infiltration Fields (gallons) EX-1 (gallons) PW-2 (gallons)
1997 655,729 94,135,000 303,264,000
1998 3,287,609* 288,180,000 269,542,128
1999 2,395,836 304,448,000 162,334,100
2000 3,256,683 278,451,000 284,985,500
2001 2,761,737 465,657,000 375,014,500
2002 2,561,733 461,619,000 364,802,000
2003 2,540,753 185,102,000 348,304,000
2004 2,701,657 17,748,000 320,670,000
2005 2,564,681 53,555,000 226,356,000
2006 1,949,931 6,003,000 273,486,000
2007 2,626,405 13,132,000 192,600,000
2008 3,376,198 177,000 249,086,000
2009 2,756,713 204,780,000 121,245,000
2010 828,954 183,437,000 112,582,000
* Injection rates for first three quarters of 1998 were comparable to those in 1997, but fourth quarter injection rates were
substantially higher.
3.2 RAOS AND STANDARDS
The Third Five-Year Review notes that although the remedy is operating as intended by design, the goal
to achieve RAOs is taking longer than anticipated.
According to the Third Five-Year Review, the City currently samples for nine VOC analytes, including
TCE. Five indicator contaminants or VOCs, as found in the ROD, are the site’s contaminants of concern
(COCs). The following table lists those contaminants and the site-specific compliance limits.
13

Table 4: Initial Groundwater RAOs
Contaminants of Concern (COCs) Compliance
Levels
(µg/L)
1,1-dichloroethane (1,1-DCA) 70
1,1-dichloroethene (1,1-DCE) 7
trans-1,2-dichloroethene (trans-1,2-DCE) 100
1,1,1-trichloroethane (1,1,1-TCA) 200
1,1,2-trichloroethene or trichloroethene (TCE) 5
Prior to the initiation of the RA system, the City conducted baseline sampling of the groundwater and
surface water monitoring locations in December of 1993. Since January of 1994, the City has conducted
routine monitoring and sampling at the site. After evaluation of original data (in September 1995), the
MDNR requested that the City include three additional parameters in the analysis. In the Second Five-
Year Review (September 2004), it was also recommended that the City include vinyl chloride to its list of
contaminants at all sampling locations.
Table 5: Additional Groundwater RAOs
Volatile Organic Carbons Compliance
Levels (µg/L)
cis-1,2-dichloroethene (cis-1,2-DCE) 70
1,2-dichloroethane (1,2-DCA) 5
Vinyl chloride 2
Acetonitrile 200
The Third Five-Year Review has noted that 1,4-dioxane is an emerging VOC contaminant found in some
slow moving VOC plumes. Since this has not been included in the list of VOCs sampled at the site,
MDNR has requested that it be included in at least two sampling events for each sampling location before
the initiation of the next Five-Year Review.
3.3 PERFORMANCE MONITORING PROGRAMS
The following table lists the well and stream locations included in the monitoring plan. This table also
includes the events where those locations are sampled.
14

Table 6: Monitoring Sampling Schedule
Monitoring Site Monitored Quarterly Monitored Monthly
Wells:
MW 1-83 X
MW 1-86 X
MW 1-93 X
EW-4 X
EW-5 X
EX-1 X
PW-2 X
Outfall X
Downstream X
The monitoring wells are sampled with (PDBs), which are generally set in the middle of the screened
interval (e.g., 46 ft deep in EW-4 for a well that is screened from approximately 30 to 68 ft deep).
3.3.1 TREATMENT PLANT OPERATION STANDARDS
The standards for discharging the water to the Town Branch Creek are based on a NPDES/MDOS permit
(#MO-0102172) with the monitoring and reporting requirements found in the following table.
Table 7: Surface Water Permit Standards
OUTFALL NUMBER
AND PARAMETERS UNITS
FINAL EFFLUENT
LIMITATIONS MONITORING REQUIREMENTS
DAILY
MAXIMUM
MONTHLY
AVERAGE
MEASUREMENT
FREQUENCY SAMPLE TYPE
Outfall #001-Purge Well and Drinking Water Production Well
Flow MGD * * Daily 24-hour total
pH-Units SU *** *** Once/month** Grab
Trichloroethene (TCE) mg/L 0.01 0.005 Once/month** Grab
1,1 Dichloroethene
(1,1-DCE) mg/L 0.014 0.007 Once/month** Grab
Vinyl Chloride mg/L 0.004 0.002 Once/month** Grab
Outfall S1-Downstream in Town Branch before Mixing with the Discharge for Liberty’s East Lagoon
Trichloroethene (TCE) mg/L * * Once/quarter****
grab
Vinyl Chloride mg/L * * Once/quarter****
grab
Aquifer Monitoring
Trichloroethene (TCE) mg/L * * Once/quarter****
grab
Vinyl Chloride mg/L * * Once/quarter****
grab
15

4.0 CONCEPTUAL SITE MODEL
This section discusses the optimization team’s interpretation of existing characterization and remedy
operation data to explain how historic events and site characteristics have led to current conditions. This
CSM may differ from that described in other site documents. Section 4.1 provides a brief summary of the
optimization team’s interpretation of the CSM, and the following sections provide additional detail to
help support that interpretation.
4.1 CSM OVERVIEW
VOC contamination released at the surface infiltrated through soil to groundwater resulting in TCE
concentrations in soil up to 11,000 µg/kg, TCE concentrations in on-site groundwater up to 851 µg/L, and
TCE concentrations in off-site groundwater up to 330 µg/L at PW-2 in the early to mid-1980s. Removal
of sources at the surface and removal of shallow contaminated soil in 1983 helped reduce contaminant
contributions to the subsurface. Since that time the soil flushing remedy has operated to flush
contaminants from the soil into groundwater, and soil contamination has also been mobilized when the
water table rises and contacts contaminated soil. Over time, the peak concentrations of the temporary
contaminant concentration spikes have decreased as the soil is flushed by the remedy and as soil is
repeatedly flushed by the rising and falling water table. Extraction from EX-1 keeps the water table in that
part of the site lower than at other locations (e.g., EW-4 and EW-5, which are non-pumping wells).
Although EX-1 captures some contamination near the center of the site, contamination may also be
mobilized in other locations (e.g., EW-4 and EW-5) that may or may not be within the EX-1 capture zone.
Contamination concentrations detected in groundwater are a function of the background groundwater
flow rate and the contaminant mass flux from the soil to the groundwater. Therefore, although
contamination may be mobilized into groundwater, the mass flux may be sufficiently low that
contaminant concentrations in groundwater generally remain below WQS. Concentrations detected at EX
1 are representative of the average concentration across the saturated thickness because EX-1 is an
operating extraction well. The concentrations detected at EW-4, EW-5, and other sampling locations may
be representative of a fairly limited interval where a PDB is present. Higher levels of contamination that
are detected may be present in EW-4, EW-5, and other monitoring locations because the PDBs are set
approximately 15 ft below the water table rather than at or near the water table where contamination is
presumably entering groundwater.
Water from soil flushing follows preferential pathways such that soil flushing does not necessarily
uniformly address all site soils, and the large majority of soil contamination in these preferential pathways
that can be flushed by the soil flushing remedy has long since been removed. Soil contamination still
remains and may be mobilized to groundwater by the soil flushing as the contamination slowly diffuses
out of relatively impermeable zones or as the water table rises and flushes contamination from the soil
that is temporarily saturated. The low concentration groundwater contaminant plumes that result from
mobilized soil contamination may be stable due to dispersion and the potential for natural degradation of
TCE in groundwater; however, there is insufficient information regarding water quality, contaminant
distribution, and groundwater flow directions to confirm this hypothesis.
The source of the acetonitrile is uncertain and might not be associated with the site.
16

4.2 CSM DETAILS AND EXPLANATION
4.2.1 INFLUENCE OF WATER TABLE ON GROUNDWATER CONTAMINATION
Water level information from site wells was not available. However, water levels have been recorded at
USGS site 374254094524501 in St. Joseph, approximately 45 miles from the site. Although a single
water level measurement from this well is not inferred to be representative of the water level at the site,
the changes in water levels over time and the general hydrographic trends at this well are presumed to be
similar to those at Lee Chemical. Attachment E presents three charts in which the TCE concentrations
trends at EX-1, EW-4, and EW-5 at the site are plotted with a hydrograph for the St. Joseph well.
Observations are as follows:
EX-1 Plot – Peak water levels remained relatively high from 1993 through 2001, and during that
time, TCE concentrations at EX-1 decreased to below WQS. The peak water levels remained
relatively low from approximately 2002 through 2006, and TCE concentrations remained below
the cleanup limit. Peak water levels from 2007 on have increased to relatively high levels. In
Spring 2008, when the regional water level increased to relatively high levels and remedy
pumping was very low (see Table 3), the water level in the vicinity of EX-1 increased sufficiently
high to mobilize additional TCE contamination. The peak TCE concentration was only
approximately 25 µg/L. The relatively high regional water tables in 2009 and 2010 did not result
in TCE releases above the cleanup limit, but this may be due to resumed high capacity pumping
from EX-1 (see Table 3) that helped mitigate the rise of the water table.
EW-4 Plot – TCE concentrations were high in 1994 and the first part of 1995 when remedy soil
flushing started and flushing rates were high. TCE concentrations dropped to non-detectable
concentrations in 1996, 1997, and 1998 when remedy soil flushing volumes were very low. A
substantial spike in remedy soil flushing rates in the fourth quarter of 1998 (and relatively high
flushing rates from 1999 forward) likely led to TCE concentration spikes in 1999. Subsequent to
the 1999 spikes, TCE concentrations have had seasonal spikes, but not to the same high level,
despite relatively consistent soil flushing rates through 2008. The TCE seasonal contaminant
concentration spikes observed from 2000 forward have generally been as high as 30 µg/L and
have been decreasing over time. It is noted that the remedy soil flushing rates in the easternmost
infiltration field in the third quarter of 2009 may partially be responsible for the low
concentrations of TCE observed in 2010. It may also be possible that the low concentrations of
TCE observed in 2010 are due to continued decreases of contamination resulting from the
historically fluctuating water table flushing the soils. EW-4 is approximately 200 ft from EX-1,
and given the transmissive aquifer, the water table near EW-4 is likely not substantially lowered
by the EX-1 pumping. Therefore, a rise in the water table is likely to reach higher into the
overlying silts and clays and contact soil contamination near EW-4 than it is near EX-1. More
remedial progress appears to have been made at EX-1 and EW-5 (see below) relative to EW-4.
The location of EW-4 with respect to the infiltration fields may be responsible for less progress at
EW-4 because it is further from the infiltration fields than EX-1 and EW-5, but continued soil
flushing with the same system may not result in measureable contaminant flushing. The soil
flushing rates have been relatively consistent since 2000, but the release of contamination to
groundwater has not been consistent and is more indicative of a seasonal pattern than of
continuous flushing.
EW-5 Plot – The TCE trends at this location appears to have a strong correlation between peak
water levels and the flushing of contamination rather than continuous flushing.
17
Occasional/seasonal concentration spikes since 2000 have been as high as 30 µg/L and may be
decreasing. There has only been one exceedance of the WQS since 2004 in this well.
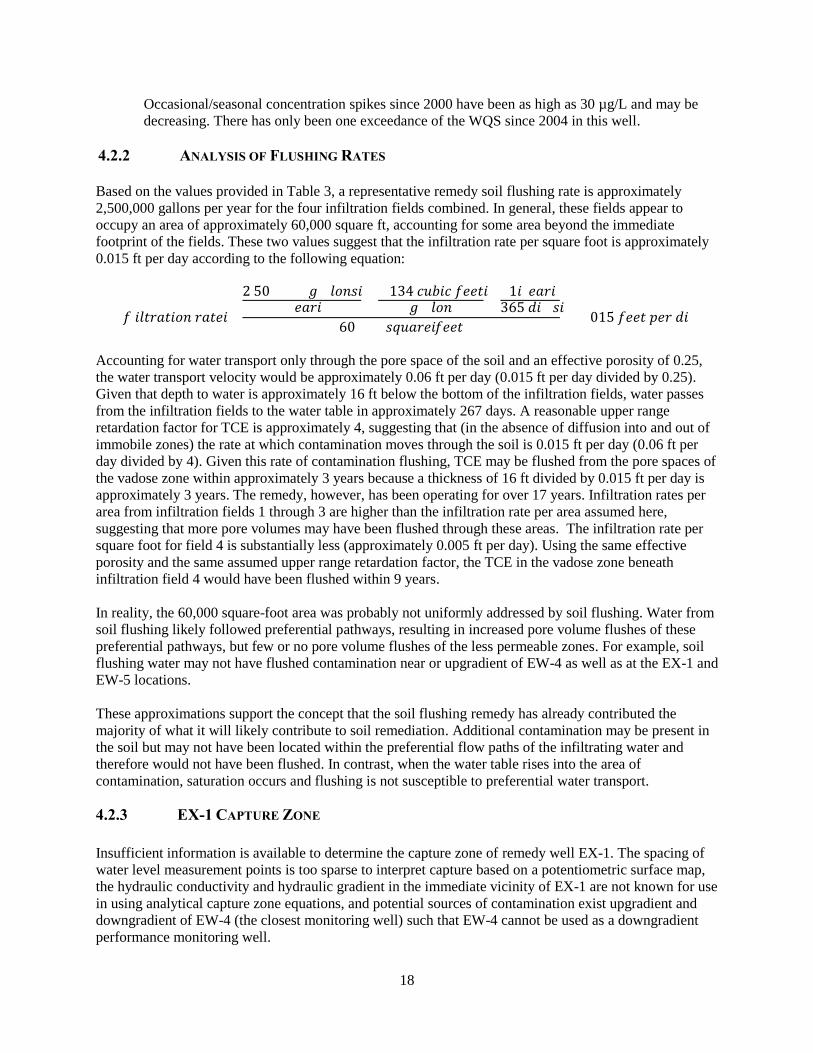
4.2.2 ANALYSIS OF FLUSHING RATES
Based on the values provided in Table 3, a representative remedy soil flushing rate is approximately
2,500,000 gallons per year for the four infiltration fields combined. In general, these fields appear to
occupy an area of approximately 60,000 square ft, accounting for some area beyond the immediate
footprint of the fields. These two values suggest that the infiltration rate per square foot is approximately
0.015 ft per day according to the following equation:
" % & ! % !#$ "'! " %$$& ! $ $ $ $ & ! #&% # %
% &$ & ! $ &$ !% %$$& "$$ # & %#' $$ %$$&
Accounting for water transport only through the pore space of the soil and an effective porosity of 0.25,
the water transport velocity would be approximately 0.06 ft per day (0.015 ft per day divided by 0.25).
Given that depth to water is approximately 16 ft below the bottom of the infiltration fields, water passes
from the infiltration fields to the water table in approximately 267 days. A reasonable upper range
retardation factor for TCE is approximately 4, suggesting that (in the absence of diffusion into and out of
immobile zones) the rate at which contamination moves through the soil is 0.015 ft per day (0.06 ft per
day divided by 4). Given this rate of contamination flushing, TCE may be flushed from the pore spaces of
the vadose zone within approximately 3 years because a thickness of 16 ft divided by 0.015 ft per day is
approximately 3 years. The remedy, however, has been operating for over 17 years. Infiltration rates per
area from infiltration fields 1 through 3 are higher than the infiltration rate per area assumed here,
suggesting that more pore volumes may have been flushed through these areas. The infiltration rate per
square foot for field 4 is substantially less (approximately 0.005 ft per day). Using the same effective
porosity and the same assumed upper range retardation factor, the TCE in the vadose zone beneath
infiltration field 4 would have been flushed within 9 years.
In reality, the 60,000 square-foot area was probably not uniformly addressed by soil flushing. Water from
soil flushing likely followed preferential pathways, resulting in increased pore volume flushes of these
preferential pathways, but few or no pore volume flushes of the less permeable zones. For example, soil
flushing water may not have flushed contamination near or upgradient of EW-4 as well as at the EX-1 and
EW-5 locations.
These approximations support the concept that the soil flushing remedy has already contributed the
majority of what it will likely contribute to soil remediation. Additional contamination may be present in
the soil but may not have been located within the preferential flow paths of the infiltrating water and
therefore would not have been flushed. In contrast, when the water table rises into the area of
contamination, saturation occurs and flushing is not susceptible to preferential water transport.
4.2.3 EX-1 CAPTURE ZONE
Insufficient information is available to determine the capture zone of remedy well EX-1. The spacing of
water level measurement points is too sparse to interpret capture based on a potentiometric surface map,
the hydraulic conductivity and hydraulic gradient in the immediate vicinity of EX-1 are not known for use
in using analytical capture zone equations, and potential sources of contamination exist upgradient and
downgradient of EW-4 (the closest monitoring well) such that EW-4 cannot be used as a downgradient
performance monitoring well.
18

4.2.4 MASS FLUX
Based on Table 3, a reasonable infiltrate rate is 2,500,000 gallons of water per year. The background
groundwater flow rate is not well known, but the extraction rate at EX-1 is approximately 200,000,000
gallons per year. This is a reasonable estimate of the groundwater flow rate passing through the site. If
this is the case, the background groundwater flow rate is approximately 80 times higher than the
infiltration rate. The detection limit for TCE is typically 1 µg/L, which means that the infiltrating water
from the soil flushing remedy may have a concentration as high as 80 µg/L and be sufficiently diluted to
be undetected in groundwater samples.
4.2.5 ACETONITRILE
Based on the data record provided in the Third Five-Year Review, acetonitrile has not been present at EX
1, but has been present at wells in the presumed upgradient (MW 1-83), cross-gradient (MW 1-86), and
downgradient (MW 1-93) locations. Also, according to the data record in the Third Five-Year Review,
acetonitrile concentrations were first detected in approximately 2006 and not in the previous 13 years of
monitoring.
A 1994 EPA chemical summary of acetonitrile (http://www.epa.gov/chemfact/s_acenit.txt) states that
acetonitrile has an organic carbon partitioning coefficient (Koc) of 16 liters per kilogram (L/kg), which is
approximately 6 to 10 times lower than the Koc for TCE and at least two times lower than the Koc for
cis-1,2-DCE (http://www.epa.gov/superfund/health/conmedia/soil/pdfs/appd_k.pdf). Therefore,
acetonitrile would be expected to have a much lower retardation coefficient than TCE and a lower
retardation coefficient than cis-1,2-DCE and should have been flushed out of the vadose zone faster than
these two compounds. Contaminant trends should also suggest the migration of acetonitrile from one
location to another; however, the analytical results show an erratic pattern of results and generally show
similar acetonitrile results at multiple well locations for a given sampling event. The locations, timing,
chemical nature of acetonitrile relative to other site contaminants (e.g., TCE and cis-1,2-DCE), and
pattern of detections suggest to the optimization team that acetonitrile may not be site-related and may
instead be a laboratory contaminant. The optimization team queried other environmental consultants and
has learned of incidents where consultants have identified acetonitrile as a laboratory contaminant.
4.3 DATA GAPS
There are several data gaps in the existing CSM, including the following:
In the absence of reliable, consistent water level measurements at site wells, there is a limited
understanding about the groundwater flow direction at the site and a limited understanding of the
capture zone of EX-1. There is also a limited understanding of how much remedy well EX-1
lowers the water table and prevents groundwater from flushing contamination from the vadose
zone.
Sampling locations are relatively limited; therefore, there is a limited understanding regarding the
extent of off-site contamination, if any.
Sampling is conducted at one interval within the monitoring points with PDBs, and some of the
monitoring points are former extraction wells that presumably have long screen intervals. The
vertical distribution of contamination is unclear and is likely shallower than the interval sampled
by the PDBs.
19

Water quality data provided to the optimization team is limited to VOC results presented in the
Five-Year Review and recent VOC analytical reports. Other water quality parameters such as
oxidation-reduction potential (ORP), nitrates, and sulfates are not known. Total dissolved carbon
and iron are measured from the city water supply wells and indicate high iron content
(presumably dissolved), which suggests reducing conditions and the potential for TCE to degrade.
TCE degradation daughter products (cis-1,2-DCE and vinyl chloride) are also present, further
suggesting the potential for TCE degradation. Other than this limited information, the potential
for natural degradation of TCE and other site-related contaminants is not known.
The current soil contamination or soil vapor contamination is not known; therefore, the potential
for the soil to serve as a continuing source of groundwater contamination is not known.
The contaminant concentration of the infiltrating water after passing through the vadose zone is
not known. The initial declines in contaminant concentrations in groundwater were likely due to
the soil flushing remedy, but the more recent occasional detections and exceedances of
contamination in groundwater are likely predominantly due to the rising water level. However,
insufficient information is available to confirm this.
The Five-Year Review indicated the potential for 1,4-dioxane to be present at the site. Monitoring
for this chemical has not been done, presenting another uncertainty. Because 1,4-dioxane is
substantially more mobile than TCE, does not degrade in the subsurface, and is typically found in
lower concentrations than solvents at solvent sites, the optimization team finds it unlikely that
1,4-dioxane is present at detectable levels at the site. Nevertheless, sampling for 1,4-dioxane is
appropriate given that the contaminant does not degrade and public water supply wells are located
downgradient of the site.
4.4 IMPLICATIONS FOR REMEDIAL STRATEGY
The implications of this CSM and related data gaps on the remedy are significant.
If the mass flux of contamination to groundwater from the soil flushing remedy has decreased
sufficiently to result in limited detections and even more limited exceedances of cleanup criteria,
then it may be appropriate to discontinue the soil flushing remedy.
If a fluctuating water table and historically high water tables are critical for flushing soil
contamination from the vadose zone, then pumping on-site may be slowing or preventing soil
flushing by lowering the water table.
If occasional contaminant concentrations that exceed cleanup criteria degrade or attenuate in a
reasonable distance, then the plume may be stable and hydraulic plume capture may not be
necessary. If contamination is entering the aquifer downgradient of the EX-1 capture zone (e.g.,
at EW-4 or EW-5), then contamination may already be migrating off-site (and may be degrading).
Contamination that is extracted by remedy well EX-1 is transferred to the atmosphere prior to
discharge. Contamination that migrates and then degrades in the subsurface is destroyed.
If the PDBs are not set at the appropriate interval, and higher concentrations of contamination are
present, then contamination may be migrating off-site at higher than expected concentrations.
20

5.0 FINDINGS
5.1 GENERAL FINDINGS
The observations provided below are not intended to imply a deficiency in the work of the system
designers, system operators, or site managers but are offered as constructive suggestions in the best
interest of the EPA and the public. These observations have the benefit of being formulated based upon
operational data unavailable to the original designers. Furthermore, it is likely that site conditions and
general knowledge of groundwater remediation have changed over time.
5.2 SUBSURFACE PERFORMANCE AND RESPONSE
5.2.1 PLUME CAPTURE
Potentiometric Surface Maps
Current water level data was not available to the optimization team and may not be collected, and
potentiometric surface maps prepared during the RI are not reliable because they are heavily dependent
on the water levels measured in operating production wells. There is, therefore, insufficient evidence to
evaluate this line of evidence regarding plume capture.
Concentration Trends
The current monitoring program indicates that TCE has occasionally exceeded WQS at EW-4 and EW-5.
The extent of the EX-1 capture zone is not known, but it is possible that these two locations are
downgradient of it, which means that the observed contamination at EW-4 and EW-5 is not captured. For
the past several years, the observed concentrations at EW-4 and EW-5 have been slightly above or below
the cleanup limit for TCE and other site-related contaminants. However, the PDBs in EW-4 and EW-5
may be set too low to intercept the highest groundwater concentrations.
Groundwater Flow and Extraction
Given the absence of reliable water levels, insufficient information is available to calculate the flow of
groundwater through the site and compare it to the extraction rate.
5.2.2 GROUNDWATER CONTAMINANT CONCENTRATIONS
As described in Section 4.0, the contaminant concentrations are low and seasonally variable with peak
concentrations generally decreasing over time. The extent of contamination off-site is unknown,
particularly near the water table. Contaminant concentrations in samples from PW-2 have been below
standards since 2001. MDNR has collected split VOC analysis for all operating municipal wells as part of
the previous Five-Year Reviews. The results for the November 20, 2008; May 12, 2010; and August 17,
2011 events have shown no exceedances of applicable water quality standards (Superfund Chemical Data
Matrix, EPA Screening Levels or Missouri WQS). In August 2011, there were detections of cis-1,2-DCE
in PW-1 and PW-4 at concentrations more than an order of magnitude below the MCL of 70 µg/L and
21
less than half the concentration detected at PW-2. The plume core appears to be migrating generally
toward PW-2 with the plume fringe reaching as far as PW-1 to the north and PW-4 to the south. Although
contamination is not present in PW-2 or the operating supply wells above WQS, contamination may be
present above WQS downgradient of the site but upgradient of these wells.
5.3 COMPONENT PERFORMANCE
5.3.1 EXTRACTION SYSTEM
EX-1 is outfitted with a 20 horsepower (HP) turbine pump that has a pressure cutoff switch and is
otherwise manually controlled. According to data in the Third Five-Year Review, and averaging over
each year, the extraction rate has ranged from 0.33 gpm (2008) to over 800 gpm (2001 and 2002). The
extraction rate from 2004 through 2008 was generally significantly lower than the average pumping rate,
which was likely in part due to iron fouling. In 2009 and 2010, the average extraction rate was 350 gpm to
390 gpm, likely reflecting recent well maintenance activities addressing iron fouling. At the time of the
optimization site visit, the flow meter indicated the well was pumping at approximately 220 gpm
unrestricted. This flow rate is likely low given the pump size and total dynamic head on the pump. The
optimization team suspects this may be due to the pressure head caused by blending the flow from PW-2
and EX-1 and potentially from iron fouling in the EX-1 piping.
PW-2 is outfitted with a 30 HP turbine pump that has a pressure cutoff switch and is otherwise manually
controlled. According to data in the Third Five-Year Review, and averaging over each year, the
extraction rate has ranged from 210 gpm (2010) to over 700 gpm (2001). At the time of the optimization
site visit, the flow meter indicated the extraction rate was 250 gpm. This well is also affected by iron
fouling and was treated for iron fouling in the fall of 2010.
The flow of the two wells is blended in a single discharge pipe, and the two wells need to be balanced to
keep them operating. For example, if PW-2 shuts down, then EX-1 needs to be throttled back to avoid
pumping the well dry.
5.3.2 INFILTRATION FIELDS
The site team reports that the infiltration fields are generally maintenance free. The City recently
reconditioned some of the vault interiors given the age and condition of the equipment in the vaults. The
injection rates are generally 1.6 gpm for field 1, 1.5 gpm for field 2, 1.2 gpm for field 3, and 0.4 gpm for
field 4. The variation in flow rates is likely due to the permeability underlying each field. All injected
water is potable water from the City water supply.
5.3.3 DISCHARGE TO TOWN BRANCH CREEK
According to the Third Five-Year Review, if the TCE level in the groundwater extracted from EX-1 and
PW-2 was found to exceed the discharge limitations set forth in the NPDES permit/MSOP, then it would
become necessary to invoke the contingency phase of the remedy consisting of further treatment of the
water prior to discharge to remove VOCs from the extracted groundwater. TCE is often detected in the
discharge but remains below the permitted limit.
22

5.4 REGULATORY COMPLIANCE
No exceedances of the permit conditions have occurred over the past 10 years.
5.5 COMPONENTS OR PROCESSES THAT ACCOUNT FOR MAJORITY OF ANNUAL
COSTS
The City did not provide a comprehensive cost for operating the remedy, but provided relevant
information to the optimization team. The following table summarizes the primary costs for operating the
remedy.
Table 8: Estimated Annual Cost Breakdown
Cost Category Estimated Annual Cost
Project management and reporting Not provided
Operation and Maintenance (O&M) labor Not provided
Electrical costs $25,000
Potable water cost $14,000
Analytical costs $7,500
5.5.1 UTILITIES
Utilities include electricity for operating EX-1 and PW-2 and the potable water for the infiltration fields.
The electricity cost is based on a 20 HP pump, a 30 HP pump, motor efficiencies of 80%, operating load
of 80%, and an average electricity rate of $0.075 per kilowatt-hour (kWh). The electricity rate is based on
the optimization team’s interpretation of the Kansas City Power & Light rates and tariffs. Any heating for
the pump houses is assumed to be relatively small given the small pump houses and large motors housed
in the pump houses. The cost for the potable water usage was provided by the City.
5.5.2 NON-UTILITY CONSUMABLES AND DISPOSAL COSTS
Limited materials and consumables are used in association with the remedy.
5.5.3 LABOR
The remedy is managed and operated by City employees, and although the time spent on this remedy is a
cost to the City, the cost is not estimated here. Operations and maintenance (O&M) labor is likely
approximately 1 hour per weekday on average. If an environmental consultant were providing the
services, this would cost approximately $17,000 to $20,000 per year. The time spent on managing the site
is not estimated.
5.5.4 CHEMICAL ANALYSIS
The chemical analysis cost is based on the sampling program described in Section 3, a cost of $75 per
sample, and a courier charge. This information was provided by the City.
23

5.6 APPROXIMATE ENVIRONMENTAL FOOTPRINTS ASSOCIATED WITH
REMEDY
5.6.1 ENERGY, AIR EMISSIONS, AND GREENHOUSE GASES
The energy, emissions, and greenhouse gas footprint of the remedy is primarily due to the electricity
usage for operating the pumps. An estimated 325,000 kWh of electricity is used each year to operate the
pumps. Assuming 33% efficiency of thermal power plants and 10% loss of electricity through
transmission and distribution, this translates to annual energy usage of approximately 3,700 million
British thermal units (BTUs) per year. Based on this electricity usage and the average fuel mix for
electricity generation in Missouri (Attachment F), annual greenhouse gas emissions are approximately
700,000 pounds (lbs) of carbon dioxide equivalents, and criteria pollutant emissions (i.e., nitrogen oxides,
sulfur oxides, particulate matter) are approximately 7,000 lbs per year. Hazardous air pollutants are
released from the generation of electricity and the off-gas of TCE during aeration at the discharge
location.
5.6.2 WATER RESOURCES
The primary uses of water are associated with the infiltration fields and groundwater extraction.
Approximately 2,500,000 gallons of potable water is used in the infiltration fields each year. Water is also
extracted from the EX-1 and PW-2 and discharged to surface water. Extraction rates have been declining
over the past several years. As of 2010, approximately 300,000,000 gallons of groundwater from these
two extraction locations combined were discharged to surface water, representing a loss of a groundwater
resource. Water is also used in some manner during electricity generation and is estimated to be in the
range of 325,000 gallons per year.
5.6.3 LAND AND ECOSYSTEMS
Land and ecosystems are not directly affected by the current operation of the remedy.
5.6.4 MATERIALS USAGE AND WASTE DISPOSAL
There is no significant use of materials or waste generation at the site with the exception of well
maintenance activities that occur approximately once every 3 to 4 years.
5.7 SAFETY RECORD
The site team did not report any safety concerns or incidents.
24
6.0 RECOMMENDATIONS
Cost estimates provided herein have levels of certainty comparable to those done for Comprehensive
Environmental Response, Compensation, and Liability Act (CERCLA) Feasibility Studies (-30%/+50%),
and these cost estimates have been prepared in a manner generally consistent with EPA 540-R-00-002, A
Guide to Developing and Documenting Cost Estimates During the Feasibility Study, July, 2000. The costs
presented do not include potential costs associated with community or public relations activities that may
be conducted prior to field activities. The costs and sustainability impacts of these recommendations are
summarized in Tables 9 and 10.
Groundwater concentrations generally meet WQS in all sampled locations, with the exception of periodic
low-level increases above criteria in on-site wells. In general, it appears that a combination of the soil
flushing remedy and a fluctuating water table have been successful in reducing the contaminant mass flux
from the soil to the groundwater to sufficiently low levels to provide the above observations. However,
significant information is missing regarding groundwater flow directions, the potential for contaminant
degradation, and horizontal and vertical plume delineation. Several recommendations are provided in
Section 6.1 to address this missing information. Limited recommendations are also provided in Section
6.3 regarding technical improvement. Focus is then placed on an exit strategy in Section 6.4. No
recommendations for the cost reduction and environmental footprint reduction categories are made, but
the outcome of implementing the strategy in Section 6.4 could result in significant improvements in these
three categories.
6.1 RECOMMENDATIONS TO IMPROVE EFFECTIVENESS
6.1.1 SURVEY WELLS, MEASURE WATER LEVELS, AND PREPARE POTENTIOMETRIC
SURFACE MAPS TO CONFIRM GROUNDWATER FLOW DIRECTIONS
All site-related monitoring wells that have not been destroyed should be located and resurveyed consistent
with general practice in the remediation field. A table should be developed that provides this new survey
information and the well construction information, including well diameter, casing material, top of casing
elevation, ground surface elevation, total depth, and screened interval(s). Water levels should be
measured quarterly for one year and the results used to make potentiometric surface maps to better
understand groundwater flow directions. Water levels from operating extraction wells should not be used
in developing the potentiometric surface maps. Where well clusters are located, vertical gradients should
be documented. This information is important to understand where contamination leaves the site (if at all)
and the fate of any contamination that leaves the site. Current practice assumes that the contamination
will migrate past EW-5 toward PW-2. The improved water level information will either confirm this
finding or help determine if the primary contaminant migration pathway has shifted to the north or south
of PW-2. It will also help determine the direction downgradient of EW-4 in case a monitoring well is
appropriate for that location. The optimization team estimates that implementing this recommendation
should cost approximately $15,000 if outside resources are used. If the City can use its own survey team
and its own labor for water level measurements, the cost will likely be substantially lower.
25

6.1.2 SAMPLE ADDITIONAL INTERVALS IN EW-4, EW-5, AND MW 1-93
The PDBs in these locations may be set too deep to detect contamination infiltrating into groundwater
from the overlying soil and may be too shallow to detect potentially deeper contamination. Placing PDBs
at depths 5 ft below the top of the screened interval, in the middle of the screened interval, and 5 ft above
the bottom of the screened interval will help identify if higher levels of contamination are present in these
locations. Sampling should occur in this manner during each sampling event for one year and then be
reevaluated. After one year, it may be appropriate to continue the sampling in this manner or adjust PDB
placement to the depth of a single interval. The estimated increased cost of this sampling for one year is
approximately $5,400 (72 samples at $75 per sample).
6.1.3 ANALYZE GROUNDWATER FOR 1,4-DIOXANE
Consistent with the Five-Year Review, samples should be collected and analyzed for 1,4- dioxane. The
PDBs cannot be used for sampling 1,4-dioxane, so the optimization team recommends conducting one
year of quarterly sampling using low-flow sampling in addition to collecting the PDB samples. This low-
flow sampling can be limited to EW-4, EW-5, and MW 1-93. Samples for 1,4-dioxane should also be
collected from EX-1 and PW-2. The pump for low-flow sampling should be placed at the same or similar
interval as the PDB. The low-flow sampling will allow 1,4-dioxane to be sampled. The low-flow sample
should also be analyzed for VOCs, and the VOC data from the low-flow sampling can be compared to the
VOC data from the PDB sampling to determine if the results are consistent. The optimization team
estimates that the cost for implementing this recommendation is approximately $10,000. This
recommendation should be implemented after the optimal PDB depth interval has been established from
recommendation 6.1.2. Although 1,4-dioxane may not appear in the first sampling events, the
optimization team suggests conducting the sampling for four quarters due to the variable nature of
contaminant detections at the site.
If 1,4-dioxane were to be detected above levels that warrant remediation, the site team should likely
conduct additional sampling to understand the distribution and magnitude of the contamination prior to
considering a remedial option. Remediation of 1,4-dioxane would likely involve in situ chemical
oxidation (ISCO) with activated persulfate or groundwater extraction and treatment with an advanced
oxidation process. Ongoing research is occurring with regard to bioremediation of 1,4-dioxane, but it is
unclear if this technology would be available or sufficiently refined for use in the near future.
6.1.4 ANALYZE GROUNDWATER SAMPLES FOR MONITORED NATURAL ATTENUATION
PARAMETERS
Limited available information suggests potential for natural degradation of TCE, including the presence
of degradation compounds (‘daughter products’) and high iron concentrations. Documentation of
conditions that promote natural degradation would be helpful in utilizing natural degradation as part of
the remedial strategy. Monitored natural attenuation (MNA) parameters (nitrate, sulfate, total organic
carbon, dissolved oxygen, ferrous iron, ORP, and methane/ethane/ethene) should be analyzed in each
monitoring location (excluding the outfall and downstream sample) quarterly for one year. The dissolved
oxygen and ferrous iron can be measured using field test kits, and the ORP can be measured with a
portable field instrument. The other parameters will involve laboratory analysis for approximately $200
per sample. The estimated cost for implementing this recommendation for one year is $6,000. The
sampling should be coordinated with the low-flow sampling discussed in Section 6.1.3 because PDBs are
not appropriate for sampling most natural attenuation parameters.
26
6.1.5 EVALUATE NEED FOR ADDITIONAL MONITORING POINTS
Based on the findings from the above four recommendations, the site team should identify if additional
monitoring points are needed for plume delineation and/or confirmation that the groundwater plume is
stable. For example, the new water level information (see Section 6.1.1) may suggest that there is not a
well located downgradient of EW-4, and a new monitoring well in this location might be appropriate to
evaluate degradation of the contamination observed at EW-4. The additional monitoring points may be
helpful for supporting a MNA remedy or other alternative remedy if conditions are appropriate.
6.2 RECOMMENDATIONS TO REDUCE COSTS
No specific recommendations are provided to reduce costs; however, the considerations in Section 6.4
may lead to a reduction in remedy life-cycle costs.
6.3 RECOMMENDATIONS FOR TECHNICAL IMPROVEMENT
6.3.1 SUBMIT BLIND PDB BLANK SAMPLES FOR EACH SAMPLING EVENT
As discussed in Section 4.2.5, the optimization team suspects that acetonitrile may be a laboratory
contaminant and not a site-related contaminant. The optimization team recommends submitting a field-
collected blank sample along with each sampling event. Acetonitrile is only detected in samples collected
with PDBs and has not been detected at EX-1 or PW-2. The acetonitrile may be associated with the PDBs
or with the methods the laboratory uses to extract water from the PDBs. Therefore, the blank samples
should be collected by filling a PDB with the same clean water source used for other PDBs, storing that
filled PDB in a safe and uncontaminated location while the other PDBs are in the wells, filling laboratory
bottles with the blank PDB sample during the sampling event, and marking the sample as a field sample
with a unique identifier (i.e., not as a blank). This will serve as a blind blank sample to the laboratory. If
acetonitrile is identified in the blank samples as well as the field samples, then the site team has
confirmation that acetonitrile is a manifestation of the sampling and analysis procedures and not a site-
related contaminant. The cost for implementing this recommendation would be approximately $100 per
sampling event until sufficient data are available for the site team to make a determination.
6.3.2 POSTPONE SOIL AND SOIL VAPOR SAMPLING
The consent order between the State and the City (through plans outlined in the 1994 Remedial Action
Report) requires that soil gas sampling occur at 10 locations when concentrations at EW-5 approach
cleanup standards and prior to discontinuation of the soil flushing remedy. Based on the sampling results
at EW-5, it is appropriate to conduct this sampling at this point. However, the optimization team has
identified the following shortcomings associated with this approach:
The soil is saturated during soil flushing operation, and this would prevent soil vapor samples
from being collected until the vadose zone soils dewater. To conduct meaningful soil vapor
sampling, the system would need to be shut down and the soil allowed to dewater prior to
sampling.
27

The concentrations at EW-4 are generally higher than those at EW-5 and given the lack of
information regarding the groundwater flow direction at the site, EW-5 may not be directly
downgradient of EW-4. As a result, the improved conditions at EW-5 may not be the appropriate
trigger for the sampling.
It is unclear how the results will be used to evaluate remedy effectiveness. The results could be
used to simply show reductions, but the resulting information would likely not provide additional
information regarding the potential for future impacts to groundwater because there is no
established link between soil concentrations in given soil intervals and resulting groundwater
impacts at this site.
One potential way of addressing these shortcomings would be to wait until concentrations at EW-4 are
closer to those currently observed at EW-5, shut down the system, wait for a set amount of time for the
vadose zone soils to dewater, and then collect the soil vapor samples as originally intended. The set
amount of time for adequate dewatering is uncertain. The optimization team estimates that at infiltration
rate of 0.015 ft per day (see Section 4.0) it will take approximately 1 year to dewater the upper 5 ft
beneath the infiltration fields. Therefore, absent other information the optimization team would suggest
waiting 1 to 3 years before conducting the prescribed vapor samples. At that time, the soil vapor sampling
at 10 locations could likely be done for approximately $30,000, including preparation of a plan, vapor
sampling with a direct-push rig in the field for 2 days, laboratory analysis, and reporting.
6.4 CONSIDERATIONS FOR GAINING SITE CLOSE OUT
6.4.1 POTENTIAL REMEDIAL APPROACHES FOR CONSIDERATION BY THE SITE
STAKEHOLDERS
Significant remedial progress has been made at the site over the past 15 or more years, and the current site
conditions merit consideration of different remedial approaches. It is difficult to outline a clear path
forward for the remedy because critical information is not available. Implementing the recommendations
in the above sections will likely provide the needed information, but the optimization team would like to
present several potential approaches at this time for consideration so that the site team can evaluate and
discuss them as the new information becomes available. Several remedial approaches are provided below
based on different outcomes from the new information. Some of the approaches discuss more focused
remediation for EW-4 and assume an area of 50 ft by 50 ft. The basis for this assumption is that the
approximate area between infiltration fields 2 and 3 is the primary cause of the more persistent
contamination observed at EW-4, but this might not be the case. All of the approaches assume that 1,4
dioxane is not present at concentrations that require active remediation (e.g., groundwater extraction and
treatment or ISCO with activated persulfate).
Potential Approach #1 - Change Remedy to MNA
This remedy would involve discontinuing the soil flushing remedy, discontinuing extraction from EX-1
and PW-2, and continuing to monitor groundwater quality to confirm natural attenuation is occurring as
intended. Natural infiltration from rainfall and a rising and falling water table would continue to flush
contamination from soils over time such that the site would eventually meet performance criteria.
Additional data analysis and study of the new information would be required to confirm MNA is
appropriate. If MNA is appropriate, the optimization team estimates that this approach would require the
same amount of time to reach remedial goals as the current remedy because the optimization team
believes that the soil flushing system and groundwater extraction are no longer contributing meaningfully
28
to soil and groundwater remediation (see Section 4.0). The optimization team cannot effectively estimate
the time frame to reach site closure, but an estimate of 20 years is likely reasonable, primarily due to the
observed contamination at EW-4. However, because the pump house and infiltration galleries would no
longer be needed, the property could be reused in a timely manner. Prior to property development, soil
vapor concentrations would need to be monitored to determine if a soil vapor barrier and/or passive
venting were merited to reduce the potential for VI in newly constructed buildings.
This potential approach might be appropriate if the following occurs:
The new information and data evaluation confirms that groundwater contamination observed on-
site degrades below WQS within a reasonable distance from the site boundary.
The site stakeholders agree with the optimization team that the soil flushing remedy is providing
little or no measureable soil remediation beyond flushing from natural infiltration and a rising and
falling water table.
The optimization team estimates that quarterly sampling for VOCs with PDBs would be conducted at EX
1, MW 1-93, PW-2, and perhaps two or three other downgradient locations (existing or new). Monthly
sampling for VOCs with PDBs would continue at EW-4 and EW-5. Once per year or once every 2 years,
low-flow sampling could be conducted for MNA parameters to confirm MNA conditions still exist.
Assuming the information from the recommendations in Sections 6.1 and 6.3 are already available, the
approximate life-cycle cost for this potential approach might be on the order of $240,000 (excluding
system abandonment and confirmation sampling). This assumes approximately $20,000 of upfront data
analysis followed by approximately 20 years of sampling. The sampling is assumed to cost $11,000 per
year for laboratory analysis and 2 days per year for low-flow sampling.
Potential Approach #2 – Expand Soil Flushing Remedy to Address the Area Near EW-4 with MNA
This potential approach would be similar to Potential Approach #1 with the exception that an existing
infiltration field would be extended to the vicinity around EW-4 or a new infiltration field would be
installed in the vicinity of EW-4 to better flush that area. The approach would also involve continued
operation of the soil flushing remedy for the new EW-4 field only. This approach assumes that EX-1 does
not need to continue operating because it is assumed that after data evaluation, MNA would be deemed an
appropriate groundwater remedy. The optimization team cannot effectively estimate the time frame to
reach site closure, but an estimate of 10 years may be a reasonable estimate given that remediation near
EW-4 should be somewhat faster than with the current system. The pump house and infiltration galleries
would need to remain on the property for this duration limiting alternate land uses during this time period.
This potential approach might be appropriate if the following occurs:
The new information and data evaluation confirms that groundwater contamination observed on-
site degrades below WQS within a reasonable distance from the site boundary.
The site stakeholders believe the soil flushing remedy would more effectively address the area
around EW-4 than flushing from natural infiltration and a rising and falling water table.
Construction of an infiltration field in the vicinity of EW-4 is feasible.
The optimization team assumes the same sampling program as for Potential Approach #1. Potable water
injection and operation of the soil flushing remedy would continue. Assuming the information from
29

implementing the recommendations in Sections 6.1 and 6.3 is already available, the approximate life-
cycle cost for this potential approach might be on the order of $240,000 (excluding system abandonment
and confirmation sampling) but is highly variable depending on the effectiveness of soil flushing at EW
4. This assumes approximately $20,000 of upfront MNA data evaluation, $25,000 to sample soils in the
vicinity of EW-4 to identify the potential area for treatment, $50,000 to expand or construct and test a
new infiltration field, $3,500 per year in potable water usage (25% of the current usage), and 10 years of
sampling. The sampling is assumed to cost $11,000 per year for laboratory analysis and 2 days per year
for low-flow sampling.
Potential Approach #3 – Expand Soil Flushing Remedy to Address the Area near EW-4 with
Continued Groundwater Extraction
This potential approach would be similar to Potential Approach #2 with the exception that data evaluation
suggests that MNA is not an appropriate groundwater remedy and EX-1 needs to continue operating or
pumping needs to occur at EW-4 instead of EX-1 to capture groundwater contamination. The estimated
time frame for this remedy would be the same as that for Potential Approach #2. The pump house and
infiltration galleries would need to remain on the property for this duration and reuse of the property
would be limited during remediation.
This potential approach might be appropriate if the following occurs:
The new information and data evaluation finds that MNA is not an appropriate groundwater
remedy.
The site stakeholders believe the soil flushing remedy would more effectively address the area
around EW-4 than flushing from natural infiltration and a rising and falling water table.
Construction of an infiltration field in the vicinity of EW-4 is feasible.
The costs for this approach would be the same as those for Potential Approach #2 with the added cost of
operating EX-1 (or EW-4) and PW-2 and sampling the outfall monthly. These added costs would be
approximately $26,000 per year. The approximate life cycle cost for this potential approach might
therefore be on the order of $510,000 (excluding system abandonment and confirmation sampling) but is
highly variable depending on the effectiveness of soil flushing at EW-4.
Potential Approach #4 – Expand Soil Flushing Remedy to Address the Area near EW-4 with
Treatment Amendments
This potential approach would be similar to Potential Approach #2 with the exception that treatment
amendments such as potassium permanganate (for ISCO) or emulsified vegetable oil (for bioremediation)
would be applied to the soil flushing remedy instead of groundwater extraction from EX-1. The
amendments would likely be metered into the potable water and mixed in line prior to distribution to the
infiltration fields. Assuming amendments are only added to treat in the vicinity of EW-4 and that the
volume to be treated is approximately 2,000 cubic yards, chemical oxidation or bioremediation
amendments (materials only) would likely cost on the order of $40,000 to over $100,000 depending on
site-specific conditions. Tanks, feed pumps, an in-line mixer, and controls would be needed to meter the
amendments into the potable water. These items might cost $25,000 to design and install. Soil flushing
with the amendments would likely need to occur for 1 to 3 years (refer to Section 4.2.2 for a discussion of
flushing rates) to allow amendments a reasonable opportunity to reach the water table. The amendment
addition would have the same limitations regarding preferential pathway flow as historic flushing.
Remediation at EW-4 might (or might not) be complete after that 3-year period, but it is unclear if EW-5
30

will consistently meet WQS at that point. Up to 10 years (or more) might be needed before EW-5 can
consistently meet the WQS. In sum, the cost of this approach would likely add up to $65,000 or more to
the cost of Potential Approach #2 and may or may not improve performance and timeliness of
remediation.
Potential Approach #5 – Use Soil Vapor Extraction to Address Soil Contamination at EW-4 with
MNA for Groundwater Remediation
This approach would be similar to Potential Approach #2 but would use soil vapor extraction (SVE)
instead of soil flushing to address the contaminated soils contributing to groundwater contamination near
EW-4. Design of the SVE system would need to account for the tight soils. Pneumatic fracturing of the
clay or the construction of several SVE trenches might be needed to provide adequate vapor recovery.
Soil sampling could be conducted during SVE installation to help evaluate the size and extent of the SVE
system. Design and installation of the system would likely be over $350,000, and up to 5 years of
operation might be required at approximately $6,000 per year for electricity costs alone. Additional labor
would be required to check and monitor the system. The MNA evaluation and annual groundwater
sampling consistent with Potential Approach #1 would also apply for approximately 10 years until EW-5
can consistently meet WQS. In sum, the life cycle costs would likely be over $500,000 (excluding system
abandonment and confirmation sampling). SVE effectiveness will be dependent on the ability of the
extraction system to pull vapors from the subsurface, which cannot be accurately estimated without on-
site pilot testing.
Potential Approach #6 – Mix Chemical Oxidants with Soil in Vicinity of EW-4
Similar to Potential Approaches #4 and #5, this approach would involve targeted remediation in the
vicinity of EW-4. The optimistic scenario of MNA is assumed for other parts of the site. This approach
would involve characterizing a particular area for treatment, excavating the treated soil, mixing the
excavated soil with a chemical oxidant (e.g., potassium permanganate), and backfilling the amended soil
in the excavation. The optimization team estimates that this approach might cost $200,000 (or possibly
more depending on the soil oxidant demand) to only address the soils in the area of EW-4. Similar to
Potential Approaches #4 and #5, costs would still be required for groundwater monitoring and allowing
time for EW-5 to consistently meet WQS. It is a more certain method of addressing the contamination at
EW-4, but does not improve the certainty of the cleanup time for EW-5.
Potential Approach #7 – Expand Soil Flushing Remedy to EW-4 and Apply Amendments to
Infiltration Fields for EW-4 and EW-5
This approach is similar to Potential Approach #4 except that the amendments are also added to
infiltration fields 3 and 4 to attempt to accelerate the remediation of contamination observed at EW-5.
The optimization team estimates that the costs for the additional amendment to add to these two other
infiltration fields is on the order of $400,000 to $1,000,0000, assuming a treatment area of 30,000 square
ft and a treatment depth of 20 ft and a range of potential site-specific soil characteristics. Operation of the
system would likely need to occur for approximately 3 years to allow for distribution of the amendment.
An optimistic scenario is that EW-4 and EW-5 consistently meet the WQS after this 3 year period.
Optimistically, total costs of the potential approach might range from $500,000 to over $1,000,000.
However, if soil remediation has been limited by preferential flow from the infiltration fields to
groundwater, then the application of amendments would likely be limited by the same preferential flow,
and there is no guarantee that the amendments will accelerate remediation. For this reason, if the
resources are going to be invested in more aggressive remediation of site soils, another technology that
does not suffer from the uncertainty related to preferential flow through soils, should be considered (see
below).
31

Other Potential Approaches
Other potential approaches would involve broader application of the above technologies (e.g., ISCO
mixing) or the use of other technologies such as in situ thermal remediation to more aggressively address
site soils and reduce uncertainty associated with preferential flow during soil flushing. Absent other
information, it is reasonable to assume that remediation would require approximately $100 per cubic yard
and that remediation could be achieved in a few years. Application of an aggressive remedy for soils
across the site could likely exceed $2,500,000. Given this scale of cost, a pre-remedy characterization
effort would be merited to better understand the CSM and better identify target areas for remediation.
Optimization Team Input
Given the above potential approaches and the need for more information, the optimization team suggests
moving forward with the recommendations in Sections 6.1 and 6.3 to better understand the nature of the
problem. Determining if 1,4-dioxane is present, if MNA is appropriate, and if acetonitrile is a site-related
contaminant are all important questions for considering a path forward. Unfortunately, soil sampling
through the infiltration fields could affect the future performance of the fields by damaging pipes or
accentuating preferential flow paths. Soil sampling outside of the infiltration fields may be helpful for
identifying soil contamination that might be causing the observed contamination at EW-4. If no other
subsurface obstructions are present in this location, direct-push technology (DPT) could be used to
perform higher-resolution sampling to better understand the extent and magnitude of contamination in
this area and the potential to address it. The decision to address potential soil contamination near EW-4
will likely depend on the results of that investigation, the applicability of MNA as a remedy, and the
sampling results at EW-5 over the next few years as the site team collects additional information. The site
team might consider obtaining the information from the recommendations in Sections 6.1 and 6.3 and
determine if the findings strongly suggest a particular path forward. If focus on the EW-4 area is of
interest, a field event consisting of 2 or 3 days of DPT soil sampling could be conducted to evaluate
potential areas for target remediation. The cost for this field event might be approximately $40,000,
including a field sampling plan, 3 days in the field, laboratory analysis, and reporting.
6.4.2 EVALUATING POTENTIAL FOR SOIL VI
Once WQS have been met for groundwater and/or the soil flushing system has been discontinued and
vadose zone dewatered, the site team can evaluate the potential for VI for future structures on the site.
Soil vapor samples can be collected from the dry infiltration field sumps because the infiltration fields
cover the majority of the property, represent the preferential path for soil vapor migration in the
subsurface, and will be in equilibrium with the underlying soil vapor contamination. Prior to sampling,
the sumps should be fitted with air tight caps. Pulling vapor samples from each of the four fields would
cost approximately $1,200 in analytical costs ($300 per summa canister sample analyzed for VOCs).
These samples could be collected by City employees in 1 day with limited instruction from a qualified
laboratory. If an environmental consultant is hired to conduct the work, the cost for contracting, a work
plan, health and safety plan, and sample collection may be as much as $10,000. If soil vapor
concentrations suggest a potential risk, the site team could decide to pursue more aggressive soil
remediation (see above) or to require vapor barriers, passive venting, or other VI mitigation approaches
for future buildings.
32

6.5 RECOMMENDATIONS RELATED TO FOOTPRINT REDUCTION
No green remediation recommendations are provided, but recommendations in Section 6.2 may result in
reducing the remedy footprint.
6.6 SUGGESTED APPROACH TO IMPLEMENTING RECOMMENDATIONS
The recommendations in Sections 6.1 and 6.3 can be implemented immediately and are necessary for
considering a path forward as discussed in Section 6.4.
33

Table 9: Cost Summary Table
Recommendation Reason
Additional
Capital
Costs ($)
Estimated
Change in
Annual
Costs ($/yr)
Estimated
Change in
Life-Cycle
Costs $*
Discounted
Estimated
Change in
Life-Cycle
Costs $**
6.1.1 SURVEY WELLS,
MEASURE WATER
LEVELS, AND PREPARE
POTENTIOMETRIC
SURFACE MAPS TO
CONFIRM
GROUNDWATER FLOW
DIRECTION
Effectiveness $15,000 $0 $15,000 $15,000
6.1.2 SAMPLE
ADDITIONAL INTERVAL
IN EW-4, EW-5 AND MW-1
93
Effectiveness $5,400 $0 $5,400 $5,400
6.1.3 ANAYLZE
GROUNDWATER FOR 1,4
DIOXANE
Effectiveness $10,000 $0 $10,000 $10,000
6.1.4 ANALYZE
GROUNDWATER
SAMPLES FOR MNA
PARAMETERS
Effectiveness $6,000 $0 $6,000 $6,000
6.1.5 EVALUATE NEED
FOR ADDITIONAL
MONITORING POINTS
Effectiveness Not quantified
6.3.1 SUBMIT BLIND PDB
BLANK SAMPLES FOR
EACH SAMPLING EVENT
Technical
Improvement $100 per sampling event until issue is resolved
6.3.2 POSTPONE SOIL AND
SOIL VAPOR SAMPLING
Technical
Improvement $0 $0 $0 $0
6.4.1 POTENTIAL
REMEDIAL APPROACHES
FOR CONSIDERATION BY
THE SITE
STAKEHOLDERS
Site Closure See text
6.4.2 EVALUATING
POTENTIAL FOR SOIL
VAPOR INTRUSION
Site Closure See text
* Assumes additional 20 years of system operation
** Assumes a discount rate of 3%
34
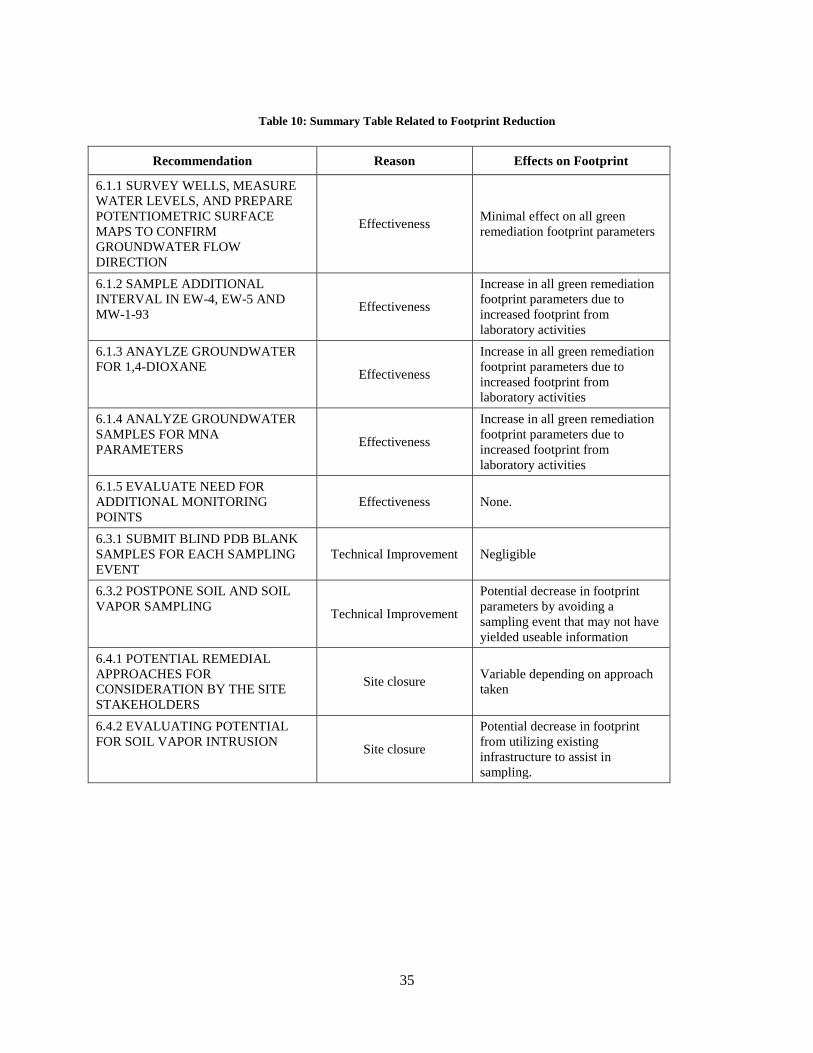
Table 10: Summary Table Related to Footprint Reduction
Recommendation Reason Effects on Footprint
6.1.1 SURVEY WELLS, MEASURE
WATER LEVELS, AND PREPARE
POTENTIOMETRIC SURFACE
MAPS TO CONFIRM
GROUNDWATER FLOW
DIRECTION
Effectiveness Minimal effect on all green
remediation footprint parameters
6.1.2 SAMPLE ADDITIONAL
INTERVAL IN EW-4, EW-5 AND
MW-1-93 Effectiveness
Increase in all green remediation
footprint parameters due to
increased footprint from
laboratory activities
6.1.3 ANAYLZE GROUNDWATER
FOR 1,4-DIOXANE Effectiveness
Increase in all green remediation
footprint parameters due to
increased footprint from
laboratory activities
6.1.4 ANALYZE GROUNDWATER
SAMPLES FOR MNA
PARAMETERS Effectiveness
Increase in all green remediation
footprint parameters due to
increased footprint from
laboratory activities
6.1.5 EVALUATE NEED FOR
ADDITIONAL MONITORING
POINTS
Effectiveness None.
6.3.1 SUBMIT BLIND PDB BLANK
SAMPLES FOR EACH SAMPLING
EVENT
Technical Improvement Negligible
6.3.2 POSTPONE SOIL AND SOIL
VAPOR SAMPLING Technical Improvement
Potential decrease in footprint
parameters by avoiding a
sampling event that may not have
yielded useable information
6.4.1 POTENTIAL REMEDIAL
APPROACHES FOR
CONSIDERATION BY THE SITE
STAKEHOLDERS
Site closure Variable depending on approach
taken
6.4.2 EVALUATING POTENTIAL
FOR SOIL VAPOR INTRUSION Site closure
Potential decrease in footprint
from utilizing existing
infrastructure to assist in
sampling.
35

ATTACHMENT A: FIGURES


ATTACHMENT B

mJt
i ffl a
.. CO
LU
or
co * en
21
<
uj
»-« i
LD
\ t/i
z
LD
O
O> Q
3
O
» »
-• I I
U
J
\—
z tn
c/i
- or
a
O <
CD
<
z
LU 3E
z
a
<
LD
(/) o
u
1/1
O
*- ..
or u. LU
Z
CO
M
AM
UA
VA
VA
WI—
—
' ' 1
VV
W\W
\V\V
l\V\V
iJ
| <
1^1
P
==l
§-»
K
j»n
»»
»A
V^—
F
>
1
1
^
a <
i—
UJ
r^ -3
- co
C
N
o
oo
o
x a
a
OJ
-3"
CO
O
O
-3"
Z
|~|
00
'—•'
— -r
0 $
, 1<N
<
U
J
y t/>
z
i3
O
)
1-1
UJ
Q
2
U
C?
^r
_j
<;
~^~
.
.o A
i
ill i
1 [•• '-\
trm
1
-j —
o
o
O
r*
. CD
••" .j
f
*>o
LA
co
r^ co
_j
^^
—
CM
U
J Q
>
Z
<o ^j
^
<
ca
en uj
a
H o
UJ
o
^ ~
Z-
CO
CO
% ™
i
ill i
i F
l M
CO
o
.—, o
o
o
o
o
o
LU
klsl
O
O
CA
~-
l/"\ f"\
tf 0
LU
-3- fl
—
UJ
U
_j
<
f no
-i
or
U J
H
-.
or S
~
1
II
I I
I H
E
l o.
LU
LTV O
O
C
M
O
O
—
LA
irv
O
o
en LD
m
u-\
c>4
-3" H
H
CO
—
—
t>->
U
J or
•-• =)
S
_J I a
U
C
/l U
J en in »
( ii
-^
' Z
(\J L
U
v^
1--
^~
a m
~
c —
1 .
i i
11
1 >•
\ •-• h- O
) _l
o
in
a
in
Qor o
1
a in
-i —
• t\j
oj n
i i
i i
i i
LU
1 CD
n
Z*-•
. a
_J O
^
DE
PT
H
BE
LO
W
GR
OU
ND
L
EV
EL
IN
F
EE
T
CD m u
o o
a

i m rH
a I 1 1 1 1 1
in < CO
IU—
0
?^o>3
z-«/>z
0
</>K
r — -i ^ o
o ui 1
Q
Z < LU
U) Z O
UJ I— I/) l/l or a
< z 0 < U CO
„ U) 1- ttO 0) * O)
u o o » «-• _l Z 1 a < 03 UI CD 0)O 1 ~ a: u. uja < >
LU a: CD
1 1
S^ 1 1 1 1 1 H 3 >- o: < f»"t -3" O O O UJ UJ xa a — • — O
vO O in
Z O z
O O Q T*
S i < U J
UIC/l Z
Q
£ 1 ^
1-1
°
UJ •
oQ
UJ 2
-i U
2' i i1 i ' i '"" i El M CQ
1 1—1 o o o o o CM•—
J" —
O vO
O LT(
O O |
CQ
- . UJ
z crv
- Qz<CO
UJ
^
> <
or L3
od Q
^
c
CJ w CO
Ik
CO LJ
-=o"i i
|l i i:i| ' ' .-^VW.\\\\\\\\\\\H^^^:::::::-r^^::|::::::::::::::::::::ii 1 ! ' 1• WWOvVWftVv'i!— 1 1
^7 ^
^ u) CO CO
joo oo —
o oo
—
o r». CM
CM CM
Ll"l '1- ' 0
o LJ
.0h
>-i
_J UJ >
o:
U f nu
Z §* n .... i , in i , 1 1 iTvyyoif— T 01 CJ
fXu_
O O O O O
UJ •—•o:
o,in in
•-•
LJ CD
_1U
KTMrvoJ
I (fl
mmi Illlllll
=) Z oin >w in h-HI m a:
LJ^^9^_, l-
UJ CO
Z (\J UJ a m x^^
a ini
o —i
i in ->
i a (\J
i in (\J
i o
ni
h- 0) _J a: en UJ -J ffli—i
..Z , O
_JO •-!
Z h-
DEPTH BELOW GROUND LEVEL IN FEET m CD u a a o »T-| _J

ATTACHMENT C

26

27

ATTACHMENT D


ATTACHMENT E

30
40
50
600
5
10
15
oncentratio
n (µg/L)
epth to W
ater (ft)
EX‐1 TCE Concentration versus Historic Water Levels
Regional Depth to Water Measurement (ft)
EX 1 TCE (µg/L)
AOC Standard (µg/L)
0
10
2020
25
30
12/2/1993 12/2/1995 12/2/1997 12/2/1999 12/2/2001 12/2/2003 12/2/2005 12/2/2007 12/2/2009
TCE CD
‐
e

EW #4 TCE Concentration versus Historic Water Levels
Deep
thto
Water
(ft)
TC
ECo
ncen
tration(µg//L)
0 120
Regional Depth to Water Measurement (ft)
5 EW #4 TCE (µg/L) 100
AOCAOC StandardStandard (µg/L)(µg/L)
10 80
15 60
20 40
25 20
30 0
12/2/1993 12/2/1995 12/2/1997 12/2/1999 12/2/2001 12/2/2003 12/2/2005 12/2/2007 12/2/2009

EW #5 TCE Concentration versus Historic Water Levels
Deep
thto
Water
(ft)
TC
ECo
ncen
tration(µg//L)
0 60
Regional Depth to Water Measurement (ft)
5 EW #5 TCE (µg/L) 50
AOCAOC StandardStandard (µg/L)(µg/L)
10 40
15 30
20 20
25 10
30 0
12/2/1993 12/2/1995 12/2/1997 12/2/1999 12/2/2001 12/2/2003 12/2/2005 12/2/2007 12/2/2009

ATTACHMENT F

Power Sources and Global Emissions Factors for Electricity Provided by
Table 5 Missouri State Electricity Pofile www.eia.gov
Type % Used* Water (gal/kWh) CO2e (lbs/kWh) NOx (lbs/kWh) SOx (lbs/kWh) PM (lbs/kWh) HAPs (lbs/kWh) Lead (lbs/kWh) Mercury (lbs/kWh) Dioxins (lbs/kWh)
Full Load Adjusted Full Load Adjusted Full Load Adjusted Full Load Adjusted Full Load Adjusted Full Load Adjusted Full Load Adjusted Full Load Adjusted Full Load Adjusted
Biomass 0% 168 0 0 0 0.0015 0 0.00060 0 0.000084 0 0 0 0 0 0 0 0 0
Coal 81% 0.94 0.76234 2.4 1.9464 0.0067 0.0054337 0.015 0.012165 0.0017 0.0013787 0.0007 0.0005677 0.00000024 1.9464E-07 0.000000042 3.4062E-08 3.8E-13 2.8969E-13
Geothermal 0% 0 0 0 0 0 0 0 0 0 0 0 0 0 0 0 0 0 0
Hydro 2% 0 0 0 0 0 0 0 0 0 0 0 0 0 0 0 0 0 0
Natural Gas 4% 0.79 0.03081 1.4 0.0546 0.0012 0.0000468 0.012 0.000468 0.000088 3.432E-06 0.000193 7.527E-06 1.31E-08 5.109E-10 2.9E-09 1.131E-10 0 0
Nuclear 12% 0.72 0.08352 0.024 0.002784 0.000056 0.0000065 0.000131 1.5196E-05 0.0000126 1.4616E-06 0.0000053 6.148E-07 5.2E-09 6.032E-10 4.6E-10 5.336E-11 2.9E-15 2.4221E-16
Oil 0% 3.52 0 1.9 0 0.0036 0.0000000 0.0041 0 0.00029 0 0.0000902 0 0.00000129 0 1.01E-08 0 1.04E-12 0
Solar 0% 0 0 0 0 0 0 0 0 0 0 0 0 0 0 0 0 0 0
Wind 0% 0 0 0 0 0 0 0 0 0 0 0 0 0 0 0 0 0 0
Other 1% 0 0 0 0 0 0 0 0 0 0 0 0 0 0 0 0 0 0
Total based on kWh at plant 100% 0.9 2 0.00549 0.0126 0.001384 0.0005758 0.0000002 3.4E-08 2.9E-13
Total based on kWh at point of use (0.12
kWh/kWh lost in transmission) 1 2.24 0.00615 0.0141 0.00155 0.000645 0.00000022 3.8E-08 3.2E-13
* Based on the following: Obtain "generation mix" or "fuel blend" from the local utility provider and enter the percentages of each type of electrcity generation method into the "% Used*" column of the above table. Percentages should add to 100%. The above table provides the conversion factors to convert each kWh of electricity from each generation type into each of the environmental parameters. "Adjusted" refers to adjusting the footprint value by the percentage of electricity from that particular generation type (e.g., the adjusted value for CO2e emitted by nuclear is 10% of the full-load value if the % of electricity generated by nuclear is 10%).
Notes: - Water consumption for thermoelectric power plants in U.S. - 0.47 gallons per kWh* - Water consumption for hydroelectric power assumed to be 0 gallons per kWh (i.e., considers evaporation from reservoir as non-additive) - Water consumption for coal resource extraction and fuel processing - 0.16 cubic meters per GJ of extracted energy, and 33% thermal energy conversion to electricity** - Water consumption for uranium resource extraction and fuel processing - 0.086 cubic meters per GJ of extracted energy and 33% thermal energy conversion to electricity** - Water consumption for natural gas resource extraction and fuel processing - 0.11 cubic meters per GJ of extracted energy and 33% thermal energy conversion to electricity** - Water consumption for oil resource extraction and fuel processing - 1.06 cubic meters per GJ of extracted energy and 33% thermal energy conversion to electricity** - Water consumption for biomass based on 55 cubic meters per GJ of extracted energy and 33% thermal energy conversion to electricity*** - CO2e, Nox, SOx, and PM emissions from NREL LCI for each fuel type ****
* Consumptive Water Use for U.S. Power Production, December 2003 • NREL/TP-550-33905
** Gleick PH. Water and energy. Annu. Rev. Energy Environ. Vol 19, 1994. p 267-99.
*** The Water Footprint of Energy Consumption : an Assessment of Water Requirements of Primary Energy Carriers, Winnie Gerbens-Leenes, Arjen Hoekstra, Theo an der Meer, ISESCO
Science and Technology Vision, Volume 4 - Number 5, May 2008 **** "NREL LCI" refers to the U.S. Dept. of Energy, National Renewable Energy Laboratory (NREL), Life-Cycle Inventory Database (www.nrel.gov/lci) maintained by the Alliance for
Sustainable Energy, LLC.