Optimization and hyper production of laccase from novel agaricomycete Pseudolagarobasidium...
12
ORIGINAL ARTICLE Optimization and hyper production of laccase from novel agaricomycete Pseudolagarobasidium acaciicola AGST3 and its application in in vitro decolorization of dyes Shilpi Thakur & Akshaya Gupte Received: 17 August 2013 /Accepted: 12 February 2014 # Springer-Verlag Berlin Heidelberg and the University of Milan 2014 Abstract A novel white rot fungus Pseudolagarobasidium acaciicola AGST3 was investigated for the production of laccase under solid state fermentation. The effects of fourteen medium components were screened by the initial screening method of Plackett-Burman. Each of the components was screened on the basis of a ‘p’ (probability value) that was above 95 % confidence level. Tween 80, CuSO 4 ·5H 2 O, glu- cose and FeC 6 H 5 O 7 ·NH 4 OH were identified as significant components for laccase production. Central composite design using response surface methodology with four significant variables was used in this study to optimize significant corre- lations between the effects of these variables on laccase pro- duction. The optimum concentrations of Tween 80, glucose, FeC 6 H 5 O 7 ·NH 4 OH and CuSO 4 ·5H 2 O were (g/l): 0.6625, 0.437, 0.037 and 0.6625, respectively, for maximum laccase production. Compared to the unoptimized medium, the laccase production (5.35×10 5 U/g of substrate) increased 1.6-fold under optimized condition. Furthermore, the crude laccase obtained was used for the decolorization of structur- ally different dyes, and 11–96 % of decolorization was ob- tained after 24 h of incubation. Keywords Pseudolagarobasidium acaciicola . Laccase . Solid state fermentation . Plackett-Burman design . Response surface methodology . Decolorization Mathematical notation ε Molar extinction coefficient Introduction Laccase (benzenediol: oxygen oxidoreductase, E.C. 1.10.3.2) is a multinuclear copper-containing enzyme that oxidizes diverse substrates and exists widely in nature (Liu et al. 2009; Thakur et al. 2012). Most of the laccases studied are from fungal origin, especially from white rot fungi (Abou-Mansouri et al. 2009; Fu et al. 2013). Laccases catalyze the oxidation of a variety of phenolic and non-phenolic compounds with a concomitant reduction of molecular oxygen to water (Zhang et al. 2012). The broad substrate specificity of laccase results in a large number of biotechnological applications. These include decol- orization and detoxification of textile dyes and effluents, biobleaching, biopulping, and transformation of antibiotics, steroids, and other aromatic compounds (Cerrone et al. 2011; Dhillon et al. 2012; Thakur et al. 2012). Thus, the production of laccase in large amounts at a low cost is required, and hence, the current focus is towards the search for an efficient production system. The use of solid state fermentation (SSF) as a method of laccase production can offer certain advantages, such as high volumetric productivity, concentrated product, lower capital investment and operating cost (Chhaya and Gupte 2010). It is known that the production of laccase is affected by media components. The development of an economically productive medium requires selection of components such as carbon, nitrogen and metal ions (Liu et al. 2009). Large numbers of reports are available on the optimization of the media compo- nents by means of the classical methods of changing one independent variable, while fixing other variables at definite levels. Compared to the classical methods, statistical experi- mental designs are useful tools to screen the main variables rapidly from a multivariable system for medium optimization. Less process variability, overall cost and closer confirmations are a few advantages of the statistical design. Plackett-Burman (PBD) and response surface methodology (RSM) have been successfully applied for the optimization of laccase production S. Thakur : A. Gupte (*) Department of Microbiology, Natubhai V. Patel College of Pure and Applied Sciences, Vallabh Vidyanagar, 388120 Gujarat, India e-mail: [email protected] Ann Microbiol DOI 10.1007/s13213-014-0849-4
Transcript of Optimization and hyper production of laccase from novel agaricomycete Pseudolagarobasidium...

ORIGINAL ARTICLE
Optimization and hyper production of laccasefrom novel agaricomycete Pseudolagarobasidium acaciicolaAGST3 and its application in in vitro decolorization of dyes
Shilpi Thakur & Akshaya Gupte
Received: 17 August 2013 /Accepted: 12 February 2014# Springer-Verlag Berlin Heidelberg and the University of Milan 2014
Abstract A novel white rot fungus Pseudolagarobasidiumacaciicola AGST3 was investigated for the production oflaccase under solid state fermentation. The effects of fourteenmedium components were screened by the initial screeningmethod of Plackett-Burman. Each of the components wasscreened on the basis of a ‘p’ (probability value) that wasabove 95 % confidence level. Tween 80, CuSO4·5H2O, glu-cose and FeC6H5O7·NH4OH were identified as significantcomponents for laccase production. Central composite designusing response surface methodology with four significantvariables was used in this study to optimize significant corre-lations between the effects of these variables on laccase pro-duction. The optimum concentrations of Tween 80, glucose,FeC6H5O7·NH4OH and CuSO4·5H2O were (g/l): 0.6625,0.437, 0.037 and 0.6625, respectively, for maximum laccaseproduction. Compared to the unoptimized medium, thelaccase production (5.35×10⁵ U/g of substrate) increased1.6-fold under optimized condition. Furthermore, the crudelaccase obtained was used for the decolorization of structur-ally different dyes, and 11–96 % of decolorization was ob-tained after 24 h of incubation.
Keywords Pseudolagarobasidium acaciicola . Laccase .
Solid state fermentation . Plackett-Burman design . Responsesurface methodology . Decolorization
Mathematical notation
ε Molar extinction coefficient
Introduction
Laccase (benzenediol: oxygen oxidoreductase, E.C. 1.10.3.2) isa multinuclear copper-containing enzyme that oxidizes diversesubstrates and exists widely in nature (Liu et al. 2009; Thakuret al. 2012). Most of the laccases studied are from fungal origin,especially from white rot fungi (Abou-Mansouri et al. 2009; Fuet al. 2013). Laccases catalyze the oxidation of a variety ofphenolic and non-phenolic compounds with a concomitantreduction of molecular oxygen to water (Zhang et al. 2012).The broad substrate specificity of laccase results in a largenumber of biotechnological applications. These include decol-orization and detoxification of textile dyes and effluents,biobleaching, biopulping, and transformation of antibiotics,steroids, and other aromatic compounds (Cerrone et al. 2011;Dhillon et al. 2012; Thakur et al. 2012). Thus, the production oflaccase in large amounts at a low cost is required, and hence, thecurrent focus is towards the search for an efficient productionsystem. The use of solid state fermentation (SSF) as a methodof laccase production can offer certain advantages, such as highvolumetric productivity, concentrated product, lower capitalinvestment and operating cost (Chhaya and Gupte 2010). It isknown that the production of laccase is affected by mediacomponents. The development of an economically productivemedium requires selection of components such as carbon,nitrogen and metal ions (Liu et al. 2009). Large numbers ofreports are available on the optimization of the media compo-nents by means of the classical methods of changing oneindependent variable, while fixing other variables at definitelevels. Compared to the classical methods, statistical experi-mental designs are useful tools to screen the main variablesrapidly from a multivariable system for medium optimization.Less process variability, overall cost and closer confirmationsare a few advantages of the statistical design. Plackett-Burman(PBD) and response surface methodology (RSM) have beensuccessfully applied for the optimization of laccase production
S. Thakur :A. Gupte (*)Department of Microbiology, Natubhai V. Patel College of Pure andApplied Sciences, Vallabh Vidyanagar, 388120 Gujarat, Indiae-mail: [email protected]
Ann MicrobiolDOI 10.1007/s13213-014-0849-4

by various researchers (Liu et al. 2009; Chhaya and Gupte2010; Tinoco et al. 2011). The present work is directed towardsthe medium optimization for the maximum production oflaccase by novel fungal isolate Pseudolagarobasidiumacaciicola AGST3. Until now, there have been no reports onthe medium optimization for enhancing laccase production bythe genus Pseudolagarobasidium (Agaricomycetes) belongingto the phylum Basidiomycota, Phanerochaetaceae family andorder polyporales. Furthermore, the laccase produced was usedfor the in vitro dye decolorization of chemically different dyes.
Materials and methods
Isolation and screening of new fungal strain
Different samples, such as decayed wood, tree bark andmushrooms, were collected from Vallabh Vidyanagar, Vadtaland nearby regions of Anand District, Gujarat, India. Sampleswere transferred on 2 % Malt extract agar (MEA) plates withantibiotic streptomycin (25 μg/ml), and incubated at 30°C for8–10 days. Samples were then screened for the presence oflaccase enzyme. Primary screening was carried out onSabouraud dextrose agar plate containing 0.01 % ortho-dianisidine and guaiacol.
Cultivation conditions for laccase production under SSF
Five grams of wheat bran was added to 250 ml Erlenmeyerflasks and moistened with a medium described by Asther et al.(1988) to give a final substrate to moisture ratio of 1:4 (w/v).The moistening medium containing (g/l) KH2PO4 0.2,CaCl2·2H2O 0.0132, MgSO4·7H2O 0.05, FeC6H5O7·NH4OH(ammonium ferric citrate) 0.085, ZnSO4·7H2O 0.0462,MnSO4·7H2O 0.035, CoCl2·6H2O 0.007, CuSO4·5H2O0.007, L-aspargine 1.0, NH4NO3 0.5, thiamine-HCl 0.0025,yeast extract 0.5, Glucose 10, Tween-80 0.1, and pH 5.0 wasused. Each flask was inoculated with five agar plugs (9 mmdiameter) of actively growing fungal mycelia fromMEA plateand incubated at 30°C for 12 days.
The enzyme was extracted using 100 mM sodium acetatebuffer (pH 5.0), and the contents were filtered through amuslin cloth. The extract obtained was then centrifuged at8000×g for 20 min at 4 °C, and the clear supernatant obtainedwas used as a source of laccase.
Experimental design and statistical analysis
Screening of important medium componentsby Plackett-Burman Design (PBD)
PBD aims to select the most important components that influ-ence overall enzyme production in the system or medium. In
the present study, total fourteen medium components (k=14)were selected for study, with each variable being representedat two levels; high (+) and low (−). The numbers of positiveand negative signs per trial are (k+1)/2 and (k – 1)/2, respec-tively. Each row represents a trial and each column representsan independent (assigned) or dummy (unassigned) variable.The effect of each variable was determined by the followingEquation:
E xið Þ ¼ 2 ∑Mþi −M
−i
� �=N ð1Þ
where E(xi) is the concentration effect of the tested variable,and Mi
+ and Mi− are the laccase production from the trial
where the variable (xi) measured was estimated by calculatingthe variance among the dummy variables as follows:
Veff ¼ ∑ Ed2
� �=n ð2Þ
where Veff is the variance of the concentration effect, Ed is theconcentration effect for the dummy variables, and n is thenumber of dummy variables. The standard error (S.E.) of theconcentration effect was the square root of the variance of aneffect and the significance level (p value) of each concentra-tion effect was determined using student’s t test.
t xið Þ ¼ Exi=S:E: ð3Þ
where, Exi is the effect of variable xi.
Response Surface Methodology (RSM)
RSM consists of an empirical modeling system that evaluatesthe relationship between a group of independent variables andobserved responses (Revankar et al. 2007). RSM was used tooptimize the screened components by PBD for enhancedlaccase production using central composite design (CCD).The effect of each component on laccase production wasstudied at five different levels, viz., −α, −1, 0, +1, +α. Thebehavior of the system was explained by the following qua-dratic Equation:
Y ¼ β0 þ ∑βixi þ ∑βijxix j þ ∑βiix2i ð4Þ
where Y is predicted response, β0 is the offset term, βi is thelinear coefficient, βii is the squared coefficient, βij is theinteraction effect, and xi is the dimensionless coded value ofXi. The above equation was solved using the software Design-Expert (Version 7.0.2, State ease inc., USA). A 25 factorialdesign with five replicates at the center point with a totalnumber of 30 trials was employed. The coded and uncodedvalues of the variables at various levels are given in Table 4.
Ann Microbiol

Laccase assay
Laccase activity (E.C. 1.10.3.2) was determined by monitor-ing the A420change related to the rate of oxidation of 2,2-azino-bis-3-ethyl-benzthiozoline-6-sulphonic acid (ABTS,ε=36,000 cm−1 M−1) at 30 °C for 3 min (Niku-Paavolaet al. 1990). The reaction mixture contained 100 μl of50 mM ABTS, 800 μl of 100 mM Na-Acetate buffer(pH 5.0), and 100 μl of appropriately diluted enzyme extract.One unit of enzyme activity (U) was defined as the amount ofenzyme that leads to the oxidation of 1 μM of substrate/minunder the standard assay condition.
In vitro decolorization of dyes by laccase produced in-house
Decolorization activity was determined by measuring thedecrease in the dye absorbance at the respective absorptionmaxima. Twenty-one different dyes (Violet P3P, Blue M4GB,Green ME4BL, Acid Red BN, Blue 3R, Brown 18, Acidgreen 10H, Reactive red M5B, Direct black 22, Acid black194, Green HE4G, Reactive red C2G, Red BS, Violet 5B,Reactive red HE8B, Direct orange 5B, Direct red 4BS, Tur-quoise blue H5G, Direct red 12B, Reactive turquoise blue Gand Acid red F2R) were investigated with crude filtrate ofenzyme. The reaction mixture contained 100 mM Sodiumacetate buffer (pH 5.0), dye (100 mg/l) and crude enzymefiltrate (final concentration 5000 U/ml). The reaction wasinitiated with enzyme and incubated at 30 °C under shakingcondition (150 rpm). Samples were withdrawn at regular timeintervals and subsequently analyzed for decolorization. Ab-sorbance was recorded at the respective absorption maximausing Shimadzu UV-1800, Japan. A control in which thecrude enzyme filtrate was replaced by denatured enzymewas kept in parallel. Dye decolorization efficiency wasexpressed in terms of percentage (%) as compared to initialconcentration of dye used. All the experiments were carriedout in triplicate, and the data represent the mean values of theexperiments.
Results and discussion
Isolation and screening of new fungal strain
One of the parameters widely used in the detection ofligninolytic enzymes is the chromogen. In the present study,ortho-dianisidine and guaiacol were used as a chromogen. Thedark brown colored zone surrounding the mycelia of theculture on the plate supplemented with ortho-dianisidine andguaiacol was an indication of Bevandamm’s reaction. Out offifteen isolates, five isolates showed positive Bevandamm’sreaction for laccase activity and were selected for furtherquantitative detection of laccase enzyme. Similar results have
also been reported by Vishwanath et al. (2008), Patel et al.(2009) and Gao et al. (2011). The culture designated asAGST3 showed highest laccase activity (3.30×10⁵ U/g ofsubstrate) among five positive isolates. The identification ofisolates was further corroborated by studies on their ITS1 andITS2 gene sequences, carried out by Xplorigen, Pvt. Ltd.(New Delhi, India). The isolate AGST3 was identified asPseudolagarobasidium acaciicola AGST3 (GenBank acces-sion no. HQ323693).
Screening of important medium components for laccaseproduction by PBD
PBD is a saturated fractional factorial design that allows abalanced estimation of all main components with the smallestpossible variance. Moreover, the design is also orthogonal innature (Plackett and Burman 1946; Joshi et al. 2012). In thepresent study, PBD was applied for the screening of importantmedium components for the production of laccase. The inde-pendent variables and their respective high and low concen-trations are shown in Table 1. Table 2 shows the PBD matrixof 20 trials and the corresponding laccase production in termsof units per gram of substrate. The variables X1-X14 signifythe medium components, whereas D1-D5 represents the dum-my variables. Table 3 represents the effect, standard error, t(xi), p value and confidence level for each component. Thecomponents were screened at a confidence level of 95 % onthe basis of their effects. The confidence levels for X1
(glucose), X4 (CuSO4·5H2O), X8 (FeC6H5O7·NH4OH), X12
(Tween 80) were above 95 %, and were hence considered assignificant while the remaining components were consideredto be insignificant. The components having 95 % or aboveconfidence level but having a negative effect (glucose and
Table 1 Variables showing medium components used in Plackett-Burman design
Variables Medium component + Values (g/l) - Values (g/l)
X1 Glucose 10 1
X2 Yeast extract 0.2 0.02
X3 Ammonium nitrate 0.5 0.05
X4 CuSO4·5H2O 0.007 0.0007
X5 CoCl2·6H2O 0.007 0.0007
X6 MnSO4·7H2O 0.035 0.0035
X7 ZnSO4·7H2O 0.0462 0.00462
X8 FeC6H5O7·NH4OH 0.085 0.0085
X9 MgSO4·7H2O 0.05 0.005
X10 CaCl2·2H2O 0.0132 0.00132
X11 KH2PO4 0.2 0.02
X12 Tween 80 0.1 0.01
X13 Aspargine 1.0 0.1
X14 Thiamine 0.0025 0.00025
Ann Microbiol

FeC6H5O7·NH4OH) have an effect on laccase production, butthe amount required is lower than the indicated low (−)concentration in the Plackett-Burman experiment. Moreover,a positive effect (CuSO4·5H2O, Tween 80) indicates a require-ment of high concentration for increased laccase production.The results obtained indicate that the PBD is a very usefulstatistical method for screening important medium compo-nents for laccase production.
Optimization of screened medium components by RSM(CCD)
The experimental design performed by the RSM method isbased onmathematical techniques that enable us to investigatethe interactions between variables of the medium components.Plackett–Burman results indicated CuSO4·5H2O, Tween 80,glucose and FeC6H5O7·NH4OH had a significant influence on
Table 2 Plackett-Burman design matrix of fourteen variables (X1–X14) and five dummy variables (D1–D5) along with observed response (laccaseproduction)
Run no. X1 X2 X3 X4 X5 X6 X7 X8 X9 X10 X11 X12 X13 X14 D1 D2 D3 D4 D5 Laccase (U/g of substrate)
1 + + - - + + + + - + - + - - - - + + - 5.55×10⁴
2 - + + - - + + + + - + - + - - - - + + 3.62×10⁴
3 + - + + - - + + + + - + - + - - - - + 1.82×10⁵
4 + + - + + - - + + + + - + - + - - - - 2.65×10⁵
5 - + + - + + - - + + + + - + - + - - - 8.50×10⁴
6 - - + + - + + - - + + + + - + - + - - 8.10×10⁴
7 - - - + + - + + - - + + + + - + - + - 4.66×10⁵
8 - - - - + + - + + - - + + + + - + - + 6.23×10⁴
9 + - - - - + + - + + - - + + + + - + - 1.50×10⁵
10 - + - - - - + + - + + - - + + + + - + 6.79×10⁴
11 + - + - - - - + + - + + - - + + + + - 6.65×10⁴
12 - + - + - - - - + + - + + - - + + + + 5.00×10⁵
13 + - + - + - - - - + + - + + - - + + + 3.91×10⁴
14 + + - + - + - - - - + + - + + - - + + 7.40×10⁴
15 + + + - + - + - - - - + + - + + - - + 2.82×10⁴
16 + + + + - + - + - - - - + + - + + - - 1.20×10⁵
17 - + + + + - + - + - - - - + + - + + - 6.86×10⁵
18 - - + + + + - + - + - - - - + + - + + 2.41×10⁵
19 + - - + + + + - + - + - - - - + + - + 1.30×10⁵
20 - - - - - - - - - - - - - - - - - - - 7.93×10⁵
Table 3 Statistical analysis ofmedium components in relation tolaccase production as perPlackett-Burman design
Factors Medium component Effect (Exi) S.E. t (xi) P value Confidence level (%)
X1 Glucose −67874.8 16132.38 −4.2 0.008 99
X2 Yeast extract −35859 16132.38 −2.22 0.07 93
X3 Ammonium nitrate −240061 16132.38 −14.88 2.4×10−5 ND
X4 CuSO4·5H2O 119784.7 16132.38 7.42 0.0007 99.99
X5 CoCl2·6H2O −197208 16132.38 −12.22 6.4×10−5 ND
X6 MnSO4·7H2O −66306 16132.38 −4.11 0.009 99
X7 ZnSO4·7H2O −16799 16132.38 −1.041 0.34 66
X8 FeC6H5O7·NH4OH −93493.6 16132.38 −5.79 0.002 99
X9 MgSO4·7H2O −276042 16132.38 −17.1 1.2×10−5 ND
X10 CaCl2·2H2O −73295 16132.38 −4.5 0.006 99
X11 KH2PO4 −11465 16132.38 −0.71 0.51 49
X12 Tween 80 46591 16132.38 2.88 0.034 96.6
X13 Aspargine −57264 16132.38 −3.54 0.016 98.4
X14 Thiamine −32666 16132.38 −2.02 0.09 91
Ann Microbiol

laccase production, and these were further selected for opti-mization of their concentration by CCD. A total of 30 exper-iments with four variables (components of the medium) andfive coded levels (five different concentrations) were per-formed. Based on the results of PBD, components that aresignificant were set at their higher or lower level, and the othercomponents were set at their middle level in CCD. Table 4documents the experimental design, concentration ofdifferent variables, and their actual and predicted valuesof laccase production. The quadratic model was used toexplain the mathematical relationship between the inde-pendent variables and the dependent response. Themathematical expression of the relationship to the pre-dicted response ‘Y’ of the laccase production with thevariables A (CuSO4·5H2O), B (Tween 80), C (glucose)
and D (FeC6H5O7·NH4OH) is shown below in terms ofcoded factors:
Y ¼ 415730:83þ 11159:58A−17847:16 B−7961:25C−2004:66Dþ 11776:12AB−26108:12AC−20756ADþ 9308:12 BC−28894:5BDþ 37471:25CD
þ 3469:33A2 þ 7268:45B2−2976:91C2 þ 1241:08D2
The statistical significance of the quadratic model for theexperimental responses was evaluated by the analysis of var-iance (ANOVA). The results of ANOVA are shown in Table 5.The ANOVA for the selected quadratic model showed that themodel was significant with lack of fit, model F and modelP>F values of 0.2699, 34.59 and <0.0001, respectively. The
Table 4 Central composite design matrix with coded values and actual values for laccase production
Run no. CuSO4·5H2O Tween 80 Glucose FeC6H5O7·NH4OH Actualresponse
Predictedresponse
Actualvalue
Codedvalue
Actualvalue
Codedvalue
Actualvalue
Codedvalue
Actualvalue
Codedvalue
1 0.55 0 0.55 0 0.775 +2 0.0465 0 3.79×10⁵ 3.87×10⁵
2 0.6625 +1 0.4375 −1 0.6625 +1 0.037 −1 3.63×10⁵ 3.54×10⁵
3 0.55 0 0.325 −2 0.55 0 0.0465 0 4.79×10⁵ 4.80×10⁵
4 0.6625 +1 0.4375 −1 0.6625 +1 0.056 +1 4.46×10⁵ 4.42×10⁵
5 0.4375 −1 0.4375 −1 0.6625 +1 0.056 +1 5.31×10⁵ 5.37×10⁵
6 0.4375 −1 0.4375 −1 0.6625 +1 0.037 −1 3.68×10⁵ 3.66×10⁵
7 0.6625 +1 0.6625 +1 0.6625 +1 0.037 −1 4.11×10⁵ 4.19×10⁵
8 0.6625 +1 0.6625 +1 0.4375 −1 0.056 +1 3.55×10⁵ 3.65×10⁵
9 0.55 0 0.55 0 0.325 −2 0.0465 0 4.21×10⁵ 4.19×10⁵
10 0.55 0 0.55 0 0.55 0 0.0655 +2 4.12×10⁵ 4.16×10⁵
11 0.4375 −1 0.6625 +1 0.6625 +1 0.037 −1 3.92×10⁵ 3.84×10⁵
12 0.55 0 0.775 +2 0.55 0 0.0465 0 4.02×10⁵ 4.09×10⁵
13 0.4375 −1 0.6625 +1 0.6625 +1 0.056 +1 4.47×10⁵ 5.37×10⁵
14 0.4375 −1 0.4375 −1 0.4375 −1 0.056 +1 4.43×10⁵ 4.42×10⁵
15 0.4375 −1 0.6625 +1 0.4375 −1 0.056 +1 3.15×10⁵ 3.08×10⁵
16 0.55 0 0.55 0 0.55 0 0.0465 0 4.10×10⁵ 4.15×10⁵
17 0.4375 −1 0.6625 +1 0.4375 −1 0.037 −1 3.91×10⁵ 4.04×10⁵
18 0.6625 +1 0.4375 −1 0.4375 −1 0.056 +1 4.60×10⁵ 4.54×10⁵
19 0.55 0 0.55 0 0.55 0 0.0465 0 4.28×10⁵ 4.15×10⁵
20 0.775 +2 0.55 0 0.55 0 0.0465 0 4.49×10⁵ 4.51×10⁵
21 0.55 0 0.55 0 0.55 0 0.0465 0 4.07×10⁵ 4.15×10⁵
22 0.325 −2 0.55 0 0.55 0 0.0465 0 4.02×10⁵ 4.07×10⁵
23 0.6625 +1 0.6625 +1 0.6625 +1 0.056 +1 3.96×10⁵ 3.90×10⁵
24 0.55 0 0.55 0 0.55 0 0.0465 0 4.25×10⁵ 4.15×10⁵
25 0.6625 +1 0.6625 +1 0.4375 −1 0.037 −1 5.64×10⁵ 5.43×10⁵
26 0.55 0 0.55 0 0.55 0 0.0465 0 4.16×10⁵ 4.15×10⁵
27 0.55 0 0.55 0 0.55 0 0.0465 0 4.04×10⁵ 4.15×10⁵
28 0.6625 +1 0.4375 −1 0.4375 −1 0.037 −1 4.99×10⁵ 5.16×10⁵
29 0.55 0 0.55 0 0.55 0 0.0275 −2 4.22×10⁵ 4.24×10⁵
30 0.4375 −1 0.4375 −1 0.4375 −1 0.037 −1 4.33×10⁵ 4.24×10⁵
Ann Microbiol

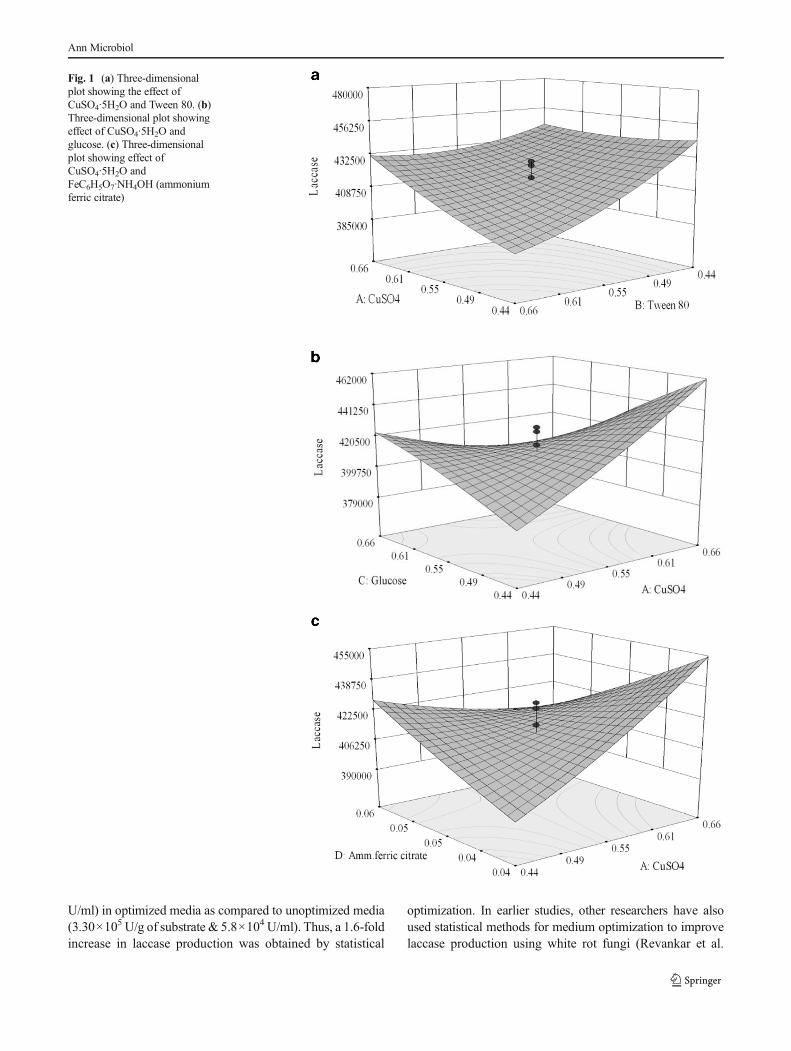
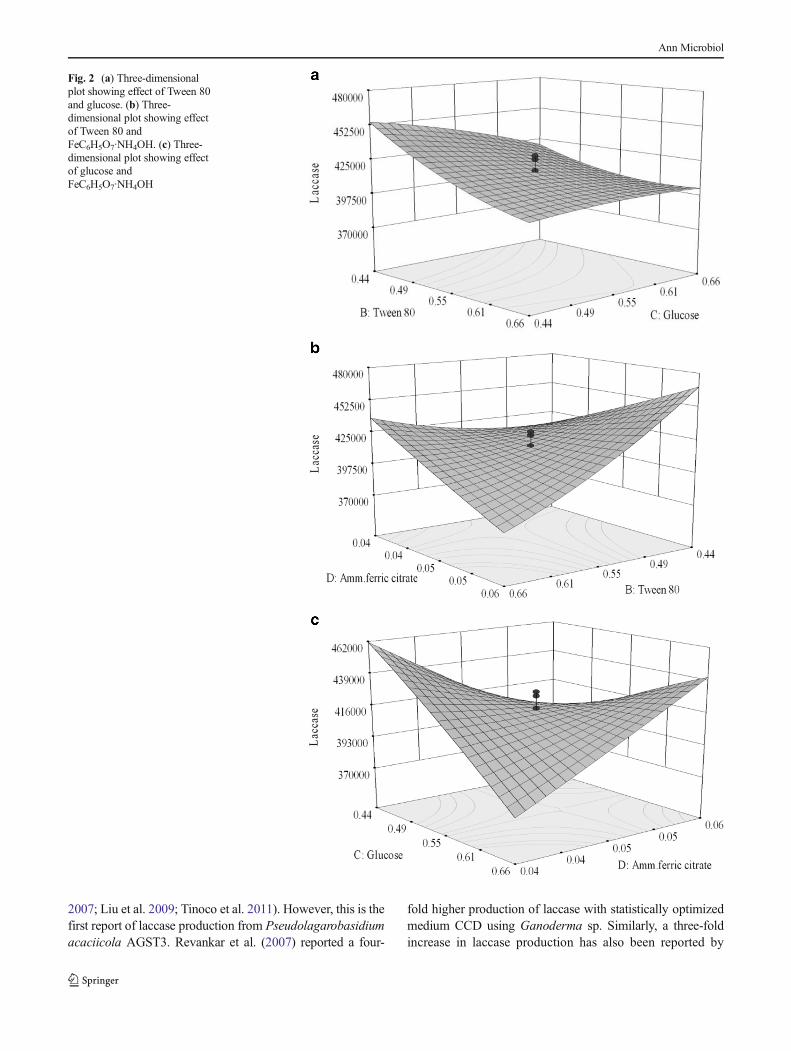
value of the adjusted determination coefficient (AdjR2=0.9699) was also very hig,h reconfirming the significance ofthe model. The lack of fit (0.2699) was found to be notsignificant. This indicates an excellent correlation betweenthe experimental and predicted values of laccase production.The adequate precision value measures signal-to-noise ratio,and a ratio greater than 4.0 is desirable. In the present study,the value of this ratio was higher for laccase production, andsuggested that the polynomial quadratic model can be used tonavigate the design space and further optimization. Three-dimensional (3-D) surface plots were obtained when the dataof laccase production were fed into the design expert software(version 7.0.2, Stat ease Inc., USA). The 3-D surface plotsdemonstrate the response over a region of interesting factorlevels, the relationship between the response and experimentallevels of each variable, and the type of interactions betweenthe test variables in order to assume the optimal compositionof the culture medium. Here, each 3-D surface plot representsthe effect of two medium components at their studied concen-tration range and at fixed concentration of the remaining twomedium components. The value of the remaining two com-ponents was then varied for that situation, using the softwareto determine the optimum values. The interaction betweenCuSO4·5H2O and Tween 80 (Fig. 1a) indicated that laccaseproduction was minimal at lower concentrations ofCuSO4·5H2O and higher concentrations of Tween 80. More-over, at higher concentrations of CuSO4·5H2O, the laccaseproduction increased with decreasing concentrations of tween80. 3-D surface plot (Fig. 1b) shows the effect of glucose andCuSO4·5H2O on laccase production. Lower laccase
production was observed at low concentrations ofCuSO4·5H2O and glucose, while at higher concentrations ofglucose with gradual increase in CuSO4·5H2O concentration,significant increase in laccase production was observed. Thesame trend of results was also observed in the case ofFeC6H5O7·NH4OH and CuSO4·5H2O (Fig. 1c). It is possibleto observe in Fig. 2a that the laccase production was maximalat lower concentrations of both Tween 80 and glucose. Al-though at higher concentrations of glucose, the laccase pro-duction starts to increase with decreasing tween 80 concen-tration. Figure 2b depicts the effect of FeC6H5O7·NH4OH andTween 80 on laccase production. Decreased laccase produc-tion was observed at higher concentrations of both compo-nents, while at lower concentrations of FeC6H5O7·NH4OH,decreasing concentration of tween 80 results in increasedlaccase production. The interaction between glucose andFeC6H5O7·NH4OH (Fig. 2c) indicates that the laccase pro-duction increased at higher concentrations of ammonium fer-ric citrate, with decrease in glucose concentrations. Thus, thepredicted optimal concentrations for the components were asfollows (g/l): CuSO4·5H2O 0.6625, Tween 80 0.6625, glucose0.437, FeC6H5O7·NH4OH0.037. Themodel predicted a valueof 5.31×10⁵ U/g of substrate for laccase production using theabove optimal concentration of variables.
Validation of the model
Model validation was performed (Fig. 3) using statisticallyoptimized media components, and results showed a higherlaccase production of 5.35×10⁵ U/g of substrate (9.55×10⁴
Table 5 Analysis of variance (ANNOVA) for the quadratic model
Source Sum of squares Mean df F Square p value Prob>F
Model 71628298055 14 5116307004 34.5922393 < 0.0001
A-CuSO4·5H2O 2988871204 1 2988871204 20.20827676 0.0004
B-Tween 80 7644512593 1 7644512593 51.68587592 < 0.0001
C-Glucose 1521156038 1 1521156038 10.28479988 0.0059
D-FeC6H5O7·NH4OH 96448522.67 1 96448522.67 0.652105195 0.4320
AB 2218833920 1 2218833920 15.00192109 0.0015
AC 10906147056 1 10906147056 73.7383524 < 0.0001
AD 6892984576 1 6892984576 46.60466461 < 0.0001
BC 1386259056 1 1386259056 9.372737987 0.0079
BD 13358274084 1 13358274084 90.31760867 < 0.0001
CD 22465513225 1 22465513225 151.8932326 < 0.0001
A2 330137795 1 330137795 2.232118909 0.1559
B2 1449064774 1 1449064774 9.79737834 0.0069
C2 243072900.8 1 243072900.8 1.643458054 0.2193
D2 42247895.05 1 42247895.05 0.285645348 0.6009
Residual 2218549785 15 147903319
Lack of Fit 1734457286 10 173445728.6 1.791452346 0.2699
R2 =0.969, Adj R2 =0.941
Ann Microbiol
U/ml) in optimized media as compared to unoptimized media(3.30×10⁵ U/g of substrate & 5.8×10⁴ U/ml). Thus, a 1.6-foldincrease in laccase production was obtained by statistical
optimization. In earlier studies, other researchers have alsoused statistical methods for medium optimization to improvelaccase production using white rot fungi (Revankar et al.
Fig. 1 (a) Three-dimensionalplot showing the effect ofCuSO4·5H2O and Tween 80. (b)Three-dimensional plot showingeffect of CuSO4·5H2O andglucose. (c) Three-dimensionalplot showing effect ofCuSO4·5H2O andFeC6H5O7·NH4OH (ammoniumferric citrate)
Ann Microbiol
2007; Liu et al. 2009; Tinoco et al. 2011). However, this is thefirst report of laccase production from Pseudolagarobasidiumacaciicola AGST3. Revankar et al. (2007) reported a four-
fold higher production of laccase with statistically optimizedmedium CCD using Ganoderma sp. Similarly, a three-foldincrease in laccase production has also been reported by
Fig. 2 (a) Three-dimensionalplot showing effect of Tween 80and glucose. (b) Three-dimensional plot showing effectof Tween 80 andFeC6H5O7·NH4OH. (c) Three-dimensional plot showing effectof glucose andFeC6H5O7·NH4OH
Ann Microbiol

Niladevi et al. (2007). CCD was performed for the productionof laccase from Fusarium incarnatum LD-3, and a 16-timeshigher production of laccase was obtained as compared tounoptimized medium (Chhaya and Gupte 2010). Liu et al.(2009) also reported the application of statistical methods andobtained a 2.5-times higher laccase yield as compared toinitial unoptimized medium using Pleurotus ostreatus strain10969. Zhang et al. (2012) reported 1.87-fold increases inlaccase production by Mycena purpureofusca using PBDfollowed by the RSMmethod. The data obtained corroboratesthe findings of Gao et al. (2013), who reported the optimiza-tion of various parameters of fermentation for the productionof laccase using PBD and RSM. The laccase yield fromTrichoderma harzianum ZF-2 was 59.68-times higher in op-timized media as compared to unoptimized media. Similarly,Niladevi et al. (2009) reported that statistical optimization byRSM resulted in a three-fold increase in laccase production byStreptomyces psammoticus MTCC 7334. Moreover, Mishraet al. (2008) reported maximum laccase production of 163.32U/g of substrate using Coriolus versicolor MTCC138 understatistically optimized media as compared to unoptimizedmedia (65.42 U/g of substrate). Poojary and Mugeraya(2012) also reported that the laccase yield from Phellinusnoxius hpF17 increased up to 780 U/l, an approximately 1.4-
fold improvement in laccase production under optimized me-dia as compared to unoptimized media (545.50 U/l).
In vitro decolorization of dyes by laccase produced in-house
The use of crude enzymes is currently a requirement forapplication in environmental engineering because of the highcost related to the enzyme purification procedure (Yu et al.2006). In the present study, we assessed the potential of crudein-house produced laccase from Pseudolagarobasidiumacaciicola AGST3. Figure 4 shows the time course profileof in vitro dye decolorization of Violet P3P, Green ME4BLand Blue 3R by crude laccase produced in-house. Maximumdecolorization of Violet P3P, GreenME4BL and Blue 3R wasfound to be 96±1.2 %, 76±0.65 % and 85.8±0.91 %, respec-tively, in 24 h. Table 6 depicts the percent decolorization ofdifferent dyes along with their maximum wavelength (λmax).The results indicate that laccase produced in-house decolor-ized structurally different dyes with variable decolorizationefficiencies between 11 and 96% after 24 h of incubation. Thedifference in the decolorization rates of different dyes could bedue to chemical structural differences, electron distribution,and steric factors between the dyes that affect their decolori-zation (Knapp et al. 1995; Levin et al. 2010). There are few
0.00E+00
1.00E+05
2.00E+05
3.00E+05
4.00E+05
5.00E+05
6.00E+05
2 4 6 8 10 12 14 16 18 20
Lac
case
(U
/g)
Incubation time (d)
Unoptimized medium Optimized mediumFig. 3 Time course profile oflaccase production withunoptimized medium andoptimized medium usingPseudolagarobasidiumacaciicola AGST3
0
20
40
60
80
100
120
0 1 2 4 8 12 16 20 24
Dec
olo
riza
tio
n (
%)
Time (h)
Violet P3P Green ME4BL Blue 3RFig. 4 Time course profile ofin vitro dye decolorization bycrudelaccase produced in-house
Ann Microbiol

reports on in vitro dye decolorization using crude laccase, andthe results obtained in the present work are comparable with thepreviously reported work. Roriz et al. (2009) reported 10 %decolorization of Reactive black 5 by crude laccase fromTrametes pubescens in 24 h. Extracellular liquid of Trametestrogiiwas able to decolorize 69%, 14% and 6%of Janus green,Azure B and Poly R-478, respectively (Levin et al. 2010).Similarly, Dhillon et al. (2012) reported that crude laccase fromTrametes versicolor was able to decolorize structurally differentdyes with variable decolorization efficiencies between 31.30
and 87.70 % after a 48 h incubation period. The results obtainedin the present work show that the crude laccase ofPseudolagarobasidium acaciicolaAGST3 was better for decol-orization of different dyes, without addition of any mediator.
Effect of dye concentration on dye decolorization
The decolorization ability of the crude laccase was furtherevaluated by varying the concentration of Violet P3P, GreenME4BL and Blue 3R (100 mg/l–500 mg/l) at a fixed concen-tration of laccase.Maximum decolorization of Violet P3P (97.2±2.2 %), Green ME4BL (80.3±1.8 %) and Blue 3R (91.3±1.5 %) was observed at a concentration of 100 mg/l. Thereduction in decolorization ability was observed with an in-crease in Violet P3P and Blue 3R concentration thereafter(Fig. 5). However, significant reduction in decolorization abil-ity (41.9–28 %) was observed with 400 and 500 mg/l of GreenME4BL. Moreover, the reason for this can be attributed topossible damage of laccase activity at high dye concentrations(Yu et al. 2006). The results obtained indicate that the initialconcentration of laccase used was sufficient for decolorization.
Effect of laccase concentration on dye decolorization
Figure 6 (a), (b) and (c) shows the effect of laccase concentra-tion (1,000–40,000 U/ml) on decolorization of Violet P3P, Blue3R and GreenME4BL (100 mg/l), respectively. Decolorizationof dyes gradually increased with increase in concentration oflaccase, and remained comparable after a threshold activity(10,000 U/ml for Violet P3P and Blue 3R, and 20,000 U/mlfor Green ME4BL). Maximum decolorization of Violet P3Pand Blue 3R was 97.20 % and 91.30 %, respectively, at 10,000U/ml laccase concentrations, whereas 81.59 % decolorizationof Green ME4BL was obtained at 20,000 U/ml of laccase. Theextent of decolorization may depend upon the reaction rate,which is directly related to enzyme activity and property of thedyes (Yu et al. 2006). The lower decolorization at low enzymeconcentration might imply damage to enzyme activity during
Table 6 Different dyes used for decolorization with laccase produced in-house
Dye Maximum wavelength(λmax) in nm
Decolorization (%)after 24 h
Violet P3P 560 96.00±1.20
Blue M4GB 616 52.00±0.80
Green ME4BL 639 76.00±0.65
Blue 3R 577 85.80±0.91
Acid red BN 532 54.60±0.54
Green HE4G 646 58.70±0.38
Acid black 194 564 50.60±0.88
Direct black 22 645 72.52±1.50
Acid green 10H 617 51.50±0.55
Reactive red M5B 538 69.37±0.90
Reactive red C2G 502 42.90±0.75
Brown 18 474 37.70±0.60
Red BS 517 11.00±0.50
Violet 5B 560 12.70±0.45
Reactive red HE8B 559 31.50±0.55
Direct orange 5E 493 29.00±0.85
Direct red 4BS 495 23.43±0.77
Turquoise blue H5G 609 11.32±0.30
Direct red 12B 523 14.43±0.55
Reactive turquoise blue G 623 26.00±0.92
Acid red F2R 510 28.20±1.25
0
20
40
60
80
100
120
100 150 200 250 300 350 400 450 500
Dec
olo
riza
tio
n (
%)
Dye concentration (mg/l)
Violet P3P Blue 3R Green ME4BLFig. 5 Effect of dyeconcentration on in vitro dyedecolorization
Ann Microbiol
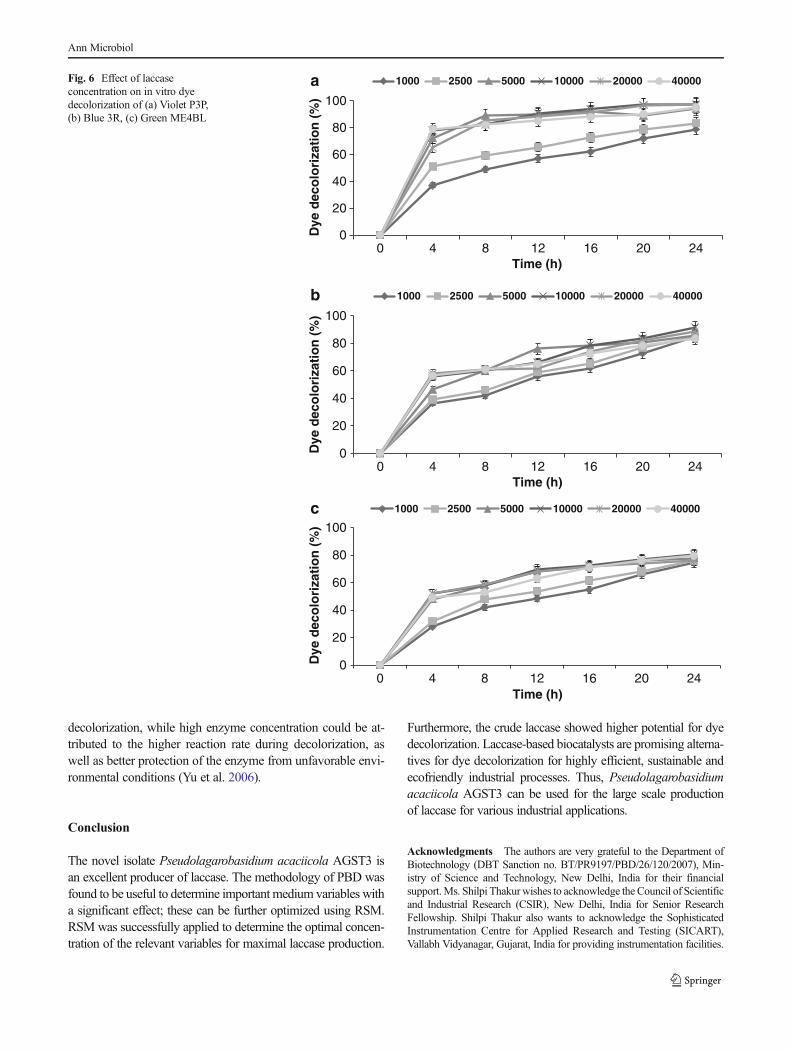
decolorization, while high enzyme concentration could be at-tributed to the higher reaction rate during decolorization, aswell as better protection of the enzyme from unfavorable envi-ronmental conditions (Yu et al. 2006).
Conclusion
The novel isolate Pseudolagarobasidium acaciicola AGST3 isan excellent producer of laccase. The methodology of PBD wasfound to be useful to determine important medium variables witha significant effect; these can be further optimized using RSM.RSMwas successfully applied to determine the optimal concen-tration of the relevant variables for maximal laccase production.
Furthermore, the crude laccase showed higher potential for dyedecolorization. Laccase-based biocatalysts are promising alterna-tives for dye decolorization for highly efficient, sustainable andecofriendly industrial processes. Thus, Pseudolagarobasidiumacaciicola AGST3 can be used for the large scale productionof laccase for various industrial applications.
Acknowledgments The authors are very grateful to the Department ofBiotechnology (DBT Sanction no. BT/PR9197/PBD/26/120/2007), Min-istry of Science and Technology, New Delhi, India for their financialsupport.Ms. Shilpi Thakurwishes to acknowledge the Council of Scientificand Industrial Research (CSIR), New Delhi, India for Senior ResearchFellowship. Shilpi Thakur also wants to acknowledge the SophisticatedInstrumentation Centre for Applied Research and Testing (SICART),Vallabh Vidyanagar, Gujarat, India for providing instrumentation facilities.
0
20
40
60
80
100
0 4 8 12 16 20 24
Dye
dec
olo
riza
tio
n (
%)
Time (h)
1000 2500 5000 10000 20000 40000a
b
c
0
20
40
60
80
100
0 4 8 12 16 20 24
Dye
dec
olo
riza
tio
n (
%)
Time (h)
1000 2500 5000 10000 20000 40000
0
20
40
60
80
100
0 4 8 12 16 20 24
Dye
dec
olo
riza
tio
n (
%)
Time (h)
1000 2500 5000 10000 20000 40000
Fig. 6 Effect of laccaseconcentration on in vitro dyedecolorization of (a) Violet P3P,(b) Blue 3R, (c) Green ME4BL
Ann Microbiol
References
Abou-Mansouri E, Polier J, Pezet R, Tabacch R (2009) Purification andpartial characterisation of a 60 KDa laccase from Fomitiporiamediterranea. Phytopathol Mediterr 48:447–453
Asther M, Lesage L, Drapron R, Corrieu G, Odier E (1988) Phospholipidand fatty acid enhancement of Phanerochaete chrysoporium INA –12 in relation to ligninase production. Appl Microbiol Biotechnol27:393–398
Cerrone F, Barghini P, Pesciaroli C, FeniceM (2011) Efficient removal ofpollutants from olive washing waste water in bubble-column biore-actor by Trametes versicolor. Chemosphere 84:254–259
Chhaya U, Gupte A (2010) Optimization of media components forlaccase production by litter dwelling fungal isolate Fusariumincarnatum LD3. J Basic Microbiol 50:43–51
DhillonGS, Kaur S, Brar SK (2012) In-vitro decolorization of recalcitrantdyes through an ecofriendly approach using laccase from Trametesversicolor grown on brewer’s spent grain. Int Biodeterior Biodegrad72:67–75
Fu K, Fu S, Zhan H, Zhou P, Liu M, Liu H (2013) A newly isolatedwood-rot fungus for laccase production in submerged cultures.Bioresour 8:1385–1397
Gao H,Wang Y, ZhangW,WangW,MuZ (2011) Isolation, identificationand application in lignin degradation of ascomycetes GHJ-4. Afr JBiotechnol 10:4166–4174
Gao H, Chu X, Wang Y, Zhou F, Zhao K, Mu Z, Liu Q (2013) MediaOptimization of Trichoderma harzianum ZF-2 for LaccaseProduction by using Response Surface Methodology. J MicrobiolBiotechnol 23:1757–1764
Joshi M, Patel H, Gupte S, Gupte A (2012) Nutrient improvement forsimultaneous production of exopolysaccharide and mycelial biomassby submerged cultivation of Schizophyllum communeAGMJ-1 usingstatistical optimization. 3 Biotech. doi:10.1007/s13205-012-0103-3
Knapp JS, Newby PS, Reece LP (1995) Decolorization of dyes by wood-rotting basidiomycete fungi. Enzym Microb Technol 17:664–668
Levin L, Melignani E, Ramos AM (2010) Effect of nitrogen sources andvitamins on ligninolytic enzyme production by some white-rotfungi. Dye decolorization by selected culture filtrates. BioresourTechnol 101:4554–4563
Liu L, Lin Z, Zheng T, Lin L, Zheng C, Lin Z, Wang S, Wang Z (2009)Fermentation optimization and characterization of the laccase fromPleurotus ostreatus strain 10969. EnzymMicrob Technol 44:426–433
Mishra A, Kumar S, Kumar S (2008) Application of Box-Benhkenexperimental design for optimization of laccase production by
Coriolus versicolor MTCC138 in solid state fermentation. J SciInd Res 67:1098–1107
Niku-Paavola ML, Raaska L, Itavaara M (1990) Detection of white rotfungi by a non-toxic stain. Mycol Res 94:27–31
Niladevi KN, Prema P, Sukumaran RK (2007) Utilization of rice straw forlaccase production by Streptomyces psammoticus in solid statefermentation. J Ind Microbiol Biotechnol 34:665–674
Niladevi KN, Sukumaran RK, Jacob N, Anisha GS, Prema P (2009)Optimization of laccase production from a novel strain-Streptomyces psammoticus using response surface methodology.Microbiol Res 164:105–113
Patel H, Gupte A, Gupte S (2009) Effect of different culture conditionsand inducers on production of laccase by a Basidiomycete fungalisolate Pleurotus ostreatus HP-1 under solid state fermentation.Bioresour 4:268–284
Plackett RL, Burman JP (1946) The design of optimum multifactorialexperiments. Biometrika 33:305–325
Poojary H, Mugeraya G (2012) Laccase Production by Phellinus noxiushpF17: Optimization of Submerged Culture Conditions byResponse Surface Methodology. Res Biotechnol 3:9–20
Revankar MS, Desai KM, Lele SS (2007) Solid-state fermentation forenhanced production of laccase using indigenously isolatedGanoderma sp. Appl Biochem Biotechnol 143:16–26
Roriz MS, Osma JF, Teixeira JA, Couto SR (2009) Application ofresponse surface methodological approach to optimize ReactiveBlack 5 decolouration by crude laccase from Trametes pubescens.J Hazard Mater 169:691–696
Thakur S, Patel H, Gupte S, Gupte A (2012) Laccase: The Biocatalystwith Industrial and Biotechnological Applications. In:Satyanarayana T, Johri BN, Prakash A (eds) Microbes inEnvironmental Management and Technology. Springer, New York,pp 309–342
Tinoco R, Acevedo A, Galindo E, Carreon LS (2011) IncreasingPleurotus ostreatus laccase production by culture medium optimi-zation and copper/lignin synergistic induction. J Ind MicrobiolBiotechnol 38:531–540
Viswanath B, Chandra MS, Pallavi H, Reddy BR (2008) Screening andassessment of laccase producing fungi from different environmentalsamples. Afr J Biotechnol 7:1129–1133
Yu G,Wen X, Li R, Yi Q (2006) In vitro degradation of a reactive azo dyeby crude ligninolytic enzymes from non immersed liquid culture ofPhanerochaete chrysosporium. Process Biochem 41:1987–1993
Zhang Y, Sun S, Hu K, Lin X (2012) Improving production of laccasefrom novel basidiomycete with response surface methodology. Afr JBiotechnol 11:7009–7015
Ann Microbiol