Optimization and Balance Sourcing Supply Chain Case … · Optimization and Balance Sourcing Supply...
24
Optimization and Balance Sourcing Supply Chain Case Study on Evaluation on Vietnamese Footwear Industry Robert Hiley Vice President, Asia Product Supply - Timberland Footwear,
-
Upload
hoangkhanh -
Category
Documents
-
view
216 -
download
2
Transcript of Optimization and Balance Sourcing Supply Chain Case … · Optimization and Balance Sourcing Supply...

Optimization and Balance Sourcing Supply Chain
Case Study on Evaluation on Vietnamese Footwear Industry
Robert Hiley
Vice President, Asia Product Supply - Timberland Footwear,

AS
IA
What external factors will drive change for Supply Chain?

What external factors will drive change for Supply Chain?
Global Economics
• Currency Fluctuations
• Political Disruption
• Big Data
• Global Terrorism
• Trade Agreements
• New US Administration
• Commodity Costs
• A Maturing China
• An Emerging Africa

What Drives Sourcing Decisions?
• Factory Capability
• Factory Partnerships
• Supply Chain Consolidation
• Political Stability
• Footwear / Material Infrastructure
• Productivity Levels
• Lead Times / Speed to Market
• Trade Agreements
• Corporate Social Responsibility / Responsible Sourcing
• Costs

Timberland Footwear – Sourcing Footprint
Bangladesh: 26%
Cambodia: 13%
China: 13%
Vietnam: 26%
Philippines: 6%
Dominican Republic: 16%
* by volume
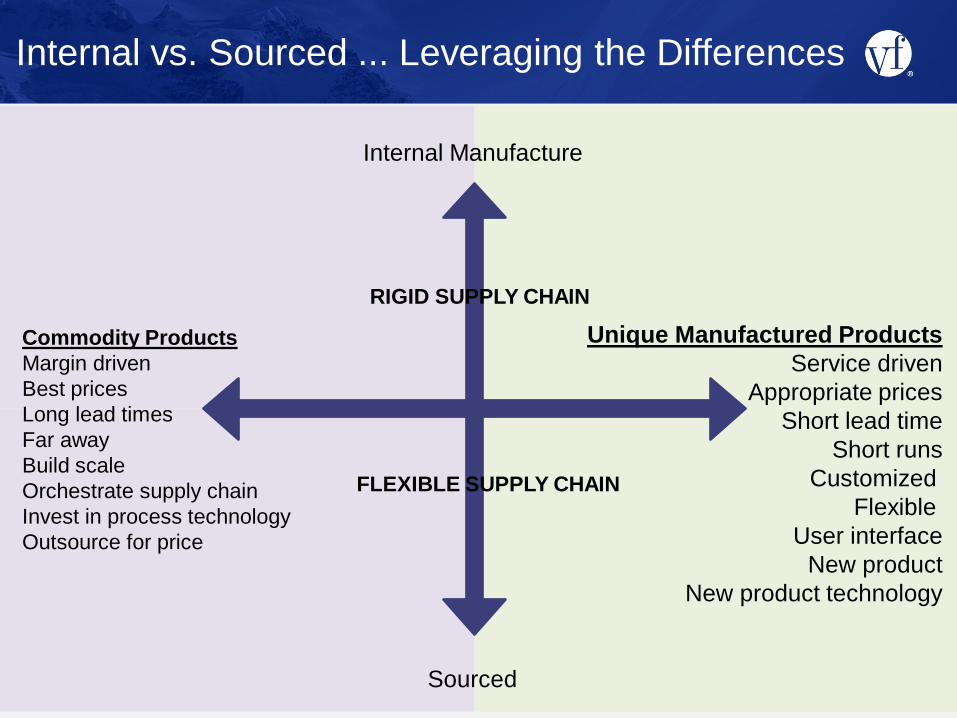
Internal vs. Sourced ... Leveraging the Differences
Sourced
Commodity Products
Margin driven
Best prices
Long lead times
Far away
Build scale
Orchestrate supply chain
Invest in process technology
Outsource for price
Unique Manufactured Products
Service driven
Appropriate prices
Short lead time
Short runs
Customized
Flexible
User interface
New product
New product technology
Internal Manufacture
RIGID SUPPLY CHAIN
FLEXIBLE SUPPLY CHAIN

Innovation and Automation
• Design to Manufacture
• Reduce Complexity
• Automation
• Product / Material Innovation
• Labor & Skill Reduction
• Production Efficiency
• Zero Waste

The Effect of Globalization on Design and Development
Offshore Design Development/
Sample Room Asia Production

What is the Landed Cost of a Shoe?
Factory FOB
$25 Shipping
$1
Insurance
$0.3 Customs/Duty
$2.5
Landed Cost
$28.8
Material $17.5 (~70%) Labor
$3.75
(~15%)
Overhead
$2.25
(~9%)
Profit
$1.5
(~6%)
FOB
Components
&
Split

Country Analysis
• Established footwear industry
• Materials infrastructure
• Stable workforce / Strong work ethics
• Low labor cost and high productivity
• Duty-friendly into the EU
• Political stability
• Availability of labor / Population size
• Rising labor costs / Rapid industrial growth
• Shallow talent pool / limited footwear skills
• Labor disputes
• Poor infrastructure
• Anticipation of Trade Agreement VIE
TN
AM
PROS CONS
• Established footwear Industry
• Footwear materials infrastructure
• Footwear expertize
• High productivity
• Politically stable
• Capacity and access to domestic market
• Rising labor costs
• Lack of investment
• High worker turnover
• Lack of footwear training
• No trade free agreements CH
INA
• Low labor costs
• Duty free into the EU/Canada
• Worker stability
• Footwear and leather training / Education
• Politically stable
• Political instability
• Terrorism
• Factory compliance
• Poor infrastructure
• Logistics and lead time
• Limited materials infrastructure
BA
NG
LA
DE
SH

Country Analysis
• Competitive labor rates
• Availability of labor / Population size
• Worker stability
• Duty-friendly into the EU
• Established footwear industry
• Worker stability
• Lack of footwear training
• Difficult labor laws
• Longer lead time
• Poor infrastructure
• Shallow footwear talent pool
• Raw material supply chain IND
ON
ES
IA
PROS CONS
• Worker stability
• Low labor rates
• Established footwear industry
• Politically stable
• Footwear and leather training
• Availability of labor/ Population size
• Poor infrastructure
• Limited good factory options
• Factory CSR compliance
• Limited footwear materials & components
• Labor unions
• Poor productivity
IND
IA
• Worker stability
• Availability of labor / Population size
• Lead time
• Footwear expertize
• Duty free into the EU
• Competitive labor rates
• Limited good factory options
• Poor infrastructure
• Raw material supply chain
• Political instability
• High logistics cost
• Low productivity PH
ILIP
PIN
ES
• Trade Agreements – Duty Free into the EU/ Canada/Japan
• Low worker turnover
• Limited industry
• Worker stability
• Small population / workforce
• Labor Disputes
• Unions
• Low productivity
• Political instability CA
MB
OD
IA
• Large labor pool
• Government
• Trade Agreements – Duty Free into the EU/ Japan
• Government support of the industry
• Limited industry
• Political instability
• Lead time
• Relatively high labor rates for a developing economy
• Low Productivity
• Poor infrastructure MY
AN
MA
R
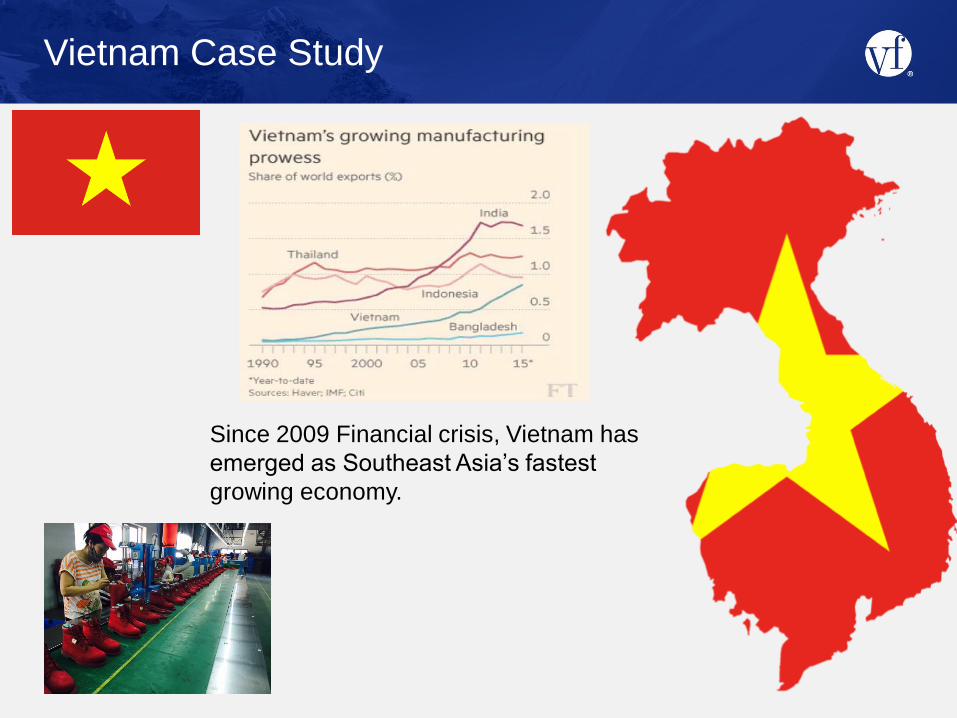
Vietnam Case Study
Since 2009 Financial crisis, Vietnam has
emerged as Southeast Asia’s fastest
growing economy.

Vietnam vs. China
Population Employed
Person GDP per
Capita Minimum
Wage Wages in
Manufacturing Inflation
2016
95 million 54 million USD2,111 USD145 USD240 >5%
1.3 billion 774 million USD7,925 USD320 USD700 2.32%

Vietnam Population
Source: Ministry of Health, Health Statistical Yearbook 2000
• The current population of Vietnam is estimated at 95,105,502 according United
Nations estimates.
• 34.7 % of the population is urban (33,121,357 people in 2017)
• The median age in Vietnam is 30.8 years.
• The population is growing at an average rate of approx.1% per year.
• As a result of immigration the population is expected to fall.

Vietnam - Inflation
Inflation:
2008 record high at 28%
2015 average below 1%
2016 average below 5%
2017 above 5% in Jan & Feb
Minimum Wage Inflation:
Wage growth has declined from 15.2% in 2014 to 7.3% in 2017
1 USD = 22,500 VND
0 ₫
500,000 ₫
1,000,000 ₫
1,500,000 ₫
2,000,000 ₫
2,500,000 ₫
3,000,000 ₫
3,500,000 ₫
4,000,000 ₫
2013 2014 2015 2016 2017
Minimum Wages in Vietnam
Region 1 Region 2 Region 3 Region 4
↑ 15.2%
↑ 14.3% ↑ 12.5% ↑ 7.3%
http://www.tradingeconomics.com/vietnam/inflation-cpi
http://www.wageindicator.org/main/salary/minimum-wage/vietnam
Region 1: cities and provinces with highest living cost
Region 2: next tier cities and provinces
Region 3: cites and provinces under development, still
need support to develop manufacturing
Region 4: remote cities and provinces that heavily need
support to provide jobs and improve the living
standard of its residents

Total Footwear Export Turnover in Vietnam
* Vietnam Leather and Footwear Association
Country 2016 Turnover in USD
2015 Turnover in USD
2016 vs. 2015
USA $ 4,483,340,500 35.0% $ 4,077,096,419 34.4% 9.96%
China $ 904,927,071 7.1% $ 754,185,864 6.4% 19.99%
Belgium $ 825,444,140 6.4% $ 723,555,968 6.1% 14.08%
Germany $ 764,676,582 6.0% $ 705,549,900 6.0% 8.38%
Japan $ 674,814,835 5.3% $ 597,579,005 5.0% 12.92%
UK $ 618,375,518 4.8% $ 693,587,418 5.9% -10.84%
The Netherlands $ 595,148,795 4.6% $ 533,738,850 4.5% 11.51%
Other Countries $ 3,960,371,064 30.9% $ 3,760,478,387 31.7% 5.32%
$ 12,827,098,505 $ 11,845,771,811

Vietnam – Footwear Industry
• 2016
• Total footwear exports in 2016 :
• Textile footwear : 46.7%
• Leather footwear : 33.3%
• Other Materials : 20%
• Foreign Direct Investment (FDI)
• 81%, mainly Taiwanese and Korean companies.
• FDI increased around 3% year on year in 2014-2016
• In 2016, the footwear sector in Vietnam grew only 8.2%, against a targeted 10% growth.
• This as mainly due to political uncertainty, particularly around the British separation from
the EU (BREXIT).
• Korean and Taiwanese manufacturers are starting to move production offshore
to Myanmar and Bangladesh.

Vietnam – Footwear Industry
2017 Forecast
• In 2017, production is expected to grow by 5% and export turnover is expected
to grow by 10% reaching US $18 billion in value
• China continues to advocate cutting investment incentives in the textile and
footwear sectors to focus on industries that have higher technology and value
add.
• Vietnam will be the main beneficiary of footwear moving out from China.
• Exports of FDI enterprises are expected to increase as enterprises continue to
expand their existing plant capacity and build new plants in Vietnam in
anticipation of the opportunities to reduce tariffs from trade agreements such
as EVFTA. In light of the recent European Union-Vietnam Free Trade
Agreement (EVFTA) for the EU markets about 80.3% of footwear tariff duties
will reduce to 0% when the FTA comes into effect, which is expected for early
2018. About 4.7% come to reduce to 0% after 3 years and the remaining will
be completed after 5-7 years.

Vietnam – Footwear Industry
Expected Challenge
• The Vietnam Leather and Footwear Association notes that the rapid
development of the leather and footwear manufacture in the country has
created concerns related to the environment, especially the production of
leather tanning and fabrics for shoes. More focus on this area from
governmental environmental agencies is expected going forward.
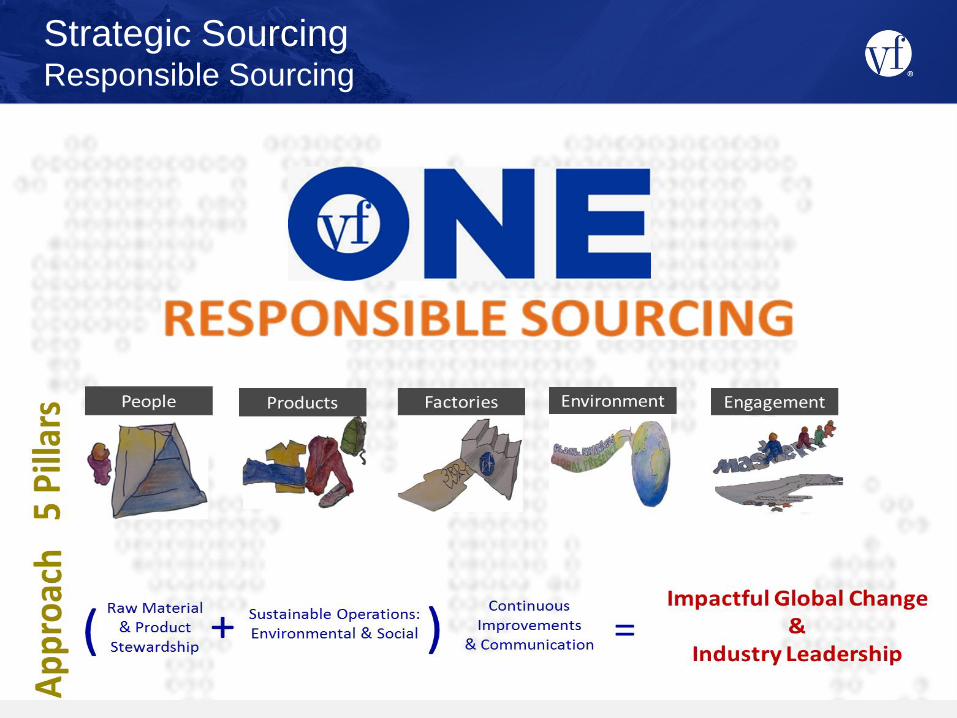
Strategic Sourcing Responsible Sourcing

Sustainable and Responsible Sourcing – Why it Matters.
https://undark.org/article/leather-tanning-bangladesh-india/
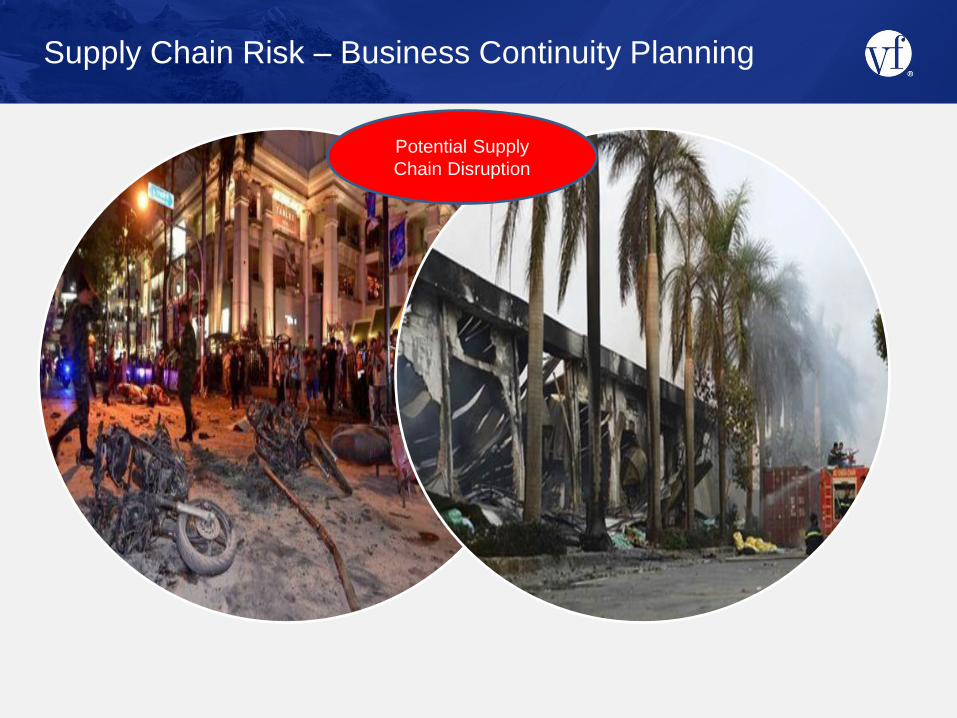
Supply Chain Risk – Business Continuity Planning
Potential Supply
Chain Disruption

Activity up, down and across the supply chain
Strategy
Plans
Urgency
Business survival
Document Set

Thank you for Listening!


![10 GSM BSS Network KPI (Uplink-Downlink Balance) Optimization Manual[1].Doc](https://static.fdocuments.in/doc/165x107/53f87678dab5ca0a678b4eda/10-gsm-bss-network-kpi-uplink-downlink-balance-optimization-manual1doc-558444c3ef615.jpg)