OPTIMISING THE NUMBER AND POSITION OF RECLOSERS ON A ...
97
OPTIMISING THE NUMBER AND POSITION OF RECLOSERS ON A MEDIUM VOLTAGE DISTRIBUTION LINE TO MINIMISE DAMAGE ON EQUIPMENT by Rinu Susan Mathew Thomas Submitted in partial fulfilment of the requirements for the degree Master of Engineering (Electrical Engineering) in the Department of Electrical, Electronic and Computer Engineering Faculty of Engineering, Built Environment and Information Technology UNIVERSITY OF PRETORIA 31 August 2014
Transcript of OPTIMISING THE NUMBER AND POSITION OF RECLOSERS ON A ...

OPTIMISING THE NUMBER AND POSITION OF RECLOSERS ON A MEDIUM
VOLTAGE DISTRIBUTION LINE TO MINIMISE DAMAGE ON EQUIPMENT
by
Rinu Susan Mathew Thomas
Submitted in partial fulfilment of the requirements for the degree
Master of Engineering (Electrical Engineering)
in the
Department of Electrical, Electronic and Computer Engineering
Faculty of Engineering, Built Environment and Information Technology
UNIVERSITY OF PRETORIA
31 August 2014

ACKNOWLEDGEMENTS
I am grateful to my supervisors, colleagues and family for their encouragement and support
without which I could not have completed this thesis.
I would like to express my gratitude to my dissertation supervisor, Dr. R. Naidoo and co-
supervisors Professor R. Bansal and Stuart van Zyl for their guidance and support.
A special note of appreciation goes to my colleagues, Anura Perera, for the technical
assistance provided and Paul Keller, for the mentorship and inspiration he has provided.
I would like to thank my parents and my husband, Rinesh for their continuous patience,
love and support.
Rinu Thomas
August 2014

SUMMARY
OPTIMISING THE NUMBER AND POSITION OF RECLOSERS ON A MEDIUM
VOLTAGE DISTRIBUTION LINE TO MINIMISE DAMAGE ON EQUIPMENT
by
Rinu Susan Mathew Thomas
Supervisor: Dr R. Naidoo
Co-supervisor: Prof. R. Bansal
Department: Electrical, Electronic and Computer Engineering
University: University of Pretoria
Degree: Master of Engineering (Electrical Engineering)
Keywords: Recloser, damage factor, customer outage, kVA outage, investment
costs, genetic algorithm, optimisation, reliability
The optimal placement of reclosers on overhead lines in a medium voltage distribution
network is known to improve the reliability of a power system. Traditionally, recloser
placement studies have not considered the effect of greater numbers of reclosers on
network damage during faults or the effect of positioning on protection settings. Recloser
positions that enhance the reliability of the system may not necessarily improve other
problematic operational aspects, such as the damage to equipment and the risk of incorrect
tripping due to the sudden increase in loading.
This research seeks to prove the hypothesis that:
Recloser placement studies with the additional consideration of protection-
related factors such as equipment damage and the risk of false tripping will
result in different recloser positions compared to when the priority is only on
improving reliability indices and cost.
A tool is developed to assess the reliability indices, cost, damage and the risk of false
tripping and it determines the best recloser positioning based on the priority given to each
factor considered. Using this tool, observations are made on the effect of the added factors
of damage and the risk of false tripping on recloser positioning.

The addition of the protection-related factors to the objective function is unique in its
ability to realise the value of recloser positions that cater for minimizing the damage factor
and the possibility of tripping on load. In the absence of these factors, the value of certain
recloser positions would not be identified as they would not improve reliability or cost
factors. The importance of reliability and cost are not overruled by the addition of the
protection-related factors.
The consideration of protection-related factors in the planning process of optimising
recloser placement ensures that the protection of the overhead line is optimal and is not
compromised in any way. This would inherently have a positive effect on the lifespan of
the equipment on the feeder and the reliability of the feeder in the long-term.

OPSOMMING
DIE OPTIMALISERING VAN DIE POSISIE EN DIE AANTAL HERSLUITERS
OP ’N MEDIUMSPANNNING-DISTRIBUSIEVOERDER OM DIE SKADE AAN
TOERUSTING TE VERMINDER.
deur
Rinu Susan Mathew Thomas
Studieleier: Dr R. Naidoo
Mede-studieleier: Prof. R. Bansal
Departement: Elektries, Elektronies en Rekenaaringenieurswese
Universiteit: Universiteit van Pretoria
Graad: Magister in Ingenieurswese (Elektriese Ingenieurswese)
Sleutelwoorde: Hersluiter, beskadigingsfaktor, kliënte-onderbreking, kVA-
onderbreking, beleggingskoste, genetiese algoritme, optimalisering,
betroubaarheid, doelfunskie
Dit is bekend dat die optimale plasing van hersluiters op mediumspanning-oorhoofse
distribusievoerders die betroubaarheid van die netwerk verbeter. Normaalweg word die
effek van ’n groter aantal hersluiters op die beskadiging van die netwerk gedurende foute
nie in ag geneem nie. Die effek van die plasing van hersluiters op die
beveiligingsverstellings word ook nie in ag geneem nie. Hersluiterposisies wat die
betroubaarheid van die netwerk verbeter, sal nie noodwendig ander probleme, soos
beskadiging van toerusting en ’n verkeerde breker wat klink as gevolg van ’n hoë las, op
die netwerk verbeter nie.
Hierdie navorsing poog om die volgende hipotese te bewys:
Wanneer addisionele beveiligingsfaktore, soos die beskadiging van toerusting
en die klinkrisiko in ag geneem word tydens hersluiter-plasingstudies, sal dit
ander posisies aanwys as wanneer die prioriteit slegs is om die koste en
betroubaarheidsindekse te verbeter.

’n Sagteware toepassing is ontwikkel om die betroubaarheidsindekse, koste, skade en die
risiko van ’n klink te evalueer. Die toepassing voorsien dan die beste hersluiterposisie,
gebaseer op die gewig, toegeken aan elkeen van die voorafgaande faktore. Deur van dié
toepassing gebruik te maak, kan waarnemings gemaak word van die effek wat die
addisionele faktore op die skade aan toerusting en die klinkrisiko het.
Deur die beveiligingsfaktore in die doelfunksie by te sit, word unieke waardes geheg aan
die resultate in hul vermoë om die beskadigingsfaktor en die risiko van ’n las-klink te
verminder. Wanneer die beveiligingsfaktore nie in ag geneem word nie, sal sekere posisies
nie geïdentifiseer word nie, omdat dit nie die betroubaarheid en kostefaktore verbeter nie.
Die belangrikheid van die betroubaarheid en kostefaktore word nie deur die byvoeging van
die beveiligingsfaktore uitgeskakel nie.
Die inagneming van die beskermingsgeoriënteerde faktore in die beplanningsproses van
die optimalisering van die hersluiterplasings verseker dat die beskerming van ’n oorhoofse
voerder optimaal is en nie in enige mate in gedrang is nie. Inherent sal dit dus nie net die
lewensduur van die toerusting verbeter nie, maar ook oor ’n lang tydperk die
betroubaarheid daarvan.

LIST OF ABBREVIATIONS
kVA kilo Volt-Ampere
MAIFI Momentary Average Interruption Frequency Index
MV Medium Voltage
NERSA National Energy Regulator of South Africa
NI Normal Inverse
RSLI Reticulation Supply Loss Index
SAIDI System Average Interruption Duration Index
SAIFI System Average Interruption Frequency Index

LIST OF FIGURES
Figure 3.1. Normal Inverse and Definite Time Characteristic
Figure 3.2. An illustration of the furthest reach
Figure 3.3. A sample feeder
Figure 3.4. Case A: Application of a high-set
Figure 3.5. Case B: Application of a high-set
Figure 4.1. Illustration of the direct coverage of reclosers
Figure 4.2. Furthest reach illustration with one recloser
Figure 4.3. Furthest reach illustration with two reclosers
Figure 4.4. Furthest reach illustration with four reclosers
Figure 5.1. Illustration of crossover
Figure 5.2. The operation of the genetic algorithm
Figure 6.1. The selection of the conductor type for the backbone and the branches
Figure 6.2. Display of where the user must enter the maximum number of reclosers to
be considered
Figure 6.3. The figure shows the naming convention of loads on a feeder
Figure 6.4. Flowchart of selection of random recloser positions
Figure 6.5. Flowchart of methodology used to obtain the optimal placement of reclosers
Figure 7.1. Hypothetical network
Figure 7.2. Division of network into zones
Figure 7.3. Network diagram of Fairfield Moloto Feeder

LIST OF TABLES
Table 2.1. Summary of recloser placement studies
Table 3.1. Summary of overcurrent elements on a recloser
Table 7.1. The positions of loads on a feeder
Table 7.2. The solution set of recloser positions
Table 7.3. The optimal recloser positions for varied number of reclosers
Table 7.4. The solution set of recloser positions
Table 7.5. The optimal recloser positions for varied number of reclosers
Table 7.6. The objective function values for varied number of reclosers
Table 7.7. The best solution set of recloser positions
Table 7.8. Fault levels at the load points on the network
Table 7.9. Selected recloser positions for unit weighting on each factor
Table 7.10. Selected recloser positions for damage having twice the weighting in
comparison to all other factors in the objective function
Table 7.11. Selected recloser positions for unit weighting on each factor
Table 7.12. Comparison of objective function values for various cases

TABLE OF CONTENTS
CHAPTER 1 INTRODUCTION ....................................................................... 1
1.1 PROBLEM STATEMENT ...................................................................................... 1
1.1.1 Context of the problem .................................................................................. 1
1.1.2 Research gap .................................................................................................. 3
1.2 RESEARCH OBJECTIVE AND QUESTIONS ...................................................... 4
1.3 HYPOTHESIS AND APPROACH ......................................................................... 4
1.4 RESEARCH GOALS ............................................................................................... 6
1.5 RESEARCH CONTRIBUTION .............................................................................. 6
1.6 OVERVIEW OF STUDY ........................................................................................ 6
CHAPTER 2 LITERATURE STUDY .............................................................. 8
2.1 CHAPTER OBJECTIVES ....................................................................................... 8
2.2 OPTIMISATION METHODS ................................................................................. 8
2.2.1 Simulated annealing ....................................................................................... 8
2.2.2 Modified drop heuristic................................................................................ 10
2.2.3 kVA.km method ........................................................................................... 10
2.2.4 Back parse method ....................................................................................... 11
2.2.5 Tabu search .................................................................................................. 11
2.2.6 Genetic algorithms ....................................................................................... 12
2.2.7 Overview of optimisation methods .............................................................. 13
2.3 OPTIMISATION OF RECLOSER PLACEMENT ............................................... 13
2.3.1 Reliability ..................................................................................................... 13
2.3.2 Cost .............................................................................................................. 16
2.3.3 Co-ordination between the reclosers ............................................................ 16
2.4 DISTRIBUTION FEEDER PROTECTION .......................................................... 20
2.4.1 Protection of MV distribution feeders ......................................................... 20
2.4.2 The impact of ineffective protection settings ............................................... 20
2.5 SOFTWARE IMPLEMENTATION ...................................................................... 22
2.6 CHAPTER IN PERPECTIVE ................................................................................ 23
CHAPTER 3 PROTECTION SETTINGS PHILOSOPHIES ...................... 24
3.1 RECLOSER SETTING PARAMETERS .............................................................. 24
3.2 DELAYED PROTECTION SETTINGS ............................................................... 26

3.3 INSTANTANEOUS PROTECTION SETTINGS ................................................. 29
3.4 AUTO-RECLOSE PHILOSOPHY ........................................................................ 31
3.5 CHAPTER IN PERSPECTIVE ............................................................................. 31
CHAPTER 4 THE MODIFIED OBJECTIVE FUNCTION ......................... 33
4.1 DAMAGE FACTOR .............................................................................................. 33
4.2 RECLOSER PICKUP LIMITS .............................................................................. 36
4.3 RECLOSER INVESTMENT COSTS ................................................................... 39
4.4 RISK TO CUSTOMERS ....................................................................................... 39
4.4.1 Impact on SAIFI .......................................................................................... 40
4.4.2 Impact on SAIDI .......................................................................................... 41
4.5 RISK TO LOADS .................................................................................................. 41
4.6 OBJECTIVE FUNCTION ..................................................................................... 42
4.7 CHAPTER IN PERSPECTIVE ............................................................................. 43
CHAPTER 5 APPLICATION OF A GENETIC ALGORITHM TO
RECLOSER POSITIONING OPTIMISATION .................... 44
5.1 THEORY ................................................................................................................ 44
5.2 THE APPLICATION TO RECLOSER POSITION OPTIMISATION ................ 46
5.3 CHAPTER IN PERSPECTIVE ............................................................................. 48
CHAPTER 6 INTEGRATION OF TOOL ..................................................... 49
6.1 NETWORK MODEL ............................................................................................. 49
6.2 ALLOCATION OF LOAD TO TERMINALS ...................................................... 52
6.3 DIVISION OF NETWORK INTO ZONES ........................................................... 53
6.4 RANDOM ALLOCATION OF RECLOSERS ...................................................... 53
6.5 SIMULATION MODEL ........................................................................................ 54
6.6 CHAPTER IN PERSPECTIVE ............................................................................. 56
CHAPTER 7 APPLICATION OF OPTIMISATION TOOL ....................... 58
7.1 VALIDATION MODEL ........................................................................................ 58
7.2 VALIDATION OF ALGORITHM ........................................................................ 60
7.2.1 Results of algorithm with high priority on cost ........................................... 60
7.2.2 Results of algorithm with high priority on load outages.............................. 61
7.2.3 Results of algorithm with high priority on customer outages ...................... 63
7.2.4 Results of algorithm with high priority on damage factor ........................... 64

7.2.5 Results of algorithm with high priority on recloser pickup limits ............... 66
7.2.6 Results of algorithm with mixed weighting factors ..................................... 68
7.3 APPLICATION OF TOOL ON REAL FEEDER .................................................. 70
7.4 CHAPTER IN PERSPECTIVE ............................................................................. 72
CHAPTER 8 CONCLUSION .......................................................................... 73
8.1 RESEARCH QUESTIONS ANSWERED ............................................................. 73
8.2 ASSESSING THE HYPOTHESIS ........................................................................ 75
8.3 OPTIMISATION OF RECLOSER PLACEMENT ............................................... 76
8.4 SCOPE FOR FURTHER RESEARCH .................................................................. 76
8.5 CONCLUSION ...................................................................................................... 76

CHAPTER 1 INTRODUCTION
1.1 PROBLEM STATEMENT
1.1.1 Context of the problem
There are approximately 305500 km of overhead MV distribution networks in South
Africa [1]. The National Energy Regulator of South Africa (NERSA) has increasingly
been driving emphasis on the improvement of network reliability [2]. This has driven
significant investment in reclosers. In the South African context, specifically within
Eskom, the urgency of improving network reliability has led to a large number of
additional reclosers being installed, with up to ten having been installed on some overhead
lines, also known as feeders. The term recloser has been substituted for automatic circuit
recloser for simplicity. A recloser automatically interrupts and recloses an alternating
current circuit and it locks out after a predefined sequence of opening and reclosing [3]. A
recloser is equipped with non-directional overcurrent, earth fault and sensitive earth fault
protection, which is used to protect the feeder. Reclosers are frequently used in preference
to fuses because fuses blow to isolate transient and permanent faults and need to be
replaced manually to restore supply. Reclosers restore the network automatically if the
fault is transient and only require manual restoration for permanent faults [4].
Although there has been increased investment in reclosers due to the focus on
improvement of network reliability indices, the primary purpose of protection on reclosers
in a power system is to detect abnormal conditions, locate the position of faults and
promptly remove the faulty equipment from service. Both network reliability and
protection of the network are dependent on the number and placement of reclosers. In the
planning stages of recloser placement, the drive to improve reliability should therefore not
compromise the protection of the network.
An increase in the number of reclosers minimises the customer interruption costs and
improves the network reliability [5]. This is achieved by isolating the downstream section
of the faulted network, which would reduce the impact of a fault on the rest of network.

Chapter 1 Introduction
Department of Electrical, Electronic and Computer Engineering 2
University of Pretoria
The number of customers, the kVA base and the length of line are important considerations
during the planning of a recloser installation so as to optimise return on investment [6]. A
number of researchers have developed methods to calculate the optimal number and
placement of reclosers on an MV feeder, offsetting improvements to reliability against
investment cost [6]-[16].
Recloser placement studies have traditionally not considered the effect of greater numbers
of reclosers on network damage during faults or the effect of positioning on protection
settings. The requirement for devices in series to co-ordinate has the result that upstream
devices, where fault currents are highest, operate in the longest time. Upstream reclosers
are intentionally time delayed to ensure that the recloser closest to the fault trips first to
minimise the number of customers affected [17]. Larger numbers of protective devices in
series can thus give rise to slower fault clearance and thus greater damage as a result of
faults being left on the network longer. The result includes localised damage at the fault
point as well as potential damage to upstream devices (specifically power transformers).
This will lead to a shortened lifespan and a higher probability of failures. In the longer
term, having more reclosers on a network with just traditional considerations could worsen
network reliability and increase maintenance costs.
Fault currents cause huge amounts of thermal energy, which can cause extensive damage
to equipment and risk to human life if not cleared quickly. By minimizing the fault
duration and therefore the energy released, reclosers greatly reduce the damage caused to
lines, the surrounding equipment and the environment. The fault duration is dependent on
the settings of the recloser, which are in turn dependent on the number of reclosers as well
as the position of reclosers. The optimisation of the number and placement of reclosers
can thus not be done without considering the associated negative impact on fault clearance.
On the contrary, having too few devices may lead to nuisance tripping under normal load
conditions. This is because each recloser must be set sensitive enough to detect faults at
the intended reach of the recloser. The intended reach is defined as the furthest point upto
which the recloser should detect faults should the downstream recloser fail, and is

Chapter 1 Introduction
Department of Electrical, Electronic and Computer Engineering 3
University of Pretoria
dependent on the positions of the other reclosers in the network. Setting the recloser in this
manner could result in tripping for load currents, because the current pickup value of the
recloser may be set below the emergency rating of the overhead conductor. In order to
avoid such nuisance tripping, the current pickup value is often rather set to the emergency
rating of the line, compromising the sensitivity of the recloser to a fault at the intended
reach. If the recloser is not set sensitive enough to detect a fault at its intended reach, there
is a possibility that the fault will remain on the network undetected. Undetected faults can
result in damage of the equipment and pose a risk to human safety.
Neither of the above factors has been considered in optimisation studies undertaken so far.
The protection settings on distribution networks are highly dependent on the number and
placement of reclosers. This has a direct impact on the practicality of the application of
protection settings that minimise the damage caused to the network under fault conditions
whilst ensuring that feeders are not tripped under load conditions.
The placement of reclosers solely based on the optimisation of network reliability and cost
may not necessarily address the need to protect the feeder from damage and unnecessary
tripping on load due to the constraints of protection settings. A well-protected feeder
implies an improved lifespan and a lower probability of failures of equipment on the
feeder, lowering maintenance and replacement costs in the long term. The potential
benefits of improvement of reliability indices and optimised operational costs in the long
term, makes it increasingly important that the effects of the abovementioned factors are
included as criteria for recloser placement.
1.1.2 Research gap
The consideration of the impact of the recloser number and placement on protection
settings needs to be prioritized in order to minimise the damage caused to the network
under fault conditions and to ensure that the feeder does not trip under load conditions. In
previous studies, reliability indices and cost have been optimised in isolation from this
consideration.

Chapter 1 Introduction
Department of Electrical, Electronic and Computer Engineering 4
University of Pretoria
The research gap will be addressed by minimising equipment damage during fault
conditions and the risk of tripping for load, in addition to the cost of investment in
reclosers, and the probable loss of supply to customers. The loss of supply to customers is
quantified in terms of the number of customers affected and the total amount of load
interrupted. How the recloser number and placement vary due to different priorities
applied to the abovementioned factors will be studied.
1.2 RESEARCH OBJECTIVE AND QUESTIONS
Previous work by other authors has investigated the optimal number and placement of
reclosers to improve network reliability yet minimise investment cost. The aim of this
research is to build on this work by considering two additional factors in the optimisation
algorithm:
The damage caused to the conductor and other line equipment
The risk of nuisance tripping due to heavy load as a result of settings constraints on
reclosers
The research questions are as follows:
How will recloser number and placement change based on the priority given to the
various factors in the objective function?
What is the suggested recloser number and placement with equal priority given to
each factor in the objective function on a real network? For an actual distribution
network, how do the actual device numbers and placements compare with those
suggested by the algorithm?
A tool will be created to assess various factors such as the reliability indices, cost, damage
and the risk of false tripping and determine the best recloser positioning based on the
priority given to each factor considered. Observations are made on how recloser
positioning is affected due to the added factors of damage and the risk of false tripping.
1.3 HYPOTHESIS AND APPROACH
This research seeks to prove the hypothesis that:

Chapter 1 Introduction
Department of Electrical, Electronic and Computer Engineering 5
University of Pretoria
Recloser placement studies with the additional consideration of protection-
related factors such as equipment damage and the risk of false tripping will
result in different recloser positions compared to when the priority is only on
improving reliability indices and cost.
The hypothesis describes the development of an improved recloser placement algorithm
for radial distribution networks. The various aspects considered in the application of the
algorithm are as follows:
The complexity of the network model that the algorithm is applied to needs to be
decided upon. The approach of previous studies on network model complexity
should be analysed in terms of the limitations on the results of the optimisation
algorithm.
A program should be developed for the automatic creation of the network model
based on provided data and for the application of the algorithm. Software packages
in which to implement the algorithm need to be assessed for simplicity of
implementation.
Various optimisation methods from previous literature must be analysed. An
optimisation method suitable for the problem of recloser placement must be
identified.
The formulation of objective functions in previous literature must be analysed and
the method of measuring reliability indices and cost must be studied. The
availability of actual data required to calculate factors of the objective function
accurately must be assessed to decide on which approach should be used to
calculate the reliability and cost factors.
A suitable factor to represent the damage caused to the network and risk of
nuisance tripping due to heavy load needs to be formulated to be included in the
objective function to be optimised.
An objective function must be developed that takes into account the risk of losing
customers and load, the investment costs, the damage during fault conditions and
the risk of false tripping.

Chapter 1 Introduction
Department of Electrical, Electronic and Computer Engineering 6
University of Pretoria
The results of the algorithm should be tested using different priority factors, and
plausibility will be checked.
Once the algorithm is validated, the program will be applied to a real life network
and results will be analysed.
1.4 RESEARCH GOALS
The goal of this research is to check whether or not the tools that have been previously
documented can be improved by additionally considering two protection-related factors.
The impact of the damage factor and the risk of nuisance tripping due to heavy load will be
studied by means of simulation. The addition of the abovementioned factors to the
objective function could lead to a more balanced algorithm in terms of simultaneously
minimising reliability indices, cost, damage to the network and the risk of nuisance
tripping due to heavy load.
1.5 RESEARCH CONTRIBUTION
Much emphasis has previously been placed on optimisation of reliability indices. This has
driven considerable investment in reclosers. This work seeks to test the concept that
recloser placement driven by reliability indices only may deteriorate the effectiveness of
network protection. Decreased effectiveness of network protection may lead to increased
damage, and may be a contributor to decreased network reliability in the long run.
1.6 OVERVIEW OF STUDY
The structure of this thesis is guided by the research goals and the process that must be
followed in order to evaluate the hypothesis. The chapters that follow are briefly outlined
below.
Chapter 2 includes a review of available literature on network damage due to fault
currents, various factors considered in the optimisation of recloser placement and various
optimisation methods and simulation tools pertaining to the objectives of the hypothesis.
Chapter 3 explains the protection philosophy applied to MV distribution networks.

Chapter 1 Introduction
Department of Electrical, Electronic and Computer Engineering 7
University of Pretoria
Chapter 4 develops the objective function to be optimised and introduces the protection-
related factors, which have not been considered in previous studies for the optimisation of
recloser placement. Modifications on the reliability and cost factors that have been
considered in previous studies are discussed.
The general theory and the application of the genetic algorithm are explained in Chapter 5.
Chapter 6 explains the integration of concepts explained in Chapters 3, 4 and 5 in the
development of the tool created for the optimisation of recloser placement. Discussions on
the automated creation of the network model are included in this chapter.
Chapter 7 includes the validation of the optimisation tool to identify the individual impact
of each factor of the objective function on recloser placement. Thereafter, the tool is
applied to a real feeder and the results are analysed and compared to the actual placement
of reclosers on the network.
Chapter 8 summarises the findings of the research and evaluates the hypothesis.

CHAPTER 2 LITERATURE STUDY
2.1 CHAPTER OBJECTIVES
Chapter 1 identified a number of areas related to the hypothesis that an improved objective
function for the optimisation of recloser placment could be developed. This chapter
includes a review of published information that provides background on previous studies
on recloser placement and on how fault currents can cause damage to conductors. Four
broad topics form the framework of the literature survey. The following topics are studied:
Optimisation methods are evaluated for suitability of application to the recloser
placement problem.
Relevant studies reported by other researchers are analysed in terms of the factors
included in the objective function.
An understanding of distribution feeder protection is critical to the formulation of
the protection-related factors that are to be added to the objective function.
A comparison of software implementation of the project in various software
packages must be done to ensure the efficient programming of the algorithm.
2.2 OPTIMISATION METHODS
The researchers in [6]-[16] employ various optimisation methods to optimise recloser
placement. In all the optimisation methods used, the quality of the solution is determined
by the value of the objective function. The objective function is an equation that consists
of variables that need to be minimised or maximised [18]. All possible combinations of
recloser numbers and positions form the search space of the solution. Each optimisation
algorithm has a unique method of exploring the search space to find a near-optimal
solution. All the methods discussed are more efficient than exhaustive enumeration in
terms of computational time.
2.2.1 Simulated annealing
In [11], the simulated annealing algorithm is used for optimising the number and
placement of switching devices. The idea of this algorithm originates from the process of
annealing in metal work [11]. As a metal is heated and then cooled, the physical properties

Chapter 2 Literature study
Department of Electrical, Electronic and Computer Engineering 9
University of Pretoria
of the metal change slowly during the cooling process and become fixed as it freezes, after
which the metal retains its newly gained properties. Similarly, the algorithm employs a
temperature variable to simulate the heating process. The algorithm begins by randomly
generating an initial recloser placement and by setting the initial temperature variable high.
The quality of the solution is assessed in terms of the value of the objective function. In
each iteration, the existing recloser placement is modified by implementing a set of moves
that are randomly selected, and the temperature variable is reduced by a predefined factor.
If the value of the objective function has improved, the new configuration is accepted as
the current solution. If the value of the objective function has deteriorated, the new
configuration is accepted based on a probability component calculated from the difference
of the objective functions and the temperature. If neither of the above conditions is met,
the previous recloser placement is retained. The probability component is calculated such
that it has a higher value when the temperature is high and when the difference between the
values of objective functions at a fixed temperature is low. The acceptance of
configurations that result in slightly worse solutions ensures that the algorithm can escape
from converging at a local optimum in the early iterations of the algorithm. As the
temperature variable reduces, so does the probability of accepting poorer solutions. This
process is repeated until the value of objective function for the configuration does not
change for a number of consecutive temperature reductions, which is indicative of the
optimal configuration.
The consideration of all branches of the feeder in the optimisation problem creates a large
search space, which makes the approach appropriate for the solution methodology. The
convergence of the simulated annealing algorithm to the optimum solution of a problem is
highly dependent on the selection of assumptions for the cooling schedule, the acceptance
rate and the number of moves at each temperature [11]. The disadvantages of the
algorithm are the difficulty in obtaining these problem-dependent parameters and its slow
convergence speed [11].

Chapter 2 Literature study
Department of Electrical, Electronic and Computer Engineering 10
University of Pretoria
2.2.2 Modified drop heuristic
The modified drop heuristic method is used to determine the number of protective devices
and their positioning, so that the inconvenience caused to the customer is minimised [9].
To simplify the problem, the potential points of recloser placement are limited to nodes on
the main line, or a connection point between the main line and one of the branches. Once
the number of potential sites is chosen, the objective function value is calculated. Each
device is temporarily removed and the objective function is recalculated. This is repeated
until the largest cost minimisation is achieved. The modified drop heuristic was tested on
ten networks and produced the best average improvement and the lowest standard
deviation in comparison to the kVA.km method and the back parse method. This is
observed since the placement of devices is limited to the main line in the other methods.
The disadvantage of the modified drop heuristic is that when a possible solution is
dropped, it can not be reinstalled again, irrespective of whether it becomes economical at a
later stage [9].
2.2.3 kVA.km method
This method is used to determine the number of protective devices and their positioning, so
that the inconvenience caused to the customer is minimised [9]. The kVA.km rating is
defined as the product of the length of the line and the energy usage in the network at each
evaluation point [9]. Once the kVA.km ratings for all the evaluation points are calculated,
the position that yields the biggest value or where the product exceeds a prescribed bound
is chosen as the position for the placement of the device [9]. The success of this method is
highly dependent on a suitable selection of the prescribed bound for each case that is
studied. The value of the bound is network dependent and it varies as the number of
reclosers on the network change. A guideline on how the bounds were selected for each
case is absent in [9].
According to the logic of this method, a node connected to a very long network and a high
load is the most optimal position for a recloser. The shortfall of this method is that a node
connected to a long network, where the probability of faults is high, and where the load

Chapter 2 Literature study
Department of Electrical, Electronic and Computer Engineering 11
University of Pretoria
connected is low may not necessarily be considered as a potential position for a recloser. It
will only be considered as a potential position if the connected length of the network is
extremely long. The major drawback of the kVA.km method is that it tends to select
placement on the main line only [9]. This is due to the fact that the largest length coverage
and connected load is typically on the main line of the feeder. This method is found to
behave less satisfactorily in comparison to other optimisation methods due to this
limitation [9].
2.2.4 Back parse method
The back parse method is used in [16]. The cumulative value of the objective function is
assessed at each point of evaluation and if the value is greater than a prescribed threshold,
a device is placed at that node. This algorithm iterates through all possible recloser
positions from the end points of the feeder till the source is reached. The back parse
method is found to perform better that the kVA.km method, but worse than the modified
drop heuristic. The result of this method is highly dependent on the threshold that needs to
be determined, which is network dependent. This aspect of the method is similar to the
dependency of the kVA.km method on the bound parameter. A lower threshold results in
excessive placement of devices, which would violate the financial constraints.
2.2.5 Tabu search
In [7] and [9], the tabu search is utilised to determine the protective device placement.
The tabu search employs adaptive memory, which enables an economical and effective
search of the solution space. The initial recloser placement is provided or randomly
selected. The neighbourhood of the existing recloser placement is explored by moves of
certain elements of the given recloser placement. If the objective function of the new
configuration has a better value than the previous configuration, the new configuration is
accepted to be the best candidate. The adaptive memory of the algorithm is achieved by
storing each move into various memory types based on certain rules. Recent moves are
stored in the short-term memory, also called the tabu list, which ensures that the move is
not reversed. Selection from the tabu list is allowed if the aspiration criterion is met. The

Chapter 2 Literature study
Department of Electrical, Electronic and Computer Engineering 12
University of Pretoria
aspiration criterion is typically dependent on the difference in the objective values of the
old and new configurations. The intermediate-term memory stores the moves that depict
promising areas of the search space, which biases the search into this area. The long-term
memory stores all previously explored configurations and forces the search into previously
unexplored areas of the search space.
All branches from the main line are considered in the algorithm, which ensures good
results. The consideration of all branches considerably increases the run-time of the
algorithm. The tabu search typically moves to recloser position configurations of lower
energy, but is permitted to make uphill moves to enable the escape from local minima [7].
2.2.6 Genetic algorithms
In [12] and [13], the problem of protection device placement is formulated as a binary
integer non-linear programming problem that is solved using genetic algorithms.
A randomly created population of recloser placement configurations is created and
evaluated according to the objective function. Configurations with the best values of
objective function are considered as elite and are selected as the parent generation.
Children vectors are produced by combining the recloser positions of the parent vectors or
by the random change of a single element in one parent vector. A comparison of the
objective function between the parent vectors and children vectors is done and the best
configurations form the new generation. This process is repeated until the stopping
criterion is reached. The vector with the best objective function after a fixed number of
iterations is considered to be the optimal solution.
Genetic algorithms have been found to be a good tool to solve mixed, combinatorial
problems, but they tend to be computationally expensive. They are less prone to
converging at local optima, unlike gradient search methods. Since the output of the
objective function is the only requirement of the algorithm, the complexity of the problem
does not depend on the form of the objective function or its constraints.

Chapter 2 Literature study
Department of Electrical, Electronic and Computer Engineering 13
University of Pretoria
2.2.7 Overview of optimisation methods
Complete enumeration is the assessment of all possible combinations, and where the best
combination is chosen as the solution. This would be a very time consuming exercise.
Every optimisation method discussed would converge to a solution faster than complete
enumeration, but the quality of the solution may differ based on its ability to escape local
optima and the suitability of the network dependent parameters required for the efficient
convergence of the algorithm for the specific problem.
The genetic algorithm is not dependent on the form of the objective function and thus
multi-dimensional, non-differential, non-continuous problems can be solved. The genetic
algorithm is used in this study due to its suitability to solve multi-objective problems and
its ability to find good solutions in potentially-large search spaces.
2.3 OPTIMISATION OF RECLOSER PLACEMENT
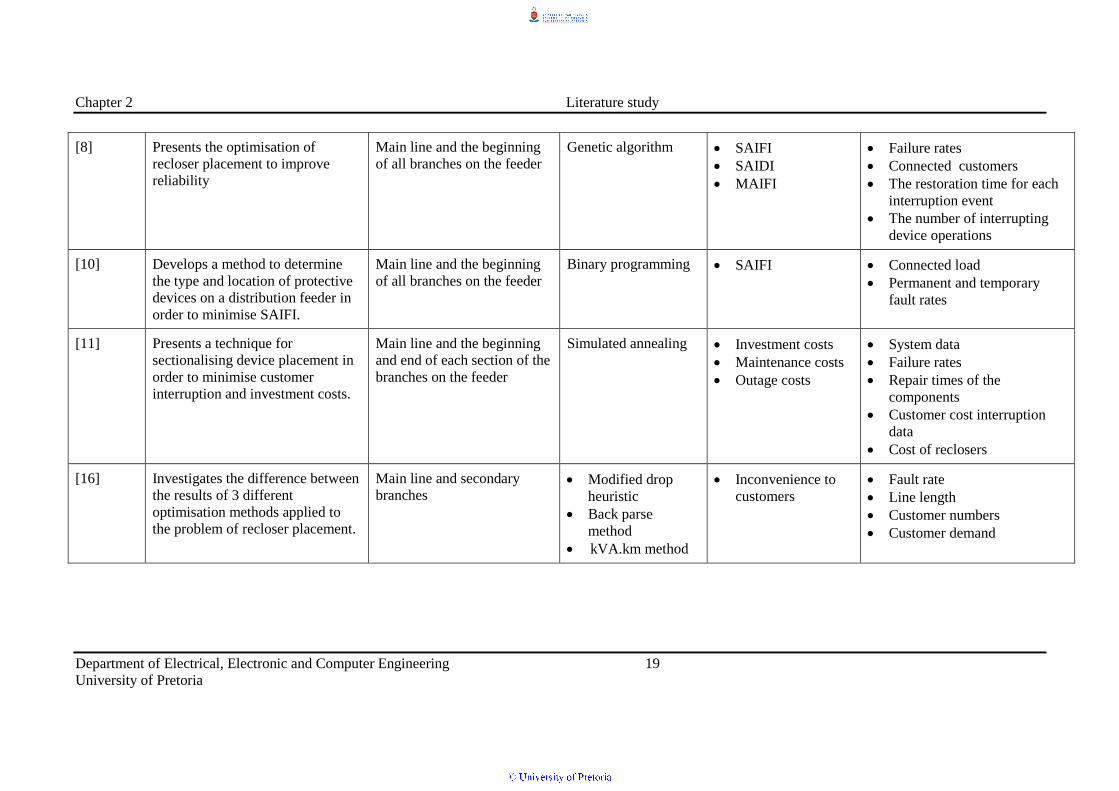
Optimisation studies based on different factors are summarised in Table 2.1 in terms of the
purpose of the study, the optimisation method, the factors that are optimised and data
required for the study. Researchers [6]-[8] use models based on real-life networks, while
[10]-[11] and [16] use hypothetical systems.
The results of Table 2.1 indicate several factors that are considered in the optimisation
process of recloser placement. The individual studies consider a number of different
combinations of these factors in their objective functions, yet it is difficult to distinguish
the individual influence of different factors on recloser placement.
2.3.1 Reliability
Most utilities’ reliability measures are customer based measures. All the studies listed in
Table 2.1 have at least one factor in the objective function that addresses the reliability of
the system. This is due to the fact that the performance of MV distribution networks is
measured by reliability indices, such as the System Average Interruption Duration Index
(SAIDI) and System Average Interruption Frequency Index (SAIFI). ESKOM is obliged

Chapter 2 Literature study
Department of Electrical, Electronic and Computer Engineering 14
University of Pretoria
to submit periodic reports to NERSA on these reliability indices according to NRS048
[19]. The inconvenience caused to the customer is well captured by SAIDI and SAIFI.
SAIDI is the average outage duration for each customer served and is calculated by
Equation 2.1.
total
affectedSAIDIC
CU i
(2.1)
where affectedC is the number of customers affected as a result of a fault at a specific
position, totalC is the total number of customers, iU is the repair time for a fault at location
i.
SAIFI is the average number of interruptions that a customer would experience. SAIFI is
calculated according to Equation 2.2.
total
affectedSAIFIC
C
(2.2)
where affectedC and totalC are the same as defined in (2.1) and is the failure rate of the
length coverage of the recloser.
To calculate either of these parameters, the failure rate of the network following every
potential recloser position and the restoration time for each interruption event must be
known. This information must thus be supplied as inputs to the application that optimises
recloser placement. In [8], [10] and [12]-[14], the objective function is dependent on the
failure rate of equipment and the restoration time of interruption events, SAIDI and SAIFI
are included in the objective function. The limitations of obtaining accurate failure rates
for each branch and the restoration time for each interruption event of a real feeder in the
South African context makes the use of these parameters in the objective function
impractical.

Chapter 2 Literature study
Department of Electrical, Electronic and Computer Engineering 15
University of Pretoria
Momentary Average Interruption Frequency Index (MAIFI) tends to be less reported than
SAIDI and SAIFI, but is included in the objective functions of [8] and [13].
The risk of an outage scenario is included as a factor in the objective function of [6]. The
risk of an outage scenario is given as the product of the Value of Lost Load (VoLL) and
probability of an outage. In [6], the probability of an outage is equivalent to the ratio of the
length of the feeder covered by the recloser and the total length of the feeder and VoLL is
estimated as a specific cost per kilowatt hour to quantify the financial losses that customers
suffer given a loss of supply. As the number of reclosers on a feeder increases, the risk of
an outage for the different sections of the feeder decreases, but not significantly. The
objective function in [6] is modified slightly and discussed further in Chapter 4 for use in
the objective function developed for this study.
The cost of interruption focuses on the monetary aspects of customer outages. References
[7], [11], [14] and [15] consider the placement of protective devices in order to minimise
the cost of interruption in terms of the customer outages, the time needed for repairs and
restoration. The assumptions made in the development of the objective function in [11] are
as follows:
Each load on the network must be defined as either a residential, commercial or
industrial customer.
A fixed repair time of four hours and a fixed switching time of 1.5 hours are
assumed for every permanent fault. The author of [11] does not state the basis of
these assumptions. This could possibly be the average periods for the repair time
and the switching time.
The repair costs and switching costs of residential, commercial and industrial
customers during permanent faults are derived from a utility customer cost damage
function shown in [20], which was relevant in Canada in 1998.
The cost of an interruption for any type of customer during a permanent fault is
assumed to be one dollar.

Chapter 2 Literature study
Department of Electrical, Electronic and Computer Engineering 16
University of Pretoria
The permanent and temporary failure rates of each section of the feeder must be
known. In this study, the permanent and temporary failure rates were assumed to
be equal for every section of the feeder. If the failure rates on every section are
assumed to be equal, the length of the section is what determines which section has
a higher probability of faults.
A considerable amount of data is required and a number of assumptions need to be made to
ensure the accuracy of the calculated cost of interruptions. The cost of interruptions is not
directly proportional to SAIDI, although both indices are dependent on the duration of an
outage. In calculating the cost of interruptions, distinguishing the type of customer is
important, whereas SAIDI only considers the number of customers. Recloser placement,
based on the minimisation of the cost of interruptions, would give higher priority to
commercial customers in comparison to residential customers due to the difference in cost
according to the customer cost damage function shown in [20]. The minimisation of the
cost of interruption would thus not imply the minimisation of SAIDI.
2.3.2 Cost
The cost of the protective devices to be installed is considered as a factor in the objective
function [6], [7], [11] and [14], where the tradeoff between the cost of a recloser and the
value of lost load is evaluated. The cost factor limits the number of reclosers on the
network. It opposes the tendency of the reliability factors to increase the number of
reclosers. The results of [6] show that the addition of a recloser at a specific position is
only justified if the reduction in the risk of an outage scenario is high enough. The
practical limitation of installing many reclosers is cost and the co-ordination between the
reclosers [6], [10].
2.3.3 Co-ordination between the reclosers
The co-ordination between reclosers is not a common factor considered in many recloser
placement studies. Authors in [6] acknowledge the problem of co-ordination between
reclosers as a constraint that must be considered in the future. In [10], all possible
combinations of placement where co-ordination is not possible must be identified

Chapter 2 Literature study
Department of Electrical, Electronic and Computer Engineering 17
University of Pretoria
beforehand and the constraint of allowing a maximum of one recloser in both positions
simultaneously is applied to the problem. The method of identifying recloser positions
where co-ordination is not possible is not discussed in [10]. The automatic identification
of these points is not discussed in [10], implying a manual process of identifying potential
recloser positions that may not allow sound co-ordination between reclosers. The
algorithm in [10] is tested on a hypothetical network, which is considerably simpler than
an actual network. The identification of recloser positions that may not grade on a real
network is impractical.

Chapter 2 Literature study
Department of Electrical, Electronic and Computer Engineering 18
University of Pretoria
Table 2.1. Summary of recloser placement studies
Reference Purpose Candidate points for the
placement of reclosers
Optimisation method Factors considered in
objective function
Data required for variables
[6] Develops a technique to determine
the most feasible number and
location of reclosers to be installed.
Manually selected points
were limited to the main line
and secondary lines
Cost analysis Investment costs
Risk of an outage
scenario
Probabilities of a fault on a
section of a feeder, which is
dependent on the length of the
section
Cost of the outage, which is
dependent on the load
connected to the section
Network topology
Cost of reclosers
[7] Presents a method to determine the
optimal placement of control and
protective devices on radial
distribution feeders.
Main line and beginning
of long secondary
branches
Beginning of branches
with loads that can suffer
reclosing effects and
classified as special or
areas subjected to a high
number of temporary
faults and that can suffer
reclosing effects
Reactive tabu search
algorithm
Investment cost
Cost of
interruptions
Connected load
Permanent and temporary
fault rates
Costs associated with
individual customer
interruptions
Network topology
Cost of reclosers
Chapter 2 Literature study
Department of Electrical, Electronic and Computer Engineering 19
University of Pretoria
[8] Presents the optimisation of
recloser placement to improve
reliability
Main line and the beginning
of all branches on the feeder
Genetic algorithm SAIFI
SAIDI
MAIFI
Failure rates
Connected customers
The restoration time for each
interruption event
The number of interrupting
device operations
[10] Develops a method to determine
the type and location of protective
devices on a distribution feeder in
order to minimise SAIFI.
Main line and the beginning
of all branches on the feeder
Binary programming SAIFI Connected load
Permanent and temporary
fault rates
[11] Presents a technique for
sectionalising device placement in
order to minimise customer
interruption and investment costs.
Main line and the beginning
and end of each section of the
branches on the feeder
Simulated annealing Investment costs
Maintenance costs
Outage costs
System data
Failure rates
Repair times of the
components
Customer cost interruption
data
Cost of reclosers
[16] Investigates the difference between
the results of 3 different
optimisation methods applied to
the problem of recloser placement.
Main line and secondary
branches Modified drop
heuristic
Back parse
method
kVA.km method
Inconvenience to
customers
Fault rate
Line length
Customer numbers
Customer demand

Chapter 2 Literature study
Department of Electrical, Electronic and Computer Engineering 20
University of Pretoria
2.4 DISTRIBUTION FEEDER PROTECTION
2.4.1 Protection of MV distribution feeders
Transient faults account for 70% to 80% of all faults on overhead distribution networks
[6]. Typical causes of transient faults are lightning, phases in contact with each other due
to windy conditions and contact with objects. These faults are temporary in nature and are
normally cleared after one operation of the protective equipment, eliminating prolonged
outages on the distribution system.
Typical causes of permanent faults are downed wires or tree branches making contact with
the wires. The protection installed on the network isolates the fault and the equipment
must be repaired before the supply is restored to the isolated portion of the network.
Reclosure on permanent faults causes further damage to the network.
Every electrical utility has a protection philosophy that is used as a guideline for the
application of protection settings. Protection philosophies for every piece of equipment are
extensively explained in [17]. The application of the protection philosophies fulfils the
purpose of protection which is to maintain the continuity of supply, to minimise damage
and repair costs and to minimise risk to life. The protection settings of reclosers have a
significant impact on the results of this study and will be further elaborated on in Chapter
3.
2.4.2 The impact of ineffective protection settings
Ineffective protection settings may result in unnecessary loss of supply, increased damage
and repair costs and may pose a risk to life. Damage and risk to life are focussed on in this
section.
Protection settings that are excessively delayed or that fail to detect a fault could cause the
components of the feeder to overheat, resulting in permanent damage. The allowable sag,
annealing, long term creep and the reliability of joints have an impact on the maximum

Chapter 2 Literature study
Department of Electrical, Electronic and Computer Engineering 21
University of Pretoria
temperature at which a conductor can safely operate [21]. Permanent sag increases due to
creep elongation of the conductor. This accumulates over time. The sag of an overhead
line is determined as a function of the thermal-mechanical parameters of the installed
conductor and the conductor temperature [22]. The conductor elongates during the
metallurgical creeping of aluminium [22]. As a result, conductor sag increases which in
turn reduces the clearance distance of the conductor to ground. Excessive sag can violate
minimum statutory clearance requirements as it poses a risk to human lives and to the
environment [21]. As the clearance distance between the conductor and ground reduces,
the probability of instances of faults on the network will increase, which will have a
negative impact on SAIDI and SAIFI.
In [23], the heat stored in the conductor is equated to the heat gained from the fault current
and solar radiation less the heat lost from radiation and convection. The effect of the
calculated temperature is used to determine an elongation model due to creep [22]. The
model is dependent on temperature, mechanical tension, the time period and material
coefficients. The only controllable parameter from the elongation model is the time
duration that the conductor is exposed to the fault current. The ideal settings of protective
devices must be sensitive enough to detect faults and trip fast enough to avoid elongation
of the conductor.
The 1 s current rating of an overhead conductor is the maximum short-circuit current that
the line can withstand for one second. This is derived from the temperature limit of the
specific equipment. Permanent damage occurs wherever the energy exposure level or the
let through energy exceeds the short time withstand rating of the conductor [22]. Equation
2.3 expresses the energy exposure of an overhead line as defined in [24]-[25].
E = I2t (2.3)
where E is the energy exposure, I is the fault current and t is the duration of the fault
current.

Chapter 2 Literature study
Department of Electrical, Electronic and Computer Engineering 22
University of Pretoria
This equation is applicable to adiabatic conditions where the loss of heat due to radiation
and convection are assumed to be insignificant due to the short time period of the fault
current.
From Equation 2.3, the time that the conductor is exposed to the fault current is the only
parameter that can be controlled without making any modifications in primary plant. A
fault current limiter could be installed to reduce the fault current, but would require further
investment. The time period the line and its components are exposed to the fault current is
dependent on the settings of the protective devices (e.g. reclosers). The settings
philosophy applied to the reclosers has a significant impact on the energy exposure of the
feeder.
The energy exposure is most significant in the portion of the feeder closest to the source,
where the fault current of the feeder is highest and where the energy limit could possibly
be exceeded. The trip time has a significant effect on the energy exposure at high fault
levels, near the source.
2.5 SOFTWARE IMPLEMENTATION
Most of the previous studies have been implemented in Matlab or optimisation packages
specialised in the implementation of the optimisation methods discussed in Section 2.2.
Due to the additional consideration of the damage factor on recloser placement, the ability
to model real networks with the parameters of the actual conductor type is required since
the fault level at each point of the network is a potential variable of the objective function.
The implementation of a real network in Matlab is complex as each component must be
modelled from first principles.
DIgSILENT PowerFactory is the simulation tool widely used in electrical utilities for
modelling, analysis and simulation of the power system. It has an extensive database of
electrical components, enabling the modelling of the network with the required parameters,
such as the impedance of the line, based on the conductor type selected for the line. The
provision of applying the relevant protection settings on reclosers modelled at specific

Chapter 2 Literature study
Department of Electrical, Electronic and Computer Engineering 23
University of Pretoria
positions on the network allow for the protection-related factors to be assessed at each
point on the network. This makes this tool the preferred option for the implementation of
the algorithm.
2.6 CHAPTER IN PERPECTIVE
The literature survey has provided background on how previous studies have approached
the optimisation of recloser placement. None of the previous studies identified in the
literature survey have attempted to include the effect of recloser placement on protection
performance of a feeder. Consequently, the proposed approach seeks to give consideration
to protection related factors in addition to the reliability and cost factors already considered
in existing recloser placement studies. In this way, the damage to the network will be
minimised.
The knowledge gained from previous studies is developed further in the detailed analysis
of later chapters. Chapter 3 considers the protection settings philosophy that is
implemented in the objective function and algorithm.
CHAPTER 3 PROTECTION SETTINGS
PHILOSOPHIES
Recloser placement has an impact on the application of suitable settings. In Section 2.3 it
was seen that many authors on the topic of recloser placement focus on reliability and cost
factors and have not considered the impact of recloser placement and numbers on
protection settings. Sound understanding of protection settings philosophy for the MV
distribution network is required for the development of the objective function detailed in
Chapter 4 and for the implementation of the chosen optimisation method, which is
described in Chapter 5.
3.1 RECLOSER SETTING PARAMETERS
Every recloser has a current pick-up and a time multiplier (TM). The current pick-up is the
recloser setting at which, when exceeded, the recloser will operate or begin timing out.
The time multiplier is the setting which determines the time that must lapse before the
relay trips once the fault is detected. The manipulation of this setting allows for time
grading to be achieved in the network. The current pick-up controls the sensitivity of the
recloser and the time multiplier controls the operating time of the recloser.
Typically, most reclosers are set using the Normal Inverse (NI) characteristic. The trip
time (TT) of the NI curve is determined by Equation 3.1 [17],
1
14.002.0
PU
fault
I
I
TMTT (3.1)
where TT is the trip time of the recloser, TM is the time multiplier, faultI is the fault current
and PUI is the current pick up setting.

Chapter 3 Protection settings philosophies
Department of Electrical, Electronic and Computer Engineering 25
University of Pretoria
From Equation 3.1 and Figure 3.1, it is evident that the trip time of the recloser reduces
exponentially as the fault current increases if the recloser is set to a Normal Inverse or NI
characteristic.
Reclosers with a definite time characteristic are set to trip after a specific time delay
irrespective of the fault current. The difference between the Normal Inverse characteristic
and the definite time characteristic is shown in Figure 3.1.
Figure 3.1. Normal Inverse and Definite Time Characteristic
Reclosers typically have overcurrent, earth fault and sensitive earth fault protection. Earth
fault levels on the MV bus of the substations are low due to the installation of neutral
earthing compensators, which limit the earth fault current nominally to 360 A per
transformer [26]. Overcurrent fault current levels on the network vary according to the
source impedance. As the source impedance reduces, the fault current will increase. The
overcurrent element of a recloser, therefore, is considered to have a greater impact on the
damage caused to the network due to the risk of exposing the network to high fault
currents.
0.1
1
10
100
100 1000
CURRENT Amps
T
I
M
E
s
e
c
Fault current (A)
Tim
e (s
)
Normal Inverse
Characteristic
Definite time
Characteristic

Chapter 3 Protection settings philosophies
Department of Electrical, Electronic and Computer Engineering 26
University of Pretoria
Overcurrent reclosers typically consist of the settings shown in Table 3.1.
Table 3.1. Summary of overcurrent elements on a recloser
Setting Purpose
Delayed protection Enables co-ordination between upstream and downstream
devices
Instantaneous
protection
Reduces damage caused by high fault currents;
Prevents voltage depressions affecting customers on
adjacent feeders
Autoreclose Automatic restoration of supply if fault is temporary
Automatic isolation of fault if fault is permanent
3.2 DELAYED PROTECTION SETTINGS
Suitable time-delayed overcurrent settings are applied to every recloser according to
guidelines described in [17] and [27]:
The pick-up should be set between 100 % and 120 % of the emergency rating of the
conductor of lowest current rating within the overcurrent reach. The emergency
rating is defined as the current rating at which the line can be safely operated
during emergency conditions, without compromising the safety of the power line
[28]. The purpose of overcurrent protection is to trip for faults and not for
overload. Every feeder is designed with a conductor type suitable for the load
requirements of the customers connected to it. If the recloser is set below the
emergency rating of the conductor, there is a high probability that the feeder will
trip for load conditions. This unnecessary loss of supply would negatively impact
SAIDI.
The pick-up should be sensitive enough to detect 80 percent of phase-to-phase fault
current at the end of the intended reach, allowing for the bypassing of one
immediate downstream recloser. Overcurrent protection must be sensitive enough
to detect three-phase faults and phase-to-phase faults, which comparatively have a

Chapter 3 Protection settings philosophies
Department of Electrical, Electronic and Computer Engineering 27
University of Pretoria
smaller magnitude. Ensuring appropriate sensitivity to phase-to-phase faults would
guarantee sensitivity to three-phase faults since the magnitude of phase-to-phase
faults is always smaller than three-phase faults in MV distribution context. A
safety margin of 80 percent is used in this case. The pick-up must also be low
enough to detect all faults within the coverage of the immediate downstream
recloser to cater for the contingency of the failure or the bypassing of the
immediate downstream recloser. Figure 3.2 illustrates the furthest reach of recloser
A. Recloser B must be able to detect faults at both Load 1 and 2, but if recloser B
fails or is bypassed, recloser A must be able to pick up for a fault at both Load 1
and Load 2. Since the fault level is lower at Load 1 in comparison to Load 2, the
pick-up must be set to 80 percent of the phase-to-phase fault at Load 1.
Figure 3.2. An illustration of the furthest reach
The pick-up of a recloser must be set to 90 % of the pick-up of the upstream
recloser. This ensures discrimination by current between two consecutive
reclosers. The grading between two devices should be done at the maximum
expected current at the point of overlap. Discrimination by time on radial networks
is attained by setting the trip times of consecutive reclosers, such that the
downstream recloser trips faster than the upstream recloser. The grading margin
between reclosers is typically 400 ms - 500 ms due to circuit breaker operating
times, recloser reset time, recloser overshoot and recloser time delay errors [27].
The required grading margin varies depending on the type of recloser that is
Substation busbar
500A
200A
Load 1
Load 2
PU=200A A
B

Chapter 3 Protection settings philosophies
Department of Electrical, Electronic and Computer Engineering 28
University of Pretoria
installed. The grading margin required between two numerical reclosers is 300 ms
and between electromechanical reclosers is 400 ms.
The abovementioned guidelines can often be in conflict with each other and thus
engineering judgement is required to decide on which criteria deserve precedence. An
example of a conflicting situation is where the reach of a recloser is compromised to avoid
load encroachment. From an operational and reliability perspective, ensuring that the line
does not trip on load is critical. From a protection perspective, there is a small probability
that some faults will not be detected, which could be a danger to human lives and to the
equipment on the line. SAIDI and SAIFI will be negatively affected if precedence is given
to the reach of the recloser and not to load encroachment. The structure of the feeder, the
fault levels and recloser positions on the feeder have an impact on the existence of these
situations of conflict between the criteria mentioned above. Of the abovementioned
factors, the recloser number and positions can be varied to minimise the difference
between the emergency rating of the line and the intended reach of the recloser. This will
be discussed further in Chapter 5.
Various approaches exist in calculating the protection settings of reclosers on an MV
distribution network. The bottom-up approach and the top-down approach are commonly
used in utilities.
Figure 3.3. A sample feeder

Chapter 3 Protection settings philosophies
Department of Electrical, Electronic and Computer Engineering 29
University of Pretoria
The bottom-up approach entails setting the reclosers closest to the loads as fast as possible,
with a minimum time multiplier. All upstream devices are graded with downstream
reclosers. The trip time of the feeder circuit-breaker thus depends on the number of
reclosers that need to be graded. The upper limit of the trip time for the feeder circuit-
breaker is the trip time of the transformer minus the 400 ms grading margin. Recloser B in
Figure 3.3 is set to a minimum time multiplier of 0.05 and the corresponding trip time for
IB is calculated. Recloser A should then be set to 400 ms slower than recloser B for IB.
The time multiplier of recloser A is calculated using Equation 3.1.
The top-down approach entails the setting of the feeder circuit-breaker 400 ms faster than
the transformer’s overcurrent protection at T in Figure 3.3. The transformer protection is
typically set to 1.5 s for a busbar fault. All downstream reclosers are graded with upstream
reclosers with a grading margin of 400 ms. Recloser A is set to trip in 1.1 s for a fault
magnitude of IA and the time multiplier is calculated using Equation 3.1. The trip time of
recloser A is calculated for IB. The time multiplier for recloser B is then calculated by
setting the trip time 400 ms faster than the calculated trip time of recloser A for IB.
Recloser A should then be set to 400 ms slower than recloser B for IB. The time multiplier
of recloser A is calculated using Equation 3.1.
Although both methods of co-ordination are used commonly in utilities, the bottom-up
approach allows less energy exposure than the top-down approach as the trip times of all
reclosers are set as fast as possible.
3.3 INSTANTANEOUS PROTECTION SETTINGS
Most overcurrent reclosers are fitted with a high-set instantaneous element. Although the
high-set is configured to trip instantaneously, the actual trip time is equivalent to the
circuit-breaker operating time since the circuit-breaker is not capable of tripping
instantaneously. The circuit-breaker operating time is defined as the time elapsed between
the trip initiation and when the arc has actually been extinguished. The circuit-breaker
operating time is assumed to be 80 ms [17].

Chapter 3 Protection settings philosophies
Department of Electrical, Electronic and Computer Engineering 30
University of Pretoria
The application of a high-set allows for a reduction in the tripping time at high fault levels.
The instantaneous element or high-set on the feeder circuit-breaker is set so that it will not
operate for the maximum through fault current seen by the successive recloser [17]. This
philosophy ensures that the high-set will not trip instantaneously for faults beyond the
successive recloser. A setting equal to 150 % of the fault current level at the downstream
recloser position is assumed to cater for network modelling errors, recloser measurement
errors and transient over reach [27].
Figure 3.4. Case A: Application of a high-set Figure 3.5. Case B: Application of a high-set
Instantaneous tripping is feasible only if there is a substantial increase in the magnitude of
the short circuit current as the position of the short circuit moves from the downstream
recloser towards the upstream recloser. The instantaneous high-set current pick-up of
recloser A is set to either 150 % or 130 % of the fault level at the downstream recloser. If
neither is possible due to small difference in fault currents, the high-set is deactivated.
Figure 3.4 presents a situation where an instantaneous high-set cannot be applied to the
feeder breaker since the fault level at A is only 10 % higher than the fault level at B. The
instantaneous high-set of Recloser A in Figure 3.5 is set to 3 kA (1.5*2 kA). The location
of downstream reclosers thus has an impact on the feasibility of the implementation of a
high-set on reclosers.
The application of a high-set on the feeder breaker is very effective in reducing the let-
through energy, where it is most critical. The lower the high-set is set, the lower the
energy exposure of the feeder will be.
5kA Substation busbar
Load 1
Load 2
2kA
5km
A
C
4.5kA
A
5kA
0.5km B
Load 1
Load 2
Substation busbar

Chapter 3 Protection settings philosophies
Department of Electrical, Electronic and Computer Engineering 31
University of Pretoria
3.4 AUTO-RECLOSE PHILOSOPHY
A recloser is typically set to autoreclose twice in an attempt to re-establish connection. If
the fault is detected even after the second autoreclose cycle, the recloser is set to lock-out,
with no further attempts to re-establish connection. The faulted part of the network would
be isolated and the remainder of the network is kept intact. If the recloser locks out, the
permanent fault must be physically repaired by a technician. Inspection of the line beyond
the recloser to locate the faulty portion of the line is time-consuming.
An auto-reclose philosophy of three trips to lock-out is assumed. This implies that the
feeder will be exposed to a permanent fault current three times consecutively until the
recloser locks out. It is assumed that the conductor will not dissipate heat significantly
over the short time span of the auto reclose deadtimes. The energy exposure of a feeder for
a permanent fault is thus three times that of a transient fault that is cleared with one auto-
reclose cycle. A success rate of 89 % is reported for the first shot, 5 % for the second and 1
% for the third in [29]. All faults expose the network to the fault current till the first trip of
the circuit. If a success rate of 89% is reported for the first shot, it implies that the
remaining 11% of faults will remain on the network till the second trip. From the 11% of
faults remaining on the system after the second trip, only 5% of faults will be cleared,
implying that 6% of faults will remain on the network until the third trip. Using this as an
assumption, the energy exposure for a fault at a specific point on the network is calculated
as follows.
E = (100% x I2t1 ) + ( (100%-89%) x I
2t2 ) + ((100%-89%-5%) x I
2t3 )
= (100% x I2t1 ) + (11% x I
2t2 ) + (6% x I
2t3 ) (3.2)
where E is the energy exposure, I is the short-circuit current and tn is the duration of the
short-circuit current with n = trip 1, 2 or 3 respectively.
3.5 CHAPTER IN PERSPECTIVE
The philosophy described in this chapter is applied to each recloser modelled in
DIgSILENT PowerFactory. Compromises based on engineering judgement are not made

Chapter 3 Protection settings philosophies
Department of Electrical, Electronic and Computer Engineering 32
University of Pretoria
in the implementation of the tool and the most conservative setting is applied to each
recloser in the network.
Chapter 4 entails the development of the objective function. The protection-related factors
in the objective function are dependent on the protection philosophy discussed in this
chapter.

CHAPTER 4 THE MODIFIED OBJECTIVE
FUNCTION
Chapter 3 discussed the protection settings philosophy which is expected to affect the
results of the optimisation algorithm due to the addition of protection-related factors in the
objective function. Sections 4.1 and 4.2 introduce the protection-related factors, which
have not been considered in previous studies for the optimisation of recloser placement.
Sections 4.3 to 4.5 include details on the selection of the reliability and cost factors that
have previously been considered. Modifications to the reliability factors are made to suit
the implementation of the optimisation algorithm and availability of data. The objective
function consists of five factors that need to be minimised by means of the optimisation
algorithm. Each factor is discussed in detail in this chapter.
Since the aim of the optimisation algorithm discussed in Chapter 5 is to minimise the value
of the objective function, the smaller the value of the objective function is for a specific
number and placement of reclosers, the more favourable the specified placement of
reclosers is. Each factor in the objective function is normalised against a measure that is
considered to be the worst case scenario. A value of 1 for any individual factor would
imply that the selected recloser placement is detrimental to that factor. The factors to be
minimised are the damage factor, the recloser investment costs, the risk of outages in terms
of customer numbers and load size, as well as the risk of nuisance tripping due to heavy
load.
4.1 DAMAGE FACTOR
The damage factor, D, is equivalent to the energy exposure of the MV distribution feeder
that is quantified by Equation 2.3. It is determined as a function of the magnitude of the
short-circuit current and the duration of the fault. The duration of the fault at each point of
the feeder is dependent on the placement of reclosers and the settings allocated to the
reclosers.

Chapter 4 The modified objective function
Department of Electrical, Electronic and Computer Engineering 34
University of Pretoria
Once the placement of reclosers on the network is implemented, the reclosers are set
according to the philosophy described in Chapter 3.
The following assumptions are made in the process of setting the recloser:
An auto-reclose philosophy of three trips to lock-out is assumed.
If the high-set implementation on a recloser is feasible, the high-set is activated. If
the high-set is activated on the recloser, the first trip would be instantaneous and
the other two trips would trip with an NI characteristic. The instantaneous
overcurrent element of the recloser is designed to operate with no intentional time
delay when the current exceeds the recloser setting, but in reality there is a slight
time delay due to the breaker operating time. The period of an instantaneous trip is
assumed to be 80 ms for calculation purposes.
All reclosers on the network are assumed to be numerical and thus a grading
margin of 300 ms is applied between consecutive reclosers.
The bottom-up approach is used to set the reclosers.
The minimum value of the current pick-up obtained from the three criteria detailed
in Section 3.2 is utilised as the current pick-up of the recloser. This results in the
most conservative setting, which would ensure comprehensive protection of the
feeder, but could result in tripping on load if the fault current at the intended reach
of the recloser is very low.
In deriving the damage factor, understanding the concept of the direct length coverage of a
recloser is required. The direct length coverage of the reclosers is illustrated in Figure 4.1.
Section LCA and LCB are the length coverages of reclosers A and B. The time that section
LCA is exposed to a fault current is dependent on the settings applied to recloser A and the
same applies for section LCB.

Chapter 4 The modified objective function
Department of Electrical, Electronic and Computer Engineering 35
University of Pretoria
Figure 4.1. Illustration of the direct coverage of reclosers
Equation 4.1 is derived from Equation 3.2 and is applied to each recloser for the direct
length coverage of the recloser.
lr
r
fl
l
dlltlIltlIltlINF
D0 0
3
2
2
2
1
2
1
)())((06.0)())((11.0)())((1
(4.1)
Equation 4.1 can be discretized as follows. The energy exposure of the network is
assessed at every 100 m of the network.
lr
r
fl
l
ltlIltlIltlINF
D0 0
3
2
2
2
1
2
1
)())((06.0)())((11.0)())((1
(4.2)
where D is the damage factor, )(lI is the short-circuit current at location l , 0r is the first
recloser, lr is the last recloser , 0l is beginning of the length coverage of the recloser, f
l is
the end of the length coverage of the recloser, )(ltn is the trip time of recloser nr for a
short-circuit current at location l with n = trip 1, 2 or 3 respectively, NF1 is the
normalisation factor.
Obtaining a normalisation factor for the damage factor is challenging as it is network
dependent. The use of a constant value irrespective of the network would result in an
Substation busbar
Load 1
Load 2
LCA
A
B LCB

Chapter 4 The modified objective function
Department of Electrical, Electronic and Computer Engineering 36
University of Pretoria
inconsistent weight of the damage factor. The normalisation factor NF1 is set to the
largest value for the damage function obtained from 200 simulated iterations of random
placements of reclosers, where the recloser number is varied from the 2 reclosers to the
maximum number of reclosers, specified by the user.
In the case of a recloser with the high-set element activated, Equation 3.2 can be simplified
as:
E = (100% x I2t1 ) + (11% x I
2t2 ) + (6% x I
2t2 ) (4.3)
= I2t1 + 0.17 I
2t2
where E is the energy exposure, I is the short-circuit current t1 is the duration of the short-
circuit current for an instantaneous trip and t2 is the duration of the short-circuit current for
a time-delayed trip.
If the high-set element is deactivated, Equation 3.2 can be simplified as:
E = (100% x I2t1) + (11% x I
2t1) + (6% x I
2t1) (4.4)
= 1.17 I2t1
where E is the energy exposure, I is the short-circuit current and t1 is the duration of the
short-circuit current for a time-delayed trip.
4.2 RECLOSER PICKUP LIMITS
Minimising the difference between the emergency rating of the conductor and the
recloser’s time delayed current pick-up is vital for ensuring that the feeder does not trip on
load. This factor is assessed to optimise the time delayed current pickup of reclosers by
considering the philosophy to be sensitive enough to detect 80 % of phase-to-phase fault
current at the end of the intended reach, allowing for the bypassing of one immediate
downstream recloser. In Figure 4.2, recloser A must be able detect 80 % of phase-to-phase
fault current at both Load 1 and Load 2. Since the fault current at Load 1 is smaller, the
pickup of recloser must be set to the smaller value between the conductor emergency rating
and 80 % of phase-to-phase fault current at Load 1. Assume that the feeder consists of
Hare conductor, which has an emergency rating of 380 A. Although the conductor has the

Chapter 4 The modified objective function
Department of Electrical, Electronic and Computer Engineering 37
University of Pretoria
capability to conduct 380 A, recloser A has to be set to 200 A, which is 80 % of phase-to-
phase fault current at Load 1. This poses the threat of tripping on load.
With the addition of recloser B in Figure 4.3, the situation does not change, since the
intended reach remains the same. This is due to the fact that the philosophy states that the
bypass of the immediate downstream recloser should be catered for. Although recloser B
will be set to detect a fault at Load 1, the case for when it is bypassed should be catered
for.
With the addition of recloser B and recloser C in Figure 4.4, the intended reach of recloser
A reduces from Load 1 to the location of recloser C. Recloser A should be set sensitive
enough to detect a fault at recloser C, which is 400 A. Recloser A can be set to the
emergency rating of the line, since the intended reach of the recloser is not a constraint
anymore. Tripping for load conditions would not be an issue in this case.
Figure 4.2. Furthest reach illustration Figure 4.3. Furthest reach illustration
with one recloser with two reclosers
500A
Substation busbar
A PU=200A
Load 1
Load 2
200A
Substation busbar
500A
200A
Load 1
Load 2
PU=200A A
B

Chapter 4 The modified objective function
Department of Electrical, Electronic and Computer Engineering 38
University of Pretoria
Figure 4.4. Furthest reach illustration with three reclosers
Setting the feeder breaker below the emergency rating of the conductor type has a ripple
effect on the current pick-up of all downstream reclosers since all downstream reclosers
must be set lower than the current pick-up of the feeder breaker to ensure grading by
current.
Equation 4.5 shows the pickup limit factor of the objective function.
n
r
r
r
LR
PULR
NFPU
02
limit
1 (4.5)
where limitPU is the pickup limit factor, LR is the line rating of the conductor connected to
the recloser, rPU is the time delayed current pickup of the recloser, 2NF is the
normalisation factor, 0r is the first recloser and nr is the last recloser.
The normalisation factor 2NF , is fixed at 0.5 as it is considered to be the worst case
scenario. The worst case scenario is assumed to be when the difference between the
emergency rating of the conductor and the recloser’s current pick-up is 50% of the
emergency rating.
C
Load 2
400A
A
Substation busbar
500A Load 1
B
PU=380
A
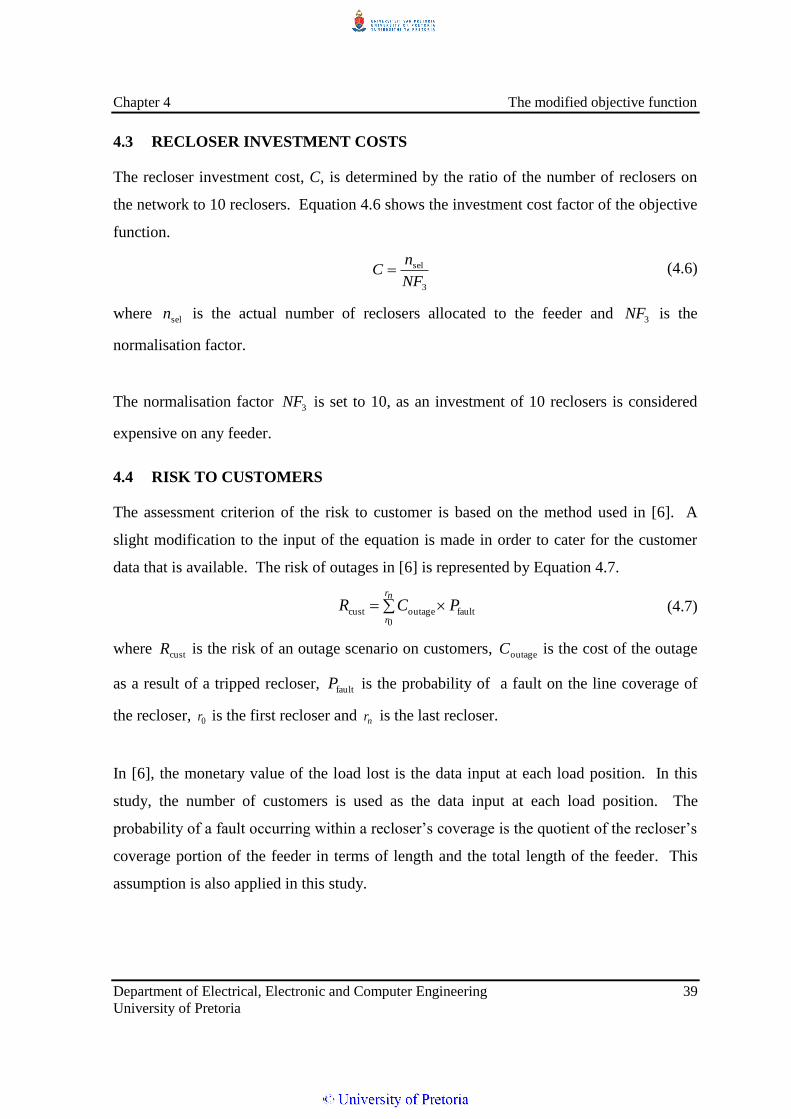
Chapter 4 The modified objective function
Department of Electrical, Electronic and Computer Engineering 39
University of Pretoria
4.3 RECLOSER INVESTMENT COSTS
The recloser investment cost, C, is determined by the ratio of the number of reclosers on
the network to 10 reclosers. Equation 4.6 shows the investment cost factor of the objective
function.
3
sel
NF
nC (4.6)
where seln is the actual number of reclosers allocated to the feeder and 3NF is the
normalisation factor.
The normalisation factor 3NF is set to 10, as an investment of 10 reclosers is considered
expensive on any feeder.
4.4 RISK TO CUSTOMERS
The assessment criterion of the risk to customer is based on the method used in [6]. A
slight modification to the input of the equation is made in order to cater for the customer
data that is available. The risk of outages in [6] is represented by Equation 4.7.
nr
r
PCR0
faultoutagecust (4.7)
where custR is the risk of an outage scenario on customers, outageC is the cost of the outage
as a result of a tripped recloser, faultP is the probability of a fault on the line coverage of
the recloser, 0r is the first recloser and nr is the last recloser.
In [6], the monetary value of the load lost is the data input at each load position. In this
study, the number of customers is used as the data input at each load position. The
probability of a fault occurring within a recloser’s coverage is the quotient of the recloser’s
coverage portion of the feeder in terms of length and the total length of the feeder. This
assumption is also applied in this study.

Chapter 4 The modified objective function
Department of Electrical, Electronic and Computer Engineering 40
University of Pretoria
The risk of an outage scenario on customers, custR , is determined as a function of the
probability of a fault occurring within a recloser’s coverage and number of customers
affected by the trip of a specific recloser, which is normalised to the total number of
customers connected to the feeder. This factor is dependent on the recloser number and its
location on the feeder. Equation 4.8 shows the customer risk factor of the objective
function.
n
r
r L
rL
C
rCR
0 total
coverage
total
affectedcust
)()( (4.8)
where affectedC is the number of customers affected as a result of a tripped recloser, totalC is
the total number of customers, coverageL is the length of the feeder for which the recloser
provides direct protective coverage, otaltL is the total length of the feeder, 0r is the first
recloser and nr is the last recloser.
There is no need to normalise this factor as the worst case scenario of this factor is when
there is only 1 recloser and all customers are disconnected should there be a fault anywhere
on the network. The value of the risk factor is 1 in this case.
Minimising the risk of an outage scenario on customers ensures the minimisation of both
SAIFI and SAIDI. The relationship between these factors is investigated further in
Sections 4.4.1 and 4.4.2.
4.4.1 Impact on SAIFI
Equation 4.8 is compared to Equation 2.2 to show the relation between the risk of the loss
of customers, custR , to SAIFI. SAIFI is dependent on the failure rate of equipment. A
failure rate on a piece of equipment, λ, is defined as the number of failures in a period and
is based on historical records of the network. The comparison of equations 4.8 and 2.2
reveal that the two measures are proportional to each other since the failure rate and the
probability of faults are proportional to each other. The ratio of the number of customers

Chapter 4 The modified objective function
Department of Electrical, Electronic and Computer Engineering 41
University of Pretoria
affected to the total number of customers is common to both equations. Minimising the
risk to customers, custR , would thus minimise SAIFI at the same time.
4.4.2 Impact on SAIDI
SAIDI is dependent on the repair time of an interruption event at any point in the network.
The repair time is generally dependent on the time taken to travel to the location of the
recloser, to patrol the line beyond the recloser, to find the fault and to repair it. Of these
four parameters, the only parameter that is dependent on the recloser placement is the time
taken to patrol the line beyond the recloser that tripped. The time taken to patrol the line is
directly proportional to the length of the line beyond the recloser, which is equivalent to
the line coverage of the recloser.
The ratio of the customers connected to the section of line and the total number of
customers is common to both Equations 2.1 and 4.8. Since the time taken to patrol the line
is directly proportional to the length coverage of the recloser, SAIDI and the risk of an
outage scenario for customers, custR , are proportional to each other. Minimising the risk of
an outage in terms of customer numbers would thus minimise SAIDI.
4.5 RISK TO LOADS
Section 4.4 considers the risk to customers, irrespective of the size of the load. This factor
caters for points on the network that do not necessarily have a high number of customers
connected to it, but may have a large load connected to it. Customer numbers and the load
size are not always directly proportional to each other and thus if priority needs to be given
to large customers in terms of load size, the factor loadR will cater for this need. loadR , the
risk of an outage scenario on loads, is determined as a function of the probability of a fault
occurring within a recloser’s coverage and load affected by the trip of a specific recloser,
which is normalised to the total load connected to the feeder. The probability of a fault
occurring within a recloser’s coverage is dependent on the recloser’s coverage portion of
the feeder in terms of length and the total length of the feeder. Equation 4.9 shows the load
risk factor of the objective function, loadR .

Chapter 4 The modified objective function
Department of Electrical, Electronic and Computer Engineering 42
University of Pretoria
nr
r L
rL
kVA
rkVAR
0 total
coverage
total
affected
load
)()( (4.9)
where affectedkVA is the load affected as a result of a tripped recloser, totalkVA is the total
load, coverageL is the length of the feeder for which the recloser provides direct protective
coverage, totalL is the total length of the feeder, 0r is the first recloser and nr is the last
recloser.
There is no need to normalise this factor as the worst case scenario of this factor is when
there is only 1 recloser and all loads are disconnected should there be a fault anywhere on
the network. The value of the risk factor is 1 in this case.
4.6 OBJECTIVE FUNCTION
The total objective function combines equations 4.2 and 4.5, 4.7, 4.8 and 4.9. Weighting
factors are added to the objective function to allow the user to apply various priorities on
each factor. The objective function is as follows.
limit5load4cust321min PUwRwRwCwDwJ (4.10)
where 1w , 2w , 3w , 4w , 5w are weighting factors that represent how the utility prioritises
the respective criteria of minimisation of damage, investment costs, the number of
customers affected, the size of the load affected and tripping on load respectively. D is the
damage factor, C is the investment cost, custR is the risk of customer outages, loadR is the
risk of load outages and limitPU is the pick-up limit.
The system performance is determined by the result of the objective function, which is
described in equation 4.10. The objective function is considered as the fitness function of
this algorithm. The optimisation involves the adjustment of the recloser positions in order
to minimise the five factors. In this way, the system performance is maximised.

Chapter 4 The modified objective function
Department of Electrical, Electronic and Computer Engineering 43
University of Pretoria
4.7 CHAPTER IN PERSPECTIVE
The objective function described in this chapter is calculated for each combination of
recloser placement in the processing of the optimisation algorithm, discussed in Chapter 5.
It consists of five unrelated factors that are normalised to the worst case scenario. It is an
improvement on the existing methods by way of its ability to:
Include the effect of recloser placement on protection-related factors, in addition to
reliability and cost factors.
Allow the user to specify a weighting on each factor in the objective function
based on the user’s priority for each factor.
Since the aim of this study is to minimise the factors considered in the objective function,
the recloser placement that produces the smallest value of the objective function is the
optimal solution. The objective function is considered to be balanced and recloser
positions that are favourable for reliability may not produce a favourable value for the
objective function due to the addition of the protection-related factors to the objective
function.
Chapter 5 explains the optimisation algorithm used to search the solution space to
minimise the objective function. The general theory and the application of the genetic
algorithm are elaborated upon in Chapter 5.

CHAPTER 5 APPLICATION OF A GENETIC
ALGORITHM TO RECLOSER POSITIONING
OPTIMISATION
The discussion of Chapter 4, regarding the objective function, will be used to measure the
fitness of each candidate solution encountered in the optimisation process. Due to the
extremely high number of combinations of recloser positions for various numbers of
reclosers, the evaluation of every possible combination is not feasible. The
implementation of an optimisation technique is thus required to explore the search space,
without evaluating each combination in the search space. Various optimisation methods
were analysed in Chapter 2 and the genetic algorithm was found to be suitable for the
problem of recloser placement. Genetic algorithms tend to thrive in large search spaces
that have many local maxima and minima. The general theory and the application of the
genetic algorithm are explained in Sections 5.1 and 5.2.
5.1 THEORY
Genetic algorithms were created to mimic the process of evolution [18]. They are based on
ideas of natural selection and genetics. Natural selection results in the ‘survival of the
fittest’, as proposed by Charles Darwin. Where there is competition between individuals
for any resource, the fittest individuals dominate over the weaker ones. The impact of
genetics is that the fit individuals are considered to have ‘good’ genes and the offspring of
two fit individuals have the possibility of being better than either parent. The phenomena
of natural selection and genetics ensure the improvement of each successive generation.
The steps involved in the application of a genetic algorithm are as follows:
A set of individuals is selected randomly from the search space. Each individual in
this case would consist of a set of various recloser positions, which is a candidate
solution.
A fitness score, based on the objective function, is calculated for each individual.
This represents the ability of an individual to compete or to qualify as a ‘parent’ for
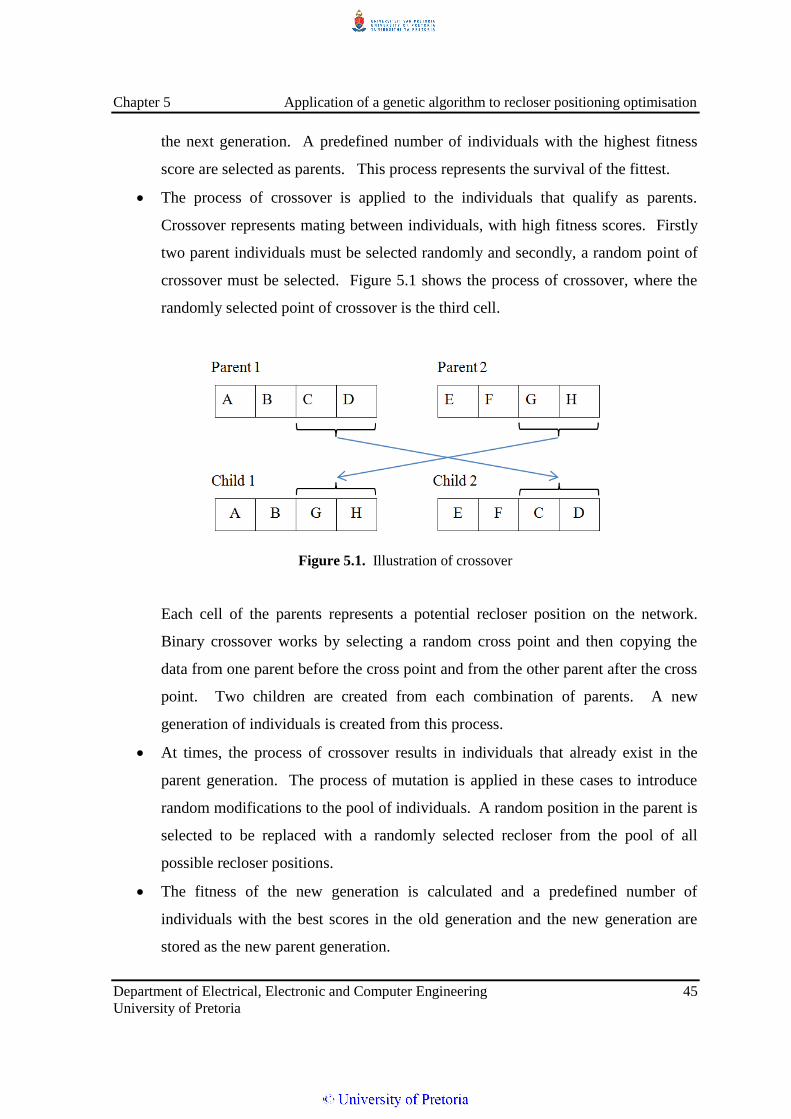
Chapter 5 Application of a genetic algorithm to recloser positioning optimisation
Department of Electrical, Electronic and Computer Engineering 45
University of Pretoria
the next generation. A predefined number of individuals with the highest fitness
score are selected as parents. This process represents the survival of the fittest.
The process of crossover is applied to the individuals that qualify as parents.
Crossover represents mating between individuals, with high fitness scores. Firstly
two parent individuals must be selected randomly and secondly, a random point of
crossover must be selected. Figure 5.1 shows the process of crossover, where the
randomly selected point of crossover is the third cell.
Figure 5.1. Illustration of crossover
Each cell of the parents represents a potential recloser position on the network.
Binary crossover works by selecting a random cross point and then copying the
data from one parent before the cross point and from the other parent after the cross
point. Two children are created from each combination of parents. A new
generation of individuals is created from this process.
At times, the process of crossover results in individuals that already exist in the
parent generation. The process of mutation is applied in these cases to introduce
random modifications to the pool of individuals. A random position in the parent is
selected to be replaced with a randomly selected recloser from the pool of all
possible recloser positions.
The fitness of the new generation is calculated and a predefined number of
individuals with the best scores in the old generation and the new generation are
stored as the new parent generation.

Chapter 5 Application of a genetic algorithm to recloser positioning optimisation
Department of Electrical, Electronic and Computer Engineering 46
University of Pretoria
This process is repeated until a certain number of generations are reached. The
average fitness of each successive generation will tend to improve with the
progression of this process of recombining portions of fit individuals.
Although genetic algorithms are randomised, they exploit historical data to focus the
search into areas with superior performance within the search space.
5.2 THE APPLICATION TO RECLOSER POSITION OPTIMISATION
Two hundred random recloser placement combinations are created, protection settings are
applied to each recloser in the set. A recloser model, which is available in the software
package, is used on the network model. The relevant delayed and instantaneous protection
settings are automatically applied to the recloser based on the philosophy detailed in
Section 3.4. The process described in Figure 5.2 is applied to the feeder.
The genetic algorithm is not applied to the case where there are only one or two reclosers
on the network since the search space is limited. The fact that there should always be a
recloser at the substation implies there is only one solution in the case of the placement of
one recloser. In the case where two reclosers are placed, there is only flexibility on the
placement of the 2nd
recloser. The fitness for every possible position of the 2nd
recloser is
assessed and the combination with the least value of the objective function automatically
becomes the best solution for the case with only two reclosers. The genetic algorithm thus
only caters for optimisation of recloser placement when the recloser count is three and
above.
Figure 5.2 is a flow chart that describes the operation of the genetic algorithm.

Chapter 5 Application of a genetic algorithm to recloser positioning optimisation
Department of Electrical, Electronic and Computer Engineering 47
University of Pretoria
Start gen=1
nmax=Max no of
reclosers
n=3
Create 200
random sets of n
recloser positions
Calculate settings
of reclosers and
evaluate fitness
function
Select best 20
vectors as parentsStore
Perform crossover
and mutation to
form 40 children
vectorsgen=gen+1
gen>10
Select 20 recloser
combinations with
least fitness
function as parents
to crossover
Store best recloser
combination
End
No
Yes
Store
Increase number
of reclosers
n=n+1
Is n=nmax
Yes
Select best
recloser
combination
No
Figure 5.2. The operation of the genetic algorithm
The algorithm begins with randomly selecting 200 vectors, each consisting of n recloser
placements on the feeder. Protection settings are automatically allocated to the reclosers
based on the network structure and the recloser placement. The fitness function of each of

Chapter 5 Application of a genetic algorithm to recloser positioning optimisation
Department of Electrical, Electronic and Computer Engineering 48
University of Pretoria
these vectors is evaluated and 20 vectors that have the minimum fitness value are selected
and stored. The selected vectors are considered to be the parent vectors of the first
generation of sequences created. The second generation of sequences is created by
applying the process of crossover on the selected 20 parent vectors. The result of crossing
over is 20 new vectors that are considered the children vectors. The children vectors are
stored into the same matrix as the original parent vectors. The matrix now contains 40
vectors, consisting of 20 parent vectors and 20 children vectors. Twenty vectors with the
least fitness function are selected from this matrix and form the parent vectors of the 2nd
generation. Ten iterations will take place before the algorithm stops. The parent vector
with the minimum fitness after 10 iterations is selected as the best recloser combination.
The recloser number is increased and this process is repeated until the maximum number
of reclosers, defined by the user is reached. The best results for each iteration done for
each recloser number is compared and the option with the lowest objective function is
deemed to be the best solution.
5.3 CHAPTER IN PERSPECTIVE
The method used for optimising the recloser placement based on the objective function
discussed in Chapter 4 is presented in this chapter. The steps of the implementation of the
genetic algorithm are discussed and the expectation of the algorithm is that it would
converge to a solution where the overall value of the objective function is minimised. The
individual factors of the objective function are not considered in isolation. If equal
weightings are given to each factor in the objective function, there is a very low chance
that any recloser position that is highly detrimental to a few factors in the objective
function would be allowed to move to the next generation. This is due to the fact that the
value of the objective function would be very high, lowering its chances of being selected
as a parent for the next generation.
In Chapter 6, the integration of the tool created for the optimisation of recloser placement
is discussed. The concepts discussed in Chapers 3, 4 and 5 are brought together in the
implementation of the tool.

CHAPTER 6 INTEGRATION OF TOOL
The optimisation of recloser placement was implemented by applying a genetic algorithm
to a specific feeder to minimise the value of the objective function discussed in Chapter 4.
The aim was to create a generic tool that could be applied to any MV distribution feeder.
The concepts explained in Chapters 3, 4 and 5 are to be applied to a real feeder.
The network model plays an important role in the results of the optimisation algorithm
discussed in Chapter 5. In previous recloser optimisation studies, fault currents of the
network were not considered and thus importance was not given to an accurate simulated
model of the MV distribution feeder. Since the calculation of fault currents plays a pivotal
role in the calculation of protection settings on the reclosers and for the calculation of the
protection-related factors in the objective function discussed in Chapter 4, importance is
given to the development of such a model of the feeder in DigSILENT PowerFactory.
6.1 NETWORK MODEL
Simplified models of the network were used in [6] and [11]. The use of simplified models
of the network limits the number of potential recloser positions on the network. Most
studies use the entire simulated network, but limit the potential recloser positions to the
backbone and the beginning of secondary branches.
DigSILENT PowerFactory is a digital simulation and network calculation tool that is
utilised to create the network model. A program was developed in DigSILENT
PowerFactory to electrically model the network, based on the data provided, using the
following components: source, terminals, lines and loads. Addendum B describes each
program module of the created tool.
The following information is required for the program to create the network:
An Excel spreadsheet with the pole numbers of every load on the network and the
corresponding number of customers and load size, as shown in Addendum A, is

Chapter 6 Integration of tool
Department of Electrical, Electronic and Computer Engineering 50
University of Pretoria
required. The pole number is the point at which a load is connected to the line.
This file is to be kept open during the running of the program.
The user is required to select the conductor type of the backbone and the branches
of the feeder from the library of the software as shown in Figure 6.1. This is done
on the ‘CreateNetwork’ module of the program.
Figure 6.1. The selection of the conductor type for the backbone and the branches
The user is required to enter the maximum number of reclosers to be considered in
the ‘randRecloserPos’ module of the program. This is shown in Figure 6.2.

Chapter 6 Integration of tool
Department of Electrical, Electronic and Computer Engineering 51
University of Pretoria
Figure 6.2. Display of where the user must enter the maximum number of reclosers to be
considered.
The following information is requested as user inputs during the execution of the program
to create the network:
The first and last column of pole number information in the provided Excel
spreadsheet is required. In Addendum A, the first column with pole number
information is column 1 and the last column with pole number information is
column 7.
The column with the customer number data is required. In Addendum A, the
column with this information is column 8.
The column number of the load size data is required. In Addendum A, the column
with this information is column 9.
The fault level at the busbar of the substation is required.
The model of the network is automatically created in DIgSILENT PowerFactory once the
program is executed, and fault simulations are possible at any point in this network. The
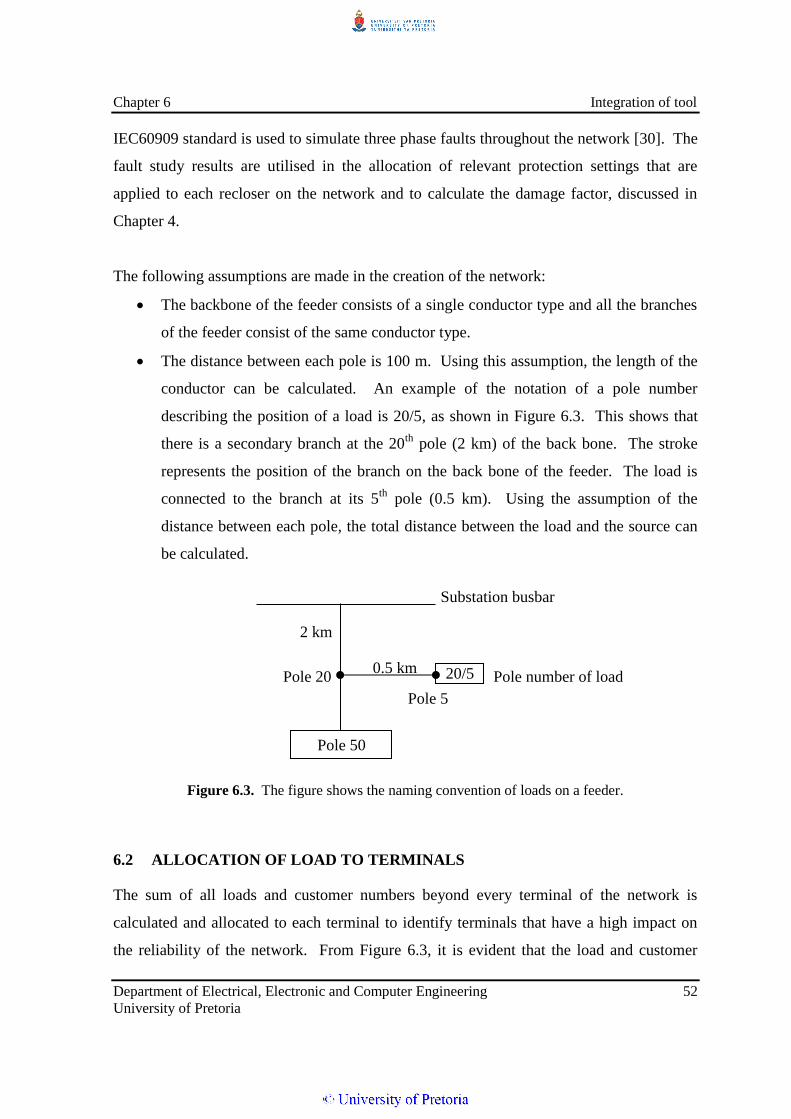
Chapter 6 Integration of tool
Department of Electrical, Electronic and Computer Engineering 52
University of Pretoria
IEC60909 standard is used to simulate three phase faults throughout the network [30]. The
fault study results are utilised in the allocation of relevant protection settings that are
applied to each recloser on the network and to calculate the damage factor, discussed in
Chapter 4.
The following assumptions are made in the creation of the network:
The backbone of the feeder consists of a single conductor type and all the branches
of the feeder consist of the same conductor type.
The distance between each pole is 100 m. Using this assumption, the length of the
conductor can be calculated. An example of the notation of a pole number
describing the position of a load is 20/5, as shown in Figure 6.3. This shows that
there is a secondary branch at the 20th
pole (2 km) of the back bone. The stroke
represents the position of the branch on the back bone of the feeder. The load is
connected to the branch at its 5th
pole (0.5 km). Using the assumption of the
distance between each pole, the total distance between the load and the source can
be calculated.
Figure 6.3. The figure shows the naming convention of loads on a feeder.
6.2 ALLOCATION OF LOAD TO TERMINALS
The sum of all loads and customer numbers beyond every terminal of the network is
calculated and allocated to each terminal to identify terminals that have a high impact on
the reliability of the network. From Figure 6.3, it is evident that the load and customer
20/5
Pole 50
0.5 km Pole number of load Pole 20
Pole 5
Substation busbar
2 km

Chapter 6 Integration of tool
Department of Electrical, Electronic and Computer Engineering 53
University of Pretoria
number at Pole 20 is equivalent to the sum of the load and customer number at Pole 20/5
and Pole 50. Every terminal modelled in the network is allocated the number of customers
and the load size that is connected to it, based on the data provided in the Excel
spreadsheet shown in Addendum A. The values stored in each terminal of the network are
utilised during the calculation of the objective function discussed in Sections 4.4 and 4.5.
6.3 DIVISION OF NETWORK INTO ZONES
The network is required to be divided into zones based on certain criteria. If a branch is
identified as a zone, every terminal within the zone has the possibility of being allocated a
recloser. The backbone is always considered as a zone, whether it meets the criteria or not.
In this study, an assumption is made that the length of any line is directly proportional to
the probability of faults on the line. Only positions that would protect a line that has a
reasonable probability of having faults is considered as a potential position for a recloser.
The length of every branch is assessed and if it is longer than 10 km, the branch is stored as
a zone. A separate zone is created for every 10 km of the branch since the maximum
length for a zone is 10 km. The beginning terminal and end terminal of each section of
line within a zone is considered as a potential position for a recloser.
This methodology does not limit the reclosers to be placed at the beginning of branches, as
in [6]-[8], [11] and [16]. The beginning and end terminal of every section within a zone
will be considered as potential positions for reclosers. Not only secondary branches will
be considered as in [6] and [9], but all branches that meet the length criteria would qualify
as a zone.
6.4 RANDOM ALLOCATION OF RECLOSERS
The maximum number of reclosers that can be allocated to any feeder is dependent on the
user’s input, but may be limited by the number of zones if the number of zones obtained
from the network is less than the user’s input. This is due to the fact that only one recloser
can be allocated per zone. The random selection of a set of N reclosers is illustrated in
Figure 6.4.

Chapter 6 Integration of tool
Department of Electrical, Electronic and Computer Engineering 54
University of Pretoria
Inputs=N
Random selection of zone
Random selection of
beginning terminal or end
terminal of selected line
section
No
End
Yes
n=1
Store recloser position
to set
n=n+1
Random selection of line
section within zone
Yes
n>N
No
Does set contain this zone
Figure 6.4. Flowchart of selection of random recloser positions
The random generation of a recloser set consists of the following processes:
A zone is randomly selected. If the zone already exists in the set, another zone is
randomly selected.
A section of line within the zone is randomly selected.
The beginning or end node of the selected section of line is randomly selected.
6.5 SIMULATION MODEL
The simulation model depicting each process that takes place in the optimisation of
recloser placement is shown in Figure 6.5.

Chapter 6 Integration of tool
Department of Electrical, Electronic and Computer Engineering 55
University of Pretoria
Create network from data
Divide network into zones
Generate 200 random sets of
recloser positions for n=3 to
n=max, apply settings and
calculate Damage factor
Generate 200 random sets of n
recloser positions, apply settings
and calculate objective funtion
End
n>max
No
Compare the best recloser set
for n=1 to max
Yes
User to define maximum number
of reclosers (max) and weights
for each parameter
Store highest value for
Damage factor to
normalize
Store 20 best recloser sets
Apply genetic algorithm
Recloser number: n=3
Recloser No : n= n +1
Store recloser set
with lowest objective
function
Select the set with the lowest
objective function
Figure 6.5. Flowchart of methodology used to obtain the optimal placement of reclosers
The tool created to optimise recloser placement implements the following steps for a given
feeder:
1. The feeder is created from the data provided in the form of Addendum A and the
user inputs that are stated in Section 6.1.

Chapter 6 Integration of tool
Department of Electrical, Electronic and Computer Engineering 56
University of Pretoria
2. The network is divided into zones as per the criteria stated in Section 6.3.
3. The user will be prompted to enter the weightings for each factor in the objective
function. These should be entered as per the priorities of the user.
4. 200 sets of recloser positions consisting of 3 reclosers each are created. Protection
settings are allocated to each recloser in each set and the damage factor for each set
is calculated and stored. The number of reclosers is incremented and the process is
repeated until the recloser number is equal to the maximum number of reclosers
specified by the user. The damage factors of all combinations of reclosers are
assessed and the maximum damage factor is stored to use as the normalisation
factor for the damage factor.
5. The number of reclosers, n, is initialised to 3 reclosers.
6. 200 sets of recloser positions consisting of n reclosers each are created. Protection
settings are allocated to each recloser in each set and the objective function for each
set is calculated and stored.
7. The top 20 recloser sets with the lowest value for the objective function are stored
as the parent generation.
8. The genetic algorithm is applied to the parent generation identified in point 7.
Refer to Figure 5.2 for details on the genetic algorithm.
9. After 10 generations, the best recloser set based on the set with the lowest objective
function is stored as the best set of n reclosers for the priorities entered in point 3.
10. The number of reclosers, n, is incremented.
11. Processes 6-10 are repeated until the number of reclosers, n, exceeds the maximum
number of reclosers specified by the user, max.
12. The best recloser sets stored for n=3 to n=max are assessed and the set with the
lowest objective function is deemed to be the overall best solution considering the
weightings specified by the user in point 3.
6.6 CHAPTER IN PERSPECTIVE
The protection settings philosophy, the objective function and the genetic algorithm
discussed in Chapters 3, 4 and 5 are integrated into the tool developed to optimise recloser
placement. The tool is able to optimise recloser placement on any feeder that has the same

Chapter 6 Integration of tool
Department of Electrical, Electronic and Computer Engineering 57
University of Pretoria
pole number naming convention as discussed in Section 6.1. The importance of the
network model is emphasised to provide fault study results, which are required for the
calculation of the protection settings applied to each recloser and for the calculation of the
damage factor in the objective function. Chapter 7 validates the results of the tool and tests
the tool on a real feeder.

CHAPTER 7 APPLICATION OF
OPTIMISATION TOOL
The optimisation tool, discussed in Chapter 6, is validated in the first section of the present
chapter to identify the individual impact of each factor of the objective function, discussed
in Chapter 3, on the recloser placement. Thereafter, the tool is applied to a real feeder and
the results are analysed and compared to the actual placement of reclosers on the network.
7.1 VALIDATION MODEL
The network model used for the validation of the tool is a hypothetical network. The
algorithm is validated on a simple 11 kV network based on the following data.
Table 7.1. The positions of loads on a feeder
Loads
Pole
number kVA Cust
1 5/1 500 50
2 6/2/75 1000 1
3 6/3/65 50 200
4 6/145 25 5
5 50/150 25 1
6 70/230 2000 300
7 90/1 25 1
Total 3625 558
The data in Table 7.1 can be visualised as in Figure 7.1. The conductor length between
each pole is assumed to be 100 m. The fault level at the busbar is assumed to be 5 kA.

Chapter 7 Application of optimisation tool
Department of Electrical, Electronic and Computer Engineering 59
University of Pretoria
Figure 7.1. Hypothetical network
The backbone and branches of the feeder are considered as possible positions for reclosers,
if the sum of all conductor lengths beyond the first node of the backbone or the branch is
longer than 5 km. The maximum possible length for a zone is 10 km. If the branch is
longer than 10 km, a new zone is created for every 10 km span of the branch. A zone can
consist of several line segments. The starting point and end point of each line segment
within a zone is considered as a possible position for a recloser. Ten zones are created
from the network depicted in Figure 7.2. Branches from pole 5 and pole 90 are only 100 m
and are therefore not defined as zones since placing a recloser at a position where the
probability of a fault is low is ineffective.
6/3
90/1 90
5/1
6/145
6/3/65
6/2/75
50/150
70/230
5
6/2 6
50
70

Chapter 7 Application of optimisation tool
Department of Electrical, Electronic and Computer Engineering 60
University of Pretoria
Figure 7.2. Division of network into zones
7.2 VALIDATION OF ALGORITHM
Each factor of the objective function is analysed in isolation from the other factors to
validate that the tool reacts as expected. The results of the application of the tool to a
hypothetical network can be analysed since it is simple, unlike the situation where the tool
is applied to a real network where the solution space is vast.
7.2.1 Results of algorithm with high priority on cost
If cost is the only weighted parameter, the obvious solution would be to place the
minimum number of reclosers. As the number of reclosers increases, the value of the
objective function increases proportionally. The logical solution would thus be to place a
single recloser at the feeder breaker.
90
50/100
6/3
90/1
5/1
6/145
6/3/65
6/2/75
50/150
70/230
5
6/2 6
50
70
6/100
70/100 70/200
0

Chapter 7 Application of optimisation tool
Department of Electrical, Electronic and Computer Engineering 61
University of Pretoria
This tool has not been designed to cater for obtaining the best recloser positioning or
number for the case where cost is the only weighted parameter. The cost function is
supposed to be used in conjunction with the other weighted parameters mentioned in this
work. This is due to the fact that the algorithm cannot differentiate between different
recloser placement options, since the objective function or the cost of all recloser
combination sets with the same number of reclosers remains constant irrespective of where
the reclosers are positioned.
7.2.2 Results of algorithm with high priority on load outages
High priority was given to minimise the risk of an outage scenario on loads connected to
the network. The weight for the load outage was set to ten and all other weights were set
to zero. The results of the tool suggested the following positions: Table 7.2. shows the
overall best solution set of recloser positions.
Table 7.2. The solution set of recloser positions
Name Recloser Positions Load lost if recloser
trips (kVA)
% Load
lost
Length
Coverage (km)
% Length
Coverage
A 0-5 start 3625 100 0.7 0.92
B 6-50 start 2025 55.86 31.5 41.61
C 6-6/2 start 1075 29.66 0.2 0.26
D 6/2-6/3 start 75 2.07 28.3 37.38
E 50-50/100 start 25 0.69 15 19.82
Table 7.3. The optimal recloser positions for varied number of reclosers
No of
Reclosers
Recloser Positions Objective
function value
Reduction in
objective value
1 A 10 -
2 A,D 7.309 2.691
3 A,B,D 4.64 2.669
4 A,B,D,E 3.533 1.107
5 A,B,C,D,E 2.817 0.716

Chapter 7 Application of optimisation tool
Department of Electrical, Electronic and Computer Engineering 62
University of Pretoria
The results indicate that the maximum number of reclosers, prescribed by the user, will be
selected to be the optimal number of reclosers. As the number of reclosers on the network
increases, the risk of the loss of supply to customers reduces. The reduction in the value of
the objective function, which represents the risk to the network, tends to become smaller as
the number of reclosers increases.
From Table 7.3, it is evident that the addition of reclosers B, D and E has a significant
impact on reducing the risk on the network. The percentage length coverage of the
reclosers that have a significant impact is high. The percentage load that is dependant on
reclosers D and E is very low, unlike recloser B, where it is high. Recloser C has a very
small impact on the overall risk since it has a very low percentage length coverage and a
high percentage load.
Reclosers should ideally be placed on spans that have a high probability of faults and
where the percentage load connected to the recloser is low. This will ensure that a large
percentage of the load will not be affected by a fault on the span of conductor whose
probability of faults is high due to the large percentage length coverage of such a span.
Placing a recloser at a position connected to 80 % of the load means that if there is a fault
on the protected span of the feeder, only 20 % of the load remains unaffected which is not
ideal. The impact of this recloser on the reduction of risk to the network would thus be
low.
Prioritizing on the load factor would improve the Reticulation Supply Loss Index (RSLI)
which is calculated using equation 7.1.
sizeLoad
timeOutagesizeLoadRSLI
)( (7.1)
If reclosers are placed in positions where the affected load under fault conditions is
minimal, RSLI can be improved.
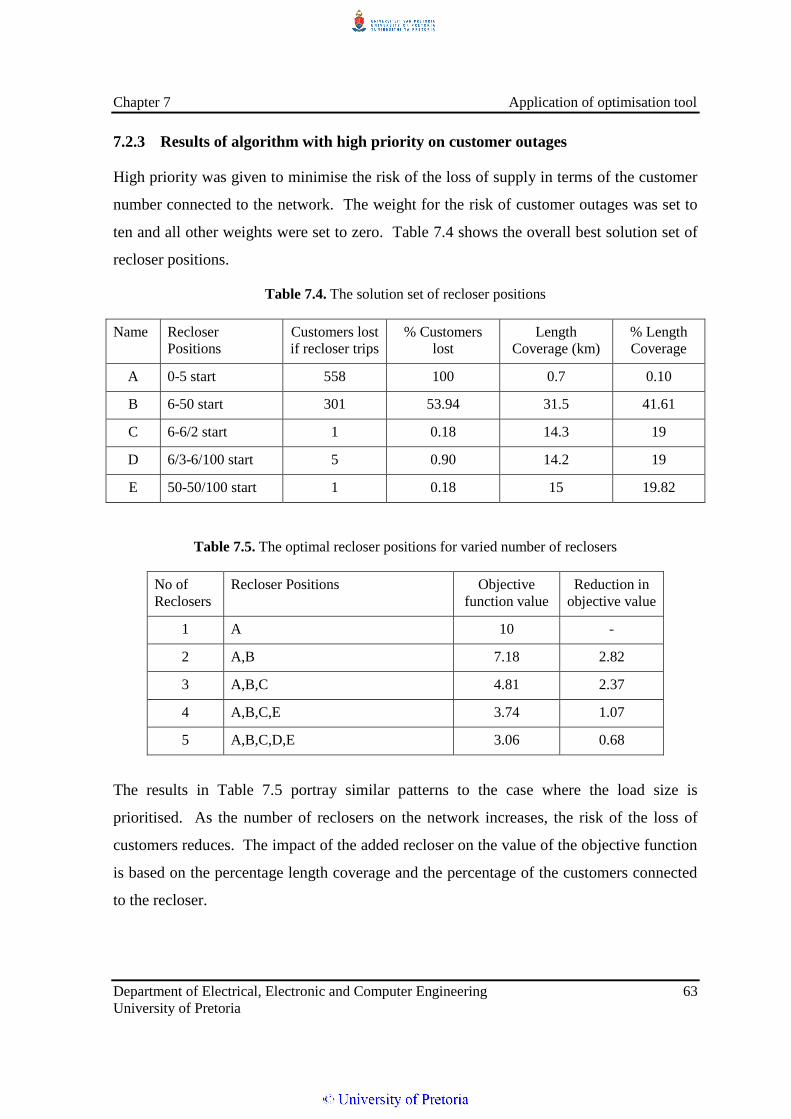
Chapter 7 Application of optimisation tool
Department of Electrical, Electronic and Computer Engineering 63
University of Pretoria
7.2.3 Results of algorithm with high priority on customer outages
High priority was given to minimise the risk of the loss of supply in terms of the customer
number connected to the network. The weight for the risk of customer outages was set to
ten and all other weights were set to zero. Table 7.4 shows the overall best solution set of
recloser positions.
Table 7.4. The solution set of recloser positions
Name Recloser
Positions
Customers lost
if recloser trips
% Customers
lost
Length
Coverage (km)
% Length
Coverage
A 0-5 start 558 100 0.7 0.10
B 6-50 start 301 53.94 31.5 41.61
C 6-6/2 start 1 0.18 14.3 19
D 6/3-6/100 start 5 0.90 14.2 19
E 50-50/100 start 1 0.18 15 19.82
Table 7.5. The optimal recloser positions for varied number of reclosers
No of
Reclosers
Recloser Positions Objective
function value
Reduction in
objective value
1 A 10 -
2 A,B 7.18 2.82
3 A,B,C 4.81 2.37
4 A,B,C,E 3.74 1.07
5 A,B,C,D,E 3.06 0.68
The results in Table 7.5 portray similar patterns to the case where the load size is
prioritised. As the number of reclosers on the network increases, the risk of the loss of
customers reduces. The impact of the added recloser on the value of the objective function
is based on the percentage length coverage and the percentage of the customers connected
to the recloser.

Chapter 7 Application of optimisation tool
Department of Electrical, Electronic and Computer Engineering 64
University of Pretoria
The choice of the recloser position at 6/2-6/3 in the case where high priority is given to the
load size is replaced by 6/3-6/100 when the priority is given to the customer number. This
is due to the fact that the number of customers connected to 6/2/-6/3 is 225 (40.32 %),
whereas the number of customers connected to 6/3/-6/100 is 5 (0.9 %). Placing a recloser
at 6/3/-6/100 would ensure that 99.1 % of customers are still connected for a fault on the
protected span of the network, where there is a 19 % probability of fault occurences, which
is equivalent to the percentage length coverage of the recloser.
Reclosers should ideally be placed on spans that have a high probability of faults and
where the percentage of customers connected to the recloser is low. In this way, a large
percentage of the customers will not be affected by a fault on the span of conductor where
the probability of having a fault is high.
Prioritizing the risk for customer outages would improve the SAIDI and SAIFI since
reclosers are placed in positions where the affected number of customers under fault
conditions is minimal.
7.2.4 Results of algorithm with high priority on damage factor
When damage is the only weighted parameter, the solution tends to consist of recloser
positions where the most effective high-sets can be implemented. The algorithm suggests
that installing one recloser at the feeder circuit-breaker is the best solution to minimise
damage. One recloser at the substation with a high-set set to twice the fault level at the
furthest reach is the most effective high-set application and is thus the best solution if the
damage factor is the only consideration.
With each recloser addition to the network, the high-set applied to the feeder breaker
increases, increasing the value of the objective function. Since the high-set of the feeder
breaker is set to a multiple of the fault current at the downstream recloser, positions with
the lowest close-up fault would be appropriate to enable the application of a lower high-set
on the feeder breaker. Applying a lower high-set on the feeder breaker would minimise the

Chapter 7 Application of optimisation tool
Department of Electrical, Electronic and Computer Engineering 65
University of Pretoria
damage caused to the network, since most of the feeder’s conductors would be protected
by the instantaneous trip of the high-set on the feeder breaker.
Table 7.6 shows the best values of the objective function for various numbers of reclosers.
It shows how the value of the objective function or the damage increases as the number of
reclosers increase. The best recloser set with two reclosers consists of the feeder breaker
and a recloser at pole 70/230, where the fault current level is the lowest at 232 A. Only
positions with low fault current levels are selected as the number of reclosers increase.
The high-set of the feeder circuit-breaker will be set to 1.5 times the maximum fault level
at the positions of the downstream reclosers.
Table 7.6. The objective function values for varied number of reclosers
No of
Reclosers
Objective
function value
Increase in
objective value
1 1.29 -
2 1.38 0.09
3 1.69 0.31
4 1.7 0.01
5 1.79 0.09
The algorithm tends to select potential recloser positions that are furthest away from the
source and that are not in series with each other. The increase in the value of the objective
function can be observed from Table 7.6 as the number of reclosers on the network
increases. The increase in the value is not due to the time delay as a result of grading
between reclosers, but rather the magnitude of the instantaneous high-set current pick up
value on the feeder breaker.
The damage factor is dependent on the number of reclosers and the positions of reclosers,
but its sensitivity to the position of reclosers is very high. The position of downstream
reclosers has a huge impact on the possibility of applying a high-set to the upstream

Chapter 7 Application of optimisation tool
Department of Electrical, Electronic and Computer Engineering 66
University of Pretoria
recloser. Placing a recloser near the feeder breaker would highly reduce the chance of
applying an instantaneous high-set on the feeder breaker due to the insignificant difference
in the magnitude of the short-circuit current between the feeder circuit-breaker and the
recloser location.
If the damage factor is given a very high weighting in comparison to the other factors, the
solution will tend to have a lower number of reclosers and the selected locations for
reclosers will tend to be at positions where the fault level is very low.
7.2.5 Results of algorithm with high priority on recloser pickup limits
High priority was given to minimise the difference between the current pickup of the
recloser and the conductor rating of the feeder. This is to ensure that the feeder does not
trip on load as a result of setting reclosers sensitive enough to detect faults at the furthest
reach of the recloser. The positioning of reclosers on the network affects the furthest reach
of reclosers. The weight for the recloser pickup was set to ten and all other weights were
set to zero. Table 7.7. shows the overall best solution set of recloser positions.
Table 7.7. The best solution set of recloser positions
Name Recloser Positions
A 0-5 start
B 50-50/100 end
C 50/100-50/150 end
D 70-70/100 start
E 70/100-70/200 start
The best recloser set is the one that ensures that majority of the reclosers on the feeder can
be set as close as possible to the emergency rating of the conductor it is connected to. The
pick-up should be sensitive enough to detect 80 % of phase-to-phase fault current at the
end of the intended reach, allowing for the bypassing of one immediate downstream

Chapter 7 Application of optimisation tool
Department of Electrical, Electronic and Computer Engineering 67
University of Pretoria
recloser. Table 7.8 shows all the load points and the corresponding fault current that the
installed protection on the feeder must detect.
Table 7.8. Fault levels at the load points on the network
The furthest reach of the feeder is at pole 70/230 and the protection on the feeder must be
sensitive enough to detect a fault of 160 A. If the feeder circuit-breaker is the only
protection on the feeder, the pick-up must be set to 160 A, although the backbone of the
feeder consists of Hare conductor and has an emergency rating of 380 A. This would be
detrimental to the operation of the feeder if the actual load is higher than 160 A, as the
feeder would consistently trip on load. If the feeder circuit breaker is set lower than the
conductor rating, all downstream reclosers will have to be set even lower than the feeder
breaker for grading purposes. The current pick-up of the feeder circuit breaker is thus
critical.
From the results displayed in Table 7.7, it is evident that the addition of two reclosers
between the feeder breaker and the two load points with the lowest fault currents at poles
70/230 and 50/150, produces the best results. The addition of these reclosers enables the
exclusion of the fault levels at poles 70/230 and 50/150 from the furthest reach of the
feeder breaker. Reclosers B and C are required to pick up for a fault at pole 50/150 and
reclosers D and E are required to pick up for a fault at pole 70/230. The feeder circuit-
Load
points
80 % of phase-to-phase fault
current at load point (kA)
6/2/75 0.50
70/230 0.16
90/1 0.77
6/3/65 0.55
5/1 2.84
6/145 0.28
50/150 0.24

Chapter 7 Application of optimisation tool
Department of Electrical, Electronic and Computer Engineering 68
University of Pretoria
breaker would only need to reach until reclosers C and E considering the allowance for the
bypassing of one immediate downstream recloser. Since the maximum number of
reclosers has been pre-defined to be 5, the results do not cater for the furthest reach at pole
6/145.
This factor would drive an increase in the number of reclosers on the network, based on the
number of load points that would be a limiting factor on the pickup setting of reclosers.
7.2.6 Results of algorithm with mixed weighting factors
The analysis of each factor of the objective function in isolation from the others is now
complete. The combined effect of each factor in the objective function is expected to
produce results that are balanced. If unit weighting is given to each factor, the results are
as shown in Table 7.9.
Table 7.9. Selected recloser positions for unit weighting on each factor
Name Recloser Positions
A 0-5 start
B 6-6/2 start
C 50-50/100 start
D 70-70/100 start
Although all factors are given equal weights, the results tend to prioritise the cost, load and
customer factors, rather than the damage factor and the pick-up limit factor. The results
look similar to the solution when the customer and load factors are the only priorities, but
the number of reclosers has reduced by one due to the cost factor. Due to the position of
recloser B, the application of a high-set on the feeder circuit-breaker is not possible. Since
there is no other recloser on the backbone of the feeder, the backbone would be protected
by the NI element of the feeder circuit-breaker only, which is not ideal. With the
placement suggested in Table 7.9, the issue of reclosers being set below the line rating of
the conductor connected to it is not addressed.

Chapter 7 Application of optimisation tool
Department of Electrical, Electronic and Computer Engineering 69
University of Pretoria
If the weighting is changed such that the damage is given twice the priority of the other
factors, the results are as displayed in Table 7.10.
Table 7.10. Selected recloser positions for damage having twice the weighting in comparison to
all other factors in the objective function.
Name Recloser Positions
A 0-5 start
B 6-6/2 end
C 50-50/100 start
D 70-70/100 start
E 6-50 start
An increased weighting on the damage factor results in the addition of a recloser on the
backbone at E. In Section 7.2.4, the observation was that the damage increases as the
number of reclosers increases. This generalisation cannot be made when other factors in
the objective function are also allocated a certain priority. The addition of the recloser at E
ensures instantaneous protection for most of the backbone from pole 6 to pole 90. At the
same time, it excludes the loads beyond reclosers C and D from the feeder breaker’s
intended reach. The feeder breaker will thus not be limited by the low fault levels at poles
70/230 and 50/150.
The allocation of the recloser at 6-6/2 is driven by the priority given to loss of customers
and loads. Having the feeder breaker with a recloser at 6-6/2 results in the application of a
low high-set on the recloser at 6-6/2, but the application of a high-set on the feeder breaker
would not be possible due to the insignificant difference in the magnitude of the short-
circuit current between the feeder circuit-breaker and the recloser at 6-6/2. Adding a third
recloser at 6-50 in this case would reduce the damage factor significantly, since an
effective high-set can be applied to it. The section of conductors beyond this point was
previously protected by the NI element of the feeder breaker, but with the addition of the
recloser, it would be protected by the instantaneous element of the recloser at 6-50.
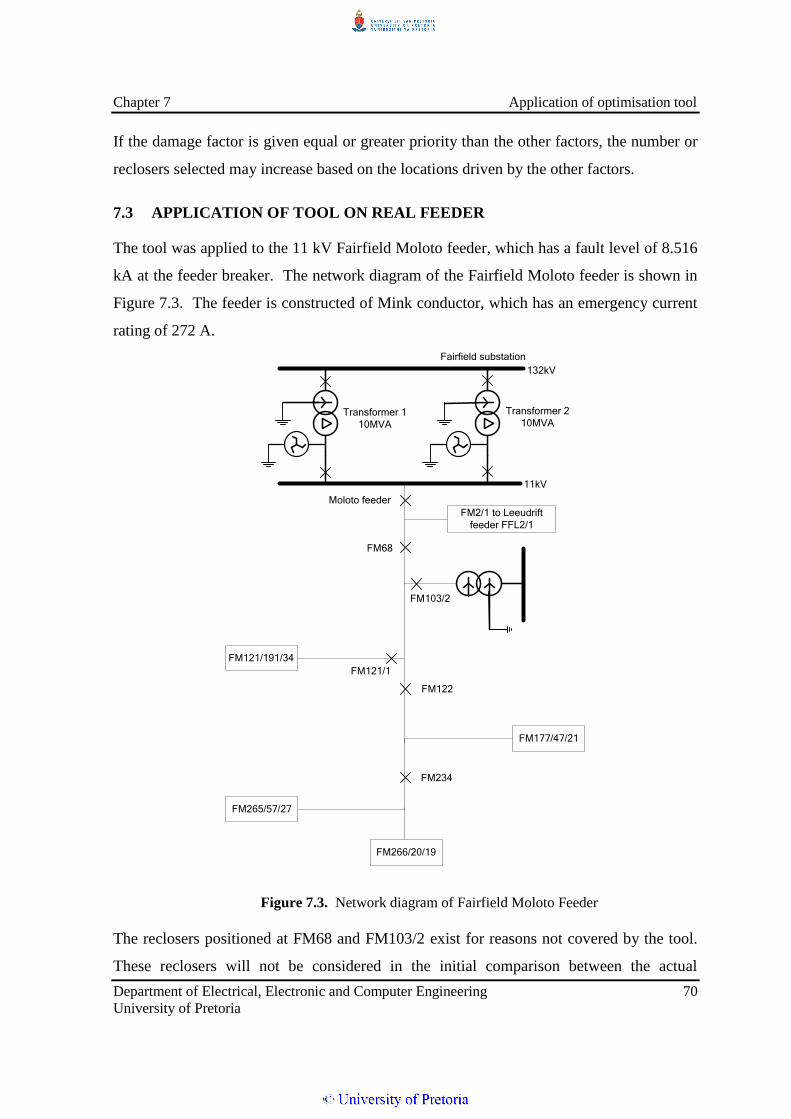
Chapter 7 Application of optimisation tool
Department of Electrical, Electronic and Computer Engineering 70
University of Pretoria
If the damage factor is given equal or greater priority than the other factors, the number or
reclosers selected may increase based on the locations driven by the other factors.
7.3 APPLICATION OF TOOL ON REAL FEEDER
The tool was applied to the 11 kV Fairfield Moloto feeder, which has a fault level of 8.516
kA at the feeder breaker. The network diagram of the Fairfield Moloto feeder is shown in
Figure 7.3. The feeder is constructed of Mink conductor, which has an emergency current
rating of 272 A.
11kV
132kV
FM103/2
FM68
FM121/191/34
FM121/1
FM122
FM177/47/21
FM234
FM265/57/27
FM266/20/19
Fairfield substation
Moloto feeder
Transformer 1
10MVA
Transformer 2
10MVA
FM2/1 to Leeudrift
feeder FFL2/1
Figure 7.3. Network diagram of Fairfield Moloto Feeder
The reclosers positioned at FM68 and FM103/2 exist for reasons not covered by the tool.
These reclosers will not be considered in the initial comparison between the actual

Chapter 7 Application of optimisation tool
Department of Electrical, Electronic and Computer Engineering 71
University of Pretoria
positioning on site and the tool’s proposed positions. According to Figure 7.3, provision to
feed an adjacent feeder is made at FM2/1. The purpose of the recloser at FM68 is thus to
ensure that faults on the Fairfield Moloto feeder do not affect the adjacent feeder in the
case of faults on Fairfield Moloto feeder. The recloser at FM103/2 is solely placed for the
protection of the transformer.
The results of the tool with equal weightings for each factor in the objective function are as
follows:
Table 7.11. Selected recloser positions for unit weighting on each factor
Name Recloser positions
A 0-82 start
B 121-121/3 start
C 121-123 start
D 237-243 end
Table 7.12. Comparison of objective function values for various cases
Parameter Selected
recloser
positions
Actual
placement,
without FM68
and FM103/2
Actual
placement
Customer risk 0.370 0.417 0.415
Load risk 0.323 0.327 0.326
Damage 0.371 0.352 0.408
Cost 0.400 0.400 0.600
Pick-up limit 0.444 0.444 0.197
Total 1.908 1.940 2.143
The proposed recloser placement for unit weighting on each factor in the objective
function shown in Table 7.11 is very similar to the actual recloser placement without the

Chapter 7 Application of optimisation tool
Department of Electrical, Electronic and Computer Engineering 72
University of Pretoria
reclosers at FM68 and FM103/2. A comparison of the factors within the objective function
is shown in Table 7.12 for the proposed recloser placement and the actual recloser
placement. The impact of the additional 2 reclosers at FM68 and FM103/2 is as follows:
It has very little impact on the the risk of losing customers and loads as the critical
positions for improvement are already in place.
The damage factor deteriorates as the instantaneous high-set on the feeder is set
higher than in the case when there was no recloser at FM68.
The cost factor increases due to the addition of 2 reclosers.
The pick-up limit factor improves due to the addition of the recloser at FM68. The
feeder circuit-breaker is not required to detect a fault at FM121/114/42 where the
three phase fault level is 379.7 A due to the presence of the recloser at FM68.
The tool provides a sound manner in which recloser combinations can be compared in
terms of the risk of losing customers and load, the risk of false tripping, cost and damage.
The magnitude of each factor of the objective function could give an indication to the user
on areas that could be improved and thus indicate the need for an increased weighting
factor on the specific factor that needs to be improved. The improvement of the pick-up
limit in this case is possible by allocating a greater weighting to the factor.
7.4 CHAPTER IN PERSPECTIVE
The algorithm has been validated and tested and is a practical tool that can be applied to a
real feeder. In the process of validating the solutions of the tool when each factor is
considered in isolation, logical recloser placements were observed based on each factor.
The addition of the protection related factors to the objective function, such as the damage
factor and the limitations on the current pickup settings of reclosers, caters for recloser
positions that would previously not have been considered on the basis of reliability. It is
an improvement on the existing methods by way of its ability to realise the value of adding
reclosers at positions that were previously not considered. The tool tends to converge to
solutions where several factors of the objective function benefit from the placement of a
recloser at a specific positon. The tool also caters for the comparative analysis of various
sets of recloser placement, based on each factor of the objective function.

CHAPTER 8 CONCLUSION
The evaluation of the main hypothesis was facilitated by investigating the answers to the
research questions posed in Chapter 1. The first section of the present chapter summarises
the answers to these questions which were developed over the course of the study. The
hypothesis is thereafter assessed considering the research findings, and the scope for future
research is identified.
8.1 RESEARCH QUESTIONS ANSWERED
The answers to the questions are summarised below.
How will recloser number and placement change based on the priority given to the
various factors in the objective function?
The risk of the loss of customers and loads on the network will improve with the increase
in recloser numbers, but the percentage improvement will reduce as the number of
reclosers increases. The recloser positions with the highest impact on the percentage
improvement are reclosers with high length coverages and low customer or load base.
The cost factor will always drive the reduction in the number of reclosers. It is the only
factor that is not dependent on the placement of reclosers.
If the damage factor is prioritized in isolation from the other factors, the solution will tend
to have a lower number of reclosers and the selected locations for reclosers will tend to be
at positions where the fault level is very low. The practicality of applying an instantaneous
high-set on the recloser is a crucial element in the behaviour of this factor as the
application of a high-set improves the damage factor greatly.
High priority given to minimise the difference between the NI current pick-up of the
recloser and the emergency rating of the conductor ensures that the feeder will not trip for
load conditions. The pick-up limit factor would drive an increase in the number of

Chapter 8 Conclusion
Department of Electrical, Electronic and Computer Engineering 74
University of Pretoria
reclosers on the network based on the number of load points that would be a limiting factor
on the pickup setting of reclosers. Increasing the number of reclosers between the feeder
breaker and the load point would ensure that the pick-up of the feeder breaker is not
limited to 80% of the phase-to-phase fault at the load point. Instead, a downstream recloser
will cater to reach for the load point, which is an improvement as it would have a smaller
load connected to it compared to the feeder breaker. This factor would not have an effect
on the results if there are no load points where the fault current is below the emergency
rating of the conductor.
If mixed priority is given to all factors of the objective function, the weightings of each
factor defined by the user will drive the placement of reclosers. The behaviour of the
damage factor changes when considered in isolation, in comparison to when all factors of
the objective function are given a certain weighting. The damage factor may increase the
number of reclosers based on the locations driven by the other factors. If the objective
function is favourable, based on factors such as the risk to load and customers, the cost and
the risk of false tripping, the genetic algorithm will select a recloser position where the
damage can be minimised for positions that cater for the other factors. The best recloser
combination for each factor prioritized in isolation of the other factors will not cater for the
minimisation of the other factors. Recloser combinations that score well on various factors
of the objective function will tend to converge as the solution set of the tool.
What is the suggested recloser number and placement with equal priority given to
each factor in the objective function on a real network? For an actual distribution
network, how do the actual device numbers and placements compare with those
suggested by the algorithm?
The tool was applied to a real feeder and the results were compared to the actual placement
of reclosers on the network where equal priority was allocated to each factor in the
objective function. The magnitude of each factor in the objective function was used as the
basis of comparison between the two cases. The results of the tool compared well with the
actual placement of reclosers on the network, except for the reclosers that were placed on

Chapter 8 Conclusion
Department of Electrical, Electronic and Computer Engineering 75
University of Pretoria
the network for reasons not catered for in the algorithm. Excluding the reclosers that are
on the network for special purposes, the number of reclosers in both scenarios was the
same and the locations of reclosers in both scenarios were very similar. From the analysis,
areas that need to be improved can be identified from the values of each factor of the
objective function.
As a result of this research, recloser placement with a balanced priority given to each of the
factors in the objective function can be attained.
8.2 ASSESSING THE HYPOTHESIS
Answers to the research questions above facilitated the evaluation of the main hypothesis
that was proposed in Chapter 1. The hypothesis stated that:
Recloser placement studies with the additional consideration of protection-
related factors such as equipment damage and the risk of false tripping will
result in different recloser positions compared to when the priority is only on
improving reliability indices and cost.
The addition of the protection-related factors to the objective function is unique in its
ability to realise the value of recloser positions that cater for minimising the damage factor
and the possibility of tripping for load conditions. In the absence of these factors, the value
of certain recloser positions would not be identified as they would not improve reliability
or cost factors.
The importance of reliability and cost are not overruled by the addition of the protection-
related factors. In the study of mixed priorities on a hypothetical feeder, it could be seen
that the recloser positions driven by reliability and cost factors are maintained, but the
inclusion of a couple of additional reclosers at specific positions could greatly reduce the
magnitude of the protection-related factors.

Chapter 8 Conclusion
Department of Electrical, Electronic and Computer Engineering 76
University of Pretoria
8.3 OPTIMISATION OF RECLOSER PLACEMENT
While it is standard practice for planners to consider reliability and cost as the only factors
influencing recloser placement, this study has demonstrated the importance of protection as
a consideration for deciding on recloser placement. This research has confirmed that the
addition of protection related factors to the objective function can add value to the
optimisation of recloser placement. The results of this study demonstrate the importance
of considering the limitations that the placement of reclosers imposes on the protection
settings applied to reclosers on the network. The compromises made on the protection of a
feeder to cater for good reliability and reduced investment costs can be mitigated by
including protection as a consideration in the process of deciding on recloser placement.
8.4 SCOPE FOR FURTHER RESEARCH
This research into the optimisation of recloser placement has identified a number of areas
requiring further research. These include the following:
In future, consideration should be given to recloser positions that cannot be
compromised on, such as reclosers that cater for the protection a transformer on the
distribution network. This is considered a special case and the recloser position
could be included as a fixed point on the network.
A study on how various protection philosophies affect the protection-related factors
such as the damage factor and the risk of false tripping could be done. The impact
of different protection philosophies on recloser placement can also be investigated.
This study could be extended to addressing the impact of fuses and sectionalisers
on reliability.
The effect of distributed generation, such as rooftop photovoltaic installations, on
the placement of reclosers in the distribution network needs to be investigated.
8.5 CONCLUSION
Considering that the majority of the overhead line network of any utility consists of MV
distribution networks, importance must be given to the protection of the MV distribution
network. The number and placement of reclosers has been identified as a limitation to the
Chapter 8 Conclusion
Department of Electrical, Electronic and Computer Engineering 77
University of Pretoria
application of effective protection settings on MV distribution networks. The standard
practice of the protection settings engineer is to apply the best possible protection settings
on the network, within the limitations of the network structure, the recloser number and
placement. In doing this, engineering judgement is applied and certain aspects of
protection are compromised to ensure the smooth operation of the feeder. The compromise
of protection of the feeder will be avoided if protection-related factors are considered in the
planning process of optimising recloser placement. This would ensure that the feeder is
adequately protected, which would inherently have a positive effect on the lifespan of the
equipment on the feeder.

REFERENCES
[1] Eskom Holdings SOC Limited, “Integrated report 2010 Eskom Holdings SOC
Limited”, Eskom Holdings SOC Limited, Johannesburg, South Africa, 2010.
[2] National Energy Regulator of South Africa, “Design of Eskom distribution incentive
scheme for MYPD2 (2010/11-2012/13),” NERSA, Pretoria, South Africa, Rep. 2010.
[3] IEEE/IEC High-voltage switchgear and controlgear - Part 111: Automatic circuit
reclosers and fault interrupters for alternating current systems up to 38 kV," IEEE Std
C37.60-2012, Sept. 2012.
[4] R. C. Dorf, “Protection,” in Transmission and distribution electrical engineering,3rd
ed. Burlington: Elsevier, 2007, ch. 10, sec. 1, pp. 269-340.
[5] M. Raoofat and A. R. Malekpour, “Optimal allocation of distributed generations and
remote controllable switches to improve the network performance considering
operation strategy of distributed generations,” Elect. Power Components and Syst.,
vol. 23, no. 16, pp. 1809-1827, 2011.
[6] A. H. Hashim, A. M. Mohamad, I. Z. Abidin, M. Z. Baharuddin and E. C. Yeoh,
“Determination of auto-recloser location using cost analysis in the Sabah electricity
distribution network,” in Power and Energy Conference, 28-29 November, 2006,
Putrajaya, Malaysia, IEEE International Volume, 2006, pp. 587-590.
[7] L. G. W. da Silva, R. A. F. Pereira, J. R. Abbad and J. R. S. Mantovani,
“Optimised placement of control and protective devices in electric distribution
systems through reactive tabu search algorithm,” Elect. Power Syst. Research,
vol.78, no. 3, pp. 372-381, Mar. 2008.
[8] N. Dehghani and R. Dashti, "Optimization of recloser placement to improve
reliability by genetic algorithm," Energy and Power Engineering, vol. 3 no. 4, pp.
508-512, 2011.
[9] S. Salhi and J. C. James, “The location of protection devices on electrical tree
networks: a heuristic approach,” J. Operational Research Soc., vol. 51, no. 8, pp.
959-970, Aug. 2000.
[10] F. Soudi and K. Tomsovic, “Optimized distribution protection using binary
programming," IEEE Trans. Power Del., vol. 13, no. 1, pp. 218-224, Jan. 1998.
[11] R. Billinton and S. Jonnavithula, “Optimal switching device placement in radial
distribution systems,” IEEE Trans. Power Del., vol. 11, no. 3, pp. 1646-1651, Jul.
1996.

Department of Electrical, Electronic and Computer Engineering 79
University of Pretoria
[12] L. G. W. da Silva, R. A. F. Pereira and J. R. S. Mantovani, “Allocation of protective
devices in distribution circuits using nonlinear programming models and genetic
algorithms,” Elect. Power syst. Research, vol. 69, no. 1, pp. 77-84, Apr. 2004.
[13] D. H. Popović, J. A. Greatbanks, M. Begović and A. Pregelj, “Placement of
distributed generators and reclosers for distribution network security and reliability,”
Int. J. Elect. Power & Energy Syst., vol. 27, no. 6, pp. 398-408, Feb. 2005.
[14] W. Tippachon and D. Rerkpreedapong, “Multiobjective optimal placement of
switches and protective devices in electric power distribution systems using ant
colony optimization,” Elect. Power Syst. Research, vol. 79, no. 7, pp. 1171-1178,
Feb. 2009.
[15] J. Teng and C. Lu, “Feeder-switch relocation for customer interruption cost
minimization,” IEEE Trans. Power Del., vol. 17, no. 1, pp. 254-259, Jan. 2002.
[16] S. Salhi, C. Robertson, and R. A. Cuninghame-Green, “Location of protection
devices on electrical tree networks,” The Journal of the Operational Research
Society, vol. 46, no. 12, pp. 1407-1417, 1995.
[17] Protective relays application guides, 3rd ed. Stafford, England: GEC Alsthom T&D,
1995, pp. 235-254.
[18] D. Karaboga and D. Pham, “Introduction,” in Intelligent optimisation techniques, 1st
ed. London, England: Springer - Verlag, 2000, ch. 1, sec. 1.1, pp.1–47.
[19] Electricity supply – Quality of supply – Part 3: Procedures for measurement and
reporting, NRS 048-3, 2002.
[20] A. A. Chowdhury and D. O. Koval, “Value-based distribution system reliability
planning,” IEEE Trans. Ind. Appl., vol. 34, no. 1, pp. 23-29, Feb. 1998.
[21] Determination of conductor current ratings in Eskom, ESKASABK1, June 2000.
[22] M. Michael, P. Stephan and J. Stefan, “Elongation of overhead line conductors under
combined mechanical and thermal stress,” in International Conference on Condition
Monitoring and Diagnosis, 21-24 April, 2008, Beijing, China, pp. 671-674.
[23] G. A. Davidson, T. E. Donoho, P. R. H. Landrieu, R. T. Mcelhaney and J. H.
Saeger, “Short-time thermal ratings for bare overhead conductors,” IEEE Trans.
Power App. and Syst., vol. 88, no. 3, pp. 194-199, July 1969.
[24] G. Parise and M. Adduce, "Conductor protection against short circuit current:
available I*2t evaluation," in 1998 IEEE of the Industry Applications Conference -

Department of Electrical, Electronic and Computer Engineering 80
University of Pretoria
Thirty-Third IAS Annual Meeting, 12-15 Oct, 1998, St. Louis, USA, vol.3, pp.2336-
2341.
[25] M. Mitolo and M. Tartaglia, "An analytical evaluation of the factor k2 for protective
conductors," IEEE Trans. Ind. Appl., vol. 48, no. 1, pp. 211–217, Jan. 2012.
[26] Distribution policy - Parts 2 & 15: Policy for neutral earthing for electrical networks,
DPL 34-2149, August 2010.
[27] Eskom distribution standard Part 4: Medium voltage distribution Section 5:
Protection part 2: Settings philosophy, DST 34-1197, February 2008.
[28] Standard for back-up protection on 11kV up to and including 132kV networks,
SCSASABG8, October 2003.
[29] J. C. Gomez and M. M. Morcos, “Voltage sag mitigation using overcurrent
protection devices,” Elect. Power Components and Syst., vol. 29, no. 1, pp. 71-81,
2001.
[30] Short circuit currents in three-phase AC systems, Part 1: Factors for the calculation
of short circuit currents, IEC 60909-1, 2002.

Department of Electrical, Electronic and Computer Engineering 81
University of Pretoria
ADDENDUM A
The pole numbers of loads connected to a sample feeder are shown below. The size of the
load and the number of customers connected to the specific pole number are specified in
the table below.
Load Pole number of loads Size of Load
(kVA)
Number of
customers
1 112 7 50 98
2 114 1 25 50
3 121 10 9 2 25 34
4 121 114 42 100 165
5 121 114 5 3 25 1
6 121 124 18 25 47
7 121 13 25 2
8 121 136 25 50
9 121 140 200 44
10 121 143 25 1
11 121 146 100 72
12 121 149 100 5
13 121 3 50 130
14 121 40 16 15
15 121 4 11 1 25 2
16 121 4 12 25 2
17 121 41 3 25 85
18 121 4 13 1 25 1
19 121 4 2 25 33
20 121 4 22 3 25 1
21 121 4 29 25 1
22 121 4 3 25 50
23 121 44 6 32 62
24 121 46 2 50 93
25 121 4 9 1 50 34
26 121 4 9A 1 50 1
27 121 5 50 89
28 121 65 2 50 2
29 121 69 4 25 48
30 121 69 5 3 25 57
31 123 1 25 99

Department of Electrical, Electronic and Computer Engineering 82
University of Pretoria
32 143 10 1 25 2
33 143 11 25 46
34 143 17 2 25 49
35 143 26 50 2
36 143 28 25 1
37 143 8 1 50 3
38 177 20 4 25 10
39 177 20 9 25 21
40 177 39 100 1
41 177 47 15 2 25 1
42 177 47 16 25 47
43 177 47 2 100 1
44 177 47 21 25 2
45 177 55 1 25 2
46 177 62 25 1
47 184 3 100 8
48 188 1 100 5
49 204 10 5 2 25 1
50 204 10 7 25 2
51 204 11 100 1
52 216 9 50 4
53 219 9 50 1
54 233 1 25 40
55 233 6 100 2
56 237 4 25 1
57 243 17 5 25 1
58 243 20 13 25 1
59 243 20 4 2 25 1
60 243 2 2 25 1
61 243 28 1 25 1
62 243 41 2 25 2
63 243 48 3 25 1
64 243 68 25 1
65 243 7 2 25 1
66 243 9 4 5 50 4
67 243 9 5 25 1
68 265 18 1 25 1
69 265 43 2 50 3
70 265 55 2 25 24
71 265 57 15 1 25 10
72 265 57 15 1A 26 16 4

Department of Electrical, Electronic and Computer Engineering 83
University of Pretoria
73 265 57 27 25 12
74 265 58 25 1
75 266 12 3 25 1
76 266 15 2 50 46
77 266 17 3 25 1
78 266 20 19 100 1
79 266 20 6 25 1
80 266 2 2 25 4
81 266 5 1 50 1
82 82 1 100 1
83 83 2 2 25 43
84 83 3 25 2
85 83 32 25 1
86 83 38 315 5
87 84 2 25 38
88 84 2 2 50 4
89 84 5 16 1
90 92 2 6 25 1
91 93 11 2 25 30
92 93 14 2 25 48
93 93 14 2A 25 48
94 93 14 5 25 46
95 93 2 4 25 22
96 93 29 1 25 50
97 93 30 2 25 1
98 93 7 25 5
99 93 7 1 25 48
100 99 5 25 1
101 103 2 5000 1

Department of Electrical, Electronic and Computer Engineering 84
University of Pretoria
ADDENDUM B
The program created to automatically determine the optimal number and placement of
reclosers has the following functions.
Main: This module calls each program module below.
CreateNetwork: The network is created based on the data in the Excel spreadsheet
in the format provided in Addendum A.
AllocLoadToTerm: Each terminal in the created network is allocated the number
of customers and the load size that are connected to the terminal.
FaultMatrix: The three-phase fault current is simulated at every 100 m of the
network and stored in the matrix to enable calculation of the damage factor of the
objective function without repetitive fault calculation simulations.
ZoneCreation: The assessments of each terminal of each line in the network are
done to differentiate nodes that meet the criteria to be allocated to zones, which are
the terminals that are considered as potential positions for reclosers. Each zone
consists of a set of lines with a maximum length of lines.
randRecloserPosWeights: The number of reclosers are varied from 2 reclosers to
the maxium number of reclosers specified by the user and 200 random recloser
placements are simulated for each case. This module has 2 sub-modules that
calculate the relevant settings for reclosers and calculate the damage factor of the
corresponding recloser placement. The largest damage factor obtained from this
module is stored as the normalisation factor of the damage factor.
randRecloserPos: The number of reclosers are varied from 2 reclosers to the
maxium number of reclosers specified by the user and 200 random recloser
placements are simulated for each case. This module has 3 sub-modules that

Department of Electrical, Electronic and Computer Engineering 85
University of Pretoria
calculate the relevant settings for reclosers, calculate the objective function of the
corresponding recloser placement and implement the genetic algorithm to the
created sets of reclosers.