OPTIMISATION OF FLOW MEASUREMENTS IN A … · into account in a pulsation analysis according API...
13
19th International North Sea Flow Measurement Workshop 22-25 October 2001 – Kristiansand, Norway OPTIMISATION OF FLOW MEASUREMENTS IN A PULSATING FLOW -EXPERIENCES FROM FIELD MEASUREMENTS- E. van Bokhorst and M.C.A.M. Peters TNO Institute of Applied Physics – Flow Centre Delft The Netherlands 1 ABSTRACT Analyses of unsteady flow in pipe systems are normally applied in case periodic pulsations are to be expected as a result of well known sources like reciprocating compressors or other positive displacement machinery. The API 618 Standard for reciprocating compressors recommends such a pulsation and mechanical response analysis to prevent unacceptable vibration levels and cyclic stresses in the piping and connected instrumentation. However the impact of pulsating flow on flowmeter accuracy is not considered and criteria for allowable pulsations at flowmeters in relation to metering errors are not specified in the present edition of the standard. Though it is well known that pulsations may have a considerable impact on traditional techniques like orifice metering, turbine and vortex flowmeters, moreover recent investigations have shown that also ultrasonic flowmeters may be influenced by pulsations. Flowmeter manufacturers do not often refer to uncertainties as a result of unsteady flow, nor do they define criteria with respect to allowable pulsation amplitudes or frequencies for their flowmeters. Amplitude thresholds can be defined for differential pressure type flowmeters and turbine flow meters without reference to pulsation frequency. In the case of a vortex flowmeter the pulsation frequency relative to the vortex frequency is a much more important parameter than the velocity pulsation amplitude. The impact on flowmeters differs considerably dependent on the measuring technique and the amplitude and frequency of pulsations. Little information is available so far on actual flow pulsations occurring in flow metering stations due to excitation by compressors or induced by flow due to vortex shedding at T-joints, reducers or valves. This paper shows the results of three cases in which pulsation measurements on-site have been performed and analysed for different flow metering stations with and without compressors. The first case describes the pulsating flow caused by a number of parallel-operating reciprocating compressors. We investigated the impact of modifications in the piping on the pulsation levels at the flow meters by means of our 1D-simulation software package PULSIM. The actual pulsation levels, determined by on-site measurements in the unmodified lay out, show that there is a considerable impact on a 12-inch turbine and vortex flowmeter, placed in series on the suction inlet line. In the second case on-site measurements prove that high frequency pulsations caused by centrifugal compressors are damped effectively at a relatively short distance from the compressor station dependent on the geometry of the piping. The on-site measurements convinced the parties involved that a flow metering station could be located at the same site as the compressors. The layout of the flow metering station, the gas flow velocity and density are important parameters in the occurrence of flow induced pulsations. The impact of piping geometry and gas properties is illustrated on experiences described in case studies 2 and 3. The cases described in this paper show that 1D-simulation can be an effective tool in predicting pulsation levels in flow metering stations and in optimising the lay out to obtain minimum flow and pressure pulsations in order to minimise the uncertainty in flowmeter readings. On the other hand a
Transcript of OPTIMISATION OF FLOW MEASUREMENTS IN A … · into account in a pulsation analysis according API...

19th International North Sea Flow Measurement Workshop
22-25 October 2001 – Kristiansand, Norway
OPTIMISATION OF FLOW MEASUREMENTS IN A PULSATING FLOW
-EXPERIENCES FROM FIELD MEASUREMENTS-
E. van Bokhorst and M.C.A.M. Peters
TNO Institute of Applied Physics – Flow Centre
Delft The Netherlands
1 ABSTRACT
Analyses of unsteady flow in pipe systems are normally applied in case periodic pulsations are to be
expected as a result of well known sources like reciprocating compressors or other positive
displacement machinery. The API 618 Standard for reciprocating compressors recommends such a
pulsation and mechanical response analysis to prevent unacceptable vibration levels and cyclic stresses
in the piping and connected instrumentation. However the impact of pulsating flow on flowmeter
accuracy is not considered and criteria for allowable pulsations at flowmeters in relation to metering
errors are not specified in the present edition of the standard.
Though it is well known that pulsations may have a considerable impact on traditional techniques like
orifice metering, turbine and vortex flowmeters, moreover recent investigations have shown that also
ultrasonic flowmeters may be influenced by pulsations.
Flowmeter manufacturers do not often refer to uncertainties as a result of unsteady flow, nor do they
define criteria with respect to allowable pulsation amplitudes or frequencies for their flowmeters.
Amplitude thresholds can be defined for differential pressure type flowmeters and turbine flow meters
without reference to pulsation frequency. In the case of a vortex flowmeter the pulsation frequency
relative to the vortex frequency is a much more important parameter than the velocity pulsation
amplitude. The impact on flowmeters differs considerably dependent on the measuring technique and
the amplitude and frequency of pulsations.
Little information is available so far on actual flow pulsations occurring in flow metering stations due
to excitation by compressors or induced by flow due to vortex shedding at T-joints, reducers or valves.
This paper shows the results of three cases in which pulsation measurements on-site have been
performed and analysed for different flow metering stations with and without compressors.
The first case describes the pulsating flow caused by a number of parallel-operating reciprocating
compressors. We investigated the impact of modifications in the piping on the pulsation levels at the
flow meters by means of our 1D-simulation software package PULSIM. The actual pulsation levels,
determined by on-site measurements in the unmodified lay out, show that there is a considerable
impact on a 12-inch turbine and vortex flowmeter, placed in series on the suction inlet line.
In the second case on-site measurements prove that high frequency pulsations caused by centrifugal
compressors are damped effectively at a relatively short distance from the compressor station
dependent on the geometry of the piping. The on-site measurements convinced the parties involved
that a flow metering station could be located at the same site as the compressors.
The layout of the flow metering station, the gas flow velocity and density are important parameters in
the occurrence of flow induced pulsations.
The impact of piping geometry and gas properties is illustrated on experiences described in case
studies 2 and 3.
The cases described in this paper show that 1D-simulation can be an effective tool in predicting
pulsation levels in flow metering stations and in optimising the lay out to obtain minimum flow and
pressure pulsations in order to minimise the uncertainty in flowmeter readings. On the other hand a

continuous effort in flowmeter design and signal processing is necessary to improve flowmeter
accuracy in case of disturbances like pulsations and vibrations.
2 AN OVERVIEW OF PULSATION IMPACT ON FLOWMETERS
Systematic errors caused by a pulsating flow can be positive or negative and are in general related to
flow or velocity pulsation amplitude and frequency. In contrast to the criterion of pressure pulsation as
specified in API 618 for pipe systems in relation to pulsation forces, the flow or velocity pulsation
amplitude (and frequency) determines the error in reading.
For purely sinusoidal pulsations the systematic error for orifices and turbine flowmeters can be
quantified in direct relation with flow pulsation amplitude and frequency. This aspect should be taken
into account in a pulsation analysis according API 618 and errors in reading can be estimated based on
the flow pulsations, calculated in the analyses at the flowmeter location.
In ISO/TR 33313 the threshold for differential pressure type flowmeters is defined as U’rms/Umean≤0.05
and for turbine flowmeters U’rms/Umean≤0.035, corresponding to a systematic error less than
respectively +0.125 % for orifice metering and +0.1% for a turbine flow meter.
In those case were considerable pulsation levels are calculated the study may reveal that the flowmeter
location should be altered or that additional measures are necessary to dampen pulsations to achieve
acceptable levels by means of a pulsation damper, additional friction, pipe modifications or a
combination of these. In most cases the pulsations caused by compressors are periodic, but not
necessarily sinusoidal, so that the relation between pulsation levels and misreading cannot be
quantified accurately.
An overview of the impact of pulsations on different metering techniques and references to standards
and published literature is shown in the table below:
Flowmeter
Technique
Origin of
Systematic Error
Standard
for
Flowmeter
Standard
Pulsation
Impact
Criterion in
ISO/ TR
3313
References
Dp:Orifice,
Nozzle and
Venturi
Square-root error and
gauge line errors
ISO 5167
AGA rep. 3
(API 2530)
ISO/TR
3313
Uall= 5 %
rms
1,2
Turbine Inertia of the rotor and
fluid
ISO 9951 ISO/TR
3313
Uall= 3.5 %
rms
3,4,5
Ultrasonic Aliasing error ISO TR 12765
AGA rep.9
- - 8,9
Vortex Lock-in ISO TR 12764 ISO/TR
3313
Uall= 3 %
rms
6,7
Coriolis Lock-in ISO 10790 - - 10,11,12
Electro
Magnetic
Unknown ISO - -
Table 2.1 Overview of pulsation impact on various flowmeters
3 PULSATION IMPACT ON A TURBINE AND VORTEX FLOWMETER CLOSE TO A
RECIPROCATING COMPRESSOR
A station for natural gas storage and transport is supplied with five similar reciprocating compressors
with a speed variation between 650 and 800 rpm. The station is extended with an additional
reciprocating compressor with a variable speed between 600 and 1000 rpm to obtain the maximum
flow of approximately 60.000 Nm3/hr. The gas is compressed from a suction pressure between 2600

and 7100 kPa to be stored in an underground storage at a discharge pressure between 4500 and 8600
kPa.
A pulsation analyses according to the API618 standard is required, which should also include an
analyses of the pulsation impact on the flow metering station located in the suction piping. This study
should reveal what measures are necessary to limit the maximum pulsations caused by parallel
operating compressors. A schematic layout of the gas compression and metering station is shown in
fig. 3.1
Fig.3.1 Schematic lay-out of compressor and metering station
The pulsation analyses are performed with our simulation package PULSIM, developed for the
calculation of plane-wave propagation in pipe systems and fluid machinery. The 1-D approach has
shown accurate results for low-frequency pulsations in pipe-systems restricted to a frequency f < 0.586
c/D, in which c is the speed of sound in the gas and D is the pipe diameter.
The pulsation analyses show that considerable pressure pulsations, above API618 limits, and
corresponding pulsation induced vibration forces are caused by acoustic resonances between the
compressors, mainly on suction side. As a result of the parallel operating compressors, running at
different phase and/or speed, beating pulsations will excite the pipe system. The maximum amplitude
of the beating pulsation is found by adding the individual pulsation amplitude caused by each
compressor.
The flow pulsations at the flow metering station, upstream of the compressors on suction piping are
varying between 20 % peak-to-peak for one compressor up to 100 % peak-to-peak for 5 compressors
in parallel. This flow pulsation level will cause a considerable systematic error at the turbine and
possibly also at the vortex flowmeter. The pulsation amplitude and frequency determine the error in
the turbine flowmeter reading, which is due to rotor inertia. A best estimate based on the theory of
Bonner and Lee [3,4] is that the turbine metering error ranges from +0.5 to +10%.
The analyses reveal that pulsations cannot be damped effectively by simple means, such as individual
orifice plates at the pulsation dampers, without causing excessive pressure losses at increasing flow.
An additional damper volume, size 2.5 m length and diameter 0.65 m, is recommended to reduce the
flow pulsation at the flowmeters to 2% pp for each individual compressor.
The new-installed compressor could be supplied with an acoustical filter, which dampens pulsation
levels successfully over the entire operating envelope. Originally the filter consists of a two-chamber
damper with two cylinders on each side of the compressor, which reduces the pressure pulsations
within the API 618 criteria. Further reduction is required as to reduce the maximum flow pulsation at
the flow meter, which is still 10 % pp. A secondary damper volume, size 2.5 x 0.55m, has been
recommended to obtain a level of approximately 2 % pp.
An overview of the reduction in pulsation levels obtained with different recommendations is shown in
the table below.

Modification Maximum flow pulsations,
U in % pp
Estimated systematic error
In turbine meter
Original lay-out 110 % pp < 10 %
Modification 1 with orifice
plates at suction dampers (dP=
1%)
50 % pp < 5 %
Additional volume bottle of 0.8
m3 at each compressor plus
orifice plates and modified
piping for new compressor
11.5 % pp < 0.5 %
Modification 2 with control
valve on each suction line with a
pressure drop of 5 %
30 % pp < 1.0 %
Fig. 3.2 Table showing the simulation results of various modifications
In addition to the model analyses we have been requested by the operator to perform on-site pulsation
measurements to be able to determine actual levels and corresponding systematic errors at the flow
meters.
Pressure pulsation measurements have been performed on 5 different locations on the 12 inch
metering section (see fig. 3.3) at various conditions with1 up to 5 compressors running.
Fig.3.3. Locations for pulsation (P) and vibration measurement (V) at the flow metering station
One of the compressors is varied in speed, whilst the others run at a fixed speed of 750 rpm. Pressure
pulsations vary slightly with speed: the maximum level measured is 40 kPa pp, which is
approximately 1 % pp of the line pressure of 4300-4500 kPa. The dominant frequency is 25 Hz,
which is 2nd harmonic of the compressor speed. This is well in line with the simulation results, which
show a 2nd harmonic resonance at 780 rpm.
We have calculated flow pulsations from the measured pressure pulsations by means of the “two-
microphone method”. The analyses show a maximum flow velocity pulsation of 2.6 m/s pp (0.91 m/s
rms) at 25 Hz. This value is measured with 3 compressors running in parallel, with a mean flow
velocity in the 12-inch metering line of 6.0 m/s (60.000 Nm3/hr). An example of the (measured)
pressure and (calculated) flow pulsation at turbine (P1) and vortex flowmeter (P3) is shown in fig. 3.4

Fig.3.4 Spectra of pressure and flow pulsation at turbine (P3) and vortex flowmeter (P2)
The corresponding systematic error at the turbine flow meter at this flow pulsation level is estimated at
+ 2.1 %, based on the manufacturer’s data and assuming a sinusoidal pulsation.
The systematic error at the vortex flowmeter cannot be determined simply as the relation between flow
pulsation and error in reading depends on the individual meter design and the sensor used. Though an
earlier investigation of different make vortex flowmeters has shown, that a pulsating flow affects the
vortex shedding process, such that the vortex shedding frequency can lock to the pulsation frequency.
The strongest lock in occurs, when fv/fp = 0.5, though lock-in also occurs at fv/fp = 0.25, .5, 1.0, 1.5,2.0
Actual lock-in has not been noticed at the maximum flow pulsation occurring at 25 Hz of 2.6 m/s
peak-to-peak at 6.0 ms/ mean flow, which is 43 % pp.
The relation between vortex frequency and bluff body diameter is presented as:
fv = Str*v/D in which:
fv : vortex frequency in Hz
Str: Strouhal number 0.3
v: flow velocity in m/s
d bluff body diameter 0.3 pipe diameter
According to this expression the vortex frequency fv for a mean flow velocity of 6.0 m/s is 20 Hz,
which is not far from the pulsation frequency of 25 Hz. For the total flow range of 1.500 – 120.000
Nm3/h the vortex frequency for the 12–inch flowmeter varies between 5 and 40 Hz.
This is partially within the range of pulsation frequencies excited by the compressors running between
600 and 1000 rpm (10 – 16.6 Hz) and exciting mainly 2nd harmonic of compressor speed. It should
also be noticed that fluctuation in pulsation and vibration levels occurs if compressors run at different
speeds. The beating frequency of the pulsation is determined by the difference in compressor speed, as
shown in the example fig. 3.5

Fig.3.5 Example of a beating pulsation as a function of time (left) and frequency spectrum 0-250 Hz
The pulsation errors on vortex flowmeters are found to be mainly negative, especially at lock-in,
though also positive errors occur if vortex frequencies are approaching towards pulsation frequencies.
The figures of actual flows of the flowmeters are only available as mean-hour flows, showing a
deviation between turbine and vortex flowmeter of approximately +1.5 %. This confirms the
theoretical positive systematic error of the turbine meter assuming the error in the vortex flowmeter is
negative or neutral if no lock-in occurs.
The client will now taken measure to decrease pulsation levels, as resulting from the simulation
studies. In this way systematic errors are reduced effectively to a level below 0.5 % over the entire
operating envelope of the compressors.
4 IMPACT OF PULSATIONS FROM A TURBOCOMPRESSOR AND ON AN ORIFICE
METERING STATION
A natural gas transport station at Olbernhau (Germany) is equipped with two identical centrifugal
compressors, operating single or parallel and running in a speed range of 5000-7200 rpm. The gas
flow, which varies from 180.000 to 900.000 Nm3/h, is measured on the suction side, line pressure
4200-5000 kPa, via a flow metering station provided with orifice plates.
The flow is measured via 1 up to 5 parallel lines: four 16-inch and one 6-inch metering line dependent
on the gas flow. The range of flows used for the 16-inch metering is between 100.000 and 300.000
Nm3/h. A simplified flow scheme of the compressor station is shown in fig. 4.1.
Fig.4.1. Overview of compressor and metering station Olbernhau

Fig. 4.1 Simplified Flow scheme of compressor and metering station Olbernhau
The purpose of the on-site measurements and analyses is to investigate whether pulsations caused by
turbo compressors can have an impact on an orifice flow metering station located nearby. The results
are used to establish if a flow metering station can be located at relatively short distance from the
compressor(s) for the Yamal pipeline stations. The Olbernhau station is similar to the compressor
stations to be located along this pipeline from the Yamal field to Germany and is therefore used for
this investigation.
Transducers for pressure pulsation measurements are located on the suction inlet of the turbo
compressors and on one out of four16-inch metering line at various locations:
1) P1 up to P6 directly on the 16 inch metering line
2) P7 and P8 close to the dP-transmitter at the end of the gauge lines (length 7 meter; diam. 9 mm)
3) P9 and P10 on suction inlet of the compressors
Some transducer have a small connection line (150-500 mm) whilst other transducers (P1 and P3) on
the main lines are flush-mounted.
4.1 Pressure pulsations at the vane-passing frequency
The pressure pulsations measured near the compressor in-and outlet show a dominant
component at the vane passing frequency, which corresponds to the running speed times the number
of vanes (15) An example of this measurement is shown in fig.4.2 with a level of 50 kPa (0.5 bar
peak) for location P9 at a vane passing frequency of 1530 Hz (compressor speed 6122 rpm).
Pulsations at the running speed or higher harmonics thereof are not present in the spectra.
Fig.4.1.2 Pressure pulsation and spectrum at compressor outlet

Other frequencies shown in the spectrum are 250,750,1250 and 1750 Hz, which correspond to
standing waves in the 1 inch connecting line (1/4, 3/4, 5/4 and 7/4 wavelength) to the transducer,
which has a length of 350 mm.
The spectra of pressure pulsations in the metering section from P1 up to P8 at the same condition show
considerable reduction, over a factor 100, from the vane-passing frequency component to amplitudes <
1 kPa (or 10 mbar). The maximum level is 0.5 kPa (5*10-3
bar) at location P2 at 1600 Hz; an overview
of the spectra at P2 at different compressor speeds and corresponding vane passing frequencies from
1500-1750 Hz are show in fig. 4.1.2. The flow induced pulsation in the measuring pipe is independent
of running speed and remains at 500 Hz. The amplitudes at the pressure transmitter of the orifice (P7
and P8) are even below 0.1 kPa.
fig.4.1.2. Pressure pulsation spectra at P2 on 16-inch metering line at various compressor speeds
In VDI 3733 the damping for acoustic waves in an ideal gas is expressed per unit of straight pipe
length:
Damping equals (0.15 f*T)/(D*P*293) dB per m, in which:
D: line diameter in m
f: frequency in Hz
T: temperature in degrees Kelvin
P: line pressure in Pascal
For a 24 inch line and a frequency of 1500 Hz the damping is approximately 0.004 dB/m. The
damping across bends however is dominant as it varies between 0.5 and 0.3 dB, dependent on
frequency and bend radius. The flow metering station is at a distance of 150 meter (pipe length) from
the compressors and the number of bends, tees and reducers/expanders is 20. The actual damping for
the vane passing frequencies measured is at least 40 dB, which is above the calculated level, based on
the formula mentioned above showing 10 dB.
We conclude that pulsations caused by the centrifugal compressor are reduced effectively and do not
interfere with the orifice flow measurement.
4.2. Low-frequency pulsations
The measurements on the 16-inch flow metering section and especially those near the pressure
transmitter mainly show pulsations in the range below 200 Hz. It is likely that resonances in the gauge
lines are excited due to vortex shedding. As a result of gauge line length (L=7 meter) standing waves
occur at frequency f = c/4L or odd multiplies thereof, which is 14, 42, 70,…… Hz.
This corresponds to the pressure pulsations measured at P7 and P8 and thus also in pressure difference
dP as shown in fig 4.2.1 and fig.4.2.2
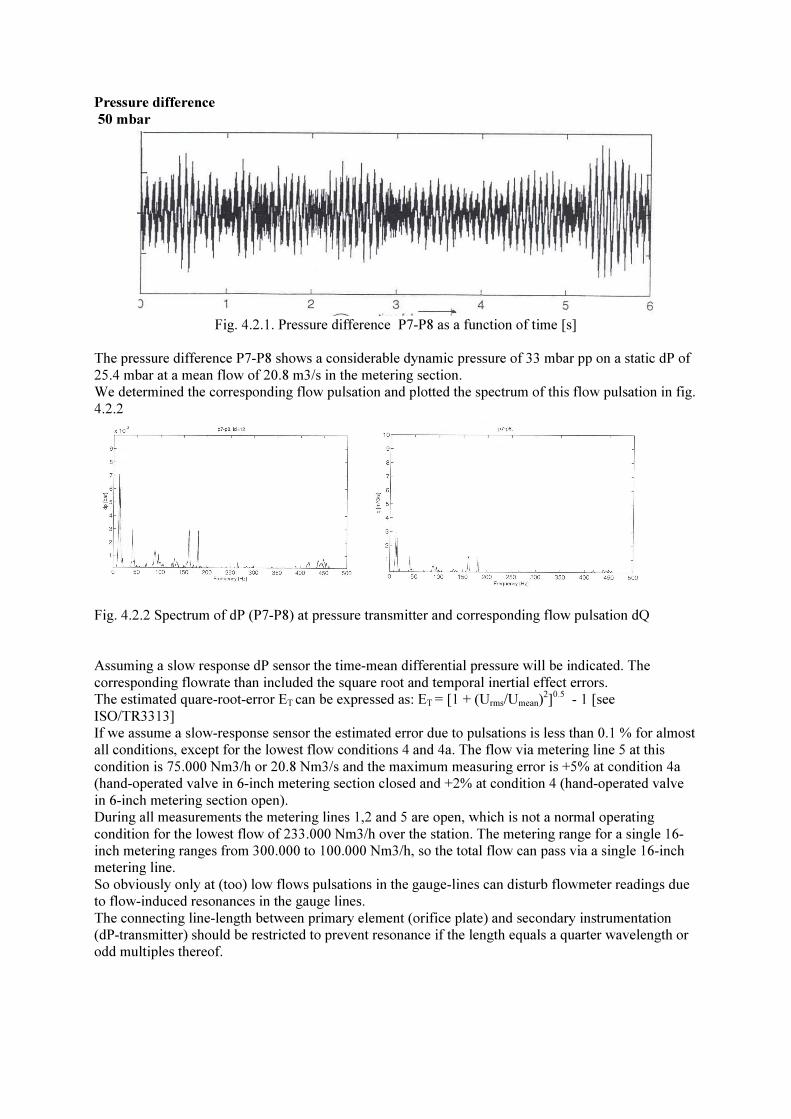
Pressure difference
50 mbar
50505
Fig. 4.2.1. Pressure difference P7-P8 as a function of time [s]
The pressure difference P7-P8 shows a considerable dynamic pressure of 33 mbar pp on a static dP of
25.4 mbar at a mean flow of 20.8 m3/s in the metering section.
We determined the corresponding flow pulsation and plotted the spectrum of this flow pulsation in fig.
4.2.2
Fig. 4.2.2 Spectrum of dP (P7-P8) at pressure transmitter and corresponding flow pulsation dQ
Assuming a slow response dP sensor the time-mean differential pressure will be indicated. The
corresponding flowrate than included the square root and temporal inertial effect errors.
The estimated quare-root-error ET can be expressed as: ET = [1 + (Urms/Umean)2]
0.5 - 1 [see
ISO/TR3313]
If we assume a slow-response sensor the estimated error due to pulsations is less than 0.1 % for almost
all conditions, except for the lowest flow conditions 4 and 4a. The flow via metering line 5 at this
condition is 75.000 Nm3/h or 20.8 Nm3/s and the maximum measuring error is +5% at condition 4a
(hand-operated valve in 6-inch metering section closed and +2% at condition 4 (hand-operated valve
in 6-inch metering section open).
During all measurements the metering lines 1,2 and 5 are open, which is not a normal operating
condition for the lowest flow of 233.000 Nm3/h over the station. The metering range for a single 16-
inch metering ranges from 300.000 to 100.000 Nm3/h, so the total flow can pass via a single 16-inch
metering line.
So obviously only at (too) low flows pulsations in the gauge-lines can disturb flowmeter readings due
to flow-induced resonances in the gauge lines.
The connecting line-length between primary element (orifice plate) and secondary instrumentation
(dP-transmitter) should be restricted to prevent resonance if the length equals a quarter wavelength or
odd multiples thereof.

The on-site measurements have shown that the high frequency pulsations caused by a turbo-
compressor are damped effectively and will not have an impact on flow metering close to the
compressors, assuming the distance is at least a 100 meter.
Considerable low-frequency pulsations did occur at the flow transmitter due to resonances in the
gauge-lines, which is excited by vortex shedding. Unsteady vortex shedding can be a strong source of
pulsations if the vortex shedding is coupled to an acoustic resonance in the system.
The PULSIM package, in which the pulsation source resulting from the source is incorporated, can be
used to analyse a flowmetering station. The package has been applied to analyse flow-induced
pulsations in a gas control station and give recommendations for the geometry to omit resonance
conditions [14]
Guidelines for the design of flowmeter instrumentation are summarised in the ISO/TR 3313 and cover
remarks with respect to both slow-response and fast-response dP-sensors for orifice metering.
5 FLOW-INDUCED PULSATIONS DUE TO VORTEX SHEDDING AND IMPACT ON
A TURBINE FLOWMETER
The gas flow metering station concerned consists of two 16-inch streams A and B, each provided with
a 16-inch turbine flow meter. TNO Institute of Applied Physics has been requested to perform
pulsation analyses to establish if flow pulsations are present and can have an impact on the accuracy of
the flow meter. When the turbine meter is subjected to an unsteady flow the inertia of the rotor can
cause the rotor speed to lag behind in an accelerating flow and to exceed it in a decelerating flow. As
the impact of a decelerating flow exceeds that of an accelerating flow the error in reading of the flow
meter subjected to pulsation will always be positive.
The total flow rate in the metering station varies between 5800 and 11000 m3/h at a line pressure
between 1300 and 1600 kPa. Measurement locations are upstream and downstream of the turbine
flowmeter and also on the reference pressure tapping as shown in the schematic lay out in fig.5.1.
There are no compressors located on-site and there is no gas control or pressure reduction in the
station. The only sources are flow-induced pulsations due to vortex shedding at T-joints or at other
obstructions in the piping geometry.
Fig.5.1 Overview of piping lay out in turbine metering station

The pressure pulsations measured on-site are ranging from 2-24 mbar pp, which is rather low: in the
order of 0.01 to 0.15 % pp of the line pressure. Main frequencies occur in the range between 0-25 Hz
with dominant components at 6, 12 and 16 Hz. An example of the spectrum of the measured pressure
and calculated flow pulsation is shown in fig. 5.2.
Fig.5.2 Measured pressure pulsations at P1 and P4 are used to calculate the flow pulsation or velocity
at P4.
The recorded pressure pulsations are analysed to calculate the corresponding flow pulsations by the
two-microphone method (2MM) as the amplitude of the flow-pulsation and frequency determines the
error as explained in chapter 2. In the 2MM a coherence analysis is performed: only those frequencies
for which the coherence > 0.95 are plotted in fig. 5.2. (So lines of the spectrum are missing if the
coherence is less than 0.95)
An overview of some results of the measurements for the various test cases are shown in table 5.2,
measurements have been performed for stream A, for stream B only and for stream A and B in
parallel. The maximum relative flow pulsation of 0.269 m/s rms or 6.6 % occurs for case 7 with
stream A and B in operation at 3330 m3/h each.
Meas. Density Flow velocity
Vmean, m/s
Pressure pulsation,
mbar
Flow pulsation,
m/s rms
Flow pulsation of
dominant
frequency in %
No. Kg/m3 VA VB P1 P2 V2 V4 V2 V4
1 10.12 10.03 11.94 1.7 1.7 0.014 - 0.2 -
2 10.22 9.94 11.53 1.9 2.1 0.014 - 0.2 -
5 11.45 6.12 7.24 2.7 1.6 0.068 0.063 2.0 1.9
6 11.45 13.36 closed 3.3 7.1 0.184 0.167 2.5 2.3
7 11.17 6.29 7.36 23.9 9.4 0.250 0.269 6.1 6.6
8 11.17 closed 13.76 11,9 9.3 0.396 0.439 5.2 5.8

We assumed a sinusoidal pulsation, with the dominant frequency in the pulsations at 12.5 Hz and
based our error analysis on the approach described in the latest edition of ISO/TR 3313. The
corresponding pulsation error for the turbine meter at 6.6% flow pulsation is + 0.2 %, whilst for all
other measured operating conditions the error is lower.
As compressors are not involved vortex shedding along a T-joint of a closed side-branch is most likely
the cause of these pulsations.
The piping geometry of the flow metering station is such that standing waves in the low frequency
range can be excited by vortices. Side branches to closed valves in stream C (not in use) and also to
A/B streams if not in use are potential locations for the occurrence of resonances. Also the closed
valve to the filter stream II offers a potential location for vortex shedding.
If we consider the case in which the 2nd filter stream B and the metering section A is closed a
configuration with 2 closed side branches is present. Vortex shedding frequencies Fv are determined
by Fv = Str V/D in which
Fv : Vortex frequency in Hz
Str: Strouhal number, for this configuration maximum source strength is obtained if Str=0.25 [13]
V: Flow velocity in the main line, m/s
The range of vortex frequencies involved is 5-11 Hz or flow velocities Fv between 6 and 13 m/s,
assuming Str=0.25 and D=0.3 meter.
Strong resonance can occur if a vortex frequency coincides with an acoustic resonance in the piping
system, such as a standing wave between the closed valves in filter stream and metering section.
For the distances involved (approx. 3 m between valve and header) the lowest standing wave
resonance frequencies are approx. 29 Hz for a single closed side-branch (1/4 wave length) and 39 Hz
for 2 closed side branches (full wavelength 9 meter).
Dependent on the configuration of the T-joint or the combination of flow direction with the acoustic
resonance the vortex shedding can result in a strong source of pulsation or even damping of unsteady
flow as described by Peters [13]. Further the effect of edge rounding is significant in determining the
source strength and the Strouhal number where the maximum source strength occurs.
It is recommended to omit long side branches with closed valves to prevent excitation of standing
resonances by vortex shedding, which can have an strong impact on flow meters located nearby.
In order to be able to predict the behaviour of such a gas metering station under various operating
conditions an analysis with the Pulsim package can be performed. Such an analysis includes:
• Building a simulation model of the gas piping involved from inlet header to outlet header,
including volumes, control sections, side branches and assuming no reflection in the headers
• Calculation of the acoustic response of different piping configurations, thus enabling us to
determine resonance frequencies and standing wave patterns in the piping
• Analysis of flow-induced pulsation sources at T-joints, bends or reducers
• Calculation of pressure and flow pulsation levels and frequencies in the pipe system caused
by these FIP sources as a function of flow rate and valve positions
• Recommendations to modify and improve the piping design or to relocate flow meters in order
to prevent flow induced pulsations, which could have an impact of the flow meters
6 CONCLUSIONS AND RECOMMENDATIONS
The experiences from field measurements that high frequency pulsations from turbomachinery are
damped sufficiently and do not have an impact on flow meters located nearby. The reduction in
pressure pulsations as observed in on-site measurements is approximately a factor 100 for the vane-
passing frequencies involved.

In case reciprocating compressors are applied strong flow pulsations can occur even if pressure
pulsations fulfil the API618 requirements for reciprocating machinery, which are based on structural
and compressor integrity.
The systematic error due to low frequency pulsations is determined by the flow pulsation amplitude
and independent of frequency when we consider dP devices and turbine flow meters. For vortex flow
meters the relation between pulsation and vortex frequency is much more important than the
amplitude, due to lock-in effects. The amplitudes measured on-site are in excess of the criteria for flow
pulsations at turbine meters defined in ISO/TR 3313. The impact of pulsations on flow meters close to
reciprocating compressor should be evaluated in a pulsation analysis. The next edition of API618 will
contain recommendations with respect to the pulsation effects on flow meters.
Low frequency pulsations due to vortex shedding in the main piping can be a strong source of
pulsations, which effect the flowmeter accuracy especially in case vortex frequencies coincide with
acoustic pipe resonances.
Evaluation of the lay out of a flow metering station in a simulation model is very effective in finding
the optimum lay out from pulsation point or to define the operating conditions, which can be run
safely.
REFERENCES
1. Mottram, R.C. “The behaviour of orifice and Venturi-nozzle meters in pulsating flow”
Ph.D.Thesis, University of Surrey (1971)
2. Studzinski,W. et al. “ Pulsation effects on orifice meter performance” Flomeko’98 Lund Sweden
pp. 417 – 422
3. Bonner , J.A. “Pulsation effects on turbine meters” American Gas Ass. Conf. Las Vegas (1976)
4. Lee, W.F.Z. et al.“Gas turbine flowmeter measurement of pulsating flow”, J. of Eng for Power
(1975, pp. 531-539)
5. Atkinson,K.N “A software tool to calculate the over-registration error of a turbine meter in
pulsating flow” Flow Meas. and Instr. 3 (3), 1992 pp. 167-172
6. Peters.M.C.A.M. et al. “Impact of pulsations on vortex flowmeters” Flomeko’98, Lund, Sweden
June 1998
7. Bokhorst. E. van et al “Impact of pipe vibrations on vortex flowmeters under operating
conditions” IFFM, June 1999, Denver Colorado (CD-Rom proceedings)
8. Hakansson E. and Delsing J. “Effects of pulsating flow on an ultrasonic gas flowmeter” Flow
Meas. and Instr. 5 (2), 1994, pp. 93-102
9. Bokhorst E. van and M.C.A.M. Peters, “ The impact of low-frequency pulsations on a dual-beam
ultrasonic flowmeter” Flomeko 2000, Salvador June 2000
10. Vetter G. and Notzon S. “Effect of pulsating flow on Coriolis mass flow meters” Flow Meas.
Instr. 5 (4) , 1994, pp. 263-273
11. Koudal O. et al “High frequency Coriolis meter performance under pulsating flow conditions”
Flomeko’98, Lund Sweden June 1998
12. Cheesewright. R. et al. “Understanding the experimental response of Coriolis massflow meters to
flow pulsations” Flow Meas. Instr. 10 (1999) pp.207-215
13. Peters, M.C.A.M. and Bokhorst, E. van “Flow induced pulsation in pipe-systems with closed side
branches, impact of flow direction” , Proceedings 7th Int. Conference on Flow Induced Vibration
Conference pp.669-676, FIV2000/Lucerne Switzerland, 19-22 June 2000
14. Egas, G. “Building acoustical models and simulation of pulsations in pipe systems with PULSIM”
Proceedings 3r Workshop “Kolbenverdichter” pp.81-108, 27-28 October, Rheine, Germany, 1999
Corresponding author:
TNO TPD
Evert van Bokhorst
P.O.Box 155, 2600AD Delft The Netherlands
Phone: + 31 15 2692346
Fax: + 31 15 2692111 or e-mail: [email protected]