
Optimisation of 3D Printed Components - Dr. James Gopsill
34
DEPARTMENT OF MECHANICAL ENGINEERING Report Submitted for the Degree of Engineering June 2015 The Optimisation of 3D Printed Components Jonathan Shindler Supervisor: Dr James Gopsill
Transcript of Optimisation of 3D Printed Components - Dr. James Gopsill

DEPARTMENT OF MECHANICAL ENGINEERING
Report Submitted for the Degree of Engineering June 2015
The Optimisation of 3D Printed Components
Jonathan Shindler
Supervisor: Dr James Gopsill

1
Acknowledgements
I acknowledge Dr James Gopsill, my supervisor, who assisted in the development of the optimisation strategy presented in this paper and for offering guidance on the writing of this paper. I also acknowledge the rest of the staff in the Language of Collaborative Manufacturing office for providing the 3D printer and filament for this research. I acknowledge Peter Whereat, the technician who assisted in setting up the three point bend test and the Instron machines in the lab. I acknowledge Dr Henry Thomas for creating and freely providing the open source program GPX, which was used as a file converter. I acknowledge Jos van der Geest for his MATLAB function insertrows.
DECLARATION
The accompanying research project report entitled: The Optimisation of 3D Printed Components is submitted in the third year of study towards an application for the degree of Master of Engineering in Mechanical Engineering at the University of Bristol. The report is based upon independent work by the candidate. All contributions from others have been acknowledged above. The supervisors are identified at the start of the report. The views expressed within the report are those of the author and not of the University of Bristol.
I hereby declare that the above statements are true.
Signed (author)
………………………………………………………………………………………………..
Full Name
………………………………………………………………………………………………..
Date
………………………………………………………………………………………………..

2
Declaration of Copyright
Certification of ownership of the copyright in a dissertation presented as part of and in accordance with the requirements for the Final Degree of Master of Engineering at the University of Bristol, Faculty of Engineering.
I hereby assert that I own exclusive copyright in the item named below. I give permission to the University of Bristol Library to add this item to its stock and to make it available for consultation in the library, and for inter-library lending for use in another library. It may be copied in full or in part for any bone fide library or research worker on the understanding that users are made aware of their obligations under the copyright legislation, i.e. that no quotation and no information derived from it may be published without the author’s prior consent.
Author
Jonathan Shindler
Title
The Optimisation of 3D Printed Components
Date of Submission
22/06/15
Signed (author)
………………………………………………………………………………………………..
Full Name
………………………………………………………………………………………………..
Date
………………………………………………………………………………………………..
This dissertation is the property of the University of Bristol Library and may only be used with due regard to the author. Bibliographical references may be noted but no part may be copied for use or quotation in any published work without prior permission of the author. In addition, due acknowledgement for any use must be made.

Summary
3 Dimensional (3D) printed components are printed with non-solid internal structures,known as infill patterns. A common infill pattern is a regular hexagonal structure. Themain aim of the research presented in this paper is to develop a strategy to optimise theinfill pattern of 3D printed components based on their loading conditions. The strategydeveloped splits the 3D printed component up into a regular rectangular grid. The stressdistribution across the component calculated by FEA (Finite Element Analysis) is used toadd more material to the cells in the grid which have higher stress values. This results inan optimised infill pattern based on the components loading conditions. To evaluate thestrategy developed, two optimised beams were created by the strategy and printed. Thesewere tested against hexagonally-infilled beams in a three point bend test. The flexuralstrength was measured and the strength-to-weight and strength-to-print time metrics werecalculated. The best-performing optimised beam scored 16.3 N/gram and 4.7 N/minutein the two metrics respectively. This represented a 55% and 27% increase respectivelycompared to the best-performing hexagonally-infilled beam which scored 10.5 N/gramand 3.7 N/minute in the two metrics respectively. The relevance of these results is that, dueto the success of testing the optimised beams, an optimisation strategy like this one couldbe incorporated into an FEA package. This would help widen the use of 3D printing inindustry as optimised 3D components are cheaper to print due to them being stronger perunit weight.
3

Contents1 Introduction 6
1.1 Fused Deposition Modelling . . . . . . . . . . . . . . . . . . . . . . . . . . . 61.2 The 3D Printing Process . . . . . . . . . . . . . . . . . . . . . . . . . . . . . 71.3 Challenges of 3D printing . . . . . . . . . . . . . . . . . . . . . . . . . . . . . 91.4 Aims and objectives . . . . . . . . . . . . . . . . . . . . . . . . . . . . . . . . 10
2 Literature review 102.1 Optimisation of 3D Printed Components . . . . . . . . . . . . . . . . . . . . . 112.2 Topology Optimisation . . . . . . . . . . . . . . . . . . . . . . . . . . . . . . 122.3 Commercial Packages . . . . . . . . . . . . . . . . . . . . . . . . . . . . . . . 13
3 Objective 1 - The Optimisation Strategy 133.1 Choice of Method . . . . . . . . . . . . . . . . . . . . . . . . . . . . . . . . . 143.2 Method Chosen . . . . . . . . . . . . . . . . . . . . . . . . . . . . . . . . . . 143.3 Using the FEA package - Flowchart Elements 1 & 2 . . . . . . . . . . . . . . . 153.4 Importing into MATLAB - Flowchart Elements 3, 4 & 5 . . . . . . . . . . . . 163.5 Performing Iterations - Flowchart Elements 6, 7 & 8 . . . . . . . . . . . . . . . 173.6 Converting and Printing - Flowchart Elements 9 & 10 . . . . . . . . . . . . . . 18
4 Objective 2 - Evaluating the Strategy 184.1 Three Point Bend Test . . . . . . . . . . . . . . . . . . . . . . . . . . . . . . 184.2 Beams Tested . . . . . . . . . . . . . . . . . . . . . . . . . . . . . . . . . . . 19
5 Results 1 - Optimised Beams 205.1 Three Point Bend Test Optimisation . . . . . . . . . . . . . . . . . . . . . . . 215.2 3D Stress Distribution Optimisation . . . . . . . . . . . . . . . . . . . . . . . 21
6 Results 2 - Testing 22
7 Discussion 237.1 Interpretation of Results . . . . . . . . . . . . . . . . . . . . . . . . . . . . . 247.2 Reliability of Results . . . . . . . . . . . . . . . . . . . . . . . . . . . . . . . 257.3 Advantages and Disadvantages of The Method . . . . . . . . . . . . . . . . . . 267.4 Scope of Work . . . . . . . . . . . . . . . . . . . . . . . . . . . . . . . . . . 27
8 Conclusion 28
9 References 28
10 Appendices i10.1 Appendix 1 - Beams Tested . . . . . . . . . . . . . . . . . . . . . . . . . . . . i10.2 Appendix 2 - Table of Results . . . . . . . . . . . . . . . . . . . . . . . . . . ii10.3 Appendix 3 - Force-Extension Graphs . . . . . . . . . . . . . . . . . . . . . . iii
4

List of Figures1 Schematic of FDM process. Reproduced from [1]. . . . . . . . . . . . . . . . . 62 Microscope image of 3D printed part labelling key features. . . . . . . . . . . . 83 Support material before (a) and after removal (b). Reproduced from [2]. . . . . 84 Different infill patterns. From left to right: Hexagonal, Concentric, Rectilinear,
Hilbert curve, Archimedean chords. Reproduced from [3]. . . . . . . . . . . . 95 Three different hexagonal infill percentages. . . . . . . . . . . . . . . . . . . . 96 Flow diagram of optimisation process. . . . . . . . . . . . . . . . . . . . . . . 157 von Mises stress contour plot of beam under 3 point bending conditions, show-
ing simple supports (red triangles) and point load (green arrow). . . . . . . . . 168 Filled contour plot showing the imported von Mises stress distribution for the
three point bended beam (Colour bar units MPa). . . . . . . . . . . . . . . . . 179 The three levels of infill used in the optimisation process. . . . . . . . . . . . . 1710 Renders of the four types of hexagonal infill percentages used. . . . . . . . . . 1911 Render of the optimised beam 3Levels. . . . . . . . . . . . . . . . . . . . . . . 2112 Render of the optimised beam Even3. . . . . . . . . . . . . . . . . . . . . . . 2113 FEA stress distribution of the cantilever beam. . . . . . . . . . . . . . . . . . . 2214 Renders of the four 2D cuts of the optimised beam. . . . . . . . . . . . . . . . 2215 Bar graphs showing the calculated metrics of the (a) hexagonally-infilled beams
and (b) the optimised beams. Equivalent infill percentages of beams in brackets. 2316 Photograph showing a 5% beam mounted on the Instron machine. . . . . . . . 2417 Renders of all the beams printed and tested. . . . . . . . . . . . . . . . . . . . i18 Force-extension graphs for all of the beams tested. . . . . . . . . . . . . . . . . iii
5

1 IntroductionAdditive manufacturing refers to a group of processes in which material is deposited layer bylayer to build up a 3 Dimensional (3D) component or model. This differs from conventionalsubtractive methods, such as milling and machining, which start with a solid billet and removematerial to create a final component.
There exists a variety of additive manufacturing techniques, of which the most commoninclude Fused Deposition Modelling (FDM), Powdered Laser Sintering (PLS) and ElectronBeam Sintering (EBS). PLS and EBS involve using a laser and an electron beam respectivelyto fuse metal powder together in lots of horizontal layers, building the model up vertically,whilst FDM melts and deposits material layer by layer through a nozzle. This research focuseson the latter and the next section describes the FDM process, and in particular, the MakerbotDesktop 2, which is the 3D printer used for this research.
1.1 Fused Deposition ModellingIn FDM, a filament of 1.75 mm diameter is heated to 230 �C and is extruded layer by layerthrough a 0.4 mm diameter nozzle onto a bed. The layer height is the height of each individualhorizontal layer and is typically set at 0.2 mm, but can be varied to improve the quality of themodel. A height of 0.1 mm is selected for high resolution models and 0.4 mm for models withlower resolution.
Figure 1 shows a schematic of the FDM process. The filament is loaded on a spool (1) andpulled through into the printer head by a small servo-motor (2). A spring-loaded tensioning unitprovides tension to the filament to allow the motor to pull the filament through into the heatingelement where it is melted. It is then deposited onto the printer bed by the nozzle (3). Theprinter bed moves in the Z (vertical) direction via a lead screw whilst the printer head movesin the X and Y directions via two toothed belts attached to stepper motors. Some printers alsohave heated beds which assist in material adhesion to the bed.
Figure 1: Schematic of FDM process. Reproduced from [1].
Thermoplastics are often the material of choice used for the FDM process; either PolylacticAcid (PLA) or Acrylonitrile Butadiene Styrene (ABS). The number of commercially availableprintable materials has been rapidly expanding for the FDM process, which include thermo-plastics, nylon, brass, flexible plastic and dissolvable plastic.
FDM systems are more commonly known as 3D printers. Recent patent expirations inthe field of 3D printing has lead to the widespread expansion of the 3D printer market. Thisexpansion is due to the decrease in price of printers as a result of increased competition and
6

also due to open-source printers such as the Rep-Rap [4]. RepRaps are bare-bones 3D printerswhich are designed to be semi self-replicable and require assembly by the user. Canalys, anindustry analyst, has predicted that the global market for 3D printers and 3D printing will growfrom $2.5 billion in 2013 to $16.2 billion by 2018 [5]. Gartner, an American research andadvisory firm has estimated that shipments of 3D printers around the world will reach around217,350 units in 2015. This is a significant increase of just over double since 2014, when theestimated number of units shipped was 108,150 [6].
3D printers have become cheaper and more accessible to the general public and to thehobbyist due to the introduction of home 3D printers. Printers available include the Maker-bot Desktop 2 and a variety of RepRap models. However, the use of 3D printing and additivemanufacturing in industry has grown as well, as new techniques and research result in improve-ments in the quality of prints. One such example of the various industrial applications of 3Dprinters include the manufacture of a car chassis [7] and perhaps most notably is innovations inthe field of medicine, such as 3D bionics and custom hip implants [8] which are bespoke andmade-to-measure for the patient.
The key advantages of 3D printing and the reason it has such an important role to play in themanufacturing sector is because it can be used to manufacture components which conventionalmanufacturing cannot make. This includes complex shapes which are either too difficult orexpensive to mill or machine such as designs with internal cavities or those which do not allowaccess to areas which need machining. One of the the main areas that has gained traction israpid prototyping. The nature of 3D printing allows designers the opportunity to print off aphysical version of their designs which can aid in design realisation and allow testing beforecommitting manufacturing to a larger scale. It is ideal for lean production, where parts are onlyproduced when required so that no inventory is kept. Additionally, waste is very low as onlythe material needed for the component is used during manufacture. The next section will gointo more detail explaining the whole of the 3D printing process, starting with the digital modeland progressing through to the finished component.
1.2 The 3D Printing ProcessA key challenge of 3D printing involves the conversion of the digital model to an instructionset which can be printed. This section will now discuss this process.
The typical process of printing a 3D model starts with a 3D digital model. Models arecreated in Computer Aided Design (CAD) software packages and are exported as Stereolithog-raphy (.stl) files. .stl files describe the surface geometry of the object through polygons. These.stl files are then imported into a slicing software package, which is a type of Computer AidedManufacturing (CAM) package, and sliced. Slicing refers to a process where the packageconverts the .stl file, which is a 3D model, into many 2D horizontal layers, (as previously men-tioned around 0.2 mm in height) and generates the instruction set for the 3D printer so it canprint off the desired component.
The output generated by slicing packages is known as Gcode, which is a control languageused by 3D printers and many other manufacturing machines, including Computer Numer-ical Control (CNC) milling machines. Gcode is a text file which contains the sequence ofcommands that will generate the component. The majority of commands contain X, Y and Zcoordinates, so the motors can move the print head and print bed to the correct location, inaddition to the amount of material to extrude. Other commands set the extrusion temperatureand other printer settings.
Slicing packages have an important role to play in taking the digital object from the .stl file
7
and converting it into an object that can be printed. A variety of parameters can be changedduring slicing which will change the quality and the characteristics of the final print. Theseinclude the layer height, the number of shells, adding supports, the infill type, the infill per-centage, the extrusion speed and the extrusion temperature. The number of shells is the totalnumber of external perimeters that will be printed, where two shells are typically chosen. Someof the other parameters listed here will be explained in the remainder of this section.
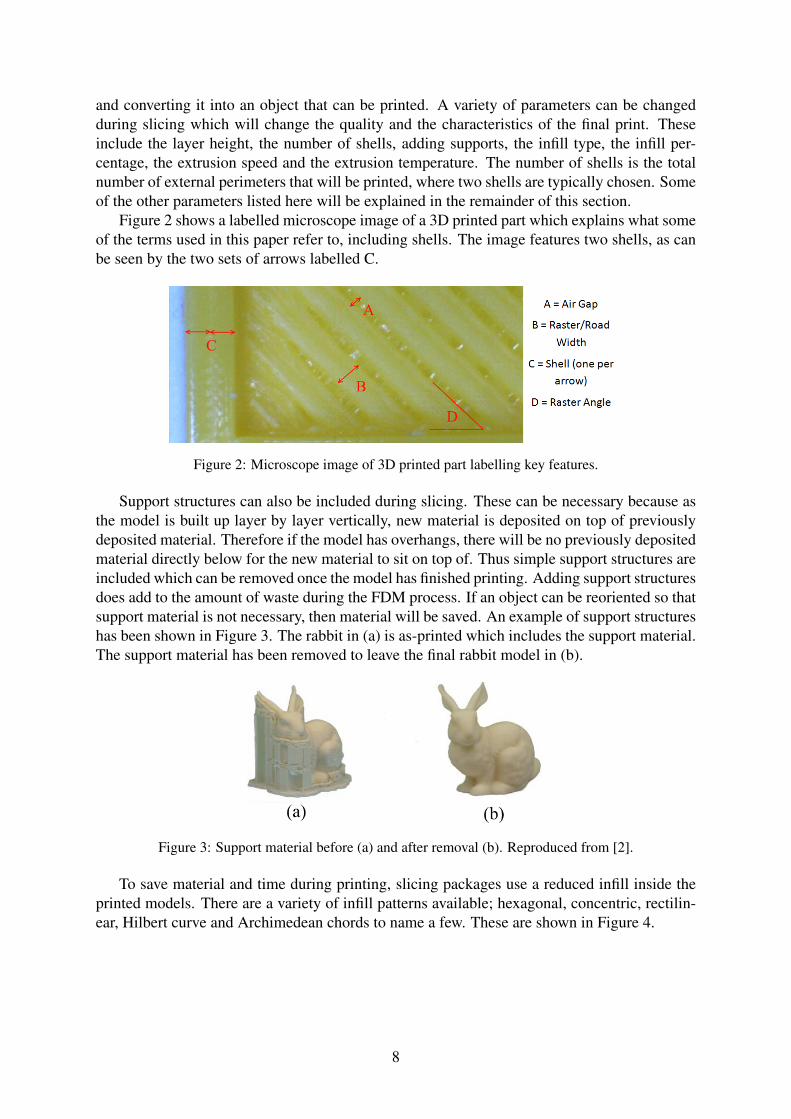
Figure 2 shows a labelled microscope image of a 3D printed part which explains what someof the terms used in this paper refer to, including shells. The image features two shells, as canbe seen by the two sets of arrows labelled C.
Figure 2: Microscope image of 3D printed part labelling key features.
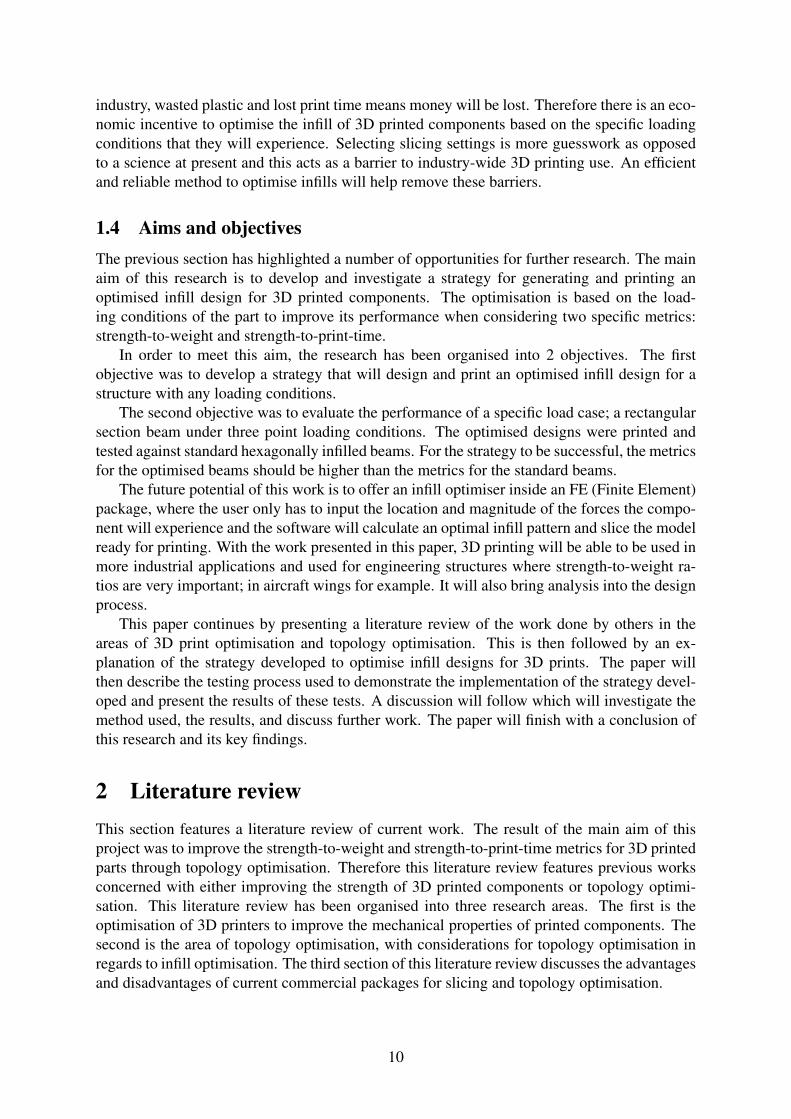
Support structures can also be included during slicing. These can be necessary because asthe model is built up layer by layer vertically, new material is deposited on top of previouslydeposited material. Therefore if the model has overhangs, there will be no previously depositedmaterial directly below for the new material to sit on top of. Thus simple support structures areincluded which can be removed once the model has finished printing. Adding support structuresdoes add to the amount of waste during the FDM process. If an object can be reoriented so thatsupport material is not necessary, then material will be saved. An example of support structureshas been shown in Figure 3. The rabbit in (a) is as-printed which includes the support material.The support material has been removed to leave the final rabbit model in (b).
Figure 3: Support material before (a) and after removal (b). Reproduced from [2].
To save material and time during printing, slicing packages use a reduced infill inside theprinted models. There are a variety of infill patterns available; hexagonal, concentric, rectilin-ear, Hilbert curve and Archimedean chords to name a few. These are shown in Figure 4.
8

Figure 4: Different infill patterns. From left to right: Hexagonal, Concentric, Rectilinear, Hilbert curve,Archimedean chords. Reproduced from [3].
A commonly used infill pattern used by slicing packages is a hexagonal infill. These hexag-onal structures can be of varying infill percentages, as shown in Figure 5, where a higher infillpercentage prints more infill material at the expense of taking longer to print. Hexagons areoften chosen for the infill pattern as a regular hexagonal grid is the most optimal way to dividea surface into regions of equal area with the least total perimeter according to the honeycombconjecture [9].
Figure 5: Three different hexagonal infill percentages.
1.3 Challenges of 3D printingEven with all of its merits, 3D printing is still a research field in its infancy with many op-portunities for improvements. Many of these improvements would be to address the variety ofchallenges facing the users of 3D printers, most of which are listed on the RepRap wiki page[10]. These can be summarised as reliability and repeatability problems, which include filamentblockages or warped final components. Other problems are a result of non-optimal slicing set-tings. This can result in the final piece not being able to support the load it was designed forand failing or the structure being over-engineered, wasting material and print time.
The main factors affecting the strength of the final part are the number of shells used, theinfill type and the infill percentage. These are all parameters which the user defines duringslicing. Higher infill percentages and more shells result in a stronger part due to more materialbeing used. However, printing more material is more costly and takes longer to print. Thereforeresearch into finding an optimum balance between print times, material usage and strength iskey.
At present, when slicing with slicing packages, users manually select the infill percentageused as well as selecting the layer height and number of shells. An example of commonly usedsettings is selecting two shells and a 10% infill, because these are the default settings for manycommon slicing packages and are empirical derived. Users will either print a part with toomuch infill, which wastes plastic and print time, or they will print a part with not enough infill,which is likely to fail during operation and again will represent a waste in plastic and print time.
Thus there exists an opportunity to develop an automatic, efficient way to create an opti-mum infill design based on the loading conditions and requirements of the 3D printed part. In
9
industry, wasted plastic and lost print time means money will be lost. Therefore there is an eco-nomic incentive to optimise the infill of 3D printed components based on the specific loadingconditions that they will experience. Selecting slicing settings is more guesswork as opposedto a science at present and this acts as a barrier to industry-wide 3D printing use. An efficientand reliable method to optimise infills will help remove these barriers.
1.4 Aims and objectivesThe previous section has highlighted a number of opportunities for further research. The mainaim of this research is to develop and investigate a strategy for generating and printing anoptimised infill design for 3D printed components. The optimisation is based on the load-ing conditions of the part to improve its performance when considering two specific metrics:strength-to-weight and strength-to-print-time.
In order to meet this aim, the research has been organised into 2 objectives. The firstobjective was to develop a strategy that will design and print an optimised infill design for astructure with any loading conditions.
The second objective was to evaluate the performance of a specific load case; a rectangularsection beam under three point loading conditions. The optimised designs were printed andtested against standard hexagonally infilled beams. For the strategy to be successful, the metricsfor the optimised beams should be higher than the metrics for the standard beams.
The future potential of this work is to offer an infill optimiser inside an FE (Finite Element)package, where the user only has to input the location and magnitude of the forces the compo-nent will experience and the software will calculate an optimal infill pattern and slice the modelready for printing. With the work presented in this paper, 3D printing will be able to be used inmore industrial applications and used for engineering structures where strength-to-weight ra-tios are very important; in aircraft wings for example. It will also bring analysis into the designprocess.
This paper continues by presenting a literature review of the work done by others in theareas of 3D print optimisation and topology optimisation. This is then followed by an ex-planation of the strategy developed to optimise infill designs for 3D prints. The paper willthen describe the testing process used to demonstrate the implementation of the strategy devel-oped and present the results of these tests. A discussion will follow which will investigate themethod used, the results, and discuss further work. The paper will finish with a conclusion ofthis research and its key findings.
2 Literature reviewThis section features a literature review of current work. The result of the main aim of thisproject was to improve the strength-to-weight and strength-to-print-time metrics for 3D printedparts through topology optimisation. Therefore this literature review features previous worksconcerned with either improving the strength of 3D printed components or topology optimi-sation. This literature review has been organised into three research areas. The first is theoptimisation of 3D printers to improve the mechanical properties of printed components. Thesecond is the area of topology optimisation, with considerations for topology optimisation inregards to infill optimisation. The third section of this literature review discusses the advantagesand disadvantages of current commercial packages for slicing and topology optimisation.
10

2.1 Optimisation of 3D Printed ComponentsThe mechanical properties of 3D printed mediums differ greatly compared to the same materialwhich has been cast or injection moulded. This is because 3D printed parts are made up of lotsof very thin layers bonded together as opposed to a single structure. This results in 3D printedparts being less mechanically strong than their cast counterparts. It has been found that themeso-structure of 3D printed ABS parts causes the elastic modulus to be 11 to 37% lower andthe strength values to be 22 to 57% less than injection moulded ABS [11]. However, eventhough 3D printed components are not as mechanically strong as subtractive-manufacturedparts, they can still be considered mechanically functional. The tensile strength of printedPLA has been calculated to be 56.6MPa with an average elastic modulus of 3368MPa [12].These values show that 3D printed components can be used as substitutes to subtractively-manufactured components. 3D printed parts also demonstrate anisotropic properties due to theway layers and rasters are printed [13]. Thus the strength and other mechanical properties varyin different directions depending on the orientation the material has been deposited in.
A variety of studies have been performed to either calculate the effects of changing slic-ing settings such as layer thickness and raster orientation on the mechanical properties of 3Dprinted components. Other work includes the development of algorithms to improve thesemechanical properties. The next section discusses these studies.
Mechanical Properties As the strength of 3D printed components plays a very significantrole in this research, a discussion of the factors which affect the strength of these componentsfollows.
Layer thickness has an important role to play in determining the mechanical properties ofthe final 3D printed component. It has been shown that as layer thickness increases, the max-imum flexural force of 3D printed parts tested in a 3 point bend test decreases. Luzanin et al.showed that there is a dominant, statistically significant relationship between these parameters,as demonstrated through an analysis of variance [14]. The ultimate tensile strength has alsobeen shown to decrease with increasing raster angle [11].
The elastic properties of 3D printed components have been tested though the use of 3Dprinted members in a catapult design. It was shown that the three parameters layer thickness,raster angle and air gap made a significant difference to the elastic properties of the 3D printedmembers [15]. Increasing these three parameters resulted in increasing the catapults averagethrowing distance. These three parameters were shown to have a contribution of around 30%each in the analysis of variance, whereas raster width only had around a 5% significance.
Print temperature is another slicing setting which can be modified. However, a Design ofExperiments method was used to show that changing the print temperature does not have asignificant effect on the ultimate tensile strength of the test pieces [13].
Due to the nature of the process of 3D printing, air gaps form between the raster roads. Itwas found that the air gap between raster roads had the greatest influence on the wear strengthof the printed parts at a 95% confidence level [16]. Thus there exists an algorithm which aims toreduce the air gaps in printed components. The method aims to improve the tensile propertiesof 3D printed parts by using a visual method to try and eliminate air gaps between rasters.Improvements of as much as 19% were achieved in ultimate tensile strength compared to thedefault build parameters [17].
Another algorithm developed optimises the orientation of 3D printed parts to increase theirtensile strength using adaptive slicing [18]. The algorithm analyses the cross-sections of astructure to find the highest stressed areas and re-orients the model into a different plane to
11

increase the amount of material in these areas and thus increase the parts mechanical strengthwhen printed. The next section investigates topology optimisation and previous work in thearea of topology optimisation of 3D printed components.
2.2 Topology Optimisation3D printing is well suited to manufacture topology-optimised components because topologyoptimisation often creates organic shapes that are hard to create using traditional manufactur-ing techniques. There currently exists a wealth of work in the field of topology optimisationfor subtractive manufacturing [19]. However, topology optimisation for additive manufactur-ing has not been researched in as much depth. A reason for this is that conventional topologyoptimisation tools start with a solid billet and remove material until an optimal amount of ma-terial remains. This suits subtractive manufacturing, as the subtractive manufacturing processremoves material to create a final component. However, additive manufacturing adds materialto create a final component, and so a topology optimisation process which adds material duringeach iteration of the optimisation would be better suited towards additive manufacturing.
A further problem with topology optimisation is that it can optimise a structure and presentthe results on a computer screen, but the challenge is actually manufacturing that optimised,theoretical result. These challenges have been summarised by Zhou et al., where the designrequirements for casting and extrusion production have been considered for topology optimi-sation [20].
An additive-manufactured aircraft hinge bracket has been topologically optimised to saveweight and cost [21]. The lack of economic viability of the optimisation process was noted dueto the high number of man hours required. It was concluded that the process would becomemore economically viable if optimisation tools for additive manufacturing had been developed.Brackett et al. discussed a variety of issues regarding the application of topology optimisationfor additive manufacturing methods [22]. The main areas that were investigated included themanufacturing constraints which must be considered when performing topology optimisationand adding support structures into the optimisation process. It was concluded that even thoughtopology optimisation is in its infancy, there exists great potential for its development and usein industry.
There also exists a method developed with similar aims to that of this research. The methodoptimised the strength to weight ratios of 3D printed parts by modifying their internal struc-ture [23]. The method is based on an irregular hexagonal cell structure. A Voronoi diagramis utilised to generate the irregular hexagonal internal structure of a 3D model based on thestresses in the model as a result of a defined external force. An optimisation sequence is thenused to remove as much material as possible from each hexagonal cell to maximise the strength-to-weight ratio based on given loads applied to the model. The method goes through numerousiterations to reach a final, optimised model based on strength-to-weight ratios. The irregularhoneycomb-like structure that this method produces is not optimised for ease-of-printing be-cause the printer will have to make lots of small, non-continuous print moves which is muchslower than long, continuous print movements. Additionally, the method is quite computation-ally intensive compared to the method proposed in this paper.
Furthermore, the method uses a Monte Carlo simulation which will not result in exactly thesame topology each time. This means that if the process was ran numerous times for exactlythe same inputs, the orientation of the hexagons would be slightly different each time. Thiswould result in final printed components with slight differences in strength due to differencesin orientation of the printed material. Moreover, the method uses a subtractive iteration process
12

where material is removed during each iteration until an optimum infill pattern is reached. Thissuits subtractive manufacturing, but is not ideal for additive manufacturing. The method has notbeen incorporated in industry or has not been developed into an easy-to-use commercial pack-age. Thus the need for a usable process to optimise internal structure still remains. The nextsection discusses the advantages and disadvantages of two commercial slicing and optimisationsoftware packages.
2.3 Commercial PackagesThere exists a commercial slicing package, Simplify3D, which allows users a lot of freedomwhen slicing [24]. The main benefit of this software is that it allows users to select differentregions of their 3D CAD model and change the infill percentage in these different regions. Thismeans that users can put higher infill percentages in higher stressed areas and reduce infill inless stressed areas. However, this software requires manual expertise and does not incorporateany intelligent process to do this automatically. Therefore it is an improvement to standardslicing packages which only allow one infill percentage for the entire model, but it does notfeature any automatic way to optimise the infill. Additionally, users can only use the standardinfill patterns offered (see Figure 2) and change the local infill percentage of these patterns in amodel. There are no custom infill patterns which are designed specifically to the model and itsloading conditions.
A second commercial package available, Altair Optistruct, is an optimisation package witha variety of features, including topology optimisation. In a recent update, the topology optimi-sation suite has been expanded to support the use of 3D printing so that it can create a mix oflattice and solid sections, which are suited to the 3D printing process [25].
However, this software package will not create a 3D printable file which can be printedon a 3D printer. It simply generates the optimised design based on input parameters definedby the user. A key consideration when creating 3D print files is if it is possible to print thegeometry that has been created. For example, shapes with internal overhangs are likely to needextra supports which the topology optimiser will not include. Optistruct does not consider ifthe geometry generated will be printable. Thus there is a need to incorporate these sorts oftechnologies with a program which can generate printable files.
Table 1 summarises the key statements from this literature review in regards to the effectschanging certain slicing parameters has on the printed components strength and the time takento print. The statements made in the table are either based on the referenced work from theliterature review or are logical conclusions based on these works.
Print Time StrengthIncrease layer height Significantly decrease Significantly decrease
More shells Significantly increase Significantly increaseInclude supports Significantly increase No effectHigher infill % Significantly increase Significantly increase
Table 1: Table summarising effects of changing 3D printing parameters on final print.
3 Objective 1 - The Optimisation StrategyThis section discusses the methods which were considered when developing the optimisationstrategy and then describes the method chosen in detail.
13

3.1 Choice of MethodTwo alternate methods, Methods 1 and 2, were considered when deciding which approach totake to develop the strategy to optimise infill patterns. These methods were not selected and anoutline as to why has been given. Following this explanation, a description of the method usedhas been given.
Method 1 The first option considered was to take results from FEA where the stress dis-tribution across the beam was calculated based on the loading conditions applied. This stressdistribution would then be used to create different sized hexagons, where smaller hexagons, andthus more material, would be placed in areas of higher stress, and areas that are less stressedwould have larger hexagons. This method is similar to that used by Jin et al [23], except thatthey performed numerous iterations to find the optimal irregular hexagonal grid layout. Thismethod optimised the entire 3D structure and thus needed many iterations to get an optimisedresult.
Method 2 The second option considered involved taking the hollow shell of the componentand generating solid struts along the force paths calculated from FEA. These solid struts wouldhelp transfer the load through the part and support the load applied. This method involves 3Danalysis and is thus more computationally intensive than a 2D analysis.
Method Reasoning The reason Method 1 was not chosen was because generating an irregularpattern of hexagons would have taken longer to print due to the printer starting and stoppingextrusion and not performing fast, continuous travel moves. The aim of this research was tooptimise 3D prints for strength per unit of weight and printing time and thus this was notdeemed to be a viable option due to the increase in time taken to print. Method 2 was notchosen because it would only have material along the force paths and very little or no materialin other areas. The lack of a regular grid would not help transfer load very well and would notbe successful for complex loading conditions or structures, which will require spider-web-likestrut-systems to support the load. These complex strut-systems will be very computationallyintensive to generate. The next section details the method chosen for the strategy with the aidof a flow chart. The advantages and disadvantages of the method chosen have been discussedin the Discussion section of this paper in Section 7.3.
3.2 Method ChosenThis paragraph briefly discusses a flow chart, shown in Figure 6, which shows the key stagesof the strategy developed in this research. The strategy commences by performing FEA (FiniteElement Analysis) on the component based on its loading conditions. This will create a stressdistribution which is imported into MATLAB. This stress distribution is then used to design theinfill pattern of the component. A rectangular grid is set up inside the component and cells inthis grid with a stress above certain values will be infilled with more material. The instructionset for the printer based on this grid and infill pattern is written to a text file. This text filecan then be converted to a printable file and printed on the 3D printed. The next section willnow explain the strategy and the flow chart in more detail, making reference to the numberedelements in the flow chart.
14

Figure 6: Flow diagram of optimisation process.
3.3 Using the FEA package - Flowchart Elements 1 & 2The purpose of using FEA is to evaluate the stress distribution across the component based onits loading conditions which will be used to design the infill pattern. This section describeshow this distribution is found. Autodesk Simulation Mechanical was the FE (Finite Element)package selected for this strategy as it allowed exportation of the stress distribution of the modelas a .csv (Comma-Seperated Variables) file. Any FE package can be used however as long asthe stress distribution of the model can be exported.
The first step of the strategy is for the user to import the .stl file of the CAD model into theFE package (flow chart element 1). FEA works by splitting up a model into a fine mesh of verysmall volumes over which stress analysis is performed. The first stage of the FEA is to meshthe model. The infill pattern used in this strategy is based upon a regular rectangular grid andthus, to simplify the process, the current method is constrained to used a regular cuboid mesh inthe FEA. The reason for this is because the FEA cuboid mesh is directly mapped to the printedinfill grid used. Therefore the size of the mesh used in the FEA package is the same size asthe size of the rectangular grid used in the infill pattern design. So, choosing a finer mesh withmore squares will result in a finer infill mesh.
The user must then apply the loading conditions and constraints to the model in the FEApackage based on the loading conditions the printed component will experience. This includes
15

constraining certain faces of the model which are known to not be allowed to move; for examplethe built in face of a cantilever beam. The loads applied can be in the form of pressures, pointloads or moments.
The stress analysis can then be performed, which will output a stress distribution. Figure 7shows the von Mises stress distribution resulting from a rectangular section beam loaded under3 point loading conditions. This rectangular section beam is the beam chosen as the proof-of-concept for the strategy developed in this research. The beam has a length of 180 mm, a heightof 60 mm and a depth of 20 mm. The simple supports are 120 mm from one another. Thisstress distribution is then exported as a .csv file to MATLAB (flow chart element 2).
Figure 7: von Mises stress contour plot of beam under 3 point bending conditions, showing simplesupports (red triangles) and point load (green arrow).
3.4 Importing into MATLAB - Flowchart Elements 3, 4 & 5The MATLAB code developed for this strategy will import the .csv file generated by the FEAprogram and convert it into a 4-columned matrix which contains the X, Y and Z coordinatesand the stress value for each node from the FEA model. The nodes of the model are the pointsbetween which the lines of the FEA mesh connect. The elements in an FEA mesh are 3Dvolumes and in this case the elements are cubes, where each is made up of 8 nodes, one at eachcorner. The 8 nodes of every element are listed in this .csv file which therefore includes a lotof repeated nodes as nodes are shared between elements. The repeated nodes are removed sothat each node is only represented once in the matrix. The MATLAB function insertrows.mwas downloaded and used to help remove the unwanted repeated nodes [26]. This resulted in amatrix which contained the stress distribution for every node of the model in all 3 dimensions.
The program then splits this matrix up into 2D cuts and decides if the stress distributionthrough the beam is 2D or 3D (flow chart element 3). Each 2D cut is defined as an X-Y planeof nodes, where every node in the cut has the same Z coordinate. The Z direction is the directiongoing into the page in Figure 7 and the X and Y directions are shown in the Figure. If the stressdistribution in the component is 2D, then the stress distribution is the same in all of the 2D cuts.The beam shown in Figure 7 has a 2D stress distribution as every 2D cut, or X-Y plane, hasthe same stress distribution due to the symmetrical nature of the 3 point bend test. A 3D stressdistribution will have a different stress distribution for each 2D cut. The difference between the2D and 3D stress distributions is that the beam with a 2D stress distribution is only made up ofone 2D cut, whereas the beam with a 3D stress distribution is made up of multiple, smaller 2Dcuts, each with its own stress distribution. The following explanation will explain the processfor a component with a 2D stress distribution. It will follow with a paragraph explaining howthe process differs for a 3D stress distribution.
For a 2D stress distribution, the average 2D stress distribution of all the 2D cuts of the beamwill be calculated and stored as a new 2D matrix (flow chart element 4). This new matrix ofnodal stress values can be plotted and is shown in Figure 8 for the three point bended beam. It
16

can be seen that the contour plot in Figure 8 is very similar to that in Figure 7 which shows thismethod works correctly.
Figure 8: Filled contour plot showing the imported von Mises stress distribution for the three pointbended beam (Colour bar units MPa).
The user must then enter the dimensions of the beam into the MATLAB program. Theprogram will then generate the Gcode for the outer geometry and write it to a text file (flowchart element 5). It will also generate the rectangular grid in Gcode and write this to the textfile as well. This is the start of the infill optimisation. The next part of the program will beused to decide which cells in this grid need more material added and which do not based on theamount of stress in the equivalent part of the beam in the FEA model.
3.5 Performing Iterations - Flowchart Elements 6, 7 & 8In the next part of the strategy, the MATLAB program will perform iterations to add materialto certain cells in the grid. The nodes of the FEA model are located such that they lie at thecentre of each cell in the printed infill grid. Two threshold stress values are calculated, wherecells in the grid with stress values lower than the lower threshold stress value will not haveany material added. Cells with a stress value above the lower threshold will have two crossmembers added. Cells above the upper threshold will have a star pattern added. Figure 9 showsthe three different levels of infill for a single cell.
Figure 9: The three levels of infill used in the optimisation process.
The reason the two cross members were chosen for the first infill level is that firstly they addmaterial in a different direction to the rectangular grid which increases stiffness and strengthin different directions. Secondly, the two cross members only require 3 moves to print percell. This is fewer moves than the star pattern, which takes 6 moves to print per square. Thestar patten is not used as often as the two cross members but is used to add extra strengthto the cells which are the most highly stressed. If the amount of material in the empty cell,including the four edges of the cell, is assigned a value of 1, then the amount of material in thecross-membered cell is 1.7 and the amount of material in the start patterned cell is 2.2.
The threshold stress values were calculated by considering the stress at every point in thematrix and organising the stress values into rank order. The stress at the 20th percentile of this
17

order is defined as being the upper threshold stress and the stress at the 70th percentile of thisorder is defined as being the lower threshold value,
The first optimisation iteration involves creating the Gcode to add the cross-member patternto cells in the grid with stress values above the lower threshold value (flow chart element 6).The second optimisation iteration involves creating the Gcode to add the star pattern to cells inthe grid with stress values above the upper threshold value. Thus, cells with higher values ofstress have more material added to them (flow chart element 7A). Once this process is complete,this finishes the optimisation for components with the 2D stress distribution case. The Gcodegenerated for this 2D cut is repeated for every layer in the beam (flow chart element 8).
3D Stress Distribution For the 3D stress distribution the process is slightly longer. Thebeam is split into multiple 2D cuts. Then each of these 2D cuts undergoes the same processmentioned above regarding adding the cross-member and star patterns to add material to thehigher stressed areas. The only difference is that once the optimised pattern has been generatedfor the first 2D cut, the Gcode is only generated for layers included in that 2D cut (flow chartelement 7B). Then the next 2D cut is taken and optimised in the same way, generating Gcodefor the layers in that 2D cut. Once all of the 2D cuts have been analysed, then the Gcode isfinished (see flow chart element 8).
3.6 Converting and Printing - Flowchart Elements 9 & 10All of the Gcode created in the previous section in MATLAB gets written to a text file. Oncethe optimisation is finished, then this text file containing Gcode can be converted into an .x3gfile (flow chart element 9). An .x3g file is a binary version of Gcode which can be read by3D printers. Dr Henry Thomas’s Gcode-to-.x3g converter, GPX was downloaded and used toconvert the text files containing the optimised Gcode [27]. The .x3g file which has now beencreated can then be uploaded to the 3D printer and printed off (flow chart element 10).
4 Objective 2 - Evaluating the StrategyThe strategy developed in this research is capable of generating optimised infill patterns for anybeam dimensions and any loading conditions. To demonstrate the wider applicability of thisstrategy, a rectangular section beam under 3 point bending conditions was optimised and testedagainst non-optimised hexagonally-infilled beams.
4.1 Three Point Bend TestThe optimised beams and the hexagonally infilled beams were tested under 3 point bend condi-tions and the flexural strength of the beams was measured. Every beam was printed out 3 timesand the average results were taken to ensure reliability. The separation of the simple supportswas 120 mm which matches where the supports were placed on the FEA model. The simplesupports were not placed at the end of the beams to prevent the beams from slipping duringtesting.
All the beams were loaded at 100 N/minute until fracture or until the maximum loadingcapacity of the machine was met. The software connected to the loading machines plottedgraphs of force against extension and provided a .csv file which contained this data. The forcerequired to reach yield stress was the parameter used to assess the flexural strength of the beams.
18

The 0.2% strain method was used as it is often very hard to identify the end of the linear regionand thus the transition from elastic behaviour to plastic behaviour.
The key parameters which were measured and used to compare the beams were the strength-to-weight and the strength-to-print-time ratios of the beams. Once the force to reach the yieldpoint was identified, then the first metric, strength-to-weight ratio, was calculated by dividingthe yield force, in Newtons, by the weight of the beam, in grams. The second metric was thencalculated, where the yield force, in Newtons, was divided by the time taken to print the beam,in minutes. The aim of the optimisation process was to create beams which scored higher interms of these two metrics, i.e. having a higher strength per unit weight or per unit print time.
Two machines were used to apply the compressive force required for the 3 point bend test.The first machine used was the Instron 3343 1KN Single Column Testing System. It was fittedwith an Instron 2519-105 1KN load cell. The load cell had linearity and repeatability ratings of0.25% [28] and an accuracy of 0.5% [29] of the maximum load. The second machine used wasthe Zwick Roell HCT 25KN. This machine was capable of applying a force of up to 25KN andwas hydraulically powered. The reason for using this second machine is that, during testing,it became apparent that some of the heavier beams could be subjected to the 1KN maximumload and still remain in their linear, elastic region and thus not reach the 0.2% yield point.Therefore, the heavier beams, including some of the optimised beams, had to be tested on theZwick Roell as this could apply a much higher force which allowed the yield point of theseheavier beams to be reached. The next section describes the hexagonally-infilled beams testedand the dimensions of the test pieces.
4.2 Beams TestedA variety of hexagonally-infilled beams were tested to provide a benchmark to compare to theoptimised beams. A hexagonal infill was chosen as it is the default infill on slicing packages,such as MakerWare, which is the in-house slicing package for the MakerBot Replicator 2.The infill percentages chosen were 5%, 10%, 15% and 20% because these are common infillpercentages used and make up the default options for MakerWare. Figure 10 shows a render ofeach of these beams. The Figure in Appendix 10.1 shows a render of the eight different infillpatterns used in the testing, including the optimised beams. The dimensions and print settingsused to generate these beams have been detailed in the next section.
Figure 10: Renders of the four types of hexagonal infill percentages used.
Materials and Dimensions The 3D printer used was the Makerbot Desktop 2, which has abuild envelope of 285 mm by 153 mm by 155 mm (length, height, depth). The filament usedwas Makerbot PLA filament. It has a diameter of 1.75 mm, a density of 1250 Kg/m3 [30] anda melting point of 170 �C [31]. The only parameter which was changed when printing was
19

the internal structure of the beams. Each beam had a length of 180 mm, a height of 60 mmand a depth of 20 mm. In the paper by Eschenauer & Olhoff, the optimum topology solutionto a 3 point bend test on a rectangular-section beam was calculated [32]. The length to heightratio (3:1) from that paper was used for the beams in this. With this ratio selected, the heightof 60 mm was chosen as it allowed for two beams to be printed at the same time on the printbed which was favourable in terms of printing as more beams could be printed simultaneously.Thus the length of 180 mm was selected as it follows on from the 3:1 ratio based on the 60 mmwidth. The depth was chosen to be 20 mm as if the depth was less than this, then there wouldhave been a risk that the beams would buckle immediately under the load applied and wouldnot provide useful data to prove the concept developed in this paper. Furthermore, if the depthselected was too high, then each beam would take longer to print, so a compromise of 20 mmwas selected.
The dimensions chosen for this beam were relatively arbitrary as the only imposed con-straints were the build envelope of the 3D printer. This differs greatly to industry, where theheight chosen is of considerable importance, where height constraints dictate beam dimensions,such as in floor joists in buildings where there is a maximum allowable height for the joists.It has been shown that the height constraint of a beam has a significant effect on the optimalshape of the beam as the optimum shape, or in this case infill, of the beam is not always thesame as the optimum shape for the unconstrained beam [33].
Slicing settings For the purposes of testing, the top and bottom faces of the beams werenot printed so that the internal structure of the beams could be seen clearly during testing.This also reduced the time taken to print each beam by 43 minutes, which was a significantsaving. MatterControl was the slicing package used to create the hexagonally-infilled beamsand Slic3r was the slicing tool selected. MakerWare, which is the in-house slicing packagefor the MakerBot, was originally the program used. However, it was not possible to print thebeams without the top or bottom faces in MakerWare. Thus MatterControl was used to slicethe beams and to generate the print files as it had the facility to print the beams without the topor bottom faces.
The layer heights used were 0.2 mm throughout and the temperature the filament was heatedto was 230 �C. All prints were in the same orientation, with the same raster angle (-45 �/45 �).No rafts or support material was printed for the beams as they were unnecessary. Each beamhad two shells.
The printer moves the print head at different speeds depending on if it is extruding materialor if it performing a travel move, where it moves to the next position but does not extrude anymaterial. The printing speed was 90 mm/s and the travel move speed was 150 mm/s. Theprinting speed is slower than the travel move speed as if the printer head moves too quicklywhilst extruding material, the material may not deposit correctly and the layers will not bind asthey should.
5 Results 1 - Optimised BeamsThis section presents the optimised beams generated by the optimisation strategy developed. Italso presents the optimisation results for a cantilever beam with a 3D stress distribution.
20

5.1 Three Point Bend Test OptimisationThis results section deals with presenting the two different optimised beams developed usingthe strategy discussed in this paper. Using the stress distribution generated in Figure 7, theoptimisation process as described above was implemented. The first optimised beam that wasgenerated, designated as 3Levels is shown in Figure 11. It received this designation becauseit features three levels of refinement as seen in Figure 9; the first being the regular squaregrid, the second being the two cross members, and the third being the star pattern. The materialplacement in this beam closely resembles the optimum solution to a 2D rectangular beam under3 point bending conditions calculated by Eschenauer & Olhoff [32].
Figure 11: Render of the optimised beam 3Levels.
The second optimised beam created was designated Even3 and is shown in Figure 12. Theaim when creating this beam was to reduce some of the redundancy in the structure by removingsome unnecessary material from 3Levels. This resulted in it being lighter, but with a similarstrength, thus improving its strength-to-weight metric. Some settings in the FEA package weremodified to generate this. The same loading conditions, dimensions and constraints were allapplied as before. However, the mesh size was adjusted slightly to be one element smaller inboth the X and Y directions which resulted in an even number of cells in the optimised infillgrid. This allowed for the possibility of only printing every other line in the grid, which reducedthe total weight of the beam. This is evident when comparing Figures 11 and 12. The reasonthis optimised beam received the designation Even3 is because it had an even grid spacing andhas 3 levels of refinement.
Figure 12: Render of the optimised beam Even3.
5.2 3D Stress Distribution OptimisationA beam with a 3D stress distribution was also optimised using the strategy presented in thisresearch. The dimensions of the beam were changed relative to the other optimised beams toshow the flexibility of the MATLAB program. It was a cantilevered, rectangular-section beamand had a length of 120 mm, a width of 50 mm and a depth of 20 mm. The beams smallestface (Face A) was fixed and a uniform force was applied to the top face (Face B) and one ofthe side faces (Face C). The stress distribution calculate by the FEA has been shown in Figure
21

13. It can be seen that the stress distribution is 3D, as the stress distribution changes along thebeams Z-axis.
Figure 13: FEA stress distribution of the cantilever beam.
Figure 14 shows the four 2D cuts of the cantilevered beam generated by the optimisationstrategy. The number of each cut relates to the relevant layer of the beam shown in Figure 13.The MATLAB program used the stress distribution from each cut to create the Gcode for eachcut, where each cut is one quarter of the total depth of the beam. Therefore when the beamis printed, each 2D cut will have a different infill pattern. This differs to the beams optimisedearlier in this paper, which had a 2D stress distribution and thus the infill pattern was constantthrough the depth of the beam.
Figure 14: Renders of the four 2D cuts of the optimised beam.
6 Results 2 - TestingThis section presents the results of the 3 point bend test and compares the metrics calculatedfor the hexagonally infilled beams and the optimised beams.
Figure 15 shows a bar graph plotting the average strength-to-weight ratio and averagestrength-to-print-time ratio calculated for the beams tested. The full table of results has beenincluded in Appendix 10.2 and the average force-extension graphs for all the beams is shown inAppendix 10.3. The results for the four hexagonally-infilled beams are plotted in Figure 15 (a),and include the 5%, 10%, 15% and 20% beams. The results shown in Figure 15 (b) representthe optimised beams which were created. The beam 1Level is the simple rectangular grid asin Figure 11 but without either the cross-member or star patterns. The beam Even2 is similar
22

to Even3 which was shown in Figure 12, but it only contained two levels of refinement andtherefore did not contain the star patterns at the points of the highest stress. These two extrabeams were printed and tested to demonstrate the increase in the strength-to-weight metric byadding material in the areas of high stress. The equivalent infill percentages of the optimisedbeams have been shown in brackets in Figure 15 (b).
Figure 15: Bar graphs showing the calculated metrics of the (a) hexagonally-infilled beams and (b) theoptimised beams. Equivalent infill percentages of beams in brackets.
It is clear to see from Figure 15 that the optimised beams outperformed the hexagonally-infilled beams in terms of the strength-to-weight metric. The best performing beam, Even3,scored 16.3 N/gram which is a 55% increase on the best performing hexagonally-infilled beam,20%, which scored 10.5 N/gram. There is a significant increase in strength-to-weight from1Level to 3Levels, which shows that the optimisation process has been successful and has re-sulted in improved beams. The other metric, strength-to-print-time increased from a maximumof 3.7 N/minute for the 20% beam to 4.7 N/minute for Even3, which is a 27% improvement.
The equivalent infill percentages of 1Level, Even2, 3Levels and Even3 are 9.0%, 10.7%,13.4% and 11.5%. These equivalent percentages were found by calculating the ratio of theweight of each optimised beam to the weight of 10% beam. These equivalent percentagesdemonstrate the high increase in performance that the optimised beams have over the hexgaonally-infilled beams. This is because Even2 and Even3 only have slightly more material in them thanthe 10% hexagonally infilled beam, but they drastically outperform the 10% beam. Even2 andEven3 have a lower equivalent infill percentage than 3Levels as they are lighter.
7 DiscussionThis section will discuss the results presented in this paper, discuss their reliability and theadvantages and disadvantages of the method used.
23

7.1 Interpretation of ResultsThe results shown in Figure 15 show that the optimisation strategy developed in this researchis successful in improving the rectangular section beams operating under three point loadingconditions in terms of the two metrics. Firstly, the hexagonally-infilled beams will be discussed.The heavier three of these beams, the 10%, 15% and 20% all had similar very similar scoresfor the strength-to-print-time metric, with scores of 3.6, 3.5 and 3.7 N/minute respectively. Thereason for this is that the only difference between these three beams is that the infill patternhas been scaled up to include more material as the percentage infill of the beams increases.Therefore, material is deposited by the 3D printer at a very similar rate for each of these threebeams. This means that the strength-to-print-time ratios for these beams should be similaras adding more material takes more time but supports more load. It would therefore appearthat there exists some linear behaviour between the print time and the flexural strength of thehexagonally-infilled beams. These three beams also had scores which were fairly similar for thestrength-to-weight metric of 8.3, 9.6 and 10.5 N/gram respectively, which occurs for a similarreason. The standard deviation of the results for each beam was low and so was not shown onthe bar graphs.
5% Beam Conversely, the metrics calculated for the 5% beam were much lower than those ofthe higher-percentage hexagonal beams, as can be seen from Figure 15 (a). The reason for thisis that due to the nature of the three point bend test, the area of highest stress during testing isthe area directly below the central loading pin. Therefore these are the cells which buckle firstduring testing. The 5% beam, when compared to the other beams in Figure 10 has very littlevertical material to support the load directly below the loading pin in the centre of the beam.This can be seen in Figure 16. As a result, the 5% beams failed a lot sooner than expected andat much lower metrics than the other three hexagonally infilled beams. The optimised beamssignificantly improve upon this by locating more material at the load points, which are thepoints of highest stress.
Figure 16: Photograph showing a 5% beam mounted on the Instron machine.
Optimised Beams This section focuses on the optimised beams. The reason the strength-to-weight ratios for the 3Levels, Even2 and Even3 optimised beams are higher than those forthe hexagonally infilled beams is because the extra material has been added in the areas of thehighest stress. The reason that the Even3 beam performed the best, compared to 3Levels, isbecause the amount of material which does not support much load, i.e. that in the top left andright corners, has been reduced by using a larger rectangular grid. The amount of support-ive material used is similar to that in 3Levels, but the beam is lighter, which results in a betterstrength-to-weight ratio. Additionally, this larger grid is quicker to print as there are fewer linesfor the printer to draw. This is the reason why Even3 has a strength-to-print-time ratio of 4.7N/gram, which is higher than 3Levels, which has a score of 3.6 N/gram, which is similar to the
24
scores for the three heavier hexagonal beams. This shows that there is still a manual elementto the strategy developed which can be used to modify some settings and thus provide addi-tional improvements to component performance. These improvements show that the strategydeveloped in this research is successful in improving component performance compared to acurrent state of the art pattern (the hexagonal infill). The improvements also provides evidenceto confirm that FEA results can be used to design an infill pattern.
The reason that the Even3 beam outperforms its predecessor Even2 is due to the addition ofthe third iteration, which adds the star pattern to the areas of highest stress. This is very effectivebecause these areas are the areas which fail first, especially the section below the central loadingpin at the top of the beam. Therefore strengthening these areas helps the beam support moreload before it reaches yield point, without actually requiring the addition of much material.This confirms that the addition of the star pattern provides extra support and is beneficial. The1Level beam was printed and tested to show the significant increase to the calculated metricsthat adding the material in an optimised fashion to best support the load, as done in 3Levels, willhave. The 1Level beam is just the regular rectangular grid, which is the predecessor of 3Levels,which has two more levels of iterations. The strength-to-weight ratio increased from 4.6 to 14.6N/gram from 1Level to 3Levels, which is an increase of 217%. The strength-to-print-time ratioalso increased from 1.7 to 3.6 N/minute which is an increase of 111%.
Failure Modes The failure modes in which the beams failed during testing was also inves-tigated. A difference in failure modes was noticed between the heavier and the lighter beams.Beams such as the 5% and the 10% beams experienced a long plastic region and at the endof loading they were still in tact, besides for a small crack underneath the central loading pin.Beams such as the 20% beam and Even3 experienced sudden brittle failure and cracked intotwo pieces after a shorter region of plastic deformation. A reason for this is that these heav-ier beams are much stiffer, especially the optimised beams, and thus resisted the deformationmore until sudden brittle failure occurred. The cells directly below the central loading pin werealways the cells to collapse first. A way to increase the strength of these cells would be to com-pletely infill the cell. The MATLAB program developed allows for this, as additional thresholdvalues and infill patterns can be used, such as the solid infill in cells.
7.2 Reliability of ResultsAll the beams tested were printed and tested three times to improve the reliability of the results.This was important because the print quality can vary from print to print. These variationscan be as a result of different room temperatures due to sunlight reducing the speed at whichthe layers can cool. Every effort was made to ensure the print parameters were consistent,including the orientation, material, temperature and print settings. These have been discussedin Section 4.2. All the beams were loaded at a constant rate; 100 N/minute. If this loading ratewas changed, to 200 N/minute for example, then it is possible that the results could vary fromwhat was calculated, although this is unlikely to be significant.
The two machines available for testing the proof-of-concept beams and the hexagonally-infilled beams were the 1KN and the 25KN machines discussed in the Method 2 section. Theresolution of these machines is as a function of their maximum load, measured in percent. The20% beam and the 3Levels beam did not reach the yield point on the 1KN machine and so hadto be reprinted and tested on the 25KN machine. A machine with a maximum load of 3KNwould have been beneficial at it would have a higher resolution when compared to the 25KNmachine as all of the test specimens failed before this 3KN point. The availability of a 3KN
25

machine would have improved the accuracy of the results. The advantages and disadvantagesof the method used in this strategy have been discussed in the next section.
7.3 Advantages and Disadvantages of The MethodAdvantages The method used in this strategy, as described in Section 3, was chosen becauseit simplifies the 3D analysis into 2D cuts which were simpler to analyse and were easier togenerate printable files for. The reason for this is that each 2D cut is independent of the nextone so the optimisation for one 2D slice does not have to be used to optimise the next 2Dslice. This would not be the case in Methods 1 and 2, where the entire model would need to beoptimised at one time in 3D which would be computationally intensive and take longer to print.
The loading case of a rectangular-section beam under 3 point bending conditions was cho-sen as a proof of concept of the strategy developed in this research. The reason this case waschosen is because it is a well-known, widely applied and accepted standard test for evaluatingthe flexural strength of a component. It was simple to setup on the test machines and was sim-ple to ensure the setup was the same for each beam being tested. Another advantage of thestrategy developed is that the MATLAB programs have been designed to be easily modifiableby the user as all functions and variables have been defined parametrically. This means thatthe strategy can be used for any loading conditions for any beam or other structure and is thusa very adaptable and useful tool for designers. The method chosen is based on a regular rect-angular grid which is very quick to print as it is made up of long straight lines which meansthe number of stops and starts is reduced as the printing is as continuous as possible. TheMATLAB program also utilises various checks and optimisation to reduce the number of travelmoves between print moves.
The strategy presented in this paper will result in exactly the same final topology if the sameinputs are used. This makes it reliable and consistent. The strategy also uses additive iterationsto optimise the infill pattern, which is better suited to the additive manufacturing process asmentioned earlier.
Disadvantages The strategy developed in this research does also have some disadvantages.At present, the FEA mesh size will be the same size as the infill grid in the 3D print. The prob-lem with this is that FEA is most accurate when the mesh size is very small. This is becausethere would be a greater number of elements, which means the elements are smaller and there-fore the calculations made over each element are more accurate [34]. Furthermore, this strategyused first order cuboidal elements in the FEA mesh. Second order elements converge faster andwould be more accurate than the first order elements used in this strategy [34]. However, withthe current method, if the mesh size was made very small then the grid size would be so smallthat it would not be printable as there is a minimum spacing needed between each raster roadwhich is printed. A better approach would be to have the infill mesh and the FEA mesh set todifferent sizes. This will allow the FEA model to have a very small mesh, resulting in a moreaccurate stress distribution but would still leave the infill mesh at a printable resolution. Whencalculating the stress in each cell in the infill mesh, the slicing software would have to take anaverage of the stress at every node in the equivalent area in the FEA stress distribution. Thiswill result in more accurate infill optimisation. A further point is that the FEA model involvescontinuum elements but the final model created is a lattice structure. Some simplifications wereneeded to convert the continuum FEA stress distribution into one that could be discretised by alattice structure in the form of the optimised infill pattern created.
26

In regards to the method of testing the proof-of-concept beams, the three point point bendtest has disadvantages compared to a four point bend test. The results of the test are moresensitive to material imperfections in the specimen when compared to a four point bend test.This is because a four point bend test applies the load at two points which means that a muchlarger proportion of the beam reaches the maximum stress, as opposed to a three point bend testwhere only the section of the beam below the central loading pin is at maximum stress. Thisis problematic when testing brittle materials, as the higher central stress can initiate cracks andimperfections in the beam more so than the four point bend test.
The time taken to print the infills generated by this strategy could be decreased. The infillpattern would be kept the same but the commands generated for the 3D printer could be mod-ified slightly. Currently, the program infills each cell individually, and goes through one byone until every cell which requires infilling has been filled in. This involves lots of small printmoves and lots of travel moves. If longer print moves could be incorporated, then time savingscould be made. A key area where long continuous print moves could be incorporated is whenprinting the cross-member patterns. As the diagonals all line up, a few long print moves couldbe used to infill lots of cells which all fall along a diagonal line.
The simply supported, centrally loaded, Michell framework was shown by Michell to bethe most efficient possible in terms of strength per unit volume for that specific loading case[35]. A design very similar to this Michell framework could be used as the infill pattern forthe rectangular section under 3 point bend conditions optimised earlier in this paper. Thistheoretical design would perform better than the optimised infill designed in this paper as it ishas been shown to be the most efficient design as all the internal angles are 90 �. However, eventhough this would be the optimum design in terms of strength per volume, which is synonymousto the strength-to-weight ratio used in this paper, it is an irregular, complex design to print andthus would not score as highly in the strength-to-print time metric. Additionally, the strategydeveloped in this paper can be used to optimise any structure with any loading conditions,whereas Michell’s framework only works for one loading case and geometry.
The strategy developed in this paper is more concerned with the relative stress distributionacross the component rather than the absolute stress values. Thus, if the magnitude of theloading conditions in the FEA were scaled down by a factor of 10, the same infill pattern wouldstill be generated as the relative stress distribution across all of the nodes is the same. Theoptimised structure developed would need to be re-analysed in an FEA package to assess if thematerial it is designed from and its overall geometry is adequate to support the magnitude ofthe loading conditions. At present, the strategy only considers the direction and location of theloading.
7.4 Scope of WorkThe subject of optimising infill patterns for 3D printed parts based on their loading conditionsis a very new area of research as the topic is still in its infancy. The strategy developed in thisresearch is applicable to any rectangular section beam and the programs designed in MATLABare parametric and can be used to optimise a variety of structures based on their loading condi-tions. The proof of concept and testing performing in this research was limited to rectangularsection beams under 3 point bending conditions.
There exists great potential to further develop this strategy. The MATLAB program createdcan be further developed to optimise the infill for any structure, as long as the exterior geometrycan be created using Gcode by MATLAB the same way that the exterior rectangle is created inGcode using the MATLAB program. There exist MATLAB functions that can load in .stl files
27

and if these were integrated into the strategy, then any shape or structure could be optimised.Integrating the FEA inside a graphical slicing package based on the strategy developed in thisresearch would increase the usability of the optimisation process and allow it to expand intoindustrial use. Furthermore, if the FEA and optimisation were integrated into one package, thenthe optimised design could be re-analysed in the FE software to reiterate the design and ensurean optimum internal structure. Furthermore, another avenue which could be explored in termsof further work could modify the strategy developed in this paper and base the infill mesh on ahexagonal or a triangular grid. The cells which are higher stressed would still be infilled withmore material. The next section will conclude the research presented in this paper.
8 Conclusion3D printing has grown into a valuable tool for use by hobbyists at home and for use in man-ufacturing and rapid prototyping due to its short lead times and low waste. Slicing packagesare used to convert 3D CAD models into a printable file. However, at present, slicing packagesuse standard infill patterns and infill percentages. There is no consideration of the compo-nents loading conditions when selecting the infill pattern or infill percentage. This results innon-optimised 3D printed parts.
The main aim of this research was to develop a strategy to optimise the infill pattern of 3Dprinted parts based on their loading conditions. The strategy splits the object up into a regularrectangular grid and then takes a stress distribution across the object, calculated in FEA, andputs more material in cells in the grid with a higher stress.
The proof of concept for this strategy was to consider a rectangular section beam under 3point bending conditions. Optimised beams were designed using the strategy developed andwere tested against hexagonally-infilled beams in a 3 point bend test. The yield point for allthe samples was calculated and the strength-to-weight and strength-to-print-time metrics werecalculated. The highest performing optimised beam achieved scores of 16.3 N/gram and 4.7N/minute respectively compared to the highest performing hexagonally infilled beam whichscored 10.5 N/gram and 3.7 N/minute respectively. The increase in performance of the opti-mised beam compared to the hexagonally infilled beam was 55% and 27% in the two metricsrespectively. These increases in performance demonstrate the success of the strategy developedfor improving the performance of the beams.
The strategy developed in this research has been set up parametrically so that it can beused to optimise any loading conditions for rectangular section beams. This has been shown inthis paper where a cantilever beam loaded from its top face and one of its side faces was alsooptimised. The area of topology optimisation of 3D printed parts and infill is still in its infancy.Thus there exists great potential to further this work and develop algorithms to optimise shapesand structures more complex than rectangular-section beams.
9 References[1] G. Hodgson. Fused Filament Fabrication. January 2014. Date Accessed: 30/03/2015.
URL: http://reprap.org/wiki/File:FFF.png#filelinks.
[2] UP Plus 3D Printer Updated to the UP Plus 2. January 2012. Date Accessed:30/03/2015. URL: http://3dprinting.co.nz/products/up-plus-3d-printer/.
[3] Slic3r Manual: Infill Patterns and Density. January 2014. Date Accessed: 30/03/2015.URL: http://manual.slic3r.org/expert-mode/infill.
28

[4] J. Hornick and D. Rolland. Many 3D Printing Patents Are Expiring Soon. December2013. Date Accessed: 16/04/2015. URL: http://3dprintingindustry.com/2013/12/29/many-3d-printing-patents-expiring-soon-heres-round-overview/.
[5] A. Palo. 3D printing market to grow to US16.2 billion in 2018. March2014. Date Accessed: 18/03/2015. URL: http://www.canalys.com/newsroom/
3d-printing-market-grow-us162-billion-2018.
[6] C. Stamford. Gartner Says Worldwide Shipments of 3D Printers to Reach More Than217,000 in 2015. October 2014. Date Accessed: 16/03/2015. URL: http://www.gartner.com/newsroom/id/2887417.
[7] L. Franceschi-Bicchierai. Urbee 2 Is the 3D-Printed Car of the Future. October2013. Date Accessed: 10/03/2015. URL: http://mashable.com/2013/03/01/
urbee-3d-printed-car/.
[8] R. Dhakshyani, Y. Nukman, A. Osman, and N. Azuan. FDM models and FEA in dysplas-tic hip. Rapid Prototyping Journal, 18:215 – 221, 2012.
[9] T. Hales. The Honeycomb Conjecture. May 2002.
[10] Print Troubleshooting Pictorial Guide. February 2015. Date Accessed: 25/03/2015.URL: http://reprap.org/wiki/Print_Troubleshooting_Pictorial_Guide.
[11] B. Huang and S. Singamneni. Raster angle mechanics in fused deposition modelling.Journal of Composite Materials, 49:363 – 383, 2015.
[12] B.M. Tymrak, M. Kreiger, and J.M. Pearce. Mechanical properties of components fabri-cated with open-source 3D printers under realistic environmental conditions. Materialsand Design, 58:242 – 246, 2014.
[13] S.H Ahn, M. Montero, D. Odell, S. Roundy, and P.K. Wright. Anisotropic material prop-erties of fused depostion modeling ABS. Rapid Prototyping Journal, 8(4):248 – 257,2002.
[14] O. Luzanin, D. Movrin, and M. Plancak. Effect of layer thickness, deposition angle, andinfill on maximum flexural force in FDM-built specimens. Journal for Technology ofPlasticity, 39(1), 2014.
[15] B.H. Lee, M. Abdullah, and Z.A. Khan. Optimization of rapid prototyping parameters forproduction of flexible ABS object. International Journal of Machine Tools and Manufac-turing, (169):54 – 61, 2005.
[16] V. Vijayaraghavan, A. Garg, J.S.L. Lam, B. Panda, and S.S. Mahapatra. Process charater-isation of.
[17] J.R. Hossain, D. Espalan, M. Perez, and R. Wicker. Improving tensile mechanical prop-erties of FDM-manufacutred specimens via modifying build parameters. 2013.
[18] N. Umetani and R. Schmidt. Cross-sectional structural analysis for 3D printing optimisa-tion. 2013.
29

[19] U. Schramm and M. Zhou. Recent developments in the commercial implementation oftopology optimisation.
[20] M. Zhou, R. Fleury, Y.K. Shyy, H. Thomas, and J.M. Brennan. Progress in topologyoptimization with manufacturing constraints. Altair Engineering, Inc.
[21] M. Tomlin and J. Meyer. Topology optimization of an additive layer manufactured.
[22] I. Brackett, I. Ashcroft, and R. Hague. Topology optimization for additive manufacturing.Loughborough University, 2011.
[23] L. Lu, A. Sharf, H. Zhao, Y. Wei, Q. Fan, X. Chen, Y. Savoye, C. Tu, D. Cohen-Or,and B. Chen. Build-to-last: Strength to weight 3D printed objects. ACM Trans. Graph.,33(4):97:1–97:10, 2014.
[24] Simplify3D Software. 2014. Date Accessed: 15/04/2015. URL: https://www.
simplify3d.com/software/m.
[25] M. Troy. Altair OptiStruct Revolutionizes Lattice Structures for 3D Printing.Feb 2015. Date Accessed: 15/04/2015. URL: http://www.altair.com/(X(1)
S(uihmrlgoujmnnlxjre0xmzna))/NewsDetail.aspx?news_id=11109&Aspx.
[26] J. Van der Geest. INSERTROWS (v2.0, may 2008). May 2008. Date Accessed:30/03/2015. URL: http://uk.mathworks.com/matlabcentral/fileexchange/
9984-insertrows--v2-0--may-2008-/content/insertrows.m.
[27] H. Thomas. Anisotropic material properties of fused depostion modeling ABS. 2014.
[28] 2519-100 Series Load Cells. 2003. Date Accessed:31/03/2015. URL: http://www.artisantg.com/info/PDF_
_496E7374726F6E5F323531395F3130305F446174617368656574.pdf.
[29] Instron 3343 1 kN Single Column Testing Systems. 2003. Date Ac-cessed: 31/03/2015. URL: http://vecomtech.com/en/single-column-utm/
instron-3343-1-kn-single-column-testing-systems.html.
[30] Filament volume and length. July 2013. Date Accessed: 25/03/2015. URL: http://www.toybuilderlabs.com/blogs/news/13053117-filament-volume-and-length.
[31] R. Hagen. Basics of PLA. July 2013. Date Accessed:26/03/2015. URL: http://www.uhde-inventa-fischer.com/linkservid/
14D9B34D-5056-A765-BB1E731580EA135C/showMeta/0/.
[32] H.A Eschenauer and N. Olhoff. Topology optimization of continuum structures:a review.Applied Mechanics Review, 54(4):331 – 390, 2001.
[33] S.C. Burgess. Shape factors and material indices for dimensioally constrained structures- Part 1: beams, volume 214. 1999.
[34] P. Dvorak. Avoiding pitfalls in FEA. October 2013.
[35] S.C. Burgess. The Ranking of efficiency of structural layouts using form factors - Part 2:design for strength, volume 212. 1997.
30

10 Appendices
10.1 Appendix 1 - Beams Tested
Figure 17: Renders of all the beams printed and tested.
i

10.2 Appendix 2 - Table of Results
Print Time Weight(grams)
YieldPoint (N)
Strength/weight(N/gram)
Strength/Print Time(N/minute)
5%
1 56 28.54 75 2.6 1.32 56 27.32 90 3.3 1.63 56 28.34 80 2.8 1.4
Mean 56 28.07 82 2.9 1.5
10%
1 1h40 42.77 348 8.1 3.52 1h40 43.38 415 9.6 4.23 1h40 43.74 316 7.2 3.2
Mean 1h40 43.30 360 8.3 3.6
15%
1 2h29 57.45 600 10.4 3.82 2h29 57.36 500 8.7 3.13 2h29 57.49 550 9.6 3.5
Mean 2h29 57.43 550 9.6 3.5
20%
1 3h27 74.24 760 10.2 3.72 3h27 74.1 770 10.4 3.73 3h27 72.03 790 11.0 3.8
Mean 3h27 73.46 773 10.5 3.7
1levelgrid
1 1h47 38.97 176 4.5 1.62 1h47 38.64 182 4.7 1.73 1h47 38.64 178 4.6 1.7
Mean 1h47 38.75 179 4.6 1.7
3levels
1 3h55 57.17 900 15.7 3.82 3h55 57.18 900 15.7 3.83 3h55 57.04 708 12.4 3.0
Mean 3h55 57.13 836 14.6 3.6
Even 2
1 2h48 45.51 700 15.4 4.22 2h48 45.24 620 13.7 3.73 2h48 44.5 628 14.1 3.7
Mean 2h48 45.08 649 14.4 3.9
Even 3
1 3h21 49.21 780 15.9 3.92 3h21 49.53 900 18.2 4.53 3h21 49.34 736 14.9 3.7
Mean 3h21 49.36 805 16.3 4.0
Table 2: Results table from the testing.
ii

10.3 Appendix 3 - Force-Extension Graphs
Figure 18: Force-extension graphs for all of the beams tested.
iii