OPTIMISATION AND CONTINUOUS IMPROVEMENT OF · PDF file2 OPTIMISATION AND CONTINUOUS...
19
1 OPTIMISATION AND CONTINUOUS IMPROVEMENT OF ANTAMINA COMMINUTION CIRCUIT Edward Rybinski 1 , Jorge Ghersi 1 , Frank Davila 1 , Javier Linares 1 Walter Valery 2 , Alex Jankovic 2 , Roberto Valle 2 and Serkan Dikmen 2 1 Compañía Minera Antamina S.A Derby 055, torre 1, piso 8, oficina 801, Santiago de Surco Lima 33, Perú ([email protected], [email protected], [email protected], [email protected]) 2 Metso Process Technology and Innovation 1/8-10 Chapman Place Eagle Farm, Brisbane, QLD, Australia ([email protected] )
Transcript of OPTIMISATION AND CONTINUOUS IMPROVEMENT OF · PDF file2 OPTIMISATION AND CONTINUOUS...

1
OPTIMISATION AND CONTINUOUS IMPROVEMENT OF ANTAMINA COMMINUTIONCIRCUIT
Edward Rybinski1, Jorge Ghersi1, Frank Davila1, Javier Linares1
Walter Valery2, Alex Jankovic2, Roberto Valle2 and Serkan Dikmen2
1Compañía Minera Antamina S.ADerby 055, torre 1, piso 8, oficina 801, Santiago de Surco
Lima 33, Perú([email protected], [email protected], [email protected], [email protected])
2Metso Process Technology and Innovation1/8-10 Chapman Place
Eagle Farm, Brisbane, QLD, Australia([email protected])

2
OPTIMISATION AND CONTINUOUS IMPROVEMENT OF ANTAMINA COMMINUTIONCIRCUIT
ABSTRACT
Compañía Minera Antamina is a polymetallic mining complex that produces copper and zincconcentrates as primary products and molybdenum and lead/bismuth/silver concentrates as by-products. In2007, Metso Process Technology and Innovation (PTI) was contracted to increase SAG mill throughput byintegrating and optimising blast fragmentation, crushing and grinding for the harder M4/M4A (CuZn) ores.Following the implementation of recommendations provided by Metso PTI, the SAG mill throughputincreased from 2750tph to reach an average of 3600tph for the remainder of 2007. Due to continuedapplication of mine to mill integration and optimisation philosophy, by 2010, the concentrator consistentlyexceeded the target of 4400tph while processing harder CuZn ores.
KEYWORDS
Antamina, SAG, blasting, crushing, grinding, optimisation, simulation, comminution
INTRODUCTION
Antamina, a polymetallic mining complex that produces copper and zinc concentrates as primaryproducts and molybdenum and lead/bismuth/silver concentrates as by-products, represents one of the maincomplexes of the Peruvian mining industry. It is situated in the central Peruvian Andes around 4,300meters above sea level.
The project, which commenced operation in 2001, had worked on initiatives which achieved thedesign capacity of 70,000tpd after five months of operation with the copper ore (M1/M2). There wereseveral issues associated with the copper/zinc ores (M4/M4A), which limited the throughput for these orestypes to just half of the M1/M2 throughputs (i.e., 2,000-2,500tph vs. 4,000-5,000tph respectively).Achieving similar throughputs for both ore types became a challenge for Antamina, and in 2007 Antaminacontracted Metso Process Technology & Innovation (PTI) for the implementation of a Mine to Mill project.
Ore classification at Antamina considers six principal ore types which are processed based ongrinding and flotation requirements. One of these ore types includes sub categories, M4 and M4A, whichare blended together prior to processing in order to get the most stable grades for the downstreamseparation. This paper describes the work carried out by Antamina and Metso PTI with the objective toincrease the throughput exclusively for the copper/zinc ore types (M4/M4A).
Metso PTI started the project in early 2007 and continued until the end of 2009. Work conductedduring this period included: comprehensive review of existing operations at the mine and in thecomminution circuits, characterisation of ore sources into domains of similar blasting/fragmentationproperties, measurement of blast design implementation and resulting fragmentation, measurement ofvibration and definition of main constraints, monitoring of blasted material movements using passiveradio-frequency transponders or SmartTagTM system, review of current operating practices of the primarycrusher, the SAG and Ball mills grinding circuits, a comprehensive analysis of historical data, modeling ofcurrent drill and blasting, crushing and milling operations, and mine to mill simulations of optimumoperating strategies which were finally put into practice in combination with other initiatives led byAntamina personnel.

3
Metso PTI methodology is based on mechanistic and forward analysis that involves the followingpractices:
a) Characterisation and delineation of blast domains based on rock structure and strength. Themeasurement techniques that have been developed over many years present results that represent theconditions in which the mines operate in a production environment. The techniques are practical andstatistically representative requiring only a few other tests to validate the results and confirm thecorrelation (e.g., Drop Weight and SMC tests). They are inexpensive and can be easily carried outby mine personnel.b) Establish process constraints such as wall stability, damage and control in the pit and in thetailings dam, presence of water, ore dilution, muckpile characteristics, size of mining equipment,size and installed power of crushing and milling equipment and other process bottlenecks.c) Definition of the key downstream requirements and development of drilling/blasting strategies foreach domain to suit the defined downstream requirements (milling of ore or waste).d) Use of proven software tools, predictive models and simulations in conjunction with theexperience and collaboration of mine and plant personnel to establish optimum operating andcontrol strategies to maximise overall profit from the blast to the mill.e) Implementation and monitoring of the defined integrated operating strategies (suitable blastdesigns for each ore domain followed by respective optimal crushing and grinding strategies) andestablishment of standards, quality assurance and control mechanisms.f) Analysis and management of comprehensive data and results.g) Long term implementation and maintenance of benefits.
The steps above are focused on the development of an integrated mining and milling optimisationstrategy to increase profitability of the operation. Part of this strategy is to increase plant throughput withlittle or no capital investment. By optimising rock breakage and fragmentation from blasting throughcrushing and grinding the following benefits could be achieved:
Increased excavation and loading efficiencies;Reduced ROM topsize allowing the primary crusher to achieve greater throughput while operatingat a smaller gap to produce mill feed with a finer topsize;Reduced SAG mill feed topsize and increased proportion of fines (-10mm material) to increasemill throughput with existing installed power;Minimal adverse impacts such as dilution or ore loss, structural damage or environmentalnuisance.
This paper summarises the work performed by Antamina and Metso PTI and includesrecommendations of changes in blasting, crushing and grinding operation and also control in order toimprove mill performance during the treatment of M4/M4A ores.
ROCK CHARACTERISATION
Metso PTI Process Integration & Optimisation methodology involves rock characterisation interms of its strength and structure. One of the objectives of rock characterisation is to determine domainswithin the orebody that will generate similar blast fragmentation. By understanding what domains exist, themine can establish standard blast patterns for each of the different domains that will generate similarfragmentation distributions. This may require either an increase in blasting energy (e.g., powder factor orexplosive weight per tonne of rock) or perhaps a decrease in energy – depending on the rock properties.

4
Measurement of Rock Strength & Structure
Fracture Frequency (FF) and Rock Quality Designation (RQD) give a good indication of the rockmass structure, which in turn will drive the proportion of coarse material in the blast fragmentation. Finesgeneration in the blast is mainly related to rock strength as well as explosive/rock interaction.
The Point Load test provides an Is50 index for rock strength classification that is well known andwidely used in the industry, mainly by geotechnical personnel. It is commonly used as a quick and simplemethod to predict Unconfined Compressive Strength (UCS).
Antamina categorises their ore into material classifications or ore types: copper-only (M1, M2,and M2A), copper-zinc (M3, M4, M4A) and bornite (M5, M6) depending on the Cu, Zn and Bi assays.However, this ore type classification is based on assays alone and does not necessarily reflect any distinctrock type or lithological variation.
Much higher mill tonnages experienced for M1 compared with M4/M4A material are due todifferences in the SAG mill feed size distribution. Figure 1 shows a range of M4A SAG feed sizedistributions compared with an M1 feed size distribution.
Figure 1 – Comparison of SAG mill feed size & throughputs
It is clear that the M1 material fragments very finely in the blast – producing about 70% minus10mm and an 80% passing size (P80) of 20 to 25mm after crushing, and is processed at 5,200tph. Incontrast, the M4A material blasts much coarser – after crushing it has a P80 of 50 to 150mm – andrepresents a typical SAG mill feed. This material is processed between 2,350 and 2,850tph.
Rock Strength – Point Load Index
Based on the Point Load Index (PLI) Is50 value, the Unconfined Compressive Strength (UCS)was estimated. The results, presented in Figure 2, show that all ore types and survey samples exhibited awide range of rock strengths from below 50MPa to more than 250MPa. The wide range of strengthsindicates that each ore type is not consistent in rock properties; most likely due to a variety of rock typesand structures.
0
10
20
30
40
50
60
70
80
90
100
1 10 100 1,000Particle Size (mm)
Cum
ulat
ive
Wei
ght %
Pas
sing
5,200 tph2,850 tph2,600 tph2,350 tph
M4A
M1
M4A
M4A

5
Figure 2 – Summary of estimated UCS from Point Load Index measurements (Jan 2007)
Metallurgical Hardness Testing
A summary of the Bond Ball Mill Work Index (BWi) results since 2002 is shown in Table 1.These results appear to be quite consistent with M1 reporting a BWi of around 10kWh/t (relatively soft)and M4/M4A between 12 and 14kWh/t (moderate). It appears that the variability in hardness between oretypes is lessened when the material is below 3mm and suitable to be processed by ball mills.
From a SAG mill’s perspective, the UCS and BWi results indicate a wide variability in rockhardness with both M1 and M4A ore types exhibiting soft and hard behaviour. However, once reduced toball mill feed size; the materials have similar properties with M1 exhibiting a slightly lower energyrequirement compared with M4A.
With a constant blast pattern used for all these ore types, it would be expected that the variablerock properties would respond differently and result in a finer and coarser fragmentation which finallyresults in a range of mill throughputs.
Overall, the M1 material fragments very well whereas M4/M4A ore types do not fragment as welland result in lower mill production. However, the variable production figures indicate that fragmentation isnever consistent – a consequence of not adjusting the blast pattern to suit the rock conditions. Byidentifying the rock strength and structure associated with each rock type, and adjusting the blast designaccordingly, it is expected that the variability would be reduced and making it easier to predict.
Table 1 – Summary of Bond Ball Work Index by ore type
0
1
2
3
4
5
6
7
8
9
<25 <50 <75 <100 <125 <150 <175 <200 <225 <250 <275 <300Estimated UCS (MPa)
No
of O
bser
vatio
ns
M4A-MPM4M2M1WasteM4A Survey 1M4A Survey 2
Ore type Date BWi(kWh/t) S.GM1 Feb 2002 10.0 3.10M1 Aug 2002 9.5 2.90M1 Oct 2002 9.6 3.00M1 Feb 2006 10.3 3.40M1 intrusive Feb 2006 9.5 2.80

6
Blasting Domain Definitions
It was recommended that Antamina initiate a drill core-testing program measuring both rockstrength and structure based on PLI and RQD. In core sections of known ore types, samples of differentrock types should be logged for RQD and then tested for PLI. Very quickly, Antamina could generate anupdated database of rock strength and structure for rock types associated with M1 and M4A (the two mainore types requiring domain definition). Table 2 lists possible rock types to be tested for M1 and M4A.
Table 2 – Rock Types to be characterised (Based on 2007 mill feed)
Ore Type Rock TypeM1 Café EndoskarnM1 Rosa EndoskarnM1 Café Verde ExoskarnM1 IntrusiveM4A Verde ExoskarnM4A Café Verde ExoskarnM4A Café Endoskarn
When designing a blast pattern, it was recommended to estimate the amount of Endoskarn andExoskarn in the blast and set the burden and spacing according to a tighter pattern for Exoskarn and widerpattern for Endoskarn. Metso PTI recommended that Antamina design the blast pattern for the mostdifficult rock conditions encountered –i.e., presence of M4A material, Exoskarn rock type or highBlastability Index– whatever the measurement used. Rather than design the blast for the average rockconditions or for the softest material, blasts should be designed to adequately fragment the mostchallenging material. This will ensure a minimum quality of fragmentation (and mill throughput) ismaintained.
REVIEW OF BLASTING PRACTICES
Metso PTI carried out an audit of Blast 3-SP-4283-08 detonated on January 10th 2007. The blastpolygon was a mix of ore (domains M4, M4A, M1 and M2) and waste. The copper zinc ore (M4, M4A)from this blast was monitored very closely with passive radio frequency transponders (SmartTags™)placed both in the stemming of some of the blast holes and on the surface of the muckpile after the blast totrack this particular ore “parcel” from blast to the mill. The SmartTags™ were detected using an antennaplaced over the primary crusher product conveyor and another over the SAG mill feed belt. The followingdata was collected as a part of the blast audit:
Blasthole locations (design & actual)
M3 Jan 2002 10.5 3.71M3 Jan 2003 12.1 3.64M4 Jan 2002 12.1 3.59M4 Nov 2002 11.3 3.30M4 Feb 2003 10.5 3.60M4A Mar 2002 12.7 3.30M4A Feb 2003 12.6 3.30M4A May 2003 11.8 3.20M4A Feb 2006 13.1 3.54M4A Feb 2006 13.8 3.39

7
Explosive loadingMeasurement of velocity of detonation (VOD) and far-field vibrationFragmentation images for size analysisSamples for Point Load Testing
As a part of the audit carried out on Blast 3-SP-4283-08, Metso PTI reviewed ‘as designed’ and‘as drilled’ drill hole parameters to determine accuracy of the design implementation. The parametersincluded burden, spacing, blasthole length and stemming length. Figure 3 overlaps the location of thedesigned versus the ‘as drilled’ hole patterns, which generally matched very well.
Figure 3 – Design and actual drill hole locations
Estimates of ROM or blast fragmentation distributions were made using image analysis software.Digital photographs were taken of muckpile, shovel working face (digline) and haul truck beds whiledumping at the primary crusher. An example of the image delineation used to determine the particle sizedistribution is presented in Figure 4.
Figure 4 – of Truck bed image and resulting particle delineation
Blast fragmentation modelling has been used to identify the key parameters affectingfragmentation. Each of these parameters has a natural variation (e.g., rock strength) and error (e.g., holeposition) associated with it. Therefore, a stochastic approach is taken in modelling blast fragmentation andthese variables are input with a mean and standard deviation. This modelling approach uses Monte Carlosampling followed by model simulation giving envelopes of ROM size distributions.
8944600
8944650
8944700
8944750
8944800
8944850
8944900
273850 273900 273950 274000 274050 274100 274150
As designedAs DrilledAquila

8
Figure 5 shows the impact of variations in blast design parameters (explosive, rock, drill pattern,stemming length, and subdrill) on the fragmentation of Blast 3-SP-4283-08. The envelope of ROM ore sizedistributions is shown by the lower 95% confidence level, the upper 95% confidence level and the mean.Based on the variation in design parameters measured in the audited blast, it is expected that significantvariations in blast fragmentation are common at Antamina. For these simulations, the 80% passing sizevaried from 157 to 476mm.
Figure 5 – Stochastic fragmentation modelling
The fragmentation model was calibrated for a range of ore types (i.e., M1, M2 and M4). Itappeared that fragmentation in the M4 domain is much coarser than M1 and M2. Based on the SAG millfeed surveys conducted, the variations in cumulative percent passing at 25mm size in M1 and M4/M4A are70 to 80% and 35 to 60%, respectively. Figure 6 shows typical ROM fragmentation curves for M1, M2 andM4/M4A ores.
Figure 6 – Blast fragmentation modelling of different ore types
0
10
20
30
40
50
60
70
80
90
100
1 10 100 1000 10000
Cum
ulat
ive
% p
assi
ng
Size (mm)
Meanlower -95% confidenceupper +95% confidenceSurvey 1Survey 2
0102030405060708090
100
1 10 100 1000 10000
Cum
ulat
ive
% p
assi
ng
Size (mm)
M4M1M2

9
The blast fragmentation model was used to predict the ROM fragmentation size. Two additionalblast designs were reviewed for the M4/M4A domain using a new powder factor design. The fragmentationmodel estimates a reduction in ROM P80 from 401 to 129mm. The results showed that the blast designwith the smaller blasthole diameter generates the finest fragmentation. The explosive energy distributionwas better with this design. Thus, Metso PTI recommended a blast design with 251mm drill holes.
SMARTTAGTM MATERIAL TRACKING
In any PIO project, it is crucial that the material being fed to the mill during a plant survey is thesame material that has been characterised in the mine. Metso PTI has developed an ore block trackingsystem named SmartTag™ that allows parcels of ore to be tracked, from the mine, through the crusher andfinally into the grinding mills. The SmartTags™ are built around robust passive radio frequencytransponders. Not having an internal power source, they can remain in stockpiles and ROM pads forextended periods of time.
Figure 7 shows a typical SmartTag™ installation. The tag passes under the antenna along with theore where it is energised by an electromagnetic field. The tag then transmits its unique ID back to theantenna where it is stored along with a time stamp in the recording device or Tag Reader. For permanentinstallations, a wireless communications link or direct network connection can be used to transmit the taginformation back to a central database.
Tags can be placed in the stemming column of blastholes and a high percentage will survive thedetonation. Alternately, they can be placed on the muckpile surface post-detonation. The tags are smallenough to pass through a primary crusher and be detected on the product conveyor belt. They can then bedetected on the SAG mill feed belt before being destroyed in the mill. SmartTags™ offer an inexpensiveand versatile tool for material tracking and can provide information on blast movement during detonation,dilution or ore loss, stockpile inventories and blending practices.
Figure 7 – Elements of SmartTagTM installation
By locating antennas at critical points in the process flow ahead of the milling circuit,SmartTags™ can be detected a number of times and provide valuable information on material movements.In particular, they provide a means to link the spatial information associated with the mine to the time-based or temporal information of the concentrator. Two antennas were installed at Antamina – one on theprimary crusher product belt and another on the SAG mill feed belt – as shown in Figure 8a and b.

10
(a) Primary crusher product. (b) SAG mill feed
Figure 8 – SmartTag TM temporary installation
For audited blast 3-SP-4283-08 discussed previously, 101 SmartTags™ were placed in the stemming of theblast holes, with a further 48 on the muckpile surface post-detonation. Figure 9 illustrates the tagdistribution in each case.
(a) stemming columns of blast holes (b) muckpile surface post detonation
Figure 9 – SmartTag TM locations
Figure 9a shows that all the blastholes that were tagged were in the southwest portion of the blast.The southeast corner was known to be in waste and was not tagged. The x,y,z locations of all tags placedon the muckpile surface post-detonation were picked up by a surveyor. The audited blast was quiteconfined with the material throw inwards. As a result the muckpile heave was measured to be a few metresas shown in Figure 9b.
The SmartTagTM detection times are presented at the bottom of Figure 10, with blue iconsrepresenting tags that passed through quickly (<2hrs) and red icons representing tags that passed throughslowly (>32hrs). In the first cluster of blue icons, it appears that the coarse ore pile height was low for anextended period. This also corresponded with an increase in the SAG feed size F80 (mm) as measured bythe on-line image analysis system and a decrease in mill tonnage. January 16 th recorded periods where thetag residence time was long. It is hypothesised that the tags that had detection times greater than 32 hourswere placed on the pile at high stockpile levels and were consequently carried to the outer perimeterincreasing residence time.
Knowledge of shovel locations over time – combined with the SmartTag™ detection timesenables material movements during a blast to be estimated. From these movements, the potential for ore

11
loss and dilution can be quantified. This is particularly important at Antamina where the polygons ofdifferent ore types and waste can be very small – perhaps only tens of metres squared. Using the tagdetection times at the primary crusher, the dispatch records were used to determine which truck wasdumping in addition to the shovel location when that truck was filled.
The audited blast was quite confined where the material was thrown internally and this wasreflected in the resulting tag movement vectors. The length of the vector also reflected the distance the tagsmoved during the blast (and possibly during clean-up and excavation). This movement averaged 25mindicating that some of the material moved in excess of 25m. While some of this may be due to the tagsrolling down the free face as they are exposed during excavation, it is estimated that the tags experienced atleast 15m of movement in the direction of the free face. Based on the SmartTag™ results from the auditedblast, there was evidence of significant dilution and ore loss.
Figure 10 – SmartTag™ detection times with coarse ore stockpile conditions
PRIMARY CRUSHER OPERATION
Operation of the primary crusher is very important in optimising mill feed size for maximumthroughput. While it has already been stated that the majority of the fines in the feed are generated in the‘crushing’ zone during the blast, the top size of the mill feed is dictated by the crusher setting and operation.Maximising the average power draw of a primary crusher will result in a finer product. In addition, chokefeeding of a primary crusher results in multiple breakage events as the material passes down the chamberrather than only a few events for a non-choked crusher. The ROM topsize and crusher gap have thefollowing interdependence, which will affect “Mine-to-Mill” optimisation:
20
30
40
50
60
70
80
90
100
110
120
12-Jan 12:00 13-Jan 12:00 14-Jan 12:00 15-Jan 12:00 16-Jan 12:00 17-Jan 12:00 18-Jan 12:00
Feed
Siz
e (m
m),
Pile
Hei
ght (
%)
500
1,000
1,500
2,000
2,500
3,000
3,500
4,000
Tonn
age
(tph
)
F80 (mm)COS PileSAG TonnageDetected Tags
Blue: <2hrresidence time
Red: >32hrresidence time
Survey 1 Survey 2
Full Stockpile

12
Crusher throughput for a given CSS is largely controlled by the largest rocks in the ROM.Reducing the top size of ROM ore allows the crusher to operate at the same throughput (and samepower draw) with a smaller CSS.Finer ROM allows the CSS to be reduced and results in the production of a finer crusher product.Finer ROM and smaller CSS allows better choke feeding in the crusher, which produces finer feedto the SAG mills and also increases the life of the crusher mantle and concaves.For a given crusher CSS, variations in the crusher product P80 will result from differences in orehardness as well as variations in the blast fragmentation.
Primary Crusher Product Sample
In order to evaluate the performance of the primary crusher, a sample of the product material wascollected from the conveyor belt on January 15th following the Metso PTI methodology. At the same time,trucks dumping into the crusher were photographed for image analysis of the crusher feed material. Thesedata were used to develop a primary crusher model for the simulation study investigating the impact ofROM ore size and crusher setting on mill throughput. The ROM and crusher product size distributions areprovided in Figure 11. Figure 11
Figure 11 – ROM and crusher product size distribution
Using a tighter setting did not produce a higher power draw and therefore there was more capacityavailable in the primary crusher to operate at a tighter setting (4.5 to 5 inches) without negatively affectingthe throughput.
GRINDING CIRCUIT
In January 2007, two complete grinding circuit surveys were performed followed by a SAG millcrash stop and grind-out. After stopping the mill, a SAG mill feed sample was also collected fromConveyor 1. Figure 12 shows the circuit and sampling points of the grinding circuit.

13
Figure 12 – Flow sheet and sampling points of the milling circuit
Due to lower throughputs when processing M4/M4A ores, only two of the three ball mills areoperated when treating these ores. For instance, during the first survey, ball mill 2 was not operating andduring the second survey, ball mill 1 was not operating. The summary of the surveys conditions arepresented in Table 3.
Table 3 – Summary of SAG mill survey conditions Variable Survey 1 Survey 2
Power, MW 14.8 15.6Bearing Pressure, kPa 5347 5386F80, mm 89.7 79.5
Throughput, tph 2366 2617 Total charge, % 23 23
Mass Balancing
Mass balancing showed that the survey data were of good quality and consistent. Table 4summarises the key stream tonnages, percent solids and P80 values for both surveys.
The cyclone feed density was lower for Survey 1 compared to Survey 2 (60% vs. 65%). All theball mill circuits had relatively low circulating loads of approximately 230%.

14
Table 4 – Grinding circuit survey – balanced results for Survey 1 and Survey 2
StreamMass Balance results Survey 1 Mass Balance results Survey 2
Solids (tph) % solids P80(mm) Solids(tph) % solids P80
(mm)Fresh Feed 2363 96.69 121.5 2617 95.0 92.99SAG discharge 2363 70.88 1.12 2617 69.7 1.47trommel oversize 45.78 92.31 30.18 62.9 95.7 30.72BM 1 product 2482 69.85 0.321 3131 77.5 0.454BM 3 product 2342 68.68 0.296 3079 75.5 0.335cyclone 1 feed 3602 59.46 0.454 4462 65.1 0.651cyclone 1 o/f 1120 38.42 0.124 1332 42.9 0.13cyclone 1 u/f 2482 78.98 0.736 3131 83.5 1.234cyclone 3 feed 3585 60.67 0.351 4364 64.9 0.409cyclone 3 o/f 1242 41.95 0.113 1286 43.3 0.116cyclone 3 u/f 2342 79.47 0.484 3079 82.1 0.555SAG disch. BM1 1120 74.59 2.112 1332 72.4 1.984SAG disch. BM3 1242 67.85 0.619 1286 67.0 1.058
Based on the mass balanced results, the cyclone efficiency curves were plotted. It was observed inFigure 13a that the sharpness of classification for Survey 1 was relatively high and fraction of fines by-passing to the underflow was relatively low (<20%). This can be explained by a favourable cyclone feeddensity of around 60%.
Figure 13b shows the cyclone efficiency curves for Survey 2. The cyclone feed density was higher,therefore, the cyclone efficiency was slightly lower and the amount of fines by-passing to the underflowhad increased to at least 25%.
(a) Survey 1 (b) Survey 2
Figure 13 – Cyclone efficiency curves
Model Fitting
Following data balancing, mathematical models of all the process units were calibrated inJKSimMet. The purpose was to model the grinding circuit and primary crusher as they were operating atthe time of the surveys.
0.0
10.0
20.0
30.0
40.0
50.0
60.0
70.0
80.0
90.0
100.0
0.01 0.1 1 10
Particles size (mm)
Effic
ienc
y %
(Und
erflo
w)
Eff. Cyc 1Eff. Cyc 3d501 = d503 = 0.1 mm
0.0
10.0
20.0
30.0
40.0
50.0
60.0
70.0
80.0
90.0
100.0
0.01 0.1 1 10
Particle size (mm)
Effic
ienc
y %
(Und
erflo
w)
Eff. Cyc 2Eff. Cyc 3d502 = 0.09 mmd503 = 0.11 mm
15
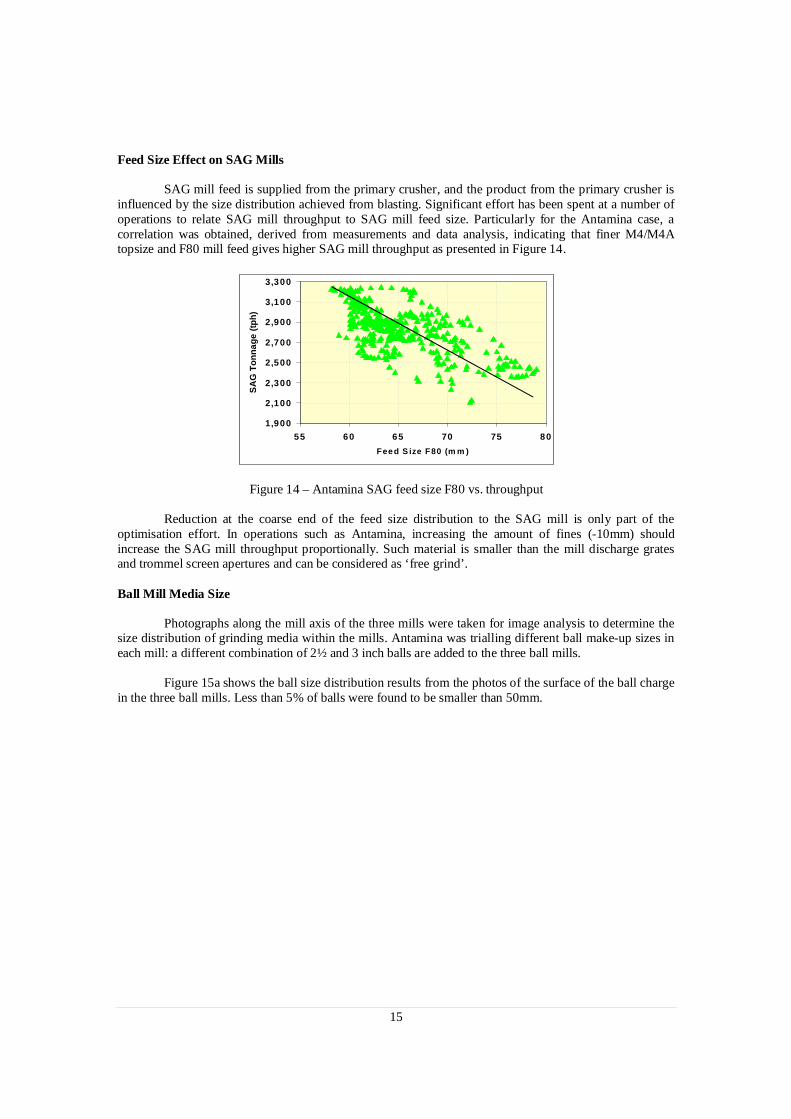
Feed Size Effect on SAG Mills
SAG mill feed is supplied from the primary crusher, and the product from the primary crusher isinfluenced by the size distribution achieved from blasting. Significant effort has been spent at a number ofoperations to relate SAG mill throughput to SAG mill feed size. Particularly for the Antamina case, acorrelation was obtained, derived from measurements and data analysis, indicating that finer M4/M4Atopsize and F80 mill feed gives higher SAG mill throughput as presented in Figure 14.
Figure 14 – Antamina SAG feed size F80 vs. throughput
Reduction at the coarse end of the feed size distribution to the SAG mill is only part of theoptimisation effort. In operations such as Antamina, increasing the amount of fines (-10mm) shouldincrease the SAG mill throughput proportionally. Such material is smaller than the mill discharge gratesand trommel screen apertures and can be considered as ‘free grind’.
Ball Mill Media Size
Photographs along the mill axis of the three mills were taken for image analysis to determine thesize distribution of grinding media within the mills. Antamina was trialling different ball make-up sizes ineach mill: a different combination of 2½ and 3 inch balls are added to the three ball mills.
Figure 15a shows the ball size distribution results from the photos of the surface of the ball chargein the three ball mills. Less than 5% of balls were found to be smaller than 50mm.
1,900
2,100
2,300
2,500
2,700
2,900
3,100
3,300
55 60 65 70 75 80Feed S ize F80 (m m )
SAG
Ton
nage
(tph
)

16
(a) In three ball mills (b) Along ball mill 1
Figure 15 – Ball Size Distribution
The analysis of the ball size distribution along the mill axis was also carried out to determine iflarger balls tend to concentrate at the feed end and smaller balls towards the mill discharge. This effectmay be observed in Figure 15b for ball mill 1 where the proportion of large balls at the mill discharge islower than near the feed or middle of the mill. For the other two ball mills this effect was not observed andtherefore segregation along the mill axis could not be proven definitively.
“MINE TO MILL” SIMULATIONS
Models for blasting, crushing and grinding operations were developed based on data collected on-site and results of the samplings during trials. These models can be combined to simulate the overall“Mine-to-Mill” Process Integration & Optimisation. Inputs to these models include rock properties (UCS,RQD), blast design parameters (burden, spacing, stemming column, explosive type, etc.), primary crushersetting, SAG mill operating conditions (ball size, ball charge, total charge, grate size, mill speed, etc.) andball mill circuit conditions (ball size, ball charge, mill speed, cyclone geometry, pressure, etc.)
These simulations quantify the possible throughput increases. When changes indicate highertonnage, it is quite likely that combining two or more of these conditions will give an even higher increasein plant throughput. Conditions such as different blast designs, primary crusher setting, SAG mill gratedesign (worn vs. new), SAG mill ball charge level were considered in the simulation study.
ROM Size Distribution Simulations
The results of the simulations of the different ROM size distribution are presented in Table 5. TheBase Case followed the conditions of the audited blast while the D2 blast design and a 5 inch CSS on theprimary crusher resulted in a 12% increase in tonnage which translates to 2,750tph of the same material.The effect of blast fragmentation variability was demonstrated as the coarser end of the 95% envelope ofROM size reduced mill throughput by 10% and the finer end increased throughput by 22% or 3,000tph.
Total Distribution (%)
0
5
10
15
20
25
30
35
+0 -40 +40 -45 +45 -50 +50 -55 +55 -60 +60 -65 +65 -70 +70
Ball Diameter Range (mm)
Bal
l Wei
ght P
erce
ntag
e (%
)
BM#1
BM#2
BM#3
BM#1 (%)
0
5
10
15
20
25
30
35
40
+0 -40 +40 -45 +45 -50 +50 -55 +55 -60 +60 -65 +65 -70 +70
Ball Diameter Range (mm)
Bal
l Wei
ght P
erce
ntag
e (%
)
Near Feed
Middle
Near Discharge

17
Table 5 – Simulations of different ROM size distribution
Operating Condition BaseCase
D2Mean
CoarserROM
FinerROM
Run of Mine P80 (mm) 401 266 521 209
Primary Crusher CSS (inch) 5 5 5 5
SAG Feed Rate (tph) 2,450 2,750 2,200 3,000
SAG Feed F80 (mm) 119 99 120 92.8
SAG Feed % -10mm 27.7 38 22.8 41.1
Scats Rate (tph) 99.6 96 91.6 101.6
No. of Cyclones 8 9 7 9
Cyclone O/F % solids 33.5 39 34 52
Cyclone O/F P80 ( m) 125 139 119 165
Tonnage Increase (%) – 12.2 -10.2 22.4
SAG Mill Operating Condition Simulations
Simulations were carried out to investigate the impact of changing grate open area and SAG millball charge level. The simulations indicated that –as the grates wear– the scats rate increases marginallyand the mill tonnage increases by 4%. Due to additional ball mill capacity being available under lowtonnage conditions (i.e., M4A material), the option of increasing the trommel screen aperture and sendingcoarser material to the ball mills should be considered. Due to the fineness of the M1 (high tonnage) SAGmill feed, this should have little impact on the ball mill circuits.
At the time of the grinding circuit survey, the SAG mill was operating with a 13.5% volumetricball charge. A simulation of 15% ball charge level was done to estimate the impact on mill throughput.This result indicated that mill throughput could increase by 5% as a result of the greater ball load. Whilechanges in feed size and material hardness may reduce the benefit of an increased ball charge, it wasrecommended that Antamina trial a 15% ball load during M4/M4A campaigns.
CONTINUOUS IMPROVEMENT AFTER FIRST STUDY
Implementation of the recommendations made by Metso PTI during the 2007 study resulted in anincrease in SAG mill throughput from 2750tph up to an average of 3600tph. Following this, CompañíaMinera Antamina and Metso PTI entered into a technical services support contract for 2008-09, toimplement continuous improvement projects to further improve the mine and mill efficiencies. As a partof this contract two projects were conducted in 2008: 1) Mine to Mill Blast Fragmentation and 2) BlastDamage and Wall Control.
The main objective of the “Mine to Mill Blast Fragmentation” project was to improve blastfragmentation in M4/M4A ore blasts in order to increase the SAG mill throughput even further. Threehigh intensity blasts were conducted in M4/M4A ore and the ore was campaigned through the plant toassess the SAG mill performance. These high intensity blasts produced finer ROM fragmentation andfeed to the SAG mill. The SAG feed F80 was reduced to around 50-60mm compared to 100-120mmpreviously and fines (-10mm) percentage was increased from 25% to 45%. Primary crusher power peakswere reduced significantly during these campaigns. SAG mill throughput averaged 4100tph for the threeblasts and throughput above 4500tph was achieved for several hours during these trials.

18
A full plant survey was conducted during the third trial in December 2008, and used to updatesite specific blasting, crushing and grinding models as pebble crushers were installed in the meantime.Modelling and simulations indicated that modified blast designs and proper utilisation of pebble crusherscan increase the SAG mill throughput up to 4500tph for the softer ore and 4250tph for the harder ore.Simulation results shown in Figure 16 indicate that blast design changes increased the mill throughput by25% (14% from the first design change and 11% from the second design change). Simulations also showthat pebble crushers with larger grates can potentially increase the throughput by 11% and the increase inball load would contribute about 4%. M4/M4a ores have become softer compared to the 2006 base case.Where the ore is very soft, ore hardness has contributed to 11% increase whereas for relatively harder ore,its contribution is only 4%.
Figure 16 – Simulated effect of blast and plant changes on SAG mill throughput
Based on the results achieved in the project, Metso PTI concluded that Antamina can consistentlyachieve SAG mill throughput above 4000tph in M4/M4a ores by implementing the mine to mill processintegration and optimisation philosophy.
CONCLUSIONS
Compañía Minera Antamina engaged Metso Process Technology and Innovation (PTI) to providetechnical assistance for implementation of continuous improvement projects. The main objective of thesupport contract was to increase the SAG mill throughput by improving blast fragmentation andcomminution for the harder M4/M4A (CuZn) ores. This project started in 2007 and proceeded through acontinuous improvement contract to completion in 2009. The project consisted of a complete review andoptimisation of existing operations, including:
Characterisation of ore sources into domains of similar blasting/fragmentation properties;Measurement of blast design implementation and resulting fragmentation; measurement ofvibration and definition of main constraints;Monitoring of blasted material movements using passive radio-frequency transponders orSmartTagTM system;Review of current operating practices of the primary crusher and grinding circuits (SAG and Ballmills);Modeling of current drill and blasting, crushing and milling operations;

19
Simulations of optimum operating strategies from the mine to mill;Implementation of recommendations and operating strategies.
The production budget in 2007 was 2750tph for the harder CuZn ores. After the implementationof changes recommended by Metso PTI during the first phase of the project the production increased to3600tph on average for the remainder of 2007. By continued application of the mine to mill integrationand optimisation philosophy, the concentrator exceeded its target of 4400tph for harder CuZn ores by 2010.
ACKNOWLEDGEMENTS
Metso PTI thanks Compañía Minera Antamina for permission to publish this paper and acknowledgecontribution of all company employees involved in this project.
REFERENCES
Dechert, C., 2006, Antamina – “Design through to Operation”, SAG Conference 2006.
Valery, W., Sedat, E., Colacioppo, J., La Rosa, D., Jankovic, A., Metso Process Technology & Innovation– “Mine to Mill Process Integration & Optimisation at Compañía Minera Antamina”, 2007.
Valery, W., Valle, R., Corsini, S., Kanchibotla, S., Colacioppo, J., Dikmen, S., Baguley, P. – MetsoProcess Technology & Innovation – “Mine to Mill Blast Fragmentation Project at Compañía MineraAntamina”, 2009.