
Optimal scheduling of dispatchable distributed...
12
Optimal scheduling of dispatchable distributed generation in smart environment with the aim of energy loss minimization A. Rahiminejad a , B. Vahidi a, * , M.A. Hejazi b , S. Shahrooyan c a Department of Electrical Engineering, Amirkabir University of Technology, Tehran, Iran b Faculty of Electrical and Computer Engineering, Kashan University, Kashan, Iran c Departments of English Literature, Hakim Sabzevari University, Sabzevar, Iran article info Article history: Received 18 March 2016 Received in revised form 20 September 2016 Accepted 22 September 2016 Keywords: Dispatchable distributed generation Optimal scheduling Smart grid and conventional network Energy loss minimization Voltage profile improvement abstract It is obvious that the high accurate information of network conditions in smart grids definitely leads to high efficient performance of the network. This paper discusses how much is the effect of smart grid compared to conventional networks to the daily energy loss minimization. In other words, the question of “is it worth to move towards the smart environment?” is discussed from only an aspect point of view in the paper. For this purpose, an optimal management of Dispatchable Distributed Generation (DDG) in smart grid with the aim of daily energy loss minimization is performed and fairly compared to DDG optimal management in conventional distribution networks. The effect of suboptimal performance of the system in conventional networks is economically analyzed. A 3-level load profile which is forecasted in advance is taken into account as the load profile of the conventional network. This load profile is investigated in 5 different scenarios from prediction points of view. On contrary, the load profile of the network in smart environment is considered as a 24-h load profile which is achieved using smart metering devices. To show how the smart grid impressively affects the network performance regards to conventional network, the DDGs are also programed in order to minimize the voltage deviation of the network. The economic analysis and yearly benefit of loss reduction are also conducted in both situations (smart grid and conventional network). In addition, the performances of the conventional network and smart grid are evaluated in two other phases i.e., in the presence of renewable energy resources and encountering with disturbances. The study is applied on 69-bus radial test system which is used in many previous studies. The results show the detrimental effects of suboptimal operation of the system on network performance in the case of conventional networks. Moreover, the impressive impacts of smart environment on energy loss reduction and voltage profile improvement in distribution systems can be concluded from the results. Furthermore, the study shows how the smart environment can be useful for utilization of renewable energy resources and managing the disturbances. © 2016 Elsevier Ltd. All rights reserved. 1. Introduction Growing trend of electricity energy consumption which is mainly produced by fossil fuel burning results in different issues such as environmental and financial problems [1]. On the contrary, nearly 15% of active power which is generated in large power plants wasted through different apparatuses mainly in distribution net- works [2]. Since the energy losses reduction may results in allevi- ating the foregoing problems, power losses reduction is one the most interesting issues in power system studies. There are different methods for loss minimization in power systems in the level of both transmission and distribution network such as Reconfiguration of distribution networks [3], capacitor banks placement [4], FACTS devices placement [5,6], and Distrib- uted Generation (DG) placement [7,8]. Among different methods, DG placement is one of the most attractive methods because of the benefits such as reliability improvement, voltage profile improve- ment and active power selling. However, insufficient placement and scheduling of DG can result in detrimental performance. On one side, optimal DG allocation can be implemented for all kinds of DG and performed in the phase of design using general information of the networks mostly the worst conditions of the systems (for instance peak load situation). On the other side, DG * Corresponding author. E-mail address: [email protected] (B. Vahidi). Contents lists available at ScienceDirect Energy journal homepage: www.elsevier.com/locate/energy http://dx.doi.org/10.1016/j.energy.2016.09.111 0360-5442/© 2016 Elsevier Ltd. All rights reserved. Energy 116 (2016) 190e201
Transcript of Optimal scheduling of dispatchable distributed...

lable at ScienceDirect
Energy 116 (2016) 190e201
Contents lists avai
Energy
journal homepage: www.elsevier .com/locate/energy
Optimal scheduling of dispatchable distributed generation in smartenvironment with the aim of energy loss minimization
A. Rahiminejad a, B. Vahidi a, *, M.A. Hejazi b, S. Shahrooyan c
a Department of Electrical Engineering, Amirkabir University of Technology, Tehran, Iranb Faculty of Electrical and Computer Engineering, Kashan University, Kashan, Iranc Departments of English Literature, Hakim Sabzevari University, Sabzevar, Iran
a r t i c l e i n f o
Article history:Received 18 March 2016Received in revised form20 September 2016Accepted 22 September 2016
Keywords:Dispatchable distributed generationOptimal schedulingSmart grid and conventional networkEnergy loss minimizationVoltage profile improvement
* Corresponding author.E-mail address: [email protected] (B. Vahidi).
http://dx.doi.org/10.1016/j.energy.2016.09.1110360-5442/© 2016 Elsevier Ltd. All rights reserved.
a b s t r a c t
It is obvious that the high accurate information of network conditions in smart grids definitely leads tohigh efficient performance of the network. This paper discusses how much is the effect of smart gridcompared to conventional networks to the daily energy loss minimization. In other words, the questionof “is it worth to move towards the smart environment?” is discussed from only an aspect point of viewin the paper. For this purpose, an optimal management of Dispatchable Distributed Generation (DDG) insmart grid with the aim of daily energy loss minimization is performed and fairly compared to DDGoptimal management in conventional distribution networks. The effect of suboptimal performance of thesystem in conventional networks is economically analyzed. A 3-level load profile which is forecasted inadvance is taken into account as the load profile of the conventional network. This load profile isinvestigated in 5 different scenarios from prediction points of view. On contrary, the load profile of thenetwork in smart environment is considered as a 24-h load profile which is achieved using smartmetering devices. To show how the smart grid impressively affects the network performance regards toconventional network, the DDGs are also programed in order to minimize the voltage deviation of thenetwork. The economic analysis and yearly benefit of loss reduction are also conducted in both situations(smart grid and conventional network). In addition, the performances of the conventional network andsmart grid are evaluated in two other phases i.e., in the presence of renewable energy resources andencountering with disturbances. The study is applied on 69-bus radial test systemwhich is used in manyprevious studies. The results show the detrimental effects of suboptimal operation of the system onnetwork performance in the case of conventional networks. Moreover, the impressive impacts of smartenvironment on energy loss reduction and voltage profile improvement in distribution systems can beconcluded from the results. Furthermore, the study shows how the smart environment can be useful forutilization of renewable energy resources and managing the disturbances.
© 2016 Elsevier Ltd. All rights reserved.
1. Introduction
Growing trend of electricity energy consumption which ismainly produced by fossil fuel burning results in different issuessuch as environmental and financial problems [1]. On the contrary,nearly 15% of active power which is generated in large power plantswasted through different apparatuses mainly in distribution net-works [2]. Since the energy losses reduction may results in allevi-ating the foregoing problems, power losses reduction is one themost interesting issues in power system studies.
There are different methods for loss minimization in powersystems in the level of both transmission and distribution networksuch as Reconfiguration of distribution networks [3], capacitorbanks placement [4], FACTS devices placement [5,6], and Distrib-uted Generation (DG) placement [7,8]. Among different methods,DG placement is one of the most attractive methods because of thebenefits such as reliability improvement, voltage profile improve-ment and active power selling. However, insufficient placementand scheduling of DG can result in detrimental performance.
On one side, optimal DG allocation can be implemented for allkinds of DG and performed in the phase of design using generalinformation of the networks mostly the worst conditions of thesystems (for instance peak load situation). On the other side, DG
Nomenclature
Ri Resistance of feeder iLimiti Thermal limit of feeder iLi Length of feeder iOF Objective FunctionPloss Active power lossPtotalloss;peak Total active power loss of the network in peak load
situationPD Active power consumption of load demandLoadpeak The amount of peak loadQD Reactive power consumption of load demandt Time step (here an hour)
U Amplitude of bus voltageT Total time duration (here a day)G The location of DDGPtotalloss;t Total active power loss of the network at time step tPDG Active power generation of DDGLoadt Total amount of load demand at time step tQDG Reactive power generation of DDGx Decision variablesLR the amount of loss reduction after DDG placement in
the networkg Equality constraintsFi The Power flowing at feeder ih Inequality constraints
A. Rahiminejad et al. / Energy 116 (2016) 190e201 191
programing can be only implemented for Dispatchable kinds ofDG (DDG) such as Fuel Cells, Micro turbines, and Diesel Gener-ators. It should be mentioned here that DGs can be categorizedinto two main categories as dispatchable and non-dispatchable.Dispatchable DGs such as Micro Turbine, Gas Engine, and Fuelcell, are the sources which the output can be controlled by theoperators. The other ones are the producers which the outputcannot be controlled. Wind Turbine, and Photovoltaic are twowell-known non-dispatchable kinds of DGs. The optimal opera-tion of DDG depends on the network conditions and varies withthe network conditions variations. Thus, the best operation pointof DDGs should be updated as the network conditions change. Itis obvious that higher accurate information of network condi-tions results in much better performance of the DDGs.
Optimal placement and operation of DDGs can be performedusing different objective functions among which loss minimizationhas been more interesting for researchers in the last decades [9].
There are two main approaches in the concept of loss minimi-zation as power loss minimization and energy loss minimization.Power loss refers to an instantaneous quantity and power lossminimization means reducing the power loss in a determined sit-uation of the network mainly peak load situation. On the contrary,energy loss is available in the time component and energy lossminimization refers to reducing the power loss in specific timeduration such as a day, a week or a month. In other words, energyloss is the power loss multiplies to specific time duration. Since thenetwork conditions are time-varying, obtaining the optimal oper-ation point of the network based on active power loss minimizationmay results in suboptimal operation [7]. Thus, it is better toconsider a multilevel load profile and obtaining the optimal oper-ation point of the network based on energy loss minimization.
Multilevel load profile can be achieved by forecasting the loaddemand in different time durations in conventional networks. Thisprofile can be estimated with high level of accuracy in smart gridswhich is equipped with advanced metering devices. The high ac-curate load profile of the system leads to more optimum operationof the distribution networks [10e13].
In Ref. [14], and [9] optimal accommodation and sizing of DG isperformed for daily energy loss minimization in a conventionalnetwork and a smart grid, respectively. However, in the former theeffect of prediction error in load profile is not investigated. In thelater, the optimal operation of renewable DG for energy lossminimization is compared to optimal operation of the networkobtained based upon power loss minimization in conventionalnetworks. Based on two foregoing articles (i.e. [9,14]) there aresome questions as follow:
1 Is it impossible to consider a multilevel load profile in conven-tional networks and achieve a multilevel generation profile forDG units?
2 What are the issues related to consideration of multilevel loadprofile in conventional distribution networks?
3 What does happen for loss minimization if the load profile isconsidered as multilevel in conventional networks?
4 How much is the difference between loss reduction in smartgrids and conventional networks with multilevel load profile?
5 How much is the benefit of loss reduction if the networks movetowards the smart operation.
6 Is it worth to move through smart grids?
In the current paper these questions are discussed. The effec-tiveness of the smart grid on the network performance iseconomically investigated. A fair comparison between energy lossreduction in smart grids and conventional networks by the optimalscheduling of DDGs is performed. A 24-h load profile as the actualload demand is considered for the smart grid; while, a 3-level loadprofile which is investigated in 5 different scenarios is consideredfor the conventional network. Moreover, the scheduling of DDGs isperformed for voltage deviation minimization in six mentionedscenarios. Economic analyses of the results reveal how effective-ness is the smart grids regards to conventional networks. To showhow the smart grid could be useful from the other aspects, thesystem is evaluated in two other situations i.e., in the presence ofrenewable energy resources and facing the disturbances.
2. Problem formulation
2.1. DG installation benefits as objective function
The presence of DG units in the distribution networks can bringvaluable benefits which can be considered as the objective functionfor optimal placement and dispatching [15,16]. Loss minimization,power selling, reliability improvement, and voltage profileimprovement are some merits of DG installation. Among differentobjectives, loss minimization has been studied more than theothers. In this paper, loss minimization is taken into considerationas the objective function for DDG management.
2.2. Loss minimization using DG placement
DG refers to small scale resources which are installed at thepoint of consumption. Being close to the end users, results inreduction in line power flow and active power loss [7]. However,insufficient allocation and generation of DG may lead to poor

A. Rahiminejad et al. / Energy 116 (2016) 190e201192
results for distribution systems performances [17]. Therefore,optimal accommodation and sizing of DG is an important issueregards to DG installation. Fig. 1 illustrates two situations of a dis-tribution system. In the first case (case a) load is supplied by themain network and in the second one (case b) a DG unit is added tothe network [18]. Active power loss of these two cases can berepresented as follows:
Paloss ¼rL�P2D þ Q2
D
�V2 (1)
Pbloss ¼rV2
hG�ðPD � PDGÞ2 þ ðQD � QDGÞ2
�þ ðL� GÞ
�P2D þ Q2
D
�i
(2)
Pbloss ¼rLV2
�P2D þ Q2
D þ GL
�P2DG þ Q2
DG � 2PDPDG � 2QDQDG
��
(3)
The difference between active power losses of the two cases canbe formulated as follow:
g ¼ Paloss � Pbloss ¼rGV2
�P2DG þ Q2
DG�2PDGPD � 2QDGQD
�(4)
Minimization of active power loss is equal to maximization of g.Thus, active and reactive power of DG, and also the location of DG(G) should be determined optimally. In other words, optimal allo-cation and sizing of DG result in loss minimization [18].
Optimal allocation of DG is based on general conditions of thenetworks and performed in the phase of design. But the generationmanagement of DDG units is implemented in operation phase andvaried based on network conditions.
Based on the foregoing phrases, the optimization problem canbe formulates as follows:
Optimal allocation of DDGs
min OF ¼ Power Loss ¼ Ptotalloss;peak
�x; Loadpeak
�S:T: gðxÞ ¼ 0
hðxÞ � 0
(5)
Optimal management of DDGs
min OF ¼ Energy Loss ¼ PTtPtotalloss;tðxt ; LoadtÞ � t
S:T : gðxtÞ ¼ 0hðxtÞ � 0
(6)
In this paper, first of all, the allocations of DDG's are performedin two different cases (i.e., a DDG and two DDGs) based on the peakload situation, and then after, optimal management are performedin different scenarios.
Fig. 1. A distribution network sample, a) before DG placement, b) after DG placement.
2.3. Constraint
During the optimal management of DDGs, a set of constraintsmust be satisfied. These constraints are as follows:
Power capacity: the scheduled generation of DDGs must not beviolated from their maximum capacity. In other words:
PDG < PmaxDG (7)
Thermal limits of the lines: the power flowing in each linemust be lower than its thermal limits as follow:
Fi < Limiti (8)
Voltage constraint: bus voltage magnitude must be sustainedin a predefined range as follow.
Vmini <Vi <Vmax
i (9)
3. Load model
Loss reduction is one of the most interesting problems in thepower systems studies. There are different methods for lossreduction such as DG placement, capacitor placement, and recon-figuration. Loss reduction has been performed using single levelload model (mainly peak load) in many papers [9]. When theoptimal conditions of different network facilities are determinedbased on this approach, suboptimal operation of the system mayoccur as the network conditions change during the day. Therefore,it is far better to consider a multi-level load profile for optimalmanagement of the network.
To have a multi-level load profile in the conventional networks,the amount of consumption must be predicted for specific timeduration in advance. The most well-known load model of thesekinds of networks is 3-level load model. In this model, a day isdivided to three time periods as peak load, off peak load, andnormal load periods. It is clear that the predicted load demandmaybe different in comparison to actual load of the network. Thisdrawback can be alleviated in smart grids which are equipped withsmart metering devices. In these kinds of networks, the networkconditions can be observed at any moment because of the presenceof smart metering devices and communication infrastructure; thus,the amount of load demand is available with high accuracy. As theoptimal operation of the network is determined based upon thisload model, suboptimal operation rarely occurs in the networkperformance. Therefore, a better network performance fromdifferent points of view can be achieved. However, the question ishowmuch the network performance would be bettered as the loadmodel of smart grids is used?
In this paper, optimal dispatching of DDGs is performed in 6different scenarios. In the first scenario, load profile is considered asa 24-h load profile which is obtained in smart grid. In other words,scenario-1 is minimization of energy loss in smart environment. Itshould be mentioned that the load profile of the smart grid isconsidered as the actual load of the network. This assumption isbased upon the presence of smart metering devices and commu-nication infrastructures in smart grids.
The five other scenarios are related to conventional networks inwhich the 3-level load profile must be estimated. This load profileshould be forecasted according to data bank which is collected in aperiod of several years. However, the forecasted load rarely iscoincident with the actual load and has a deviation from the exactload demand. In this paper the load profile of conventional networkis considered in five different scenarios which are scenarios 2 to 6

A. Rahiminejad et al. / Energy 116 (2016) 190e201 193
as follows:Scenario-2- In this scenario it is assumed that the load is fore-
casted with high accuracy and the amount of load of each level isthe average of 8-h load demand of actual load profile (i.e., smartgrid load profile). This scenario is presented in Fig. 2.
Scenario-3- In the third scenario, the amount of load in eachlevel is considered as the maximum load demand of 8-h of smartgrid load profile. This scenario which is presented in Fig. 3, meansthe forecasting is performed accurately and the maximum pre-dicted value of the load in each level is taken into consideration asthe load of the level to cover the worst situation. It should be notedthat this scenario is more reasonable than the previous one.
Scenario-4- In this scenario, it is assumed that the forecastedload is 10% higher than the 3-level load profile of Scenario-3.
Scenario-5- In this scenario, the forecasted load is 10% lowerthan the minimum value of load demand in each level. It should bementioned that the scenarios 4 and 5 consist of the error of loadforecasting.
Scenario-6- this scenario consists of a combination of pre-dictions in which the load prediction is 10% lower than the mini-mum of load in the first level, is the mean value of second level, and10% higher than the maximumvalue in the third level. The scenariois depicted in Fig. 4.
The results of optimal DDG dispatching for these scenarios arecompared with the scenario of smart grid. Summation of energyloss of all the levels determines the total daily energy losses of thesystem in conventional network.
The stepwise simulations of energy loss minimization fordifferent scenarios are as follows:
Step 1- Initialization: get the network parameters, the locationand maximum capacity of DDG(s), get the load modelStep 2- Select a level
Fig. 2. Load profile of Scenario-2 of
Step 3- Perform the optimal DDG scheduling, checking theconstraints, calculating the energy loss based on the optimumoperation point in the mentioned levelStep 4- If all the levels are investigated go to step 5, otherwise goto step 2Step 5- Calculate the total daily energy loss of the network
4. Case study
4.1. Test system
The study is applied on 69-bus radial test system which is usedin many previous studies such as capacitor placement [19], optimalDG placement [20], and reconfiguration [21]. Fig. 5, depicts thesingle line diagram of 69-bus test system and the line data and busdata can be found in Ref. [22]. The original load of the network isconsidered as the peak load demand of the network in this paper.The base values of voltage and power of the system are 12.66 kVand 10 kVA, respectively. Based on power flow results, the activepower loss of the system in peak load situation is 224.97 KW.
To show the performance of the network with the increasing ofthe penetration level of DDG generation, the test system is inves-tigated in two phases. In phase 1, a DDG unit is placed in the systemand in the second phase, 2 DDG units are installed in the system.First of all, The DDG placement is performed based on the peak loadsituation.
4.2. DDG placement
DDG placement is performed with the aim of active power lossreduction based on the peak load situation. The allocation is per-formed for two different cases. In the first case a 1 MW DDG isallocated and in the second case two DDG with the capacity of1 MW are allocated. The optimization problem is solved by a
conventional network.

Fig. 3. Load profile of Scenario-3 of conventional network.
Fig. 4. Load profile of Scenario-6 of conventional network.
A. Rahiminejad et al. / Energy 116 (2016) 190e201194
heuristic optimization method known as Teaching-Learning-BasedOptimization (TLBO) [23]. The results are listed in Table 1.
4.3. Load model
As mentioned before, a 24-h load profile is considered for the
smart grid case and a 3-level load model for the conventionalnetwork. Since the smart grid is equipped with smart meteringdevices, the 24-h load profile is considered as the actual load of thenetwork. The 3 levels of the conventional network load modelrepresent the peak load, normal load, and off-peak load with theduration of 8 h for each level. The load model of conventional

Fig. 5. Single line diagram of 69-bus radial test system with 2 DDG units.
Table 1Optimal allocation of DDG in 69-bus test system.
Location Size (kW)
1 DDG unit 50 1000P loss (kW) 111.582 DDG units 51 862.59
50 1000P loss (kW) 83.35
A. Rahiminejad et al. / Energy 116 (2016) 190e201 195
network is investigated in 5 different scenarios. Thus, the study ofoptimal DDG dispatching is performed in 6 different scenarios. Thefirst scenario is related to smart grid and the other five scenarios arerelated to the conventional network.
4.4. Phase-1: scheduling of a DDG
4.4.1. Scenario-1The power flow analysis of the 69-bus test system respect to 24-
h load profile indicates that the total daily energy loss of the systemis 2023 KWh. By installation of a DDG in the bus 50, based on theresults of Table 1, and running the optimal dispatching of the DDGgeneration in smart environment, the total energy loss decreased to892.25 kWh which is roughly 56% reduction in daily total energyloss of the system. A comparison between hourly losses of thesystem before and after installation of DDG is depicted in Fig. 6. Itcan be concluded from the figure that the loss reduction isimpressive especially at the peak times.
4.4.2. Scenario-2As mentioned before, in this scenario, load forecasting is per-
formed with high accuracy and the amount of load in each level isthe average of load in 8 h of the actual model. Optimal dispatchingof DDG is accomplished based on the 3-level load model. It meansthe DDG units output, are set according to the 3-level load mode.However, the power flow results are based on real load model (the24-h load profile). In other words, the scheduling of DDG genera-tion is determined for 3-level load profile in advance, but the sys-tem has a 24-h load profile. Thus, it can be said that in each 8 h thegeneration of DG is constant, while the load varies. In this situation,the total energy loss of the system in a day is 897.6 KWh which is0.62% higher than energy loss in smart grid. It can be concludedthat with accurate information of power consumption in smart grid0.6% higher daily loss reduction can be achieved in compared toconventional network with high accurate load forecasting.
However, it can be said that with such a great estimation, there isno big difference between the performance of the network in martenvironment and conventional networks.
4.4.3. Scenario-3In this scenario, the load is forecasted with high accuracy;
however, the worst case is considered and the amount of load ineach level considered as the maximum amount of real load in that8 h. This scenario is more reasonable for consideration of worstcase. It should be noticed again that the optimal dispatching isperformed base on 3-level load profile; while, the power flow re-sults are based on real load profile (i.e. 24-hour load profile). In thisscenario, the total daily energy loss of the system is 913.58 kWhwhich is 21 kWh higher than the smart grid scenario. It meansconsideration of worst case results in 2.4% increase in daily energyloss which is a noticeable value.
4.4.4. Scenario -4In this scenario, the impact of wrong estimation of load is
investigated. It is assumed that the forecasted load is 10% higherthan Scenario-3. The optimal dispatching of DDG is accomplishedbased on this load profile. The total daily loss of system is926.96 kWh which is approximately 35 KW higher than Scenario-3(i.e. no error in load estimation). The amount of energy loss isnearly 3.9% higher than the energy loss in smart grid situation. Inthe other words, exact load profile which is achieved in smart gridcan lead to 4% higher loss reduction compared to conventionalnetwork in which the load profile must be estimated and may havesome deviation from the actual load amount.
4.4.5. Scenario -5This scenario is also investigates the wrong estimation of load,
but the estimated load is 10% lower than the load profile ofScenario-3. The results of optimal scheduling of the DDG reveal thatthe daily energy loss of the system decreases to 904.2551 kWhwhich is 1.3% higher than the energy loss in smart grid.
4.4.6. Scenario -6In this scenario, the estimated load in three levels are, respec-
tively, 10% lower than the minimum of load in the first level, themean value of second level, and 10% higher than the maximumvalue of the third level. The daily energy loss of this scenario afteroptimal management of the DDG is 898.96 MW which is 0.75%higher than the daily energy loss in smart grid scenario.
As one can see, the best operation point of distribution network
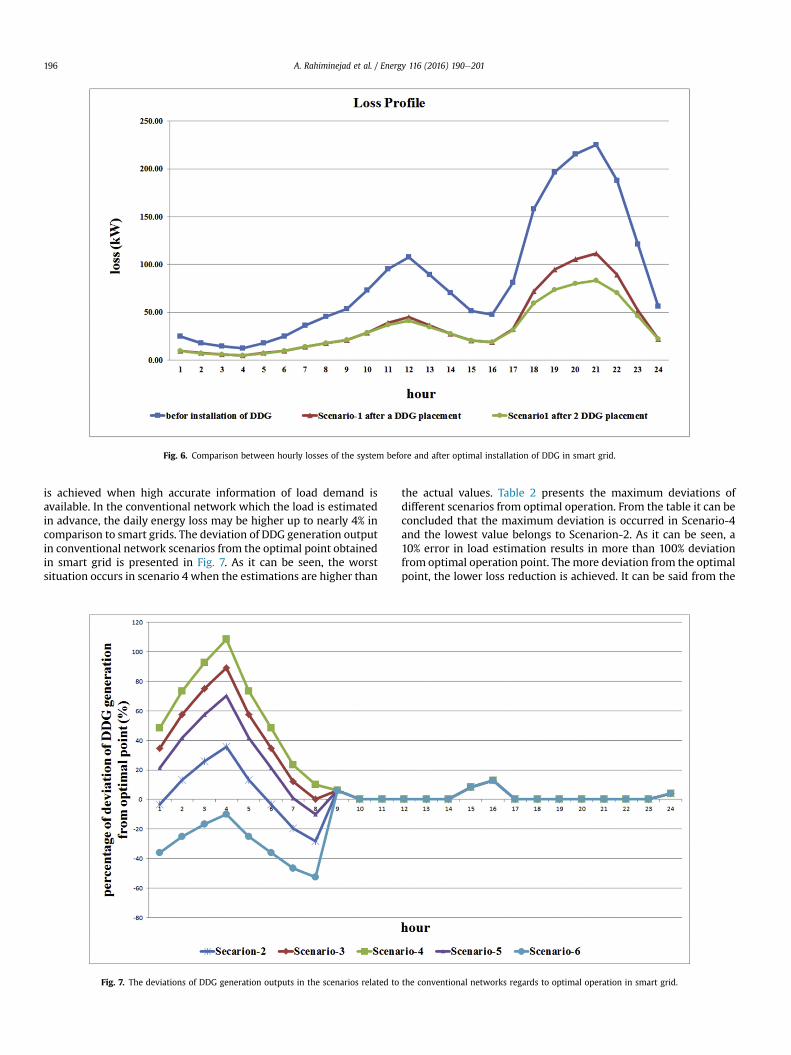
Fig. 6. Comparison between hourly losses of the system before and after optimal installation of DDG in smart grid.
A. Rahiminejad et al. / Energy 116 (2016) 190e201196
is achieved when high accurate information of load demand isavailable. In the conventional network which the load is estimatedin advance, the daily energy loss may be higher up to nearly 4% incomparison to smart grids. The deviation of DDG generation outputin conventional network scenarios from the optimal point obtainedin smart grid is presented in Fig. 7. As it can be seen, the worstsituation occurs in scenario 4 when the estimations are higher than
Fig. 7. The deviations of DDG generation outputs in the scenarios related to
the actual values. Table 2 presents the maximum deviations ofdifferent scenarios from optimal operation. From the table it can beconcluded that the maximum deviation is occurred in Scenario-4and the lowest value belongs to Scenarion-2. As it can be seen, a10% error in load estimation results in more than 100% deviationfrom optimal operation point. The more deviation from the optimalpoint, the lower loss reduction is achieved. It can be said from the
the conventional networks regards to optimal operation in smart grid.

Table 2Percentage of deviation of a DDG generation output from optimal point in different scenarios of Phase-1.
Parameter Scenario-2 Scenario-3 Scenario-4 Scenario-5 Scenario-6
Maximum Deviation (%) 35.84 89.17 108.37 70.04 52.46Total Deviation (%) 173.54 392.31 510.09 295.14 279.93energy loss (kWh) 897.7983 913.5789 926.9603 904.26 898.96
A. Rahiminejad et al. / Energy 116 (2016) 190e201 197
foregoing phrases, any error in load demand prediction regards toactual load of the system, results in suboptimal operation point andhigher losses.
Fig. 8, shows the daily loss profile of different scenarios. Fromthe figure it can be comprehended that the high accurate infor-mation of load demand results in better performance of thenetwork especially in lower amount of the load.
4.5. Phase-2: scheduling of 2 DDGs
In this phase, the optimal scheduling of 2 DDGs is performed in6 different scenarios. The generation profiles of DDGs are depictedin Fig. 9. It is obvious from the figure that the DDG at bus 50 hasmore influence on system performance. Hence, this DDG generatesat its maximum capacity in a period of time in a day. On the con-trary, the generation of second DDG which is allocated at bus 51varies with the any change of the load demand. The daily lossprofile of the system in Phase-2 in smart environment is comparedto the loss profile of Phase-1 and before DDG installation in Fig. 6.By comparing the three loss profiles in the figure, the effect of smartgrid and also the effect of increasing the number of facilities areapparent. The additional DDG to the network decreases the dailyenergy loss of the network more than 120 kWh. The hourly powerlosses of the network for different scenarios are depicted in Fig. 10.Furthermore, the total energy loss, and the percentage of lossreduction of these scenarios are listed in Table 3. As it can be seen,the amount of power loss during the day in the smart grid is lower
Fig. 8. Daily loss profile of different
than the all scenarios related to conventional network. This sce-nario is followed by Scenario-2 which the load is the average ofeach level. The worst situation belongs to Scenario-4 in which theestimated load is higher than the actual value. The percentage ofvariance of loss reduction for different scenarios of conventionalnetwork regards to smart grid is depicted in Fig. 11. The figure re-veals that the loss reduction in case 4 is 7.93% lower than smart gridwhich is a noticeable value. From the other perspective, it can besaid that by increasing the facilities of distribution network, thesuboptimal operation of conventional network, has more influenceon network performance.
It should be mentioned that this is a distribution system withonly 69 buses; while, the actual distribution networks are moreextended with more buses. Therefore, 1%e8% reduction in total lossof the system is a noticeable value of loss reduction in actual dis-tribution systems. Moreover, the optimization is considered fordaily load model and can be extended to monthly, seasonally, andannually demand. Thus, it can be comprehended that the smartgrid has a noticeable influence on yearly network performancefrom financial and energy points of view.
From these 6 scenarios it can be inferred that the smart opera-tion of distribution system can result in at least 2% higher lossreduction. In the conventional network even with exact load esti-mation, suboptimal operation point is occurred and the systemcannot be operated at its best operation point. The movement tosmart grid besides all other benefits of these kinds of systems canlead the network to operate at the best point.
cases with one DG placement.

Fig. 9. Generation profile of DGs in smart grid.
Fig. 10. Daily loss profile of different scenarios with two DDGs.
Table 3Total power loss and percentage of loss reduction in different scenarios of Phase-2.
Parameter Scenario-1- smart grid Scenario-2 Scenario-3 Scenario-4 Scenario-5 Scenario-6
Energy loss (kWh) 771.8 809.43 868.32 932.21 823.35 894.36Percentage of loss reduction (%) 61.84 59.98 57.07 53.91 59.30 55.79
A. Rahiminejad et al. / Energy 116 (2016) 190e201198
Now, optimal management of DDGs (2 DG units) is performed inorder to improve the voltage profile of the network. The results arelisted in Table 4. In this table, the minimum and maximum voltage
of the day, and also the minimum and maximum overall voltagedeviation of the day are shown. As it can be seen, the maximumvoltage and the minimum overall voltage deviation in the day are

Fig. 11. Percentage of difference of different cases with smart grid.
Table 4Daily voltage profile characteristics of the network in different scenarios of Phase-2.
Before DDG installation Scenario-1 (smart grid) Scenario-2 Scenario-3 Scenario-4 Scenario-5 Scenario-6
Minimum voltage (p.u.) 0.9092 0.9691 0.9691 0.9691 0.9691 0.9691 0.9691Maximum voltage (p.u.) 1.0 1.003 1.025 1.025 1.027 1.025 1.025Minimum overall voltage deviation (p.u.) 0.435 0.147 0.167 0.228 0.251 0.205 0.1691Maximum overall voltage deviation (p.u.) 1.837 0.81 0.81 0.81 0.81 0.81 0.81
A. Rahiminejad et al. / Energy 116 (2016) 190e201 199
achieved in the scenario of smart grid. Theworst situation occurs inScenario-4.
4.6. Economic analysis
To investigate the financial benefits of the smart grids regards tothe conventional network the number of consumers must beknown. Here, the load of the system is considered as a combinationof industrial, commercial and domestic users which are organizedas follow:
The branch between busses 42 to 54 is an industrial park with30 users and 60 kW consumption for each user. The commercialconsumers are placed in buses 10 and 11, and also in branch be-tween buses 35 to 38. Total commercial users are 40 and eachcommercial load consumes approximately 30 kW. The rest of thenetwork consists of domestic subscribers with 5 kW consumptionfor each user. Thus, the total number of domestic load is 200.Consequently, the total consumers of the test system are 270subscribers.
The cost of smart metering devices is considered 150$. Consid-ering 270 consumers in test system, the total cost of smart meteringdevices is 40000$.
According to the results obtained earlier, daily loss reduction is1251 kWh for smart grid and 1090.6e1213.3 kWh for conventionalnetwork considering the error in load forecasting (this error isroughly inevitable). Considering the active power price as 0.06
$/kWh [24], total benefit of loss reduction for smart grid is 27397$/year and 23871e26565 $/year for conventional network. Thismeans the movement towards the smart gird has approximately3e13% increase in loss reduction benefit; while, smart operation ofdistribution network has lots of other merits in other perspectives.
4.7. In the presence of renewable resources
Renewable energy based distributed generations such as windturbines and solar cells have been used widely in the last decays.Because of very clean and low cost energy production of these kindsof resources, the utility operators are very inclined to employ theseresources in distribution networks. However, a controversialproblem related to these kinds of DG units is their variable output.Since the policy of distribution networks is to use all the productionof renewable DGs, the fluctuation of DG output may increase thecost of generation. Moreover, the operating point of the systemmaybecome away from the optimal point as the predictions go wrong.In a smart environment, the smart metering devices and commu-nication infrastructure give the opportunity of renewable energyutilization in a high efficient operation of the system. In otherwords, the amount of solar irradiation and wind speed can beestimated with a high level of accuracy and communicated to thenetwork operator for a high efficient management of the system. Inthe conventional network, the system programing is performedbased on predicted informationwhichmay be associatedwith large

Table 5Daily energy loss of different cases in the presence of renewable resources.
Case1-smart grid Case2 Case3 Case4 Case5 Case6 Case7 Case8 Case9
Wind 0 þ10 �10 þ10 �10 þ10 �10 þ10 �10Solar 0 þ10 þ10 �10 �10 þ10 þ10 �10 �10load 0 þ10 þ10 þ10 þ10 �10 �10 �10 �10Daily energy loss (kWh) 753.42 851.31 782.81 853.12 783.11 882.42 790.44 884.90 790.93
Table 6Daily energy loss of different cases in the presence of renewable resources.
Scenario1 Scenario21 Scenario3 Scenario41 Scenario5
Unexpected DG outage 1 0 0 1 1Increase in load 0 1 0 1 0Eliminating a load 0 0 1 0 1Daily energy loss in smart grid 797.79 796.53 770.73 904.32 796.71Daily energy loss in conventional network 871.87 869.77 808.35 1025.49 870.78
A. Rahiminejad et al. / Energy 116 (2016) 190e201200
errors. Herein, a comparison between the renewable energy re-sources utilization in smart grid and conventional network isimplemented. For this purpose, a 500 kWwind turbine and a set ofsolar cells with the capacity of 200 kW are added to the network inarbitrary buses (here, the wind turbine and solar cells are placed inbuses 53 and 21 respectively). To evaluate the effect of wrongprediction in conventional networks, 8 different scenarios whichare listed in Table 5 are investigated. The total daily energy lossreductions of different scenarios are shown in Table 5. As it can beseen, the wrong prediction may cause large daily energy loss in theconventional networks compared to smart grid. In other words, inthe smart grid, the renewable energy resources could be utilized inthe best way.
4.8. Uncertainties situation
The distribution networks are encountered with lots of distur-bances such as unexpected load, feeders, or DGs outage or sharpincrease in load. In the conventional network, finding, removingand reacting against these disturbances may last an hour or evenmore. These disturbances besides the transient problems may leadto different mal operations in steady state situation such as ineffi-cient operation of the system. On the contrary, in smart grids, thesedisturbances could be distinguished immediately because of smartmetering devices and communicated to the network operatorbecause of communication infrastructure. Therefore, the networkcan be rescheduled immediately to perform in the most optimaloperation point of the system. To investigate the performance ofthe conventional network and smart grids in facing with distur-bances, some uncertainties scenarios are applied to the network ina specific hour (here the hour 20). These scenarios include unex-pected outage of a DG unit, sharp increase in a bus load, outage of abus load and two other combinations of these scenarios. Thedifferent scenarios are listed in Table 6. It is assumed that theconventional network cannot respond to these uncertainties;while, the network is rescheduled in the mentioned hour in smartenvironment. The amounts of daily energy loss in different sce-narios in two mentioned networks are compared in Table 6. Thedaily energy loss of the network in conventional network for adisturbance lasts for an hour can be higher than the smart grid from40 kWh to 130 kWh. Thus, it can be comprehended that the smartenvironment can be very helpful in the facing with disturbancesfrom steady state point of view.
5. Conclusion
In this paper optimal scheduling of Dispatchable DG (DDG) insmart distribution network is performed and a comprehensive faircomparison is investigated between the loss reduction in smartgrid and conventional networks. The load profile of smart grid isconsidered as a 24-h load profile as the actual load demand of thenetwork. On the contrary, the load profile of conventional networkis considered as a 3-level load model which is investigated in 5different scenarios.
The results of simulations of six different scenarios reveal thatmovement to smart environment can have an impressive influenceon the network performance form loss reduction point of view. Inother words, accurate information of load profile leads to betteroperation of system. Moreover, the smart meter devices andcommunication infrastructure decrease the error in load calcula-tion and increase the accuracy of system scheduling. In addition,the results of DDGs scheduling for voltage profile improvementclears such a point. The economic analysis reveals that it is worth tomove through smart grids. This conclusion is obtained based upona comprehensive comparison between the smart grid performanceand different scenarios of conventional networks. To show theeffectiveness of the smart environment on system operation, theutilization of renewable DGs are investigated in both system.Moreover, the occurring of disturbances is also studied. The resultsshow how the renewable energy resources could be used in anefficient way in a smart grid. Moreover, the management of anetwork encountered with disturbances could be easily performedin smart environment. As future work, the smart optimal man-agement of storage systems besides the renewable DGs can beinvestigated.
References
[1] Maleki A, Pourfayaz F, Rosen MA. A novel framework for optimal design ofhybrid renewable energy-based autonomous energy systems: a case study forNamin, Iran. Energy 2016;98:168e80.
[2] Hong T, Burke JJ. Calculating line losses in smart grid: a new rule of thumb. In:Proc. Transmission and distribution conference and Exposition; 2010. p. 1e5.
[3] Arasteh H, Sepasian MS, Vahidinasab V. An aggregated model for coordinatedplanning and reconfiguration of electric distribution networks. Energy2016;94:786e98.
[4] El-Fergany AA. Optimal capacitor allocations using evolutionary algorithms.IET Gen Trans Dist 2013;7(no. 6):593e601.
[5] Rashed GI, Sun Y, Shaheen HI. Optimal TCSC Placement in a Power system bymeans of Differential Evolution algorithm considering loss minimization. In:Proc. 6th IEEE Conference on Industrial Electronics and Applications (ICIEA);2011. p. 2209e15.
[6] Sirjani R, Mohamed A, Shareef H. Optimal allocation of shunt Var compen-sators in power systems using a novel global harmony search algorithm. Int J
A. Rahiminejad et al. / Energy 116 (2016) 190e201 201
Electr Power & Energy Syst December 2012;43(1):562e72.[7] Hung DQ, Mithulananthan N. Multiple distributed generator placement in
primary distribution networks for loss reduction. IEEE Trans Ind Electron2013;60(4):1700e8.
[8] Doagou-Mojarrad H, Gharehpetian GB, Rastegar H, Olamaei J. Optimal place-ment and sizing of DG (distributed generation) units in distribution networksby novel hybrid evolutionary algorithm. Energy 2013;54:129e38.
[9] Ochoa LF, Harrison GP. Minimizing energy losses: optimal accommodationand smart operation of renewable distributed generation. IEEE Trans PowerSyst 2011;26(1):198e205.
[10] Katie N, Marijanovie V, Stefani I. Smart grid solution in distribution networkscost/benefit analysis. In: 2010 China International conference on electricitydistribution; Sept. 2010. p. 1e6.
[11] Abaide AR, Canha LN, Barin A, Cassel G. Assessment of the smart grids appliedin reducing the cost of distribution system losses. In: 7th International con-ference on the European Energy Market (EEM); 2010. p. 1e6.
[12] Li Z, Wu C, Chen J, Shi Y, Xiong J, Wang AY. Power distribution networkreconfiguration for bounded transient power loss. In: IEEE PES, InnovativeSmart Grid Technologies - Asia (ISGT Asia); 2012. p. 1e5.
[13] Alonso M, Amaris H, Alvarez-Ortega C. Integration of renewable energysources in smart grids by means of evolutionary optimization algorithms.J Expert Syst Appl April 2012;39(5,):5513e22.
[14] Khalesi N, Rezaei N, Haghifam MR. DG allocation with application of dynamicprogramming for loss reduction and reliability improvement. Int J Electr Po-wer Energy Syst February 2011;33(2):288e95.
[15] Mattison LR. Technical analysis of the potential for combined heat and power
in Massachusetts. Report, University of Massachusetts Amherst. May 2006.[16] Singh D, Misra RK, Singh D. Effect of load models in Distributed Generation
planning. IEEE Trans Power Syst Nov. 2007;22(4).[17] Shaaban MF, El-Saadany EF. Optimal allocation of renewable DG for reliability
improvement and losses reduction. In: IEEE power and energy society generalmeeting; 2012. p. 1e8.
[18] Guo Y, Lin Y, Sun M. The impact of integrating distributed generations on thelosses in the smart grid. In: IEEE power and energy society general meeting;2011. p. 1e6.
[19] Huang YC, Yang HT, Huang CL. Solving the capacitor placement problem in aradial distribution system using Tabu search approach. IEEE Trans Power SystNovember 1996;11(4).
[20] Injeti SK, Kumar NP. Optimal planning of distributed generation for improvedvoltage stability and loss reduction. Int J Comput Appl 2011;15(1):40e6.
[21] Abdelaziz AY, Mohamed FM, Mekhamer SF, Badr MAL. Distribution systemreconfiguration using a modified Tabu Search algorithm. Int J Electr PowerSyst Res 2010;80:943e53.
[22] Baran ME, Wu FF. Optimal capacitor placement on radial distribution systems.IEEE Trans Power Deliv January 1989;4(1):725e34.
[23] Rao RV, Patel V. An elitist teachingelearning-based optimization algo- rithmfor solving complex constrained optimization problems. Int J Ind Eng Comput2012;3(No. 4):535e60.
[24] Bhumkittipich K, Phuangpornpitak W. Optimal placement and sizing ofdistributed generation for power loss reduction using particle swarm opti-mization. Energy Procedia 2013;34:307e17.