Optimal Production of Chinook Salmon from the Taku River
58
Fisheries and Oceans Canada Pêches et Océans Canada Canadian Stock Assessment Secretariat Research Document 99/207 Secrétariat canadien pour l’évaluation des stocks Document de recherche 99/207 Not to be cited without permission of the authors 1 Ne pas citer sans autorisation des auteurs 1 Optimal Production of Chinook Salmon from the Taku River Scott A. McPherson 1 , David R. Bernard 2 and John H. Clark 3 1 Alaska Department of Fish and Game Division of Sport Fish, Region I P. O. Box 240020 Douglas, AK 99824-0020, USA 2 Alaska Department of Fish and Game Division of Sport Fish, Region II 333 Raspberry Road Anchorage, AK 99518-1599, USA 3 Alaska Department of Fish and Game Division of Commercial Fisheries, Headquarters 4240 Jimtown Road Helena, MT 59602 1 This series documents the scientific basis for the evaluation of fisheries resources in Canada. As such, it addresses the issues of the day in the time frames required and the documents it contains are not intended as definitive statements on the subjects addressed but rather as progress reports on ongoing investigations. 1 La présente série documente les bases scientifiques des évaluations des ressources halieutiques du Canada. Elle traite des problèmes courants selon les échéanciers dictés. Les documents qu’elle contient ne doivent pas être considérés comme des énoncés définitifs sur les sujets traités, mais plutôt comme des rapports d’étape sur les études en cours. Research documents are produced in the official language in which they are provided to the Secretariat. Les documents de recherche sont publiés dans la langue officielle utilisée dans le manuscrit envoyé au secrétariat. ISSN 1480-4883 Ottawa, 1999
Transcript of Optimal Production of Chinook Salmon from the Taku River

Fisheries and OceansCanada
Pêches et OcéansCanada
Canadian Stock Assessment SecretariatResearch Document 99/207
Secrétariat canadien pour l’évaluation des stocksDocument de recherche 99/207
Not to be cited withoutpermission of the authors1
Ne pas citer sansautorisation des auteurs1
Optimal Production of Chinook Salmon from the Taku River
Scott A. McPherson1, David R. Bernard2 and John H. Clark3
1 Alaska Department of Fish and GameDivision of Sport Fish, Region I
P. O. Box 240020Douglas, AK 99824-0020, USA
2Alaska Department of Fish and Game Division of Sport Fish, Region II
333 Raspberry Road Anchorage, AK 99518-1599, USA
3Alaska Department of Fish and GameDivision of Commercial Fisheries, Headquarters
4240 Jimtown RoadHelena, MT 59602
1 This series documents the scientific basis for theevaluation of fisheries resources in Canada. Assuch, it addresses the issues of the day in the timeframes required and the documents it contains arenot intended as definitive statements on the subjectsaddressed but rather as progress reports on ongoinginvestigations.
1 La présente série documente les bases scientifiquesdes évaluations des ressources halieutiques duCanada. Elle traite des problèmes courants selon leséchéanciers dictés. Les documents qu’elle contientne doivent pas être considérés comme des énoncésdéfinitifs sur les sujets traités, mais plutôt commedes rapports d’étape sur les études en cours.
Research documents are produced in the officiallanguage in which they are provided to theSecretariat.
Les documents de recherche sont publiés dans lalangue officielle utilisée dans le manuscrit envoyéau secrétariat.
ISSN 1480-4883Ottawa, 1999

ii
ABSTRACT
Optimal production of adult chinook salmon Oncorhynchus tshawytscha from the TakuRiver was investigated with information from a stock assessment program (1973-1997)and catch sampling programs of the Canadian inriver gillnet fishery, U.S. gillnet fisheryin Taku Inlet, the U.S. commercial troll and the U.S. recreational fishery near Juneau.Stock assessment was based on aerial surveys and mark-recapture experiments toestimate abundance of large (mostly age-1.3 and older fish) salmon over the spawninggrounds. Relative age composition was estimated from 1973 through 1997 at a carcassweir on the Nakina River and during mark-recapture experiments on other tributaries.Additional mark-recapture experiments using coded-wire tags provided estimates ofharvest in fisheries and abundance of emigrating smolts. Spawning abundance thatwould produce maximum-sustained yield (NMSY) was estimated at 19,597 and 28,738large salmon from fits of two traditional stock-recruit models to the data. Noautocorrelation among residuals was detected in these fits, however, measurement errorin estimates of spawning abundance and production, mostly from aerial surveys, reducedconfidence in the accuracy of NMSY estimates. Inspection of more precise, individualestimates of spawner and smolt abundance, adult production, and smolt size providedevidence for early density-dependent survival of young salmon and later density-independent survival of young salmon while still in freshwater and while at sea.Because observed smolt production was near maximum over a range of about 30,000 to55,000 large spawners, this level was recommended as the best estimate for NMSY at thistime. We recommend that the Alaska Department of Fish and Game and theDepartment of Fisheries and Oceans (Canada) adopt a biological escapement goal rangeof 30,000 to 55,000 large spawners for management purposes for this chinook salmonstock. This corresponds to an aerial survey goal of approximately 5,800 to 10,600 largespawners, counted in five tributaries. We also recommend continuation orimplementation of several stock assessment components to improve estimation ofpopulation statistics and management of this stock.
Key words:chinook salmon, Oncorhynchus tshawytscha, Taku River, smolt abundance,spawning abundance, mark-recapture, age, sex and length composition, escapementgoal, stock-recruit analysis.

iii
RÉSUMÉ
La production optimale du saumon quinnat adulte (Oncorhynchus tshawytscha) de larivière Taku a été étudiée à partir d’un programme d’évaluation des stocks (1973-1997)et de programmes d’échantillonnage des prises de la pêche canadienne au filet maillanten rivière, de la pêche américaine au filet maillant dans le ruisseau Taku, de la pêcheaméricaine commerciale à la traîne et de la pêche américaine récréative effectuée près deJuneau. Afin d’évaluer les stocks, l’abondance des saumons de grande taille(principalement les poissons de 1,3 an et plus) dans les frayères a été estimée par relevésaériens et par capture-recapture. La composition relative selon l’âge de 1973 à 1997 aété estimée au moyen d’un filet à carcasses dans la rivière Nakina et à partir de donnéesobtenues par capture-recapture dans d’autres affluents. D’autres études avec la méthodede capture-recapture, au moyen de micromarques magnétisées codées, ont permisd’estimer les captures des pêches et l’abondance des saumoneaux qui émigrent.L’abondance du frai qui devrait correspondre à la production maximale équilibrée(NMSY) a été estimée à 19 597 et 28 738 saumons de grande taille, en ajustant lesdonnées à partir de deux modèles traditionnels stock-recrue. Aucune autocorrélation n’aété observée entre les résidus des ajustements, mais les erreurs de mesure dans lesestimations de l’abondance et de la production du frai, obtenues surtout par relevésaériens, diminuent la confiance de la précision des estimés de NMSY. L’analysed’estimations particulières plus précises de l’abondance du frai et du saumoneau, de laproduction de l’adulte et de la taille du saumoneau a établi que la survie initiale du jeunesaumon était dépendante de la densité et que la survie tardive du jeune saumon étaitindépendante de la densité lorsqu’il est encore dans l’eau douce et lorsqu’il est dans lamer. Puisque la production observée de saumoneaux était presque au maximum parrapport au nombre de saumoneaux de grande taille, qui se situe entre 30 000 et 55 000, ila été recommandé d’utiliser ce niveau comme meilleur estimé de NMSY, pour cette fois.Nous recommandons que le département de la pêche et de la chasse de l’Asaska et quele ministère des Pêches et des Océans (du Canada) adoptent comme objectif d’échappéebiologique se situant entre 30 000 et 55 000 saumoneaux de grande taille pour la gestionde ce stock de saumons quinnat. Cela correspond, pour les relevés aériens, à un objectifd’environ 5 800 à 10 600 saumoneaux de grande taille comptés dans cinq affluents.Nous recommandons aussi de continuer à utiliser ou de mettre en application diverséléments d’évaluation des stocks pour améliorer les statistiques sur l’estimation de lapopulation et la gestion de ce stock.
Mots clés : saumon quinnat, Oncorhynchus tshawytscha, rivière Taku, abondance dusaumoneau, abondance du frai, capture-recapture, composition selon l’âge, lesexe et la longueur, objectif de remontée, analyse stock-recrue.

iv
TABLE OF CONTENTS
PageABSTRACT .......................................................................................................................................................................... ii
RÉSUMÉ.............................................................................................................................................................................. iii
LIST OF TABLES .................................................................................................................................................................v
LIST OF FIGURES................................................................................................................................................................v
LIST OF APPENDICES...................................................................................................................................................... vi
ACKNOWLEDGMENTS .................................................................................................................................................. vii
INTRODUCTION................................................................................................................................................................. 1
STATISTICS......................................................................................................................................................................... 3
Spawning Abundance .................................................................................................................................................... 3Smolt Abundance........................................................................................................................................................... 6Marine Harvests ............................................................................................................................................................. 8Inriver Harvests ........................................................................................................................................................... 10Production ................................................................................................................................................................... 10Exploitation Rate ......................................................................................................................................................... 10
ANALYSIS ......................................................................................................................................................................... 10
Measurement Error ...................................................................................................................................................... 10Parameter Estimates .................................................................................................................................................... 13Smolt Production ......................................................................................................................................................... 16
CONCLUSIONS................................................................................................................................................................. 17
DISCUSSION ..................................................................................................................................................................... 18
RECOMMENDATIONS.................................................................................................................................................... 19
LITERATURE CITED ....................................................................................................................................................... 20
APPENDIX A ..................................................................................................................................................................... 23
APPENDIX B...................................................................................................................................................................... 31
APPENDIX C...................................................................................................................................................................... 37
APPENDIX D ..................................................................................................................................................................... 41
APPENDIX E...................................................................................................................................................................... 49

v
LIST OF TABLES
Table Page 1. Pearson correlation coefficients among counts of large chinook salmon in five tributaries to the Taku
River from 1973 to 1997. ................................................................................................................................... 5
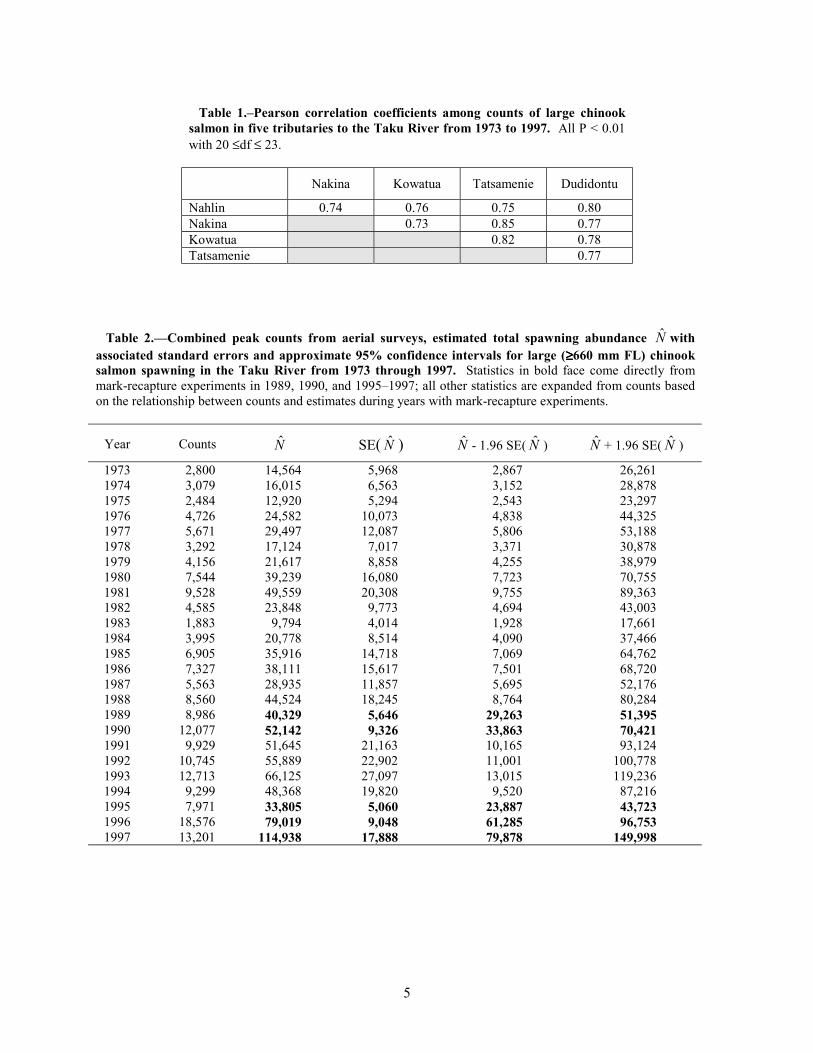
2. Combined peak counts from aerial surveys, estimated abundance N with associated standard errorsand estimated 95% confidence intervals for large (≥660 mm FL) chinook salmon spawning in theTaku River from 1973 through 1997.................................................................................................................. 5
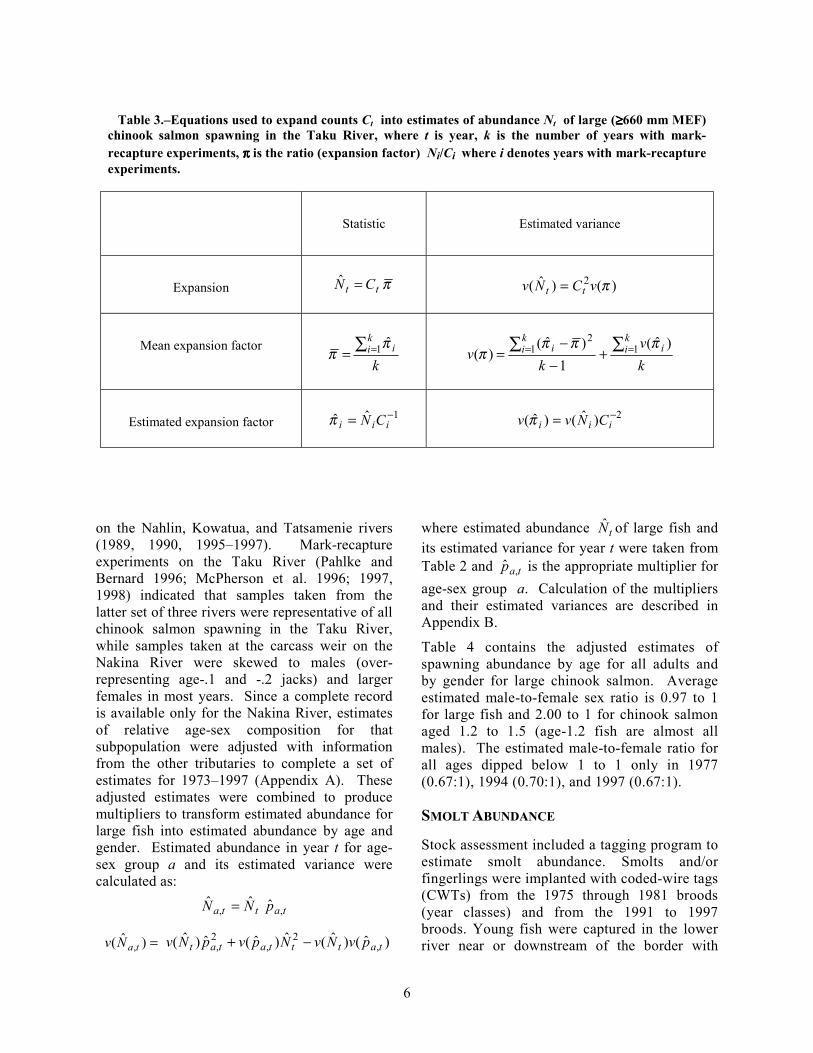
3. Equations used to expand counts Ct into estimates of abundance Nt of large (≥660 mm MEF)chinook salmon spawning in the Taku River .................................................................................................... 6
4. Estimated numbers aN of chinook salmon by age and by large (≥660 mm MEF) females and malesspawning in the Taku River from 1973 through 1997 ...................................................................................... 7
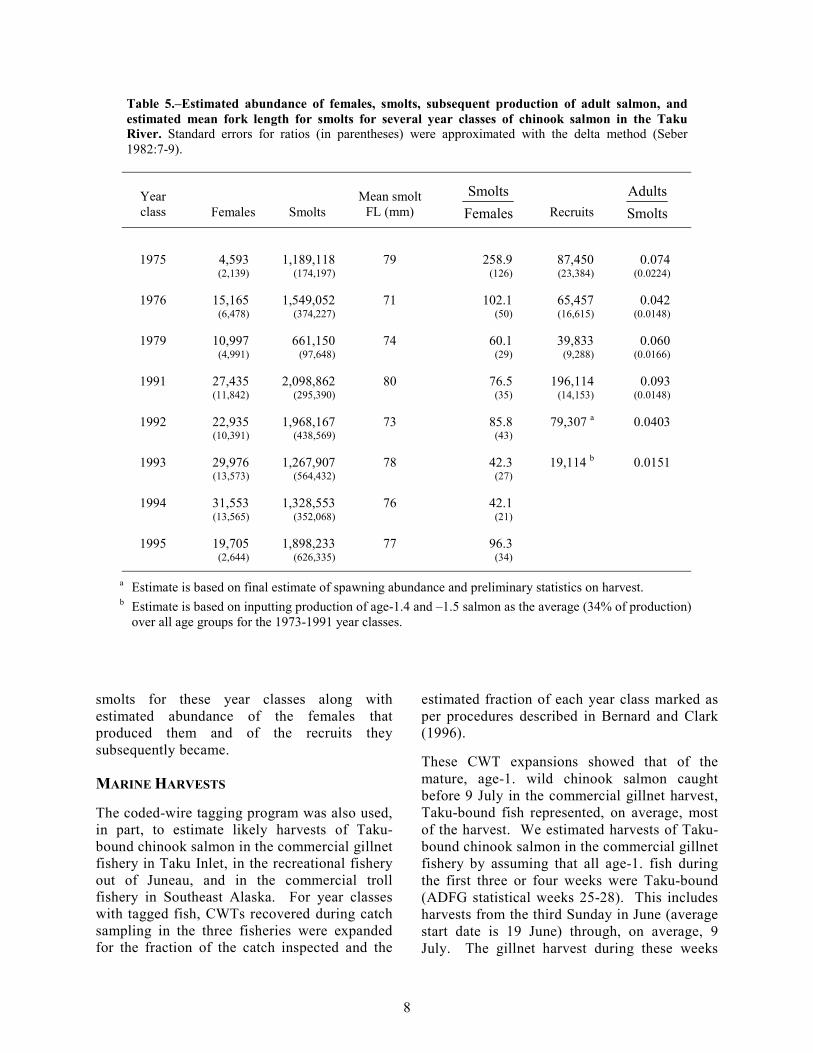
5. Estimated abundance of females, smolts, subsequent production of adult salmon, and estimatedmean fork length for smolts for several year classes of chinook salmon in the Taku River. ........................ 8
6. Estimated harvests by year and age of chinook salmon bound for the Taku River caught incommercial gillnet fisheries in Taku Inlet and in Canada, in the recreational fishery near Juneau, andin the commercial troll fishery in Southeast Alaska........................................................................................ 11
7. Estimated production yR by age and year class for chinook salmon in the Taku River .............................. 11
8. Estimated large spawners yN , large female spawners yN , production yR , return rate ( yR / yN )
and exploitation rate yE by year class for chinook salmon in the Taku River ............................................. 12 9. Estimated parameters for unweighted and weighted regression on the log-linear transform of
Ricker's model on estimates of production and spawning abundance of chinook salmon in the TakuRiver .................................................................................................................................................................. 14
10. Estimated parameters for the log-linear transform of Cushing's power function fit to all data onproduction and spawning abundance of chinook salmon in the Taku River and fit to data with the1991 year class excluded .................................................................................................................................. 15
11. Extremes estimates of female spawning abundance and their ratios with subsequent production ............. 16
.LIST OF FIGURES
Figure Page 1. Map of Taku Inlet and Taku River drainage........................................................................................................ 2 2. Length-frequency polygons of age groups of chinook salmon sampled in fish wheels at Canyon Island
on the Taku River in 1988.................................................................................................................................... 4 3. Spawning abundance of females and associated production simulated from the measurement error in
the original data ................................................................................................................................................ 13 4. Estimated production of age-1.2 to -1.5 chinook salmon in year classes 1973 through 1991 against
the estimated abundance of females that spawned them, along with curves corresponding to least-squares fits of Ricker and Cushing models to all data ................................................................................... 15
5. Estimated smolt production and estimated abundance of female parents for the 1975, 1976, and1991–1995 year classes .................................................................................................................................17

vi
LIST OF APPENDICES
Appendix Page A. Estimates of Relative Age-Sex Composition of Spawning Chinook Salmon ................................................. 22 B. Estimating Numbers of Spawning Chinook Salmon by Age and Sex ............................................................. 30 C. Estimates of Age Composition of Harvested Chinook Salmon........................................................................ 36 D. Summary of Regulations in Southeast Alaska for Recreational, Commercial Gillnet and Commercial
Troll Fisheries, which Pertain to the Marine Harvest of Taku-bound Chinook Salmon ................................ 40 E. Estimates of Smolt Abundance........................................................................................................................... 48
vii
AUTHORS
Scott A. McPherson is the Regional Research Coordinator for the Alaska Department of Fishand Game, Sport Fish Division, Douglas Island Center Building, 802 Third Street, Post OfficeBox 240020, Douglas, Alaska 99824-0020.
David R. Bernard is the Fisheries Scientist for the Alaska Department of Fish and Game, SportFish Division, 333 Raspberry Road, Anchorage, Alaska 99518-1599.
John H. Clark is a Fisheries Scientist for the Alaska Department of Fish and Game,Commercial Fisheries Division, 4240 Jimtown Road, Helena, Montana 59602
ACKNOWLEDGMENTS
The authors thank Paul Kissner, formerly of ADF&G, for implementing the stock assessmentprogram for chinook salmon on the Taku River in the early 1970s. He standardized the aerialsurveys in 1973, initiated age/sex/size sampling on the tributaries, was responsible for the codedwire tagging and most of the adult recovery efforts for the 1975–1981 year classes. We thankSandy Johnston and Pat Milligan of DFO and Andy McGregor and Scott Kelley of ADF&G forhelp developing the chinook stock assessment program on the Taku River, review of this reportand participation in annual projects. We thank Phil Timpany of TRTFN for his 25 years ofparticipation in chinook stock assessment on the Taku River in various capacities for ADF&G,TRTFN and DFO. We thank Keith Pahlke for aerial surveys, assistance in field sampling andproject design in the 1990s, completion of the 1989 and 1990 mark-recapture analysis and reviewof this manuscript. We thank the following project leaders for work required to complete the1989 and 1990 mark-recapture projects: Doug Mecum, Dennis Lemond and Dave Magnus(ADF&G); Brian Mercer and Michael Link (DFO); John Eiler (radio-tagging projectsupervision—National Marine Fisheries Service). We thank the following project leaders forwork required to complete the 1995–1997 mark-recapture projects: Heather Stilwell, Jerry Owensand Richard Yanusz (ADF&G); Brian Mercer (DFO); Phil Timpany and Terry Jack (TRTFN).We thank Dale Brandenburger, Mark Olsen, and Jarbo Crete for smolt tagging since 1993. MarkOlsen and Sue Millard aged many of the scales collected over the years. Various members of: (1)the Transboundary Technical Committee of the PSC, (2) the Chinook Technical Committee of thePSC, (3) the Salmon Escapement Goal Review Committee of ADF&G, and (4) the SalmonSubcommittee of the Pacific Scientific Advice Review Committee (DFO) provided helpfulreview comments on this manuscript--specifically, we would like to thank Ed Jones, KathleenJensen, Mark Schwan (ADF&G); Brian Riddell and Les Jantz (DFO). Alma Seward preparedthe final layout of this manuscript. This work was partially funded by aid authorized under theU.S. Federal Sport Fish Restoration Act, by Canadian funding through DFO and TRTFN, andby recreational anglers fishing in Alaska and Canada.

1
INTRODUCTION
Chinook salmon Oncorhynchus tshawytscha fromthe Taku River (Figure 1) are a “spring run” ofsalmon with adults passing through SoutheastAlaska (SEAK) from late April through early Julyon their way to spawn in Canada from late July tomid-September. Almost all juveniles rear for oneyear in freshwater after emergence. These fishleave freshwater at age-1. as yearling smolt(Kissner and Hubartt 1986), then rear offshorewest and north of SEAK in the Gulf of Alaska andthe Bering Sea. Mature adults migrate backthrough SEAK after one to five years at sea. Fishmaturing at a younger age (age-1.1 and -1.2 fish)are almost exclusively males, while older fish(age-1.3, -1.4. and -1.5 fish) are, on average,about 50% females. Age-1.2, -1.3, and -1.4 fishdominate the annual spawning population, whileage-1.5 fish are uncommon (<5%). Mostspawning occurs in clear-water tributaries to theTaku River, such as the Nakina, King Salmon,Kowatua, Hackett, Dudidontu and Nahlin rivers,
and Tseta Creek (Eiler et al. In prep). Themainstem Taku River is turbid from late springthrough late fall from silts flushed from glaciers inAlaska and British Columbia.
A commercial fishery for chinook salmon hasoperated in Taku Inlet since the late 1800s (Moser1898). Commercial harvests near the terminalarea (troll and gillnet) in Taku Inlet averaged10,000 to 15,000 chinook salmon from 1900through 1929 (Kissner 1982). Commercial gillnetharvests appear to have averaged 5,000 or fewerchinook salmon in the decades since, exceptduring the 1950s when harvests averaged about14,000. These figures include harvests for theentire season and include harvests of other stocks.The Taku chinook stock undoubtedly contributedto the spring troll fishery in SEAK since the early1900s as well, but contribution rates are unknown.Prior to 1976, annual commercial harvests ofchinook salmon from the Taku River wereestimated to have reached approximately 15,000or more, based on spring gillnet and trollharvests in or near Taku Inlet (Kissner 1976).

2
Figure 1.–Taku Inlet and Taku River drainage.
Beginning in 1976, commercial fishing forchinook salmon in SEAK was reducedsubstantially in terminal areas as part of whatsubsequently became a coast-wide, internationalrebuilding program under the Pacific SalmonTreaty signed in 1985. The spring troll fisherywas closed in inside waters of SEAK in 1976, andin the same year, the regulatory opening date of
the drift gillnet fishery in Taku Inlet (Figure 1)was delayed until the third Sunday in June.Presently, the entire annual migration is onlyexposed to capture in a marine recreationalfishery centered near Juneau that is managedunder an annual abundance-based quota forrecreational fishing in all areas of SEAK. Thetail end of each migration is subject to incidental

3
capture in the commercial troll fishery in SEAK,commercial gillnet fisheries for sockeye salmonO. nerka in Taku Inlet and Canadian inriverfisheries. There are also inriver Canadianaboriginal and recreational fisheries. Terminalexploitation of this population is jointly managedby the U.S. and Canada through the TransboundaryRiver Technical Committee (TTC) of the PacificSalmon Commission (PSC) (TTC 1999).
The escapement goal for the Taku River chinooksalmon stock has history dating to 1981. In 1981,the Alaska Department of Fish and Game (ADFG)began an intensive rebuilding program for chinooksalmon in SEAK (ADFG 1981). This programincluded setting escapement goals; a survey countof 9,000 large spawners in the Nakina Riverbecame the goal for the Taku River, based on thehighest survey count on record for this tributary,which was counted in 1952. With the signing ofthe 1985 Salmon Treaty, a drainage-wide goalrange of 25,600 (U.S.) to 30,000 (Canada) largespawners was agreed to, because of differingopinions on a point estimate and an unknownexpansion factor for survey counts. In 1991, theTTC jointly agreed to an index survey goal of13,200 large spawners counted in six tributaries—Nahlin, Nakina, Dudidontu, Kowatua andTatsamenie rivers, along with Tseta Creek (TTC1991). This goal has been used by both nationsand the PSC from 1991 to present. None ofthese three previous escapement goals was basedon analysis of production data because little wasavailable, though the 1991 goal did incorporatespawning distribution determined from radiotelemetry in 1990.
The purpose of our analysis is to determine anoptimal escapement goal range for the populationof chinook salmon in the Taku River based on thebest available information. An optimal escapementgoal along with current stock status will be used todetermine the success or failure of the rebuildingprogram for this population. We provide anoverview of the stock assessment programs used togather information on this population since 1973.Sources of information are cited and analysesdescribed. Adjustments to annual estimates fromstock assessment programs are described inappendices to focus attention on links betweenspawning abundance and subsequent production ofsmolts and adults.
STATISTICS
SPAWNING ABUNDANCE
Since 1973, escapements to the Taku River havebeen assessed with aerial surveys fromhelicopters. Only “large” chinook salmon,typically 3-ocean [age-1.3] and older (most >660mm mid-eye to tail fork [MEF]), were countedannually by flying over stretches of the Nakina,Nahlin, Kowatua, Tatsamenie, and Dudidonturivers, and after 1981, Tseta Creek, according tofixed schedules and protocols (Pahlke 1998).Age-1.1 and age-1.2 salmon (1- and 2-ocean age)were not counted because of the difficulty ofseeing these fish and distinguishing them fromother species. Large chinook salmon could bedistinguished from smaller fish because there waslittle overlap in age/size distributions (Figure 2).Counts were highly correlated across tributaries(Table 1), indicating the relative strengths of yearclasses were the same throughout the Taku River.For this reason, counts within a year weresummed across tributaries to produce a singlecount representing the entire population of largechinook salmon spawning in the Taku River.1
Because surveys over Tseta Creek began in 1981,eight years after the start of surveys elsewhere,counts from Tseta Creek were not used insubsequent analyses. Counts from Tseta Creekwere highly correlated with those from otherwatersheds (P < 0.01). Summed counts Ct for theTaku River are listed in Table 2.
Abundance of large spawners in the Taku Riverwas estimated with mark-recapture experimentsbased on tagging and radiotelemetry studies in1989 and 1990 by the Commercial FisheriesDivision [CFD] of ADFG, the Department of
1 Due to cancelled flights, no counts are available forTatsamenie and Kowatua rivers in 1975 or for theDudidontu River in 1978 and 1984. For those years,sums of counts across surveyed watersheds wereexpanded by complements of interpolated fractions forwatersheds not surveyed. For instance, 2,089 largechinook salmon were counted in 1975. Counts for theTatsamenie River represented 7.6% of all counts in1974 and 7.2% in 1976, making the interpolatedfraction 0.074 for 1975. Together with the interpolatedvalue of 0.085 for the Kowatua River, the expandedcount is 2,484 [=2,089/(1-0.074-0.085)] for 1975.

4
0
10
20
30
40
50
500 550 600 650 700 750 800 850 900 1000950
Num
bers
MEF(mm)
1.2
1.3
1.4
1.5
Figure 2.–Length-frequency polygons of age groups of chinook salmonsampled in fish wheels at Canyon Island on the Taku River in 1988. Thedashed vertical line marks the boundary segregating “large” fish (≥660 mm MEF).
Fisheries and Oceans Canada (DFO), and the U.S.National Marine Fisheries Service (NMFS) (Pahlkeand Bernard 1996; Eiler et al. In prep) and fromcooperative tagging studies by the Division ofSport Fish (DSF) of ADFG, the Taku River TlingitFirst Nation (TRTFN), CFD and DFO from 1995through 1997 (McPherson et al. 1996, 1997, 1998).Adults were captured in fish wheels at CanyonIsland (the first sampling event) and on thespawning grounds upriver in the Nakina,Nahlin, Tatsamenie, Kowatua and Dudidonturivers and Tseta Creek (the second samplingevent). Marked chinook salmon subsequentlycaptured in commercial or recreational fisherieswere censored from the marked population,making the estimate germane to all chinooksalmon spawning in the Taku River. Nospawning has been detected downstream or inthe vicinity of Canyon Island (Eiler et al. Inprep). Estimated abundance was stratified intoage-1.2 and fish age-1.3 and older. Estimatedabundance tN for the latter group in year t is inTable 2.
Abundance of spawners age-1.3 and older inyears without mark-recapture experiments was
estimated indirectly from an expansion factorestimated from comparison of counts Ct of largefish (≥660 mm MEF) in years with mark-recaptureexperiments (Table 3). Expansion factors π forindividual years with experiments are 4.49(SE = 0.63), 4.32 (SE = 0.77), 4.24 (SE = 0.63),4.25 (SE = 0.49), and 8.71 (SE = 1.36), makingthe mean expansion factor π = 5.202 and theestimated variance )(πv = 4.54. Note that )(πvinstead of )(πv was used in calculations tocapture measurement error from mark-recaptureexperiments and from uncertainty in the accuracyof individual aerial surveys.
Age-sex composition of spawners was estimatedfrom information gathered at a carcass weir on theNakina River (1973-1997) and with a combinationof carcass surveys, carcass weirs, and live weirs
2 The unusually high factor of 8.71 represents 1997, ayear when estimated spawning abundance wasexceptionally large. Excluding information from 1997,the expansion factor drops to 4.33 and has an estimatedvariance of 0.42. If 1997 does represent an anomaly inthe survey, information from future years shouldgreatly improve precision of expansions.
5
Table 1.–Pearson correlation coefficients among counts of large chinooksalmon in five tributaries to the Taku River from 1973 to 1997. All P < 0.01with 20 ≤df ≤ 23.
Nakina Kowatua Tatsamenie Dudidontu
Nahlin 0.74 0.76 0.75 0.80Nakina 0.73 0.85 0.77Kowatua 0.82 0.78Tatsamenie 0.77
Table 2.—Combined peak counts from aerial surveys, estimated total spawning abundance N withassociated standard errors and approximate 95% confidence intervals for large (≥≥≥≥660 mm FL) chinooksalmon spawning in the Taku River from 1973 through 1997. Statistics in bold face come directly frommark-recapture experiments in 1989, 1990, and 1995–1997; all other statistics are expanded from counts basedon the relationship between counts and estimates during years with mark-recapture experiments.
Year Counts N SE( N ) N - 1.96 SE( N ) N + 1.96 SE( N )
1973 2,800 14,564 5,968 2,867 26,2611974 3,079 16,015 6,563 3,152 28,8781975 2,484 12,920 5,294 2,543 23,2971976 4,726 24,582 10,073 4,838 44,3251977 5,671 29,497 12,087 5,806 53,1881978 3,292 17,124 7,017 3,371 30,8781979 4,156 21,617 8,858 4,255 38,9791980 7,544 39,239 16,080 7,723 70,7551981 9,528 49,559 20,308 9,755 89,3631982 4,585 23,848 9,773 4,694 43,0031983 1,883 9,794 4,014 1,928 17,6611984 3,995 20,778 8,514 4,090 37,4661985 6,905 35,916 14,718 7,069 64,7621986 7,327 38,111 15,617 7,501 68,7201987 5,563 28,935 11,857 5,695 52,1761988 8,560 44,524 18,245 8,764 80,2841989 8,986 40,329 5,646 29,263 51,3951990 12,077 52,142 9,326 33,863 70,4211991 9,929 51,645 21,163 10,165 93,1241992 10,745 55,889 22,902 11,001 100,7781993 12,713 66,125 27,097 13,015 119,2361994 9,299 48,368 19,820 9,520 87,2161995 7,971 33,805 5,060 23,887 43,7231996 18,576 79,019 9,048 61,285 96,7531997 13,201 114,938 17,888 79,878 149,998
6
Table 3.–Equations used to expand counts Ct into estimates of abundance Nt of large (≥≥≥≥660 mm MEF)chinook salmon spawning in the Taku River, where t is year, k is the number of years with mark-recapture experiments, ππππ is the ratio (expansion factor) Ni/Ci where i denotes years with mark-recaptureexperiments.
Statistic Estimated variance
Expansion πtt CN =ˆ )()ˆ( 2 πvCNv tt =
Mean expansion factork
ki i∑ == 1π
πkv
kv
ki i
ki i ∑∑ == +
−−
= 112 )ˆ(
1)ˆ(
)(πππ
π
Estimated expansion factor 1ˆˆ −= iii CNπ 2)ˆ()ˆ( −= iii CNvv π
on the Nahlin, Kowatua, and Tatsamenie rivers(1989, 1990, 1995–1997). Mark-recaptureexperiments on the Taku River (Pahlke andBernard 1996; McPherson et al. 1996; 1997,1998) indicated that samples taken from thelatter set of three rivers were representative of allchinook salmon spawning in the Taku River,while samples taken at the carcass weir on theNakina River were skewed to males (over-representing age-.1 and -.2 jacks) and largerfemales in most years. Since a complete recordis available only for the Nakina River, estimatesof relative age-sex composition for thatsubpopulation were adjusted with informationfrom the other tributaries to complete a set ofestimates for 1973–1997 (Appendix A). Theseadjusted estimates were combined to producemultipliers to transform estimated abundance forlarge fish into estimated abundance by age andgender. Estimated abundance in year t for age-sex group a and its estimated variance werecalculated as:
tatta pNN ,, ˆˆˆ =
=)ˆ( ,taNv )ˆ()ˆ(ˆ)ˆ(ˆ)ˆ( ,2
,2, tatttatat pvNvNpvpNv −+
where estimated abundance tN of large fish andits estimated variance for year t were taken fromTable 2 and tap ,ˆ is the appropriate multiplier forage-sex group a. Calculation of the multipliersand their estimated variances are described inAppendix B.
Table 4 contains the adjusted estimates ofspawning abundance by age for all adults andby gender for large chinook salmon. Averageestimated male-to-female sex ratio is 0.97 to 1for large fish and 2.00 to 1 for chinook salmonaged 1.2 to 1.5 (age-1.2 fish are almost allmales). The estimated male-to-female ratio forall ages dipped below 1 to 1 only in 1977(0.67:1), 1994 (0.70:1), and 1997 (0.67:1).
SMOLT ABUNDANCE
Stock assessment included a tagging program toestimate smolt abundance. Smolts and/orfingerlings were implanted with coded-wire tags(CWTs) from the 1975 through 1981 broods(year classes) and from the 1991 to 1997broods. Young fish were captured in the lowerriver near or downstream of the border with

7
Table 4.–Estimated numbers aN of chinook salmon by age and by large (≥≥≥≥660 mm MEF) femalesand males spawning in the Taku River from 1973 through 1997. Bold numbers came directly from mark-recapture experiments. Estimated SEs for these statistics are in Appendix Table B.3.
Year 1.2 1.3 1.4 1.5Large
femalesLargemales
1973 8,553 7,966 6,427 172 8,929 5,6311974 10,043 11,080 4,826 109 9,824 6,1911975 25,074 7,998 4,800 122 4,593 8,327
1976 11,667 16,718 7,624 240 15,165 9,4171977 4,678 12,716 16,091 689 20,466 9,0301978 31,514 9,162 6,653 1,309 9,143 7,9811979 28,620 18,790 2,530 297 10,997 10,6201980 16,436 26,282 12,957 - 21,228 18,011
1981 15,597 28,133 21,426 - 25,024 24,5351982 5,932 11,390 11,431 1,026 12,396 11,4511983 4,571 5,935 3,705 155 4,120 5,6751984 9,821 17,838 2,593 347 10,091 10,6871985 12,923 25,720 10,062 134 17,447 18,469
1986 8,034 19,363 18,008 739 21,700 16,4101987 7,715 19,856 8,291 788 12,607 16,3281988 17,579 14,265 27,785 2,474 21,864 22,6601989 10,569 26,715 12,053 1,561 17,580 22,7491990 7,095 20,848 30,124 1,171 26,749 25,394
1991 21,707 24,090 23,013 4,542 27,435 24,2101992 18,683 31,513 22,592 1,784 22,935 32,9541993 11,217 34,594 29,762 1,769 29,976 36,1491994 5,285 28,888 17,489 1,991 31,553 16,8151995 30,884 14,606 19,950 612 19,705 14,100
1996 8,005 71,372 9,901 143 40,897 38,1221997 2,652 43,757 71,071 - 70,691 44,247
baited minnow traps (Kissner and Hubartt 1986)and in later years with additional screw traps.The fraction of year class y tagged in year y+2 assmolts was estimated by summing data on adultsof that year class sampled on the spawninggrounds or caught at Canyon Island in years y+3,y+4, y+5, and/or y+6. Recovery of CWTs fromadults on the spawning grounds showed thattagged smolts represented all subpopulations inthe Taku River in near equal proportion. The
estimated marked fraction of year class y wasmultiplied by the number tagged in year y+2 toestimate the number of smolt emigrating thatyear as per a simple, two-event mark-recaptureexperiment on a closed population (Seber1982:60). Because too few smolt were recapturedfor some year classes, estimates of smoltabundance are available only for year classes in1975, 1976, 1979, and 1991 through 1995. Table5 is a compendium of abundance estimates of
8
Table 5.–Estimated abundance of females, smolts, subsequent production of adult salmon, andestimated mean fork length for smolts for several year classes of chinook salmon in the TakuRiver. Standard errors for ratios (in parentheses) were approximated with the delta method (Seber1982:7-9).
Yearclass Females Smolts
Mean smoltFL (mm) Females
SmoltsRecruits Smolts
Adults
1975 4,593 1,189,118 79 258.9 87,450 0.074(2,139) (174,197) (126) (23,384) (0.0224)
1976 15,165 1,549,052 71 102.1 65,457 0.042 (6,478) (374,227) (50) (16,615) (0.0148)
1979 10,997 661,150 74 60.1 39,833 0.060 (4,991) (97,648) (29) (9,288) (0.0166)
1991 27,435 2,098,862 80 76.5 196,114 0.093(11,842) (295,390) (35) (14,153) (0.0148)
1992 22,935 1,968,167 73 85.8 79,307 a 0.0403(10,391) (438,569) (43)
1993 29,976 1,267,907 78 42.3 19,114 b 0.0151(13,573) (564,432) (27)
1994 31,553 1,328,553 76 42.1(13,565) (352,068) (21)
1995 19,705 1,898,233 77 96.3(2,644) (626,335) (34)
a Estimate is based on final estimate of spawning abundance and preliminary statistics on harvest.b Estimate is based on inputting production of age-1.4 and –1.5 salmon as the average (34% of production)
over all age groups for the 1973-1991 year classes.
smolts for these year classes along withestimated abundance of the females thatproduced them and of the recruits theysubsequently became.
MARINE HARVESTS
The coded-wire tagging program was also used,in part, to estimate likely harvests of Taku-bound chinook salmon in the commercial gillnetfishery in Taku Inlet, in the recreational fisheryout of Juneau, and in the commercial trollfishery in Southeast Alaska. For year classeswith tagged fish, CWTs recovered during catchsampling in the three fisheries were expandedfor the fraction of the catch inspected and the
estimated fraction of each year class marked asper procedures described in Bernard and Clark(1996).
These CWT expansions showed that of themature, age-1. wild chinook salmon caughtbefore 9 July in the commercial gillnet harvest,Taku-bound fish represented, on average, mostof the harvest. We estimated harvests of Taku-bound chinook salmon in the commercial gillnetfishery by assuming that all age-1. fish duringthe first three or four weeks were Taku-bound(ADFG statistical weeks 25-28). This includesharvests from the third Sunday in June (averagestart date is 19 June) through, on average, 9July. The gillnet harvest during these weeks
9
averaged 1,898 chinook salmon from 1977–1997, which represents 70% of the season totalin this fishery. Though some Taku-boundchinook salmon are undoubtedly caught laterthan this in some years, as evidenced by CWTrecoveries, some harvest of other age-1. stocksis also included in our estimates and we expectthese differences to cancel each other.
Estimated marine gillnet harvests wereapportioned among year classes according toestimated relative age composition of thecatches (Appendix C). Age samples collectedfrom the gillnet fishery from 1982–1992 and1995–1997 were used to estimate agecomposition for those years (Appendix C). Agecomposition for 1977–1981 and 1993–1994were estimated by adjusting estimates ofrelative age composition for the Nakina River(Appendix C). For years when information isavailable for both the gillnet fishery and theNakina River, regression parameters werecalculated to estimate proportions by age classin the gillnet fishery in years when this fisherywas not sampled. Estimated standard errors forgillnet harvests are listed in Appendix Table C2.
CWT expansions in the Juneau recreationalfishery showed that of the mature, age-1. wildchinook salmon caught before late-June in thisfishery, Taku-bound fish represented most ofthe harvests in years when random CWTs wererecovered. This fishery has been sampled atrelatively low rates for CWTs (9%) and, notsurprisingly, few random CWTs have beenrecovered in this fishery. However, select CWTrecoveries (heads turned in voluntarily by sportanglers), represented almost every brood yearCWTd on the Taku River. We estimated Taku-bound chinook salmon in the Juneaurecreational fishery by subtracting all age-0.fish and all other stocks estimated harvest fromCWTs (hatchery and wild) from the springharvests. Spring harvests include estimatedharvests from late April to late June in theJuneau area. Estimated spring harvests of Taku-bound chinook salmon in the Juneau recreationalfishery averaged 4,122 from 1977–1997.
These estimated marine recreational harvestswere then apportioned among year classesaccording to estimated relative age composition
of the harvests (Appendix C). Age samplescollected from the Juneau recreational fisheryfrom 1983–1997 were used to estimate agecomposition for those years. Age compositionsfor 1977–1982 were estimated by adjustingestimates of relative age composition for theNakina River (Appendix C). Estimatedstandard errors for recreational harvests arelisted in Appendix Table C1.
Harvests of Taku-bound chinook salmon in thecommercial troll fishery in Southeast Alaskawere estimated directly from CWT recoveries(Appendix Table C4). This fishery harvestsmyriad stocks and has been sampled at highrates for recovery of CWTs, averaging 40–45%.Given the magnitude of the harvest (over200,000 per year average) and the highsampling rate, the likelihood of recoveringCWTs from this fishery is higher than for theother two fisheries mentioned previously. Thisfishery has undergone large-scale changes inmanagement; the fishery has been closed mostof the spring troll period (April 16 to June 30)since 1981, when Taku-bound fish would havebeen harvested (Appendix D). Estimatedharvests of Taku-bound chinook salmon werelow following the 1976 brood year returns.Additionally, we did not have CWT estimatesfor the 1982–1990 year classes and we did notinclude estimated commercial troll harvests forthese broods. Exclusion of these broods isconsidered negligible in the following analysisbecause the estimated troll exploitation rate forthe 1977–1981 year classes was 2% of the totalreturn.
These marine harvest estimates were combinedwith those from the inriver fishery (Table 6).This fishery occurs above the internationalborder in Canada on the Taku River and allchinook salmon in this fishery were consideredTaku-bound.
Virtually no other CWTs associated withchinook salmon of the Taku River wererecovered from other marine fisheries.Incidental mortality of chinook salmon inmarine fisheries was ignored in this analysis,including potential net drop-out in commercialgillnets. Only the recreational fishery nearJuneau is known to cover the migration windowof chinook salmon returning to the Taku River.

10
Some fish caught in this fishery are most likelyreleased and some of these released fish mostlikely die. However, the number of released,legal-sized chinook salmon in this fishery isknown to be minor, from annual creel sampling(Hubartt et al. 1999). Hence, the number ofthese incidentally killed chinook salmon isnegligible relative to the abundance of returningadults.
INRIVER HARVESTS
Age compositions of chinook salmon caught inthe inriver commercial fishery for sockeyesalmon were estimated by adjusting estimates ofrelative age composition for the Nakina River(Appendix C). For years when information isavailable for both the fishery and the NakinaRiver, regression parameters were calculated toestimate proportions by age class in the inriverfishery in years when this fishery was notsampled. Estimated standard errors for inrivergillnet harvests are listed in Appendix Table C4.Because catches in the inriver recreationalfishery are believed to be so small (<100 peryear), these fish are not considered further inthis analysis.
PRODUCTION
Estimated production of adults from year class yand its estimated variance were calculated as:
∑∑ = ++= ++ += 51 2,.1
51 2,.1
ˆˆˆi iyii iyiy HNR
∑∑ = ++= ++ += 51 2,.1
51 2,.1 )ˆ()ˆ()ˆ( i iyii iyiy HvNvRv
where 2,.1ˆ
++iyiN is the estimated number of
spawners and 2,.1ˆ
++iyiH the estimated harvest of
chinook salmon age-1.i in year y+i+2. Estimatedproduction and estimates of their SEs are inTable 7 for year classes 1973 through 1991.Estimated production for age-1.5 salmon in the1991 year class was not available at this writing,making the overall estimate of production forthis year class negligibly conservative.
EXPLOITATION RATE
The estimated exploitation rate (Table 8) and itsestimated variance were calculated as:
y
yy R
HE ˆ
ˆˆ =
[ ] 4
2
4
2
ˆ
ˆ]ˆ[ˆ
ˆ]ˆ[ˆy
y
y
yyy
R
HNv
R
NHvEv +≈
The variance above was approximated with thedelta method (Seber 1982).
ANALYSISMEASUREMENT ERROR
Because values of Ry and Ny are unknown for theTaku River population, their estimates were usedin the analysis as substitutes. Use of estimatesintroduced measurement error into bothindependent and dependent variables. As perBernard et al. (2000) log-normal measurementerror can itself be estimated when samplingvariances are calculated. For measurement errorin spawning abundance
2)]ˆ[ln()]ˆ[ln( uNVNV σ+=
These variances are unknown, but can beestimated as )]ˆ[ln(Nv and 2ˆuσ such that
1])ˆln()ˆ[ln(
)]ˆ[ln(2
−−
=∑
nNN
Nv y = 0.3033
nNcv
nyyu
u)ˆ(ˆ
ˆ22
,2 ==∑σ
σ = 0.1832
Note these calculations show estimated measure-ment error composed 60% (= 0.1832/0.3033) ofall variation in estimated spawning abundance.
Log-normal measurement error in estimates ofproduction was estimated as (see Bernard et al.2000):
nyv
v∑
=2,2 ˆ
ˆσ
σ
)ˆ(ˆ)ˆ()]ˆ[ln(ˆ 222, yyyyyv RcvRRvRv =≅= −σ

11
Table 6.–Estimated harvests by year and age of chinook salmon bound for the Taku River caught incommercial gillnet fisheries in Taku Inlet and in Canada, in the recreational fishery near Juneau and inthe commercial troll fishery in Southeast Alaska. Standard errors are in parentheses.
Year 1.2 1.3 1.4 1.5 Total1977 183 (90)
1978 1,403 (278) 1,818 (355)
1979 3,297 (710) 5,402 (561) 1,559 (366) 10,259 (976)
1980 891 (202) 3,745 (1,022) 5,390 (404) 10,026 (1,117)
1981 543 (148) 4,930 (1,905) 3,041 (1,027) 8,514 (2,169)
1982 941 (54) 1,661 (445) 3,480 (969) 12 (9) 6,143 (1,068)
1983 725 (35) 637 (79) 1,060 (325) 2,493 (337)
1984 799 (66) 4,173 (926) 345 (61) 9 (9) 5,370 (930)
1985 777 (65) 1,983 (180) 1,703 (419) 30 (20) 4,501 (461)
1986 560 (108) 942 (121) 1,147 (133) 22 (12) 2,702 (212)
1987 505 (64) 1,031 (109) 1,039 (408) 122 (41) 2,707 (430)
1988 797 (128) 409 (135) 1,090 (129) 25 (14) 2,339 (227)
1989 868 (158) 2,452 (274) 914 (133) 118 (38) 4,357 (345)
1990 1,292 (329) 1,875 (347) 2,666 (353) 48 (22) 5,884 (595)
1991 2,183 (286) 2,252 (346) 3,657 (395) 312 (76) 8,404 (603)
1992 1,103 (234) 2,435 (350) 2,546 (354) 37 (21) 6,121 (550)1993 1,724 (640) 4,168 (677) 6,077 (687) 170 (50) 12,139 (1,159)
1994 1,059 (531) 3,563 (541) 3,196 (377) 108 (33) 7,927 (847)
1995 4,365 (412) 2,115 (438) 2,228 (234) 159 (58) 8,867 (647)
1996 727 (547) 9,674 (1,110) 1,117 (306) 75 (31) 11,594 (1,275)
1997 241 (50) 3,702 (257) 8,748 (1,132) 12,692 (1,162)
Table 7.–Estimated production yR by age and year class for chinook salmon in the Taku River. Standarderrors are in parentheses.
Year class 1.2 1.3 1.4 1.5 Total1973 4,861 (3,203) 10,980 (3,946) 4,089 (1,276) 19,931 (5,266)
1974 32,917 (20,686) 24,192 (7,732) 18,347 (6,061) 75,456 (22,913)
1975 31,917 (18,120) 30,027 (11,160) 24,467 (9,540) 1,038 (543) 87,450 (23,384)
1976 17,327 (9,947) 33,063 (12,117) 14,911 (5,066) 155 (86) 65,457 (16,615)
1977 16,140 (9,846) 13,051 (4,958) 4,765 (1,660) 356 (174) 34,312 (11,164)
1978 6,873 (3,901) 6,572 (2,518) 2,938 (1,318) 164 (67) 16,547 (4,828)
1979 5,296 (3,003) 22,011 (7,348) 11,765 (4,696) 761 (404) 39,833 (9,288)
1980 10,620 (5,889) 27,703 (10,772) 19,155 (8,055) 910 (406) 58,388 (14,691)
1981 13,700 (8,083) 20,305 (8,495) 9,330 (3,870) 2,499 (1,467) 45,833 (12,442)
1982 8,594 (5,175) 20,887 (8,320) 28,875 (11,905) 1,679 (294) 60,035 (15,423)
1983 8,220 (4,945) 14,674 (6,471) 12,967 (1,770) 1,219 (264) 37,079 (8,341)
1984 18,376 (11,808) 29,167 (3,819) 32,790 (5,434) 4,854 (2,385) 85,187 (13,764)
1985 11,437 (1,589) 22,723 (3,779) 26,670 (10,244) 1,821 (1,050) 62,650 (11,097)
1986 8,387 (1,338) 26,342 (10,328) 25,138 (10,069) 1,939 (964) 61,805 (14,530)
1987 23,890 (14,085) 33,948 (13,421) 35,839 (13,300) 2,099 (970) 95,777 (23,601)
1988 19,786 (12,515) 38,762 (15,006) 20,685 (8,135) 771 (174) 80,004 (21,182)
1989 12,941 (7,438) 32,451 (12,321) 22,178 (2,600) 218 (84) 67,788 (14,651)
1990 6,344 (3,400) 16,715 (1,952) 11,018 (1,287) 34,078 (4,194)
1991 35,249 (3,848) 81,046 (7,692) 79,819 (11,120) 196,114 (14,153)
Average 15,414 26,559 21,355 1,078 64,406

12
Table 8.–Estimated large spawners yN , large female spawners FyN ,ˆ , production yR , return rate
( yR / yN ) and exploitation rate yE by year class for chinook salmon in the Taku River. Standard errorsare in parentheses.
Yearclass yN FyN ,
ˆyR
Fy
y
N
R
,ˆ
ˆyE
1973 14,564 (5,968) 8,929 (3,864) 19,931 (5,266) 2.2 (1.13) 0.179 (0.052)
1974 16,015 (6,563) 9,824 (4,236) 75,456 (22,913) 7.7 (4.05) 0.162 (0.050)
1975 12,920 (5,294) 4,593 (2,139) 87,450 (23,384) 19.0 (10.22) 0.115 (0.035)
1976 24,582 (10,073) 15,165 (6,478) 65,457 (16,615) 4.3 (2.14) 0.142 (0.046)
1977 29,497 (12,087) 20,466 (8,678) 34,312 (11,164) 1.7 (0.90) 0.095 (0.034)
1978 17,124 (7,017) 9,143 (3,997) 16,547 (4,828) 1.8 (0.95) 0.118 (0.035)
1979 21,617 (8,858) 10,997 (4,991) 39,833 (9,288) 3.6 (1.85) 0.166 (0.044)
1980 39,239 (16,080) 21,228 (9,450) 58,388 (14,691) 2.8 (1.41) 0.069 (0.018)
1981 49,559 (20,308) 25,024 (11,144) 45,833 (12,442) 1.8 (0.96) 0.061 (0.019)
1982 23,848 (9,773) 12,396 (5,426) 60,035 (15,423) 4.8 (2.46) 0.047 (0.012)
1983 9,794 (4,014) 4,120 (1,903) 37,079 (8,341) 9.0 (4.62) 0.051 (0.012)
1984 20,778 (8,514) 10,091 (4,720) 85,187 (13,764) 8.4 (4.18) 0.073 (0.013)
1985 35,916 (14,718) 17,447 (7,820) 62,650 (11,097) 3.6 (1.73) 0.103 (0.020)
1986 38,111 (15,617) 21,700 (9,523) 61,805 (14,530) 2.8 (1.42) 0.101 (0.025)
1987 28,935 (11,857) 12,607 (5,778) 95,777 (23,601) 7.6 (3.95) 0.113 (0.029)
1988 44,524 (18,245) 21,864 (9,742) 80,004 (21,182) 3.7 (1.90) 0.108 (0.030)
1989 40,329 (5,646) 17,580 (4,827) 67,788 (14,651) 3.9 (1.35) 0.112 (0.027)
1990 52,142 (9,326) 26,749 (5,831) 34,078 (4,194) 1.3 (0.32) 0.126 (0.025)
1991 51,645 (21,163) 27,435 (11,842) 196,114 (14,153) 7.1 (3.13) 0.116 (0.011)
Average 30,060 15,650 64,406 5.1 0.108
For the population in the Taku River, 2ˆ vσ =0.0583. Estimated measurement error for theestimated log of the production-to-spawnerratio yy NR ˆˆ is )ˆ()ˆ(ˆ 222
, yyyuv NcvRcv +=σ . The
average over all year classes is 2ˆuvσ = 0.2415.
The magnitude of measurement error in estimatesof production and spawning abundance for thisstock was graphically displayed with the aid ofsimulation (Figure 3). A log-standard normalvariate was randomly selected for each estimateof harvest, spawning abundance, and relative agecomposition, then transformed into a variate withthe appropriate mean and variance, therebycreating a new set of statistics from the original.These new simulated statistics were multipliedand their products added appropriately to obtain
a simulated set of data pairs }~,~{ yy NR . The pro-
cess was used to create 950 pairs. The cloud ofsimulated points spreads out horizontally fromclose on the y-axis out to about twice the highestestimate of spawning abundance. The cloud alsospreads vertically topped by a curious wisp ofpoints set above the cloud. The wisp is a resultof the relatively precise estimate of productionfor the 1991 year class [ )ˆ( 91Rcv = 7.0%] (due tomark-recapture experiments) and poor precisionin estimates of the females that spawned them[ )ˆ( 91Ncv = 43%] from the expansion of an aerialsurvey). This contrast in precision laterallyflattens and elongates the cloud of simulatedpoints for this year class. Simulated points forthe 1991 year class are set above the rest becausetheir production was atypically strong.

13
Spawning Females(thousands)
Prod
uctio
n (t
hous
ands
)
0 10 20 30 40 500
50
100
150
200
250
Figure 3.–Spawning abundance of females and associated productionsimulated from the measurement error in the original data. Boxescorrespond to the range of the original data. Bands along the right edge of theplot correspond to a few instances with spawning abundance beyond 50thousand females.
PARAMETER ESTIMATES
Two models were used in the analysis: Ricker’sexponential function (Ricker 1975) =yR
)exp()exp( yyy NS εβα − and Cushing’s power
function )exp( yyy NR εα β ′′= (Cushing 1973).The latter is an approximation to the former thatallows incorporation of measurement error inspawning abundance in the analysis. The term εyrepresents process error in both models where
),0(~ 2εσε normy . Parameters were estimated for
the linear form of Ricker’s model=− )ln()ln( yy NR yyN εβα +−)ln( (Table 9)
with the computer program Systat. Becauseestimated precision for brood years 1989-91 wasconsiderably improved over earlier year classes,parameters were estimated with unweightedregression and with regression where thedependent variable was weighted by 2
,ˆ1 yuvσ . No
autocorrelation among residuals or higher orderinfluence of spawning abundance could be found(as per methods in Bernard et al. 2000).Predictions by the fitted, untransformed modeland the original data are given in Figure 4.Spawning abundance that on average producesmaximum sustained yield (NMSY) was estimated byiteratively solving the following transcendentalrelationship:
)2ˆlnexp(
)1)(ˆˆexp()ˆˆ1(1
2
1
εσα
τββ
+
+−−=∧
−msymsy NN
for MSYN where 222 ˆˆˆ uvr σσσ ε −= = 0.12 for both
unweighted and weighted regressions, 2ˆ rσ is themean square error from the fitted regression, andthe male-to-female ratio τ = 1. Little differencewas seen between statistics for the unweightedand weighted regression ( MSYN = 11,629 vs.
14
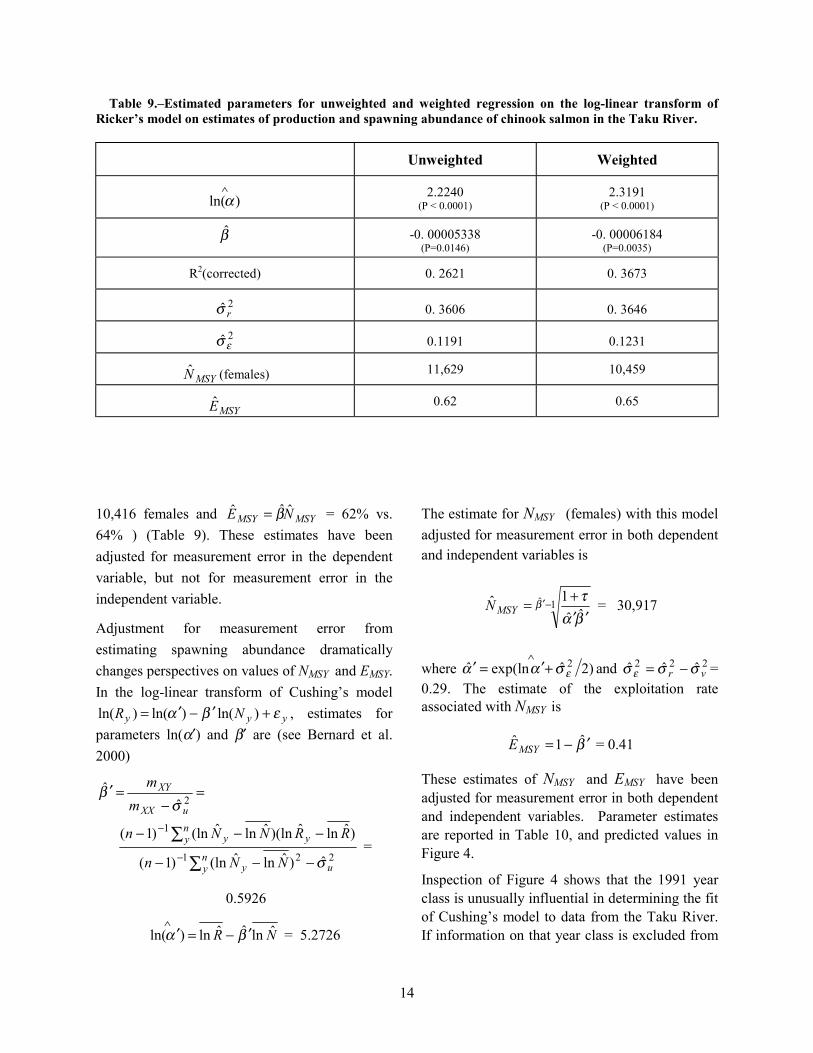
Table 9.–Estimated parameters for unweighted and weighted regression on the log-linear transform ofRicker’s model on estimates of production and spawning abundance of chinook salmon in the Taku River.
Unweighted Weighted
∧)ln(α 2.2240
(P < 0.0001)2.3191
(P < 0.0001)
β -0. 00005338(P=0.0146)
-0. 00006184(P=0.0035)
R2(corrected) 0. 2621 0. 3673
2ˆ rσ 0. 3606 0. 3646
2ˆεσ 0.1191 0.1231
MSYN (females) 11,629 10,459
MSYE 0.62 0.65
10,416 females and MSYMSY NE ˆˆˆ β= = 62% vs.64% ) (Table 9). These estimates have beenadjusted for measurement error in the dependentvariable, but not for measurement error in theindependent variable.
Adjustment for measurement error fromestimating spawning abundance dramaticallychanges perspectives on values of NMSY and EMSY.In the log-linear transform of Cushing’s model
yyy NR εβα +′−′= )ln()ln()ln( , estimates forparameters ln(α′) and β′ are (see Bernard et al.2000)
=−
=′2ˆ
ˆuXX
XY
mm
σβ
221
1
ˆ)ˆlnˆ(ln)1(
)ˆlnˆ)(lnˆlnˆ(ln)1(
uny y
ny yy
NNn
RRNNn
σ∑
∑−−−
−−−−
−
=
0.5926
NR ˆlnˆˆln)ln( βα ′−=′∧
= 5.2726
The estimate for NMSY (females) with this modeladjusted for measurement error in both dependentand independent variables is
1ˆˆˆ
1ˆ −′′′
+= ββατ
MSYN = 30,917
where )2ˆlnexp(ˆ 2εσαα +′=′
∧and 222 ˆˆˆ vr σσσ ε −= =
0.29. The estimate of the exploitation rateassociated with NMSY is
β ′−= ˆ1ˆMSYE = 0.41
These estimates of NMSY and EMSY have beenadjusted for measurement error in both dependentand independent variables. Parameter estimatesare reported in Table 10, and predicted values inFigure 4.
Inspection of Figure 4 shows that the 1991 yearclass is unusually influential in determining the fitof Cushing’s model to data from the Taku River.If information on that year class is excluded from

15
0
20,000
40,000
60,000
80,000
100,000
120,000
140,000
160,000
180,000
200,000
0 5,000 10,000 15,000 20,000 25,000 30,000 35,000
Spawning Females
Prod
uctio
n
Cushing
Ricker
Figure 4.–Estimated production of age-1.2 to -1.5 chinook salmon in year classes 1973through 1991 against the estimated abundance of females that spawned them, along withcurves corresponding to least-squares fits of Ricker and Cushing models to all data.
Table 10.–Estimated parameters for the log-linear transform of Cushing’s power function fit to all data onproduction and spawning abundance of chinook salmon in the Taku River and fit to data with the 1991 yearclass excluded.
All data 1991 excluded
)ln(∧
′α 5.2726 8.9688
β ′ˆ 0.5926 0.1983
R2(corrected) 0.2841 0.0389
2ˆ rσ 0.3706 0.2666
2ˆεσ 0.3123 0.2083
MSYN 30,917 4,602
MSYE 0.41 0.80
16
the data and Cushing’s model refit, the resultingstatistics differ dramatically (Table 10) with
MSYN dropping to 4,602 and MSYE rising to80%.
SMOLT PRODUCTION
An analysis of the more precise statistics onproduction and on the auxiliary data in Table 5 onsmolt production, reveals evidence to support thefollowing:
• a wide range of spawning abundance overthe years with even a wider range to come;
• density-dependent survival in the earlyfreshwater life of young chinook salmon;
• density-independent survival in the laterfreshwater life of young chinook salmon;
• density-independent survival of smolts atsea; and
• an upper bound on the production of smoltsfrom the Taku River.
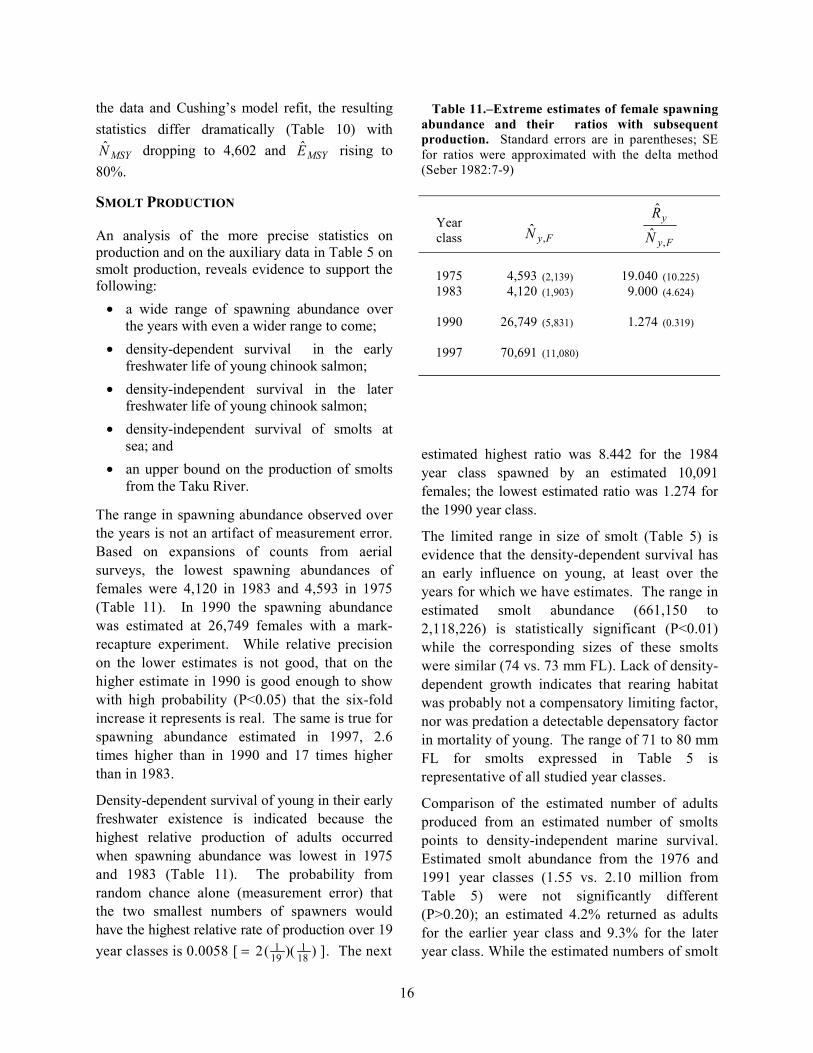
The range in spawning abundance observed overthe years is not an artifact of measurement error.Based on expansions of counts from aerialsurveys, the lowest spawning abundances offemales were 4,120 in 1983 and 4,593 in 1975(Table 11). In 1990 the spawning abundancewas estimated at 26,749 females with a mark-recapture experiment. While relative precisionon the lower estimates is not good, that on thehigher estimate in 1990 is good enough to showwith high probability (P<0.05) that the six-foldincrease it represents is real. The same is true forspawning abundance estimated in 1997, 2.6times higher than in 1990 and 17 times higherthan in 1983.
Density-dependent survival of young in their earlyfreshwater existence is indicated because thehighest relative production of adults occurredwhen spawning abundance was lowest in 1975and 1983 (Table 11). The probability fromrandom chance alone (measurement error) thatthe two smallest numbers of spawners wouldhave the highest relative rate of production over 19year classes is 0.0058 [ ))((2 18
1191= ]. The next
Table 11.–Extreme estimates of female spawningabundance and their ratios with subsequentproduction. Standard errors are in parentheses; SEfor ratios were approximated with the delta method(Seber 1982:7-9)
Yearclass FyN ,
ˆFy
y
N
R
,ˆ
ˆ
1975 4,593 (2,139) 19.040 (10.225)1983 4,120 (1,903) 9.000 (4.624)
1990 26,749 (5,831) 1.274 (0.319)
1997 70,691 (11,080)
estimated highest ratio was 8.442 for the 1984year class spawned by an estimated 10,091females; the lowest estimated ratio was 1.274 forthe 1990 year class.
The limited range in size of smolt (Table 5) isevidence that the density-dependent survival hasan early influence on young, at least over theyears for which we have estimates. The range inestimated smolt abundance (661,150 to2,118,226) is statistically significant (P<0.01)while the corresponding sizes of these smoltswere similar (74 vs. 73 mm FL). Lack of density-dependent growth indicates that rearing habitatwas probably not a compensatory limiting factor,nor was predation a detectable depensatory factorin mortality of young. The range of 71 to 80 mmFL for smolts expressed in Table 5 isrepresentative of all studied year classes.
Comparison of the estimated number of adultsproduced from an estimated number of smoltspoints to density-independent marine survival.Estimated smolt abundance from the 1976 and1991 year classes (1.55 vs. 2.10 million fromTable 5) were not significantly different(P>0.20); an estimated 4.2% returned as adultsfor the earlier year class and 9.3% for the lateryear class. While the estimated numbers of smolt

17
are not statistically different, the return rates are(P<0.01). The estimated size of smolts for theseyear classes (71 and 80 mm FL) do cover theobserved range. In contrast, estimated smoltabundance was significantly different for the1975 and 1979 year classes (1.20 vs. 0.66million, P<0.01) while their return rates werevery similar (0.074 vs. 0.060; P>0.50).Estimated smolt size for the 1975 and 1979 yearclasses are closer: 74 vs. 79 mm FL.
The evidence in the auxiliary informationunderpinning a ceiling on the number of smoltsproduced each year by the Taku River iscircumstantial. Early density-dependence in thefreshwater existence of chinook salmon is theresult of limited, high quality spawning habitator limited rearing habitat for emerging young. Ifthe earliest determinants of year-class strengthare the only density-dependent factors in the lifehistory of the population (as may be indicated),the highest production observed from a givenspawning abundance captures the mostinformation on density dependence.3 For thesereasons, the highest production ratio (smolts/female) for a given spawning abundance (females)is the best reflection of the effect of density-dependent survival on young. The year classeswith the highest production ratios are 1975,1976, 1991, 1992 and 1995 (Table 5). The otheryear classes, with more or fewer numbers ofspawners, had estimated smolt productionunexpectedly low given the estimated abundanceof female parents. If there is a ceiling on smoltproduction in the Taku River, smolt productionfor the year classes with the highest productionrates should follow an asymptotic, density-dependent relationship (Figure 5). However, smoltproduction is too similar among the year classesand the precision in estimates too poor todistinguish an asymptote. Under these circum-stances, the average of the four highest smolt
3 For instance, 27,345 females in 1991 produced 2.1million smolts (Table 5), and about the same number offemales (31,553) three years later produced about 1.3million smolts. The difference of 0.8 million smolts issignificant (P <0.10) and represents the effects ofdensity-independent factors alone.
Figure 5.–Estimated smolt production andestimated abundance of female parents for the1975, 1976, 1979, and 1991–1995 year classes.Intervals on smolt production are approximate 95%confidence intervals.
estimates (1976, 1991, 1992 and 1995), 1.879million smolt with a SE of 0.451 million, is aminimal estimate of the ceiling. The 1975 yearclass smolt estimate was excluded from thiscalculation because it was significantly differentfrom the 1991 estimate (P<0.01).
CONCLUSIONS
Given the measurement error in estimates ofadult abundance, the most defensible estimate forNMSY is a range from 30,000 to 55,000 largespawners, estimated as total escapement, i.e.,from mark-recapture or expanded aerial surveycount. This range was chosen as twice thenumber of females that had produced near or atthe maximum number of smolt, i.e., the fourhighest estimates of smolt production in Figure5. In 1976 an estimated 15,165 large femalesspawned and produced an estimated 1.55 millionsmolts that went to sea in 1978; in 1991 anestimated 27,435 large females spawned andproduced an estimated 2.1 million smolts thatwent to sea in 1993 (Table 5). Given density-independent marine survival, maximizing smoltproduction with a minimal number of spawnerswill result on average in production near toMSY, which is the lower end of the range. Theabove-mentioned range, after accounting for anexpansion factor of 5.20, translates to an index
0.00
0.50
1.00
1.50
2.00
2.50
3.00
3.50
4,59
3
10,9
97
15,1
65
19,7
05
22,9
35
27,4
35
29,9
76
31,5
53
Female Spawners
Smol
t Pro
duct
ion
(mill
ions
)
75
76
79
9592 91
9394

18
survey count goal of approximately 5,800 to10,600 large spawners, summed across fivetributaries—Nahlin, Nakina, Dudidontu, Kowatuaand Tatsamenie rivers.
A point estimate for NMSY of 35,938 can bederived from the range of 30,000 to 55,000 largespawners (age 1.3 and older). Eggers (1993)showed that for sockeye salmon (O. nerka), arange of 80% to 160% of NMSY produces a yieldthat is ≥90% of MSY. If this same relationship istrue for chinook salmon, two estimates of NMSY forthe chinook salmon in the Taku River would be30,000/0.80 = 37,500 and 55,000/1.6 = 34,375.The average of these two estimates would beapproximately 36,000 large spawners.
Parameter Estimates. Estimates of α and β(Ricker's model) for use in the CTC model werealso estimated from smolt data. Smolt productionover year classes with spawning escapementsfrom 30,000 to 55,000 (1976, 1991, 1992, 1995)averaged 1,878,579 smolts (Table 2.5). Thegeometric mean of estimated adult-to-smolt ratiosis 0.0468 (Table 5) making the expectedproduction at NMSY to be 87,982[= (0.047)(1,878,579)] salmon. Given Hilborn'sapproximation (Hilborn 1985), there are twoequations with two unknowns:
)]938,35(exp[)938,35(892,87 βα −= :Ricker'smodel
)ln07.050.0()ln(938,35 αβα −= :Hilborn's
approximation
Solving these equations produces estimates α =4.4055 and β = 0.00001635. The estimate for theexploitation rate associated with NMSY is 0.59(= MSYE ).
Lower levels of spawning abundance wereconsidered too risky when survival in freshwaterhas a significant density-independent component.The 1975 year class began with marginally fewerfemales (an estimated 4,593) than in 1976 andproduced marginally fewer smolt (1.2 million).Both these statistics are precise enough to feelconfident of the reality of low spawningabundance and subsequently good smoltproduction. However, the 1979 year class
produced only 0.7 million smolt from a similarspawning abundance. This difference in smoltproduction of 0.5 million is statistically significant(P<0.01) and represents density-independentfreshwater survival.
The upper end of the NMSY range reflected thehigher levels of spawning abundance where highsmolt production was maintained. Smolt estimatesfor the 1993 and 1994 year classes are lower thanthe higher smolt estimate from the 1991 yearclass. These may or may not be the result ofdensity-independent factors, but they representedno improvement in smolt production beyond thechosen level.
We conclude that the Taku River chinook salmonstock has been rebuilt from low levels ofescapements in the 1970s. Escapements in the1970s averaged an estimated 19,500 largespawners. In contrast, estimated escapements inthe 1990s have averaged 62,750 large spawners, athreefold increase.
DISCUSSION
Stability of environment, at least around averageconditions, is presumed under traditionalstatistical analysis of stock-recruit data; the sameis true under our scientific analysis of auxiliaryinformation about chinook salmon of the TakuRiver. Evidence in our data for such stability isthat:
• Smolt sizes were essentially the same forearly and late year classes in the series;
• Maximum production of smolt is similaracross year classes; and
• There was negligible or no loss of habitatduring our series from land development,land use, or human habitation.
Evidence in our data against such stability ofenvironment can be found in the marine survivalfor the 1991 year class (0.093) which was 58%higher (P<0.01) than the average for year classestwo decades earlier (0.059). However, the 1991year class is an outlier and other year classes fromthe 1990s are not returning at the same rate as the1991 year class, as judged from returns of youngage classes. Hence, we see no evidence that

19
return rates have changed over the two decades inthis data set.
All ongoing scientific investigations improvewith the addition of new information; this will beespecially true for future investigations of thechinook salmon of the Taku River. In the nextseveral years, adults will return for year classesthat began with considerably greater numbers ofspawners than in the past. Better precision infuture adult estimates from mark-recaptureexperiments will clarify analysis of these returns;imprecision in statistics from aerial surveysgreatly hampered the current analysis. Betterprecision in future statistics would improve thedependability of more traditional stock-recruitanalyses. Estimates of smolt abundance,especially for the 1997 year class, may providestrong clues as to how many smolts the TakuRiver can produce. If smolt production from thisexceptionally large number of spawners isconsiderably above the 2.1 million maximumestimated from data available now, the currentestimate of NMSY would have to be increased.Unfortunately, investigating productivity ofchinook salmon is not for the impatient; smoltabundance for the 1997 year class can not beestimated with reasonable accuracy until 2001 or2002.
Alternatively, future stock assessment resultsmay show that we overestimated escapements inearlier years, those without mark-recaptureestimates. The expansion factor of 5.20 mayhave inflated those estimates. The meanexpansion factor is 4.33, excluding 1997. Iffuture investigations show that a lower expansionfactor is more appropriate, those earlier estimatesof escapement will be lowered, along with theescapement goal range.
Managing for the recommended managementrange of 30,000 to 55,000 large spawners may notbe beyond the capability of ADFG and DFO,given refinement of our stock assessment program.We are in the process of developing preseasonforecasts, relying heavily on the data developed inthis manuscript. Inseason monitoring of theescapement needs to be developed. One option isto implement a test fishery in May and early Junenear the international border to provide inseasonestimates of escapement from mark-recapture
methods, similar to existing programs for sockeyeand coho salmon on the Taku River (Kelley andMilligan 1999).
RECOMMENDATIONS
Since this analysis may set the stage for futureconsiderations, we recommend some strategies toimprove a future analysis and improvemanagement.
We believe that preserving long-term stockassessment programs should continue to be oneof the highest priorities for ADFG, DFO, TRTFNand the Pacific Salmon Commission (PSC).These types of programs provide information onthe population dynamics of the resource, whichis often poorly understood due to the lack oflong-term programs. For the Taku River chinookstock we recommend that:
• Enumeration of total spawning abundancefrom mark-recapture studies be continuedannually.
• Aerial surveys be continued annually for anumber of years to refine estimates of thevariability in expansion factors, until suchtime it is determined they are no longerneeded.
• Biological sampling be continued (andimproved in some cases) annually for allfisheries and in the escapement for age, sexand size structure as well as recovery ofCWTs and other tags.
• Chinook smolt be CWTd annually at highrates (35,000 to 50,000).
• ADFG and DFO adopt the range of 30,000to 55,000 large spawners as a biologicalescapement goal, and structure managementto achieve escapements throughout therange.
• Preseason and inseason estimates of run sizeand escapement be developed prior toimplementation of new or directed fisheries.
• An international management plan bedeveloped and adopted by both nationsthrough the Transboundary River TechnicalCommittee of the PSC.

20
• This escapement goal be reviewed in2003/2004, incorporating additional dataavailable at that time.
LITERATURE CITED
ADFG (Alaska Department of Fish and Game). 1981.Proposed management plan for Southeast Alaskachinook salmon runs in 1981. ADF&G, FisheriesManagement Divisions, Regional UnpublishedReport No. 1J81-3, Juneau.
Bernard, D. R., and J. E. Clark. 1996. Estimatingsalmon harvest based on return of coded-wire tags.Canadian Journal of Fisheries and AquaticSciences 53:2323-2332.
Bernard, D. R., S. A. McPherson, K. A. Pahlke and P.Etherton. 2000. Optimal production of chinooksalmon from the Stikine River. Alaska Departmentof Fish and Game, Fishery Manuscript No. 00-1.
Chapman, D.G. 1951. Some properties of thehypergeometric distribution with applications tozoological censuses. University CaliforniaPublication Statistics 1, 131-160.
Cushing, O.H. 1973. Dependent recruitment on parentstock. IFRBC 50:1965-1976.
Draper, N. R. and H. Smith. 1981. Applied regressionanalysis, 2nd ed. John Wiley. New York.
Efron, B. and R. J. Tibshirani. 1993. An introductionto the bootstrap. Chapman and Hall, New York.
Eiler, J., M. M. Masuda, J. Pella, H. R. Carlson, R. F.Bradshaw, and B. D. Nelson. In prep. Stockcomposition, escapement estimate, and timing ofchinook salmon returns in the Taku River, Alaskaand British Columbia.
Hilborn, R. 1985. Simplified calculation of optimumspawning stock size from Ricker’s stockrecruitment curve. Canadian Journal of Fisheriesand Aquatic Sciences 42:1833-4.
Hilborn, R. , and C. J. Walters. 1992. Quantitativefisheries stock assessment: choice, dynamics anduncertainty. Chapman and Hall. New York.
Hubartt, D. J., A. E. Bingham and P. M Suchanek.1999. Harvest estimates for selected marine sportfisheries in Southeast Alaska during 1998. AlaskaDepartment of Fish and Game, Fishery Data SeriesNo. 99-15, Anchorage.
Kelley, M. S., and P. A. Milligan. 1999. Adult mark-recapture studies of Taku River salmon stocks in1997. Alaska Department of Fish and Game,Commercial Fisheries Management and
Development Division, Regional InformationReport No. 1J99-22, Douglas.
Kissner, P. D., Jr. 1976. A study of chinook salmon inSoutheast Alaska. Alaska Department of Fish andGame, Annual Report 1975–1976, Project F-9-8, 17(AFS-41).
Kissner, P. D., Jr. 1982. A study of chinook salmon inSoutheast Alaska. Alaska Department of Fish andGame, Annual Report 1981–1982, Project F-9-14,23 (AFS-41).
Kissner, P. D., Jr., and D. J. Hubartt. 1986. A study ofchinook salmon in Southeast Alaska. AlaskaDepartment of Fish and Game, Annual Report1985-1986, Project F-10-1, 27 (AFS-41).
McPherson, S. A., D. R. Bernard, M. S. Kelley, P. A.Milligan, and P. Timpany. 1996. Spawningabundance of chinook salmon in the Taku River in1995. Alaska Department of Fish and Game,Fishery Data Series No. 96-36, Anchorage.
McPherson, S. A., D. R. Bernard, M. S. Kelley, P. A.Milligan, and P. Timpany. 1997. Spawningabundance of chinook salmon in the Taku River in1996. Alaska Department of Fish and Game,Fishery Data Series No. 97-14, Anchorage.
McPherson, S. A., D. R. Bernard, M. S. Kelley, P. A.Milligan, and P. Timpany. 1998. Spawningabundance of chinook salmon in the Taku River in1997. Alaska Department of Fish and Game,Fishery Data Series No. 98-41, Anchorage.
Moser, J.F. 1898. The salmon and salmon fisheries ofAlaska. U.S. Fisheries Commission, Vol. 18.
Pahlke, K. A. 1998. Escapements of chinook salmonin Southeast Alaska and transboundary rivers in1997. Alaska Department of Fish and Game,Division of Sport Fish, Fishery Data Series No. 98-33, Anchorage.
Pahlke, K. A. and D. R. Bernard. 1996. Abundance ofthe chinook salmon escapement in the Taku River,1989 and 1990. Alaska Department of Fish andGame, Commercial Fisheries Management andDevelopment Division, Alaska Fishery ResearchBulletin 3(1):8–19, Juneau.
Ricker, W. E. 1975. Computation and interpretationof biological statistics of fish populations. Bulletinof the Fisheries Research Board of Canada, No.191. Ottawa.
Seber, G. A. F. 1982. On the estimation of animalabundance and related parameters, second edition.MacMillan and Company, New York.
TTC (Transboundary Technical Committee). 1999.Pacific Salmon Commission Transboundary

21
Technical Committee Report: salmon managementand enhancement plans for the Stikine, Taku, andAlsek Rivers, 1999. Pacific Salmon Commission,TCTR (99)-2, Vancouver, British Columbia.
TTC (Transboundary Technical Committee). 1991.Pacific Salmon Commission TransboundaryTechnical Committee Report: escapement goals forchinook salmon in the Alsek, Taku and Stikinerivers. Pacific Salmon Commission, TCTR (91)-4,Vancouver, British Columbia.

22
Appendix A:Estimates of Relative Age-Sex Composition of Spawning Chinook Salmon
Relative age-sex composition of spawners wasestimated from information gathered at a carcassweir on the Nakina River (1973-1997) and witha combination of carcass surveys, carcass weirs,and live weirs on the Nahlin, Kowatua, andTatsamenie rivers. Mark-recapture experimentson the Taku River (Pahlke and Bernard 1996;McPherson et al. 1996; 1997, 1998) indicatedthat samples taken from the latter set of threerivers were representative, while samples takenat the carcass weir on the Nakina River wereskewed to males and larger females in mostyears. Since a complete record is available onlyfor the Nakina River, estimates of relative age-sex composition for that population wereadjusted with information from the othertributaries to complete a set of estimates for1973 – 1997.
The adjustment is based on the assumption thatpopulations in all tributaries have the samerelative age-sex composition. Comparison ofstatistics shows strong and weak year classes arerepeated across tributaries (see Pahlke andBernard 1996: Figure 4), and trends in countsare correlated across populations (Table 1). Ifthese populations have the same relative age-sexcompositions:
MM
NN aa
a ==θ
where M is the number of spawners in NakinaRiver, Ma is the subset of that population in age-sex group a, and N and Na are the correspondingnumbers for the other populations. If ρa is theprobability of sampling a fish in group a on theNakina River, the expected number of chinooksalmon of that group in a randomly drawnsample from the Nakina River is:
aaa Mm ρ=][E
Similar equations exist for all age-sex groups.Because aa MM θ= , bb MM θ= , etc:
aaa Mm ρθ=][E
bbb Mm ρθ=][E
and so forth. If the equation for group a is dividedinto the equation for group b and rearranged:
][E][E
ab
ba
a
bmm
θθ
ρρ
=
If ρa is arbitrarily set to 1 and estimates pluggedinto the equation above:
ab
bab m
mwθθˆˆ
ˆ =
where bw is the estimate of ρb relative to ρa.Weighted estimates for other groups can becalculated in the same way. Since estimates ofrelative age-sex composition are a function of therelative magnitudes of the probabilities of capture,scaling all probabilities to that for a single grouphas no effect on the estimates.
Solutions to {w} were calculated for years withmark-recapture experiments (1989, 1990, 1995-1997), then elements averaged across years toproduce expansion factors (Table A.1). Relativeage-sex composition for all chinook salmon age-1.2 through -1.4 were estimated from pooledsamples drawn from Nahlin, Tatsamenie, andKowatua rivers:
t
tata n
n ,,
ˆ =θ
where nt is the pooled number of samples, na,t thenumber of those samples from age-sex group a, andt is the year of sampling. The few sampled fish thatwere age-2. were considered inconsequential andwere lumped with those age-1. Because samplingage-1.1 jacks was problematical over the years,these fish were ignored as an age-sex group. So fewage-1.2 females were found (<0.01%) that these

23
fish were also ignored. Samples for age-1.5chinook salmon of both sexes were not adjustedbecause their representation in samples was solow (≤2%). The remaining five age-sex groupsin the adjustment are age-1.3 females(considered group a), -1.4 females, -1.2 males, -1.3 males, and -1.4 males.
Table A.2 contains the adjusted estimates forrelative age-sex composition for chinook salmonspawning in the Taku River from 1973-1997.For years with mark-recapture experiments,estimates of relative age-sex composition forspawners in the river were calculated directlyfrom samples taken at on the Nahlin, Kowatua,and Tatsamenie rivers. In other years, estimateswere calculated as adjustments of statisticsbased on samples from the Nakina River:
K+++= −− 11
ˆccbba
aa wmwmm
mθ
K+++= −−
−
11
1ˆ
ccbba
bbb wmwmm
wmθ
and so forth. Estimated variances for }ˆ{ tθθθθ inyear t were obtained through simulation (TableA.3). During the kth iteration of a simulation,two vectors of new sample sizes {ni′′′′}k and{mt′′′′}k were generated from the probabilitydistributions multinom(ni, }ˆ{ iθθθθ ) and
multinom(mt, }ˆ{ tφφφφ ) where i represents one of theyears with mark-recapture experiments drawn atrandom with replacement. Elements of thevector }ˆ{ tφφφφ are estimates of relative age-sexcomposition from the sampling program on theNakina River in year t:
K+++=
tctbta
tata mmm
m
,,,
,,φ
and so forth. A new set of weights werecalculated for each vector of simulated samplesizes:
)(,)(,
)(,)(,)(, ˆ
ˆˆ
ktakib
ktbkiaktb m
mw
′′
′′=′
θ
θ
and so forth for the other groups. Simulatedestimates of relative age-sex composition were thencalculated as:
K+′′+′′+′
′=′
−− 1)(,)(,
1)(,)(,)(,
)(,)(, ˆˆ
ˆktcktcktbktbkta
ktakta wmwmm
mθ
K+′′+′′+′
′′=′
−−
−
1)(,)(
1)(,)(,)(,
1)(,)(,
)(, ˆˆ
ˆˆktckcktbktbka
ktbktbktb wmwmm
wmθ
and so forth. Variance for each element in }ˆ{ tθθθθ wasapproximated as follows:
1)ˆ(
)ˆ( 12
,)(,, −
′−′≅
∑ =
Kv
Kk takta
taθθ
θ
1)ˆ(
)ˆ( 12
.)(., −
′−′≅
∑ =
Kv
Kk tbktb
tbθθ
θ
and so forth with K (=100) the number of iterations.The process was repeated for the next year. Thesecalculations of estimated variance represent boththe measurement (sampling error) at the carcassweir on the Nakina River, the measurement errorfrom sampling on the Nahlin, Kowatua, andTatsamenie rivers during mark-recaptureexperiments, and the process error (interannualvariation) among the {wt}.
Simulation also provided a means of estimating thestatistical bias in the procedures used to estimate{θθθθ} (Table A.4). Relative statistical bias wasestimated by subtracting estimates of ta,θ from themean ta,θ ′ of simulated values )(,
ˆktaθ ′ and dividing
the difference by ta,θ (from Efron and Tibshirani1993:124-6).

24
Table A1.—Solutions to {w} for years with mark-recapture experiments.
Sex Age 1989 1990 1995 1996 1997 Average
Females 1.3 1.000 1.000 1.000 1.000 1.000 1.000Females 1.4 1.835 5.289 2.629 2.032 1.649 2.687Males 1.2 1.784 2.031 4.056 3.716 1.303 2.578Males 1.3 0.999 2.507 2.839 1.896 1.585 1.965Males 1.4 1.647 5.525 5.799 3.082 2.726 3.756
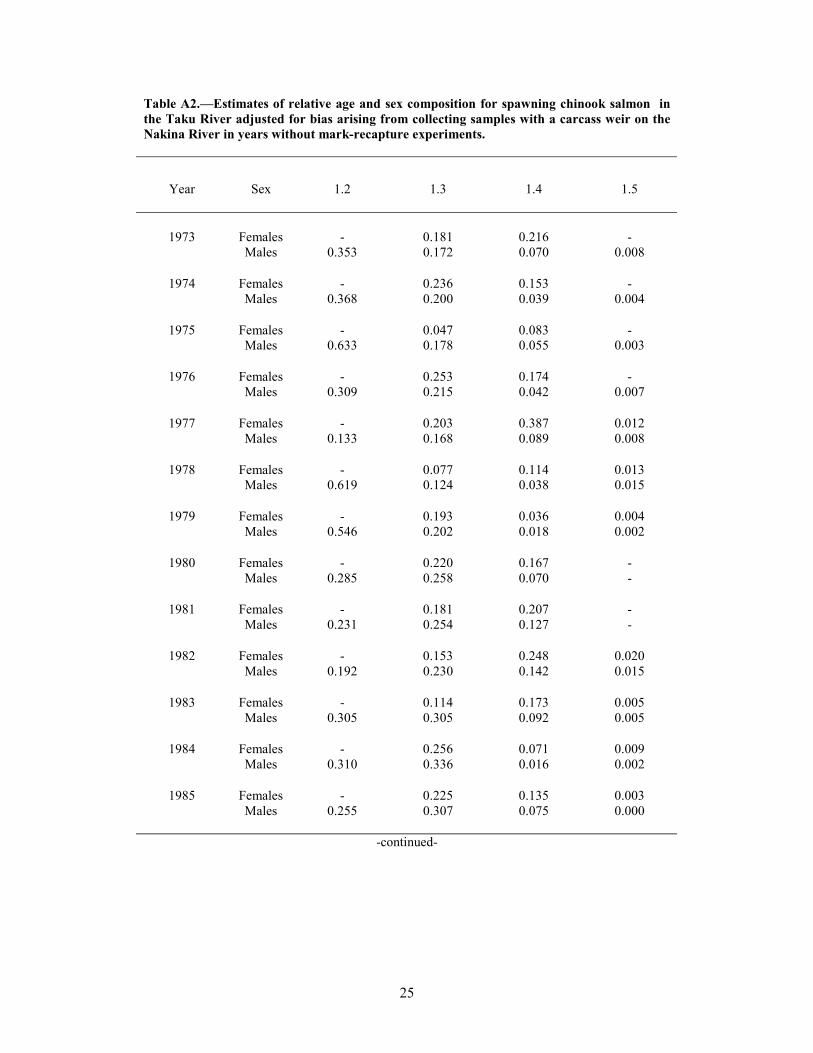
25
Table A2.—Estimates of relative age and sex composition for spawning chinook salmon inthe Taku River adjusted for bias arising from collecting samples with a carcass weir on theNakina River in years without mark-recapture experiments.
Year Sex 1.2 1.3 1.4 1.5
1973 Females - 0.181 0.216 -Males 0.353 0.172 0.070 0.008
1974 Females - 0.236 0.153 -Males 0.368 0.200 0.039 0.004
1975 Females - 0.047 0.083 -Males 0.633 0.178 0.055 0.003
1976 Females - 0.253 0.174 -Males 0.309 0.215 0.042 0.007
1977 Females - 0.203 0.387 0.012Males 0.133 0.168 0.089 0.008
1978 Females - 0.077 0.114 0.013Males 0.619 0.124 0.038 0.015
1979 Females - 0.193 0.036 0.004Males 0.546 0.202 0.018 0.002
1980 Females - 0.220 0.167 -Males 0.285 0.258 0.070 -
1981 Females - 0.181 0.207 -Males 0.231 0.254 0.127 -
1982 Females - 0.153 0.248 0.020Males 0.192 0.230 0.142 0.015
1983 Females - 0.114 0.173 0.005Males 0.305 0.305 0.092 0.005
1984 Females - 0.256 0.071 0.009Males 0.310 0.336 0.016 0.002
1985 Females - 0.225 0.135 0.003Males 0.255 0.307 0.075 0.000
-continued-

26
Table A2.—Page 2 of 2.
Year Sex 1.2 1.3 1.4 1.5
1986 Females - 0.185 0.277 0.011Males 0.169 0.235 0.118 0.005
1987 Females - 0.185 0.146 0.016Males 0.204 0.361 0.083 0.005
1988 Females - 0.065 0.275 0.020Males 0.271 0.166 0.184 0.020
1991 Females - 0.126 0.216 0.041Males 0.284 0.207 0.105 0.022
1992 Females - 0.091 0.210 0.012Males 0.240 0.336 0.099 0.012
1993 Females - 0.126 0.251 0.013Males 0.141 0.321 0.138 0.010
1994 Females - 0.338 0.229 0.022Males 0.097 0.201 0.098 0.015

27
Table A3.—Simulated SEs for estimates of relative age and sex composition for spawningchinook salmon in the Taku River adjusted for bias arising from collecting samples with acarcass weir on the Nakina River in years without mark-recapture experiments.
Year Sex 1.2 1.3 1.4 1.5
1973 Females - 0.056 0.060 -Males 0.098 0.042 0.024 0.002
1974 Females 0.000 0.063 0.053 -Males 0.099 0.047 0.013 0.001
1975 Females - 0.020 0.035 -Males 0.098 0.051 0.023 0.001
1976 Females - 0.061 0.053 -Males 0.091 0.046 0.015 0.002
1977 Females - 0.067 0.094 0.004Males 0.057 0.040 0.029 0.003
1978 Females - 0.027 0.047 0.004Males 0.099 0.036 0.018 0.005
1979 Females - 0.063 0.015 0.001Males 0.099 0.053 0.008 0.001
1980 Females - 0.075 0.046 -Males 0.082 0.054 0.026 -
1981 Females - 0.055 0.056 -Males 0.077 0.050 0.038 -
1982 Females - 0.048 0.065 0.006Males 0.072 0.039 0.043 0.004
1983 Females - 0.041 0.054 0.002Males 0.091 0.057 0.030 0.002
1984 Females - 0.079 0.025 0.003Males 0.082 0.075 0.006 0.001
1985 Females - 0.066 0.042 0.001Males 0.080 0.055 0.025 0.000
-continued-

28
Table A3.—Page 2 of 2.
Year Sex 1.2 1.3 1.4 1.5
1986 Females - 0.063 0.072 0.004Males 0.063 0.045 0.038 0.001
1987 Females - 0.059 0.046 0.005Males 0.073 0.064 0.026 0.002
1988 Females - 0.029 0.077 0.007Males 0.092 0.033 0.048 0.007
1991 Females - 0.041 0.059 0.012Males 0.091 0.040 0.028 0.007
1992 Females - 0.033 0.060 0.004Males 0.085 0.055 0.031 0.004
1993 Females - 0.046 0.073 0.004Males 0.057 0.051 0.039 0.003
1994 Females - 0.083 0.062 0.005Males 0.039 0.049 0.031 0.004
Table A4.—Estimated relative statistical bias in }ˆ{θθθθ by age-sex groups of spawning chinooksalmon across years without mark-recapture experiments.
Female1.3
Female1.4
Female1.5
Male1.2
Male1.3
Male1.4
Male1.5
Average -4% 6% -2% 2% -1% 4% -4%Minimum -10% -1% -8% -3% -6% -7% -10%Maximum 7% 12% 7% 13% 1% 11% 7%

29
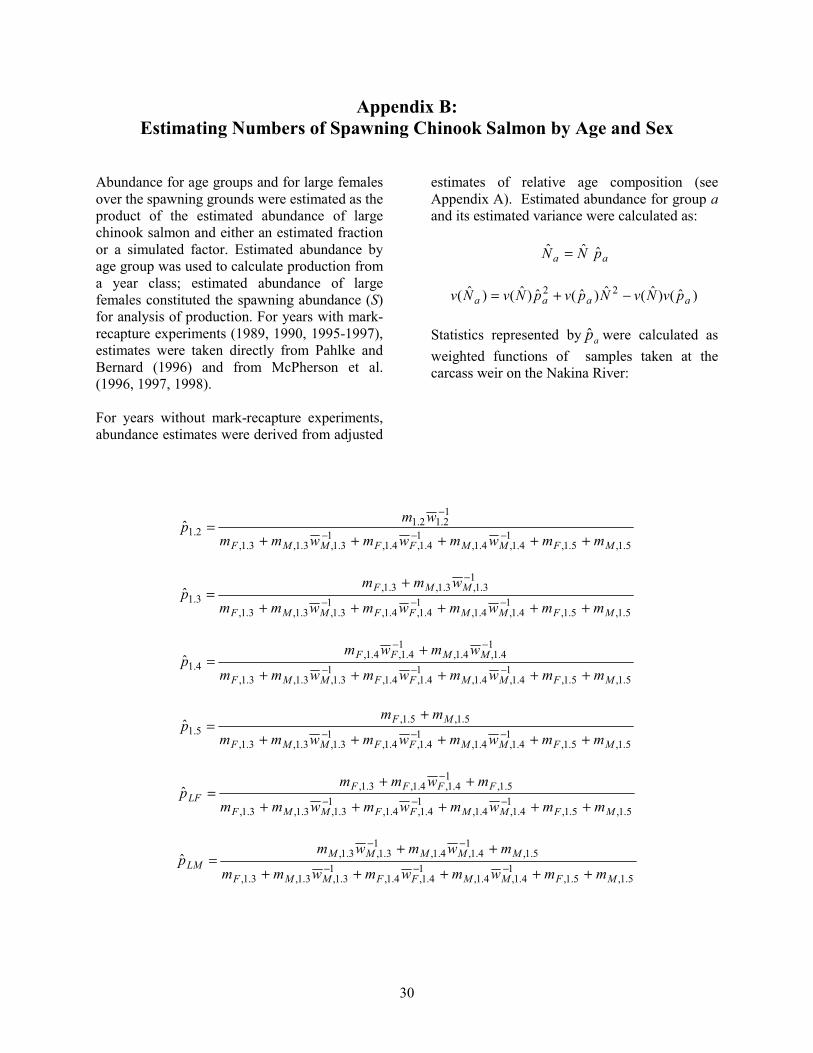
30
Appendix B:Estimating Numbers of Spawning Chinook Salmon by Age and Sex
Abundance for age groups and for large femalesover the spawning grounds were estimated as theproduct of the estimated abundance of largechinook salmon and either an estimated fractionor a simulated factor. Estimated abundance byage group was used to calculate production froma year class; estimated abundance of largefemales constituted the spawning abundance (S)for analysis of production. For years with mark-recapture experiments (1989, 1990, 1995-1997),estimates were taken directly from Pahlke andBernard (1996) and from McPherson et al.(1996, 1997, 1998).
For years without mark-recapture experiments,abundance estimates were derived from adjusted
estimates of relative age composition (seeAppendix A). Estimated abundance for group aand its estimated variance were calculated as:
aa pNN ˆˆˆ =
)ˆ()ˆ(ˆ)ˆ(ˆ)ˆ()ˆ( 22aaaa pvNvNpvpNvNv −+=
Statistics represented by ap were calculated asweighted functions of samples taken at thecarcass weir on the Nakina River:
5.1,5.1,1
4.1,4.1,1
4.1,4.1,1
3.1,3.1,3.1,
12.12.1
2.1ˆMFMMFFMMF mmwmwmwmm
wmp
+++++=
−−−
−
5.1,5.1,1
4.1,4.1,1
4.1,4.1,1
3.1,3.1,3.1,
13.1,3.1,3.1,
3.1ˆMFMMFFMMF
MMF
mmwmwmwmm
wmmp
+++++
+=
−−−
−
5.1,5.1,1
4.1,4.1,1
4.1,4.1,1
3.1,3.1,3.1,
14.1,4.1,
14.1,4.1,
4.1ˆMFMMFFMMF
MMFF
mmwmwmwmm
wmwmp
+++++
+=
−−−
−−
5.1,5.1,1
4.1,4.1,1
4.1,4.1,1
3.1,3.1,3.1,
5.1,5.1,5.1ˆ
MFMMFFMMF
MF
mmwmwmwmm
mmp
+++++
+=
−−−
5.1,5.1,1
4.1,4.1,1
4.1,4.1,1
3.1,3.1,3.1,
5.1,1
4.1,4.1,3.1,ˆMFMMFFMMF
FFFFLF
mmwmwmwmm
mwmmp
+++++
++=
−−−
−
5.1,5.1,1
4.1,4.1,1
4.1,4.1,1
3.1,3.1,3.1,
5.1,1
4.1,4.1,1
3.1,3.1,ˆMFMMFFMMF
MMMMMLM
mmwmwmwmm
mwmwmp
+++++
++=
−−−
−−

31
where ma is the number in the sample belongingto group a, F denotes female, M male, LF largefemales, LM large males, and the w are weights(see Appendix A). All age-1.2 fish areconsidered male. Note that because abundanceestimated through mark-recapture experimentsand aerial surveys is only for large fish(considered age-1.3 fish and older), 0 ≤ 3.1p ≤ 1,0 ≤ 4.1p ≤ 1, 0≤ 5.1p ≤ 1, and 0 ≤ LFp ≤ 1, while0≤ 1.1p and 0≤ 2.1p . Estimated variances werecalculations during simulations described inAppendix A. Simulation also provided a meansof estimating the statistical bias in the
procedures used to estimate the multipliers(Table B.1). Relative statistical bias wasestimated by subtracting estimates tap ,ˆ from themean tap ,′ of simulated values )(,ˆ ktap′ anddividing the difference by tap ,ˆ (from Efron andTibshirani 1993:124-6). Table B.2 containsestimated multipliers and estimates of their SEs.Estimated abundance by age and gender, the
aN , are in Table 4 in the text. Table B.3contains the SEs for the aN .
Table B1.–Estimated relative statistical bias in }ˆ{p by age and large (≥≥≥≥660 mm MEF)female and male spawning chinook salmon across years without mark-recapture experiments.
1.2 1.3 1.4 1.5Large
FemalesLargeMales
Average 9% -2% 5% -3% 0% 0%Minimum 2% -5% 0% -9% -3% -5%Maximum 21% 0% 9% 5% 4% 4%

32
Table B2.—Simulated multipliers used to calculate numbers of spawning chinook salmon in the TakuRiver by age and numbers of large (≥≥≥≥660 mm MEF) females from estimated abundance of large spawningchinook salmon of both sexes for years without mark-recapture experiments.
Year 1.2 1.3 1.4 1.5Large
femalesLargemales
1973 ap 0.587 0.547 0.441 0.012 0.613 0.387SE 0.276 0.072 0.075 0.003 0.079 0.079
1974 ap 0.627 0.692 0.301 0.007 0.613 0.387SE 0.286 0.070 0.071 0.002 0.076 0.076
1975 ap 1.941 0.619 0.372 0.009 0.356 0.644SE 0.847 0.071 0.072 0.003 0.073 0.073
1976 ap 0.475 0.680 0.310 0.010 0.617 0.383SE 0.206 0.066 0.068 0.002 0.069 0.069
1977 ap 0.159 0.431 0.546 0.023 0.694 0.306SE 0.081 0.088 0.095 0.008 0.070 0.070
1978 ap 1.840 0.535 0.389 0.076 0.534 0.466SE 0.873 0.066 0.082 0.023 0.075 0.075
1979 ap 1.324 0.869 0.117 0.014 0.509 0.491SE 0.591 0.030 0.032 0.003 0.092 0.092
1980 ap 0.419 0.670 0.330 0.000 0.541 0.459SE 0.173 0.069 0.069 0.000 0.087 0.087
1981 ap 0.315 0.568 0.432 0.000 0.505 0.495SE 0.140 0.070 0.070 0.000 0.081 0.081
1982 ap 0.249 0.478 0.479 0.043 0.520 0.480SE 0.118 0.065 0.075 0.013 0.074 0.074
1983 ap 0.467 0.606 0.378 0.016 0.421 0.579SE 0.222 0.061 0.064 0.005 0.083 0.083
1984 ap 0.473 0.859 0.125 0.017 0.486 0.514SE 0.192 0.033 0.035 0.004 0.101 0.101
1985 ap 0.360 0.716 0.280 0.004 0.486 0.514SE 0.157 0.057 0.058 0.001 0.082 0.082
-continued-

33
Table B2.—Page 2 of 2.
Year 1.2 1.3 1.4 1.5Large
femalesLargemales
1986 ap 0.211 0.508 0.473 0.019 0.569 0.431SE 0.097 0.074 0.078 0.006 0.083 0.083
1987 ap 0.267 0.686 0.287 0.027 0.436 0.564SE 0.122 0.056 0.059 0.008 0.083 0.083
1988 ap 0.395 0.320 0.624 0.056 0.491 0.509SE 0.194 0.058 0.072 0.022 0.080 0.080
1991 ap 0.420 0.466 0.446 0.088 0.531 0.469SE 0.196 0.054 0.072 0.027 0.067 0.067
1992 ap 0.334 0.564 0.404 0.032 0.410 0.590SE 0.164 0.061 0.066 0.012 0.073 0.073
1993 ap 0.170 0.523 0.450 0.027 0.453 0.547SE 0.082 0.069 0.074 0.009 0.081 0.081
1994 ap 0.109 0.597 0.362 0.041 0.652 0.348SE 0.050 0.065 0.074 0.010 0.079 0.079

34
Table B3.—Estimated SEs for estimated numbers aN of chinook salmon by age and by large (≥≥≥≥660mm MEF) females and males spawning in the Taku River from 1973 through 1997. Bold numbers camedirectly from mark-recapture experiments.
1.2 1.3 1.4 1.5Large
FemalesLargeMales
1973 5,577 3,458 2,884 87 3,864 2,6211974 6,435 4,701 2,332 53 4,236 2,8591975 15,670 3,424 2,209 68 2,139 3,560
1976 7,267 7,074 3,610 118 6,478 4,2711977 3,203 5,917 7,256 389 8,678 4,3221978 20,686 3,946 3,119 690 3,997 3,5551979 18,120 7,732 1,276 140 4,991 4,8521980 9,947 11,160 6,061 - 9,450 8,253
1981 9,846 12,117 9,540 - 11,144 10,9611982 3,901 4,958 5,066 543 5,426 5,0661983 3,003 2,518 1,660 86 1,903 2,4851984 5,889 7,348 1,318 174 4,720 4,9361985 8,083 10,772 4,696 67 7,820 8,205
1986 5,175 8,495 8,055 404 9,523 7,5381987 4,945 8,320 3,870 406 5,778 7,1741988 11,808 6,471 11,905 1,467 9,742 10,0431989 1,589 3,819 1,770 294 4,827 4,1911990 1,338 3,779 5,434 264 5,831 3,218
1991 14,085 10,328 10,244 2,385 11,842 10,5961992 12,515 13,421 10,069 1,050 10,391 14,2131993 7,438 15,006 13,300 964 13,573 15,8991994 3,400 12,321 8,135 970 13,565 8,0201995 3,848 1,952 2,600 174 2,633 2,295
1996 1,097 7,692 1,287 84 4,781 4,5881997 639 6,600 11,120 - 11,080 7,032

35

36
Appendix C:Estimates of Age Composition of Harvested Chinook Salmon
Four age groups are represented in the agecomposition of harvests in commercial andrecreational fisheries: age-1.2, -1.3, -1.4, and -1.5 chinook salmon. The few sampled fish thatwere determined to have freshwater age 2. wereconsidered anomalous and were lumped withthose with age 1. Virtually no age-1.1 jackshave been harvested in these fisheries.
Marine Harvest
We estimated harvest by age of Taku-boundchinook salmon in the marine gillnet fisheryduring its first three or four weeks when thesefish are still moving through the fishery. Thefishery starts on the third Sunday in June(Appendix D) and judging from informationfrom Canyon Island, almost all of the Taku-bound chinook salmon have past through thefishery by July 9. Harvest by age and itsestimated variance were estimated as:
tatta pHH ,, ˆˆ =
)ˆ()ˆ( ,2
, tatta pvHHv =
where Ht is harvest in year t and pa,t the fractionof the harvest comprised of age group a thatyear. Harvests are reported on fish tickets andare considered known without error. Relativeage composition in years when this fishery wasnot sampled (1977-1981 and 1993-1994) werepredicted from adjusting estimates fromspawners (Appendix Table A.2) with regressionson data from other years.
Regressions to predict missing data were dual innature. Samples were first split into two groups:age-1.4 fish in one group and age-1.2 and -1.3fish in the other (samples of fish age 1.1 and 1.5were ignored). Fractions of samples representedby both groups were normalized, then thefraction of age-1.4 fish in samples from thefishery regressed against the normalized fractionfor spawners. Estimated variance for predictions
were estimated with eq. 1.4.11 in Draper andSmith (1981:30). The fraction predicted for theage-1.2/-1.3 group was the complement of theprediction for the age-1.4 fish; the estimatedvariance for both groups is the same. The secondstep involved splitting the age-1.2 and age-1.3into two groups by normalizing their fractionsagainst the prediction for both age groupscombined. Fractions of samples represented inboth groups were normalized, then fraction ofage-1.3 fish in samples from the fishery wereregressed against the normalized fraction forspawners. The predicted fraction for the age-1.2fish was the complement of the fractionpredicted for the age-1.3 fish. Variances ofpredictions were estimated as described before.
Harvests of Taku-bound chinook salmon in thecommercial troll fishery in Southeast Alaskawere estimated from CWT recoveries as perBernard and Clark (1996). Some brood yearswere not tagged (1973-1974 and 1982-1990).Estimates were made for the 1973 and 1974broods. No estimates were made for the 1982-1990 broods, but in consideration of the majorreductions in the spring troll fishery in SoutheastAlaska in the years those fish returned, lack ofestimates are considered to have a negligibleeffect in the analysis.
Estimated age composition of Taku-boundchinook salmon harvested by the recreationalfishery in the Juneau area was calculated as theproduct of the estimated spring harvest and theestimated or predicted relative age compositionof the catch. This spring fishery runs fromApril through late June and covers the bulk ofthe Taku-bound migration. Age-0. fish andcontributions of other stocks, estimated fromcoded-wire tag (CWT) recoveries, were firstsubtracted from estimated harvest Relative agecomposition in years when this fishery was notsampled for age data (1977-1982) was predictedby adjusting estimates from spawners withregressions on data from 1983-1997 when boththe recreational fishery and escapements were
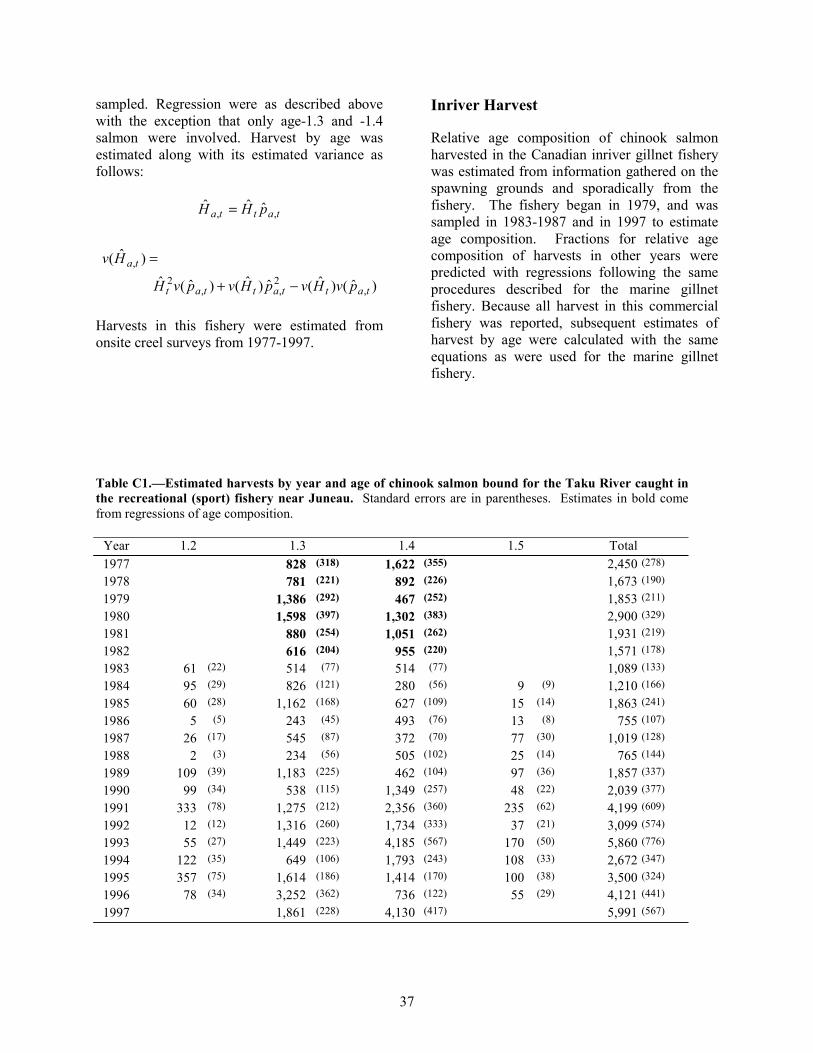
37
sampled. Regression were as described abovewith the exception that only age-1.3 and -1.4salmon were involved. Harvest by age wasestimated along with its estimated variance asfollows:
tatta pHH ,, ˆˆˆ =
)ˆ()ˆ(ˆ)ˆ()ˆ(ˆ)ˆ(
,2,,
2,
tattattat
ta
pvHvpHvpvH
Hv
−+
=
Harvests in this fishery were estimated fromonsite creel surveys from 1977-1997.
Inriver Harvest
Relative age composition of chinook salmonharvested in the Canadian inriver gillnet fisherywas estimated from information gathered on thespawning grounds and sporadically from thefishery. The fishery began in 1979, and wassampled in 1983-1987 and in 1997 to estimateage composition. Fractions for relative agecomposition of harvests in other years werepredicted with regressions following the sameprocedures described for the marine gillnetfishery. Because all harvest in this commercialfishery was reported, subsequent estimates ofharvest by age were calculated with the sameequations as were used for the marine gillnetfishery.
Table C1.—Estimated harvests by year and age of chinook salmon bound for the Taku River caught inthe recreational (sport) fishery near Juneau. Standard errors are in parentheses. Estimates in bold comefrom regressions of age composition.
Year 1.2 1.3 1.4 1.5 Total1977 828 (318) 1,622 (355) 2,450 (278)
1978 781 (221) 892 (226) 1,673 (190)
1979 1,386 (292) 467 (252) 1,853 (211)
1980 1,598 (397) 1,302 (383) 2,900 (329)
1981 880 (254) 1,051 (262) 1,931 (219)
1982 616 (204) 955 (220) 1,571 (178)
1983 61 (22) 514 (77) 514 (77) 1,089 (133)
1984 95 (29) 826 (121) 280 (56) 9 (9) 1,210 (166)
1985 60 (28) 1,162 (168) 627 (109) 15 (14) 1,863 (241)
1986 5 (5) 243 (45) 493 (76) 13 (8) 755 (107)
1987 26 (17) 545 (87) 372 (70) 77 (30) 1,019 (128)
1988 2 (3) 234 (56) 505 (102) 25 (14) 765 (144)
1989 109 (39) 1,183 (225) 462 (104) 97 (36) 1,857 (337)
1990 99 (34) 538 (115) 1,349 (257) 48 (22) 2,039 (377)
1991 333 (78) 1,275 (212) 2,356 (360) 235 (62) 4,199 (609)
1992 12 (12) 1,316 (260) 1,734 (333) 37 (21) 3,099 (574)
1993 55 (27) 1,449 (223) 4,185 (567) 170 (50) 5,860 (776)
1994 122 (35) 649 (106) 1,793 (243) 108 (33) 2,672 (347)
1995 357 (75) 1,614 (186) 1,414 (170) 100 (38) 3,500 (324)
1996 78 (34) 3,252 (362) 736 (122) 55 (29) 4,121 (441)
1997 1,861 (228) 4,130 (417) 5,991 (567)

38
Table C2.—Estimated harvests by year and age of chinook salmon bound for the Taku River caught inthe commercial gillnet fishery in Taku Inlet. Standard errors are in parenthesis. Estimates in bold comefrom regressions of age composition.
Year 1.2 1.3 1.4 1.5 Total1973 239 (118) 1,255 (254) 6,634 (291) 299 (132) 8,427 (0)
1974 35 (35) 637 (132) 1,842 (140) 106 (61) 2,620 (0)
1975 69 (49) 1,039 (136) 970 (136) 35 (35) 2,113 (0)
1976 834 (201) 500 (201) 209 (128) 1,543 (0)
1977 183 (90) 277 (90) 227 (58) 686 (0)
1978 1,403 (278) 0 (278) 128 (131) 1,531 (0)
1979 2,675 (478) 204 (478) 55 (266) 2,934 (0)
1980 771 (199) 544 (199) 233 (127) 1,549 (0)
1981 476 (146) 419 (146) 253 (93) 1,148 (0)
1982 923 (53) 479 (47) 347 (42) 12 (9) 1,809 (0)
1983 304 (19) 50 (13) 50 (13) 429 (0)
1984 431 (41) 382 (41) 49 (19) 890 (0)
1985 717 (58) 588 (57) 226 (41) 1,539 (0)
1986 501 (106) 563 (109) 501 (106) 1,596 (0)
1987 458 (58) 423 (58) 141 (40) 23 (17) 1,057 (0)
1988 407 (64) 174 (52) 232 (58) 833 (0)
1989 379 (45) 823 (51) 243 (39) 21 (12) 1,466 (0)
1990 946 (252) 946 (252) 568 (218) 2,459 (0)
1991 925 (124) 797 (120) 797 (120) 77 (44) 2,596 (0)
1992 368 (44) 702 (50) 361 (44) 1,430 (0)
1993 1,254 (583) 2,035 (583) 1,200 (368) 4,489 (0)
1994 622 (394) 1,661 (394) 672 (240) 2,955 (0)
1995 2,652 (145) 501 (118) 295 (94) 59 (43) 3,506 (0)
1996 263 (40) 1,860 (53) 250 (39) 20 (12) 2,393 (0)
1997 137 (29) 920 (62) 1,349 (63) 2,406 (0)

39
Table C3.—Estimated harvests by year and age of chinook salmon bound for the Taku River caughtin the gillnet fishery in Canada in the Taku River. Standard errors are in parentheses.
Year 1.2 1.3 1.4 1.5 Total1979 97 (24) 97 (0)
1980 120 (34) 63 (34) 42 (16) 225 (0)
1981 67 (23) 44 (23) 49 (11) 159 (0)
1982 19 (8) 14 (8) 21 (4) 54 (0)
1983 360 (20) 74 (14) 78 (14) 556 (0)
1984 273 (43) 212 (43) 15 (15) 515 (0)
1985 233 (33) 102 (32) 15 (14) 350 (0)
1986 54 (19) 135 (26) 153 (27) 9 (9) 352 (0)
1987 21 (21) 64 (32) 127 (36) 21 (21) 233 (0)
1988 389 (110) 0 (110) 352 (54) 741 (0)
1989 379 (147) 446 (147) 209 (73) 1,034 (0)
1990 247 (208) 391 (208) 749 (106) 1,386 (0)
1991 924 (246) 181 (246) 504 (111) 1,609 (0)
1992 723 (229) 418 (229) 451 (110) 1,592 (0)
1993 415 (261) 684 (261) 692 (125) 1,790 (0)
1994 315 (354) 1,253 (354) 732 (159) 2,300 (0)
1995 1,356 (378) 0 (378) 519 (130) 1,875 (0)
1996 386 (545) 2,957 (545) 131 (277) 3,475 (0)
1997 104 (41) 921 (101) 1,790 (104) 2,816 (0)
Table C4.—Estimated harvests by year and age of chinook salmon bound for the Taku River caughtin the commercial troll fishery in Southeast Alaska. Standard errors are in parentheses.
Year 1.2 1.3 1.4 1.5 Total1978 1,038 1,038 (NE)
1979 525 (525) 3,812 1,038 5,375 (NE)
1980 1,540 (920) 3,812 5,352 (NE)
1981 3,587 (1,882) 1,689 (988) 5,276 (2,126)
1982 552 (393) 2,157 (943) 2,709 (1,022)
1983 419 (316) 419 (316)
1984 2,754 (916) 2,754 (916)
1985 749 (401) 749 (401)
19861987 399 (399) 399 (399)
1996 1,605 (895) 1,605 (895)
1997 1,479 (1,045) 1,479 (1,045)

40
Appendix D:Summary of Regulations in Southeast Alaska for Recreational, Commercial
Gillnet and Commercial Troll Fisheries, which Pertain to the Marine Harvestof Taku-bound Chinook Salmon
Table D1.—Southeast Alaska (SEAK) chinook salmon harvest levels, Alaska hatchery contributions toSEAK harvests, and harvest management targets, 1965-1997 in thousands of chinook salmon a.
YearCommercial
harvestSport
harvest
Total allgear SEAK
harvest
Alaskahatchery
contribution
SEAK harvestminus AKhatchery
contributionHarvesttarget
1965 337 13 350 0 350 none1966 308 13 321 0 321 none1967 301 13 314 0 314 none1968 331 14 345 0 345 none1969 314 14 328 0 328 none1970 323 14 337 0 337 none1971 334 15 349 0 349 none1972 286 15 301 0 301 none1973 344 16 360 0 360 none1974 346 17 363 0 363 none1975 300 17 317 0 317 none1976 241 17 258 0 258 none1977 285 17 302 0 302 none1978 400 17 417 0 417 none1979 366 17 383 0 383 none1980 324 20 344 7 337 286-320b
1981 268 21 289 2 287 243-286b
1982 290 26 316 1 315 243-286b
1983 289 22 311 2 309 243-272b
1984 268 22 290 5 285 243-272b
1985 251 25 276 14 262 263c
1986 260 23 283 18 265 254c
1987 258 24 282 24 258 263c
1988 252 26 278 30 248 263c
1989 260 31 291 34 257 263c
1990 315 51 366 62 304 302c
1991 296 60 356 70 286 273c
1992 215 43 258 45 213 263c
1993 254 49 303 39 264 263d
1994 221 42 263 38 225 240d
1995 186 50 236 66 170 230d
1996 178 42 220 75 145 140-155d
1997 271 68 340 55 285 302d
a Data Sources: commercial harvests, Alaska hatchery contributions, and harvest targets: Dave Gaudet, personalcommunication; sport harvests taken from 1977-1996 statewide harvest surveys, 1997 sport harvest is a projection.
b Guideline harvest levels established by Alaska Board of Fisheries and North Pacific Fisheries ManagementCouncil; ranges included allowances for Alaska Hatchery chinook salmon and were applicable to commercialfisheries only.
c Ceilings established by the U.S.-Canada Pacific Salmon Treaty, SEAK ceilings applied to all gear harvests minusAlaska hatchery add-on.
d Ceilings imposed on SEAK fishery through NMFS Section 7 ESA consultations; ceilings applied to all gearharvests minus Alaska hatchery add-on, similar to previous ceilings established through Pacific Salmon Treaty.
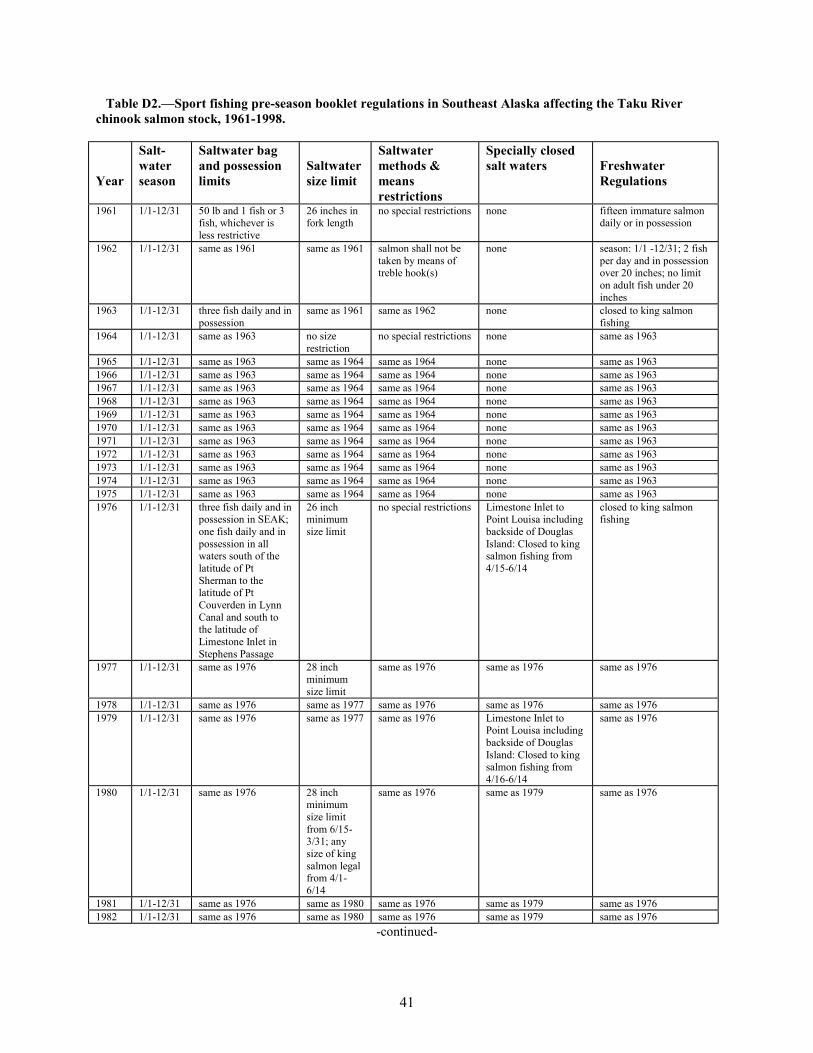
41
Table D2.—Sport fishing pre-season booklet regulations in Southeast Alaska affecting the Taku Riverchinook salmon stock, 1961-1998.
Year
Salt-waterseason
Saltwater bagand possessionlimits
Saltwatersize limit
Saltwatermethods &meansrestrictions
Specially closedsalt waters Freshwater
Regulations
1961 1/1-12/31 50 lb and 1 fish or 3fish, whichever isless restrictive
26 inches infork length
no special restrictions none fifteen immature salmondaily or in possession
1962 1/1-12/31 same as 1961 same as 1961 salmon shall not betaken by means oftreble hook(s)
none season: 1/1 -12/31; 2 fishper day and in possessionover 20 inches; no limiton adult fish under 20inches
1963 1/1-12/31 three fish daily and inpossession
same as 1961 same as 1962 none closed to king salmonfishing
1964 1/1-12/31 same as 1963 no sizerestriction
no special restrictions none same as 1963
1965 1/1-12/31 same as 1963 same as 1964 same as 1964 none same as 19631966 1/1-12/31 same as 1963 same as 1964 same as 1964 none same as 19631967 1/1-12/31 same as 1963 same as 1964 same as 1964 none same as 19631968 1/1-12/31 same as 1963 same as 1964 same as 1964 none same as 19631969 1/1-12/31 same as 1963 same as 1964 same as 1964 none same as 19631970 1/1-12/31 same as 1963 same as 1964 same as 1964 none same as 19631971 1/1-12/31 same as 1963 same as 1964 same as 1964 none same as 19631972 1/1-12/31 same as 1963 same as 1964 same as 1964 none same as 19631973 1/1-12/31 same as 1963 same as 1964 same as 1964 none same as 19631974 1/1-12/31 same as 1963 same as 1964 same as 1964 none same as 19631975 1/1-12/31 same as 1963 same as 1964 same as 1964 none same as 19631976 1/1-12/31 three fish daily and in
possession in SEAK;one fish daily and inpossession in allwaters south of thelatitude of PtSherman to thelatitude of PtCouverden in LynnCanal and south tothe latitude ofLimestone Inlet inStephens Passage
26 inchminimumsize limit
no special restrictions Limestone Inlet toPoint Louisa includingbackside of DouglasIsland: Closed to kingsalmon fishing from4/15-6/14
closed to king salmonfishing
1977 1/1-12/31 same as 1976 28 inchminimumsize limit
same as 1976 same as 1976 same as 1976
1978 1/1-12/31 same as 1976 same as 1977 same as 1976 same as 1976 same as 19761979 1/1-12/31 same as 1976 same as 1977 same as 1976 Limestone Inlet to
Point Louisa includingbackside of DouglasIsland: Closed to kingsalmon fishing from4/16-6/14
same as 1976
1980 1/1-12/31 same as 1976 28 inchminimumsize limitfrom 6/15-3/31; anysize of kingsalmon legalfrom 4/1-6/14
same as 1976 same as 1979 same as 1976
1981 1/1-12/31 same as 1976 same as 1980 same as 1976 same as 1979 same as 19761982 1/1-12/31 same as 1976 same as 1980 same as 1976 same as 1979 same as 1976
-continued-

42
Table D2.—Page 2 of 2.
Year
Salt-waterseason
Saltwater bagand possessionlimits
Saltwatersize limit
Saltwatermethods &meansrestrictions
Specially closedsalt waters Freshwater
Regulations
1983 1/1-12/31 two fish daily and inpossession
28 inchminimumsize limit;except, thoseless than 28inches with atag orclippedadipose fincan beretained
not more than 6 linesmay be fished from acharter vessel
Limestone Inlet toPoint Louisa includingbackside of DouglasIsland: Closed to kingsalmon fishing from4/16-6/14
closed to king salmonfishing
1984 1/1-12/31 same as 1983 same as 1983 same as 1983 same as 1983 same as 19831985 1/1-12/31 same as 1983 same as 1983 same as 1983 same as 1983 same as 19831986 1/1-12/31 same as 1983 same as 1983 same as 1983 same as 1983 same as 19831987 1/1-12/31 same as 1983 same as 1983 same as 1983 same as 1983 same as 19831988 1/1-12/31 same as 1983 same as 1983 same as 1983 same as 1983 same as 19831989 1/1-12/31 same as 1983 28 inch
minimumsize limit
not more than 6 linesmay be fished fromany vessel sportfishing
Taku Inlet north of aline from Point Bishopto Dorothy Creek:Closed to king salmonfishing from4/16- 6/14
closed to king salmonfishinga
1990 1/1-12/31 same as 1983 same as 1989 same as 1989 same as 1989 same as 19891991 1/1-12/31 same as 1983 same as 1989 same as 1989 same as 1989 same as 19891992 1/1-12/31 same as 1983 same as 1989 same as 1989 with
the addition of:sport fishing mayonly be conducted bythe use of a singleline per angler
same as 1989 same as 1989
1993 1/1-12/31 same as 1983 same as 1989 same as 1992 same as 1989 same as 19891994 1/1-12/31 two fish daily and in
possession28 inchminimumsize limit
same as 1992 Taku Inlet north of aline from Cooper Pointto the mouth ofDorothy Creek: Closedto king salmon fishingfrom4/16- 6/14
closed to king salmonfishing1
1995 1/1-12/31 same as 1994 same as 1994 same as 1992 same as 1994 same as 19941996 1/1-12/31 same as 1994 same as 1994 same as 1992 same as 1994 same as 19941997 1/1-12/31 two fish daily and in
possession; inaddition, fornonresidents, theannual limit is fourfish
same as 1994 Operators and crewmembers working ona charter vessel maynot retain kingsalmon while clientsare aboard; themaximum number oflines allowed is equalto number of payingclients
same as 1994 same as 1994
1998 1/1-12/31 same as 1997 same as 1994 same as 1997 same as 1994 same as 1994
a Since 1989 ADFG has had the authority to open king salmon fishing in freshwater under certain circumstancesand the book regulations if this were to occur are as follows: in all freshwater systems opened by emergency orderto fishing for king salmon, the bag and possession limit is 2 fish 28 inches or more in length and 2 fish less than 28inches in length; otherwise freshwaters are closed to king salmon fishing. To date, ADFG has not opened kingsalmon fishing in the Taku River under this authority.

43
Table D3.—Commercial fishing pre-season booklet regulations for drift gillnets in District 111 of SoutheastAlaska likely affecting the Taku River chinook salmon stock, 1960-1998 a.
Year
Season openingdate(s) and fishingperiod(s)
Gillnet mesh regulations Gillnet LengthRegulations
Gillnetspacingregulations
Chinook sizelimits
1960 5/1-E.O. date: 72 hrs/wk 6” and smaller: 50 meshes;61/8-7”: 45 meshes; 71/8-9”: 40meshes
50 fathom min. & 150fathom max.
100 yardminimumspacing
26” limit exceptfrom 5/1-7/13when there wasno size limit
1961 5/1-E.O. date: 96 hrs/wk same as 1960 same as 1960 same as 1960 same as 19601962 4/30-6/15: 24 hrs/wk 6/16-
E.O. date: 96 hrs/wksame as 1960 same as 1960 same as 1960 same as 1960
1963 4/29-6/14: 24 hrs/wk 6/15-E.O. date: 72 hrs/wk
less than 8” - 60 mesh max.;8” and larger - 40 mesh max.
same as 1960 same as 1960 same as 1960
1964 4/27-6/12: 24 hrs/wk 6/15-E.O. date: 72 hrs/wk
same as 1963 same as 1960 same as 1960 same as 1960
1965 4/24-6/11: 24 hrs/wk 6/12-E.O. date: 72 hrs/wk
same as 1963 except, 40 mesh max.before 6/12
same as 1960 same as 1960 same as 1960
1966 same as 1965 same as 1965 same as 1960 same as 1960 same as 19601967 4/30-6/17: 24 hrs/wk;
6/18-E.O. date: 72 hrs/wksame as 1965 same as 1960 same as 1960 same as 1960
1968 4/28-6/15: 24 hrs/wk 6/16-E.O. date: 72 hrs/wk
same as 1965 same as 1960 same as 1960 same as 1960
1969 4/27-6/14: 24 hrs/wk 6/15-E.O. date: 72 hrs/wk
same as 1965 except, 40 mesh max.before 6/15; 6” max. from 6/15-7/20
same as 1960 same as 1960 same as 1960
1970 4/26-6/13: 24 hrs/wk 6/14-E.O. date: 72 hrs/wk
60 mesh max. for nets smaller than8”; 40 mesh max. for nets 8” orlarger; 40 mesh max. before 6/14;6” max. from 6/14-7/20
not less than 100fathoms or more than150 fathoms exceptafter 6/13, max. lengthincreases to 200fathoms
same as 1960 same as 1960
1971 5/2-6/12: 24 hrs/wk 6/13-E.O. date: 72 hrs/wk
60 mesh max. for nets smaller than8”; 40 mesh max. for nets 8” orlarger; 40 mesh max. before 6/14;6” max. from 6/14-7/20
not less than 100fathoms or more than150 fathoms exceptafter 6/13, max. lengthincreases to 200fathoms
100 yardminimumspacing
no size limit
1972 4/30-6/17: 24 hrs/wk;6/18-E.O. date: 72 hrs/wk
same as 1971; except, 40 meshrestriction in effect before 6/17;6” mesh max. from 6/18-7/18
same as 1971; exceptdate of change was 6/18
none none
1973 last Sunday in April-3rd
Saturday in June: 24hrs/wk3rd Sunday in June-E.O.date: 72 hrs/wk
60 mesh max. for nets smaller than8”; 40 mesh max. for nets 8” orlarger; 40 mesh max. before 3rd
Sunday in June; 6” max. from 3rd
Sunday in June-7/18
not less than 100fathoms or more than150 fathoms exceptafter 3rd Sunday in June,max. length increases to200 fathoms
none none
1974 same as 1973 same as 1973 same as 1973 none none1975 same as 1973 same as 1973 same as 1973 none none1976 Spring-time gill netting
closed
Season Opens: 3rd Mondayin June-E.O. date: 72hrs/wk
same as 1973; except, mesh not lessthan 53/8 inches during a seasonspecified by E.O.
not less than 100fathoms or more than150 fathoms exceptafter 3rd Saturday inJune, max. lengthincreases to 200fathoms
none none
1977 same as 1976 same as 1976 same as 1976 none none1978 same as 1976 same as 1976 same as 1976 none none1979 same as 1976 same as 1976 same as 1976 none none1980 same as 1976 same as 1976 same as 1976 none none1981 same as 1976 same as 1976 same as 1976 none none1982 same as 1976 same as 1976 same as 1976 none none1983 3rd Sunday in June-E.O.
date: 72 hrs/wksame as 1976 same as 1976 none none
-continued-

44
Table D3.—Page 2 of 2.
Year
Season openingdate(s) and fishingperiod(s)
Gillnet mesh regulations Gillnet LengthRegulations
Gillnetspacingregulations
Chinook sizelimits
1984 same as 1983 same as 1976; except, during E.O.pink salmon seasons, mesh size maynot be more than 5”
same as 1976 none none
1985 3rd Sunday in June-E.O.date: 72 hrs/wk
60 mesh max. for nets smaller than8”; 40 mesh max. for nets 8” orlarger; 40 mesh max. before 3rd
Sunday in June; 6” max. from 3rd
Sunday in June-7/18; max. meshsize in Section 11-B through 7/30 is6” and in Section 11-C through 7/18is 6”; during E.O. pink salmonseasons, mesh size may not be lessthan 53/8 inches
not less than 100fathoms or more than150 fathoms exceptafter 3rd Saturday inJune, max. lengthincreases to 200fathoms
none no size limit
1986 3rd Sunday in June-E.O.date: hrs/wk not specified
Drift gill net quotaestablished by Board ofFisheries in 1986 at 7,600chinook salmon perregulatory year for all ofSEAK
60 mesh max. for nets smaller than8”; 40 mesh max. for nets 8” orlarger; 40 mesh max. before 3rd
Sunday in June; Section 11-B max.of 6” through 6/30 and Section 11-Cmax. of 6” through 6/18; for theprotection of pink salmon, 53/8”;for the harvest of chum salmon, 6”
same as 1985 none none
1987 same as 1986 same as 1986 same as 1985 none none1988 same as 1986 same as 1986 same as 1985 none none1989 same as 1986 same as 1986 same as 1985 none none1990 same as 1986 same as 1986 same as 1985 none none1991 same as 1986 same as 1986 same as 1985 none none1992 same as 1986 same as 1986 same as 1985 none none1993 same as 1986 same as 1986 same as 1985 none none1994 same as 1986 same as 1986; except, 40 mesh max.
before 2nd Sunday in June;district-wide 6” max. through 4th
Saturday in June
same as 1985 none none
1995 same as 1986 same as 1994 same as 1985 none none1996 3rd Sunday in June-E.O.
date: hrs/wk not specified60 mesh max. for nets smaller than8”; 40 mesh max. for nets 8” orlarger; 40 mesh max. before 2nd
Sunday in June; max. mesh of 6”through 4th Saturday in Junethroughout District; for theprotection of pink salmon, 53/8
inches; for the harvest of chumsalmon, 6”
not less than 100fathoms or more than150 fathoms exceptafter 3rd Saturday inJune, max. lengthincreases to 200fathoms
none no size limit
1997 same as 1996 60 mesh max. for nets smaller than8”; 40 mesh max. for nets 8” orlarger; 40 mesh max. before 2nd
Sunday in June; max. mesh of 6”through 4th Saturday in June; min.size is 6” during periods announcedby E.O.
same as 1996 none none
1998 same as 1996 same as 1997 same as 1996 none nonea Prior to 1945, gill netting opened on or before May 10 and fishing time was limited only by weather and the
general regulation of 1906 which provided for a weekly closure from 6 PM Saturday to 6 PM Monday. Between1945 and 1953, gill nets were fished in Taku Inlet up to 5.5 days per week through May followed by a three weekclosure in June. In 1953 and 1954, the fishing period was reduced to 4 days per week in May and June. From1955-1959, the fishing period was reduced to 3 days per week (72 hours) from May 1st through the EmergencyOrder (E.O.) closing date.

45
Table D4.—Major regulatory actions taken in the management of the Southeast Alaska troll fishery forchinook salmon over the past 75 years.
Year Major Regulatory Actions Associated with Management of Southeast Alaska Troll FisheryPrior
to1924
Congressional Act in 1906 provided for 36 hour per week closure in all waters of Alaska, but very little enforcementwas conducted.
Priorto
1950
Troll fishery was unlimited by area restrictions and continued year round. Trollers were limited to four lines inTerritorial waters. In 1941, a minimum size of 6 lbs. dressed weight for chinook was implemented. In 1941,Burroughs Bay was closed to trolling from 8/16-10/5.
1950 “Outside” waters were closed from 10/31 to 3/15. Portions of northern Lynn Canal were closed from 5/31 to 6/25.Northern Behm Canal was closed from 5/1 to 7/15.
1951 Chinook size limit was modified to either 6 lbs. dressed weight or 26 inches in fork length.1958 Additional area restrictions were imposed with the closing of portions of Stephens Passage.1959 Trolling was prohibited in Stikine Straight south of Vank Island during November and December.1960 Trollers were limited to 4 fishing lines and use of single hooks in State waters and “outside” waters were closed from
11/1 to 4/15.1962 A portion of northern Behm Canal was closed to trolling. Trolling was limited to 1 day per week in Districts 11A and
11B from late April to mid-June.1965 The District 8 troll season was open only during days the gill net fishery was open during the gill net season.1970 Trolling in Yakutat Bay was restricted to the same days as the set net fishery was open.1971 Trolling was limited to 1 day per week in District 111, District 112 north of Point Couverden and District 115C from
5/1 to the 3rd Sunday of June.1973 Yakutat Bay was opened to winter troll fishing.1974 All State waters north and west of Cape Suckling were closed to troll fishing.1975 Power trolling was placed under limited entry with 940 permits allowed.1976 District 11, District 12 north of Point Couverden, and Districts 15B and 15C were closed to trolling from 4/16 to 6/14.
District 11A was closed to trolling from 4/16 to 8/14.1977 Federal waters of the Fishery Conservation Zone west of Cape Suckling were closed to troll fishing. The chinook
salmon minimum size length was increased to 28 inches. Waters in east Behm Canal and in Boca de Quadra wereclosed to troll fishing.
1978 The eastern Sumner Strait portions of District 6 and adjoining District 8 were closed to trolling from 4/16 to 6/14. Thenorthern Clarence Straight portion of District 6 and adjoining District 8 were closed to trolling from 4/16 to 8/14.District 8 was closed to trolling from 4/16 to the third Monday in June. The southern Frederick Sound portion ofDistrict 10 and adjoining District 8 was closed to trolling from 4/16 to 6/14.
1979 A 8-day “on” and 6-day “off” fishing period was implemented for the troll fishery in Districts 12 north of PointHepburn and in Districts 14, 15A and 15C. Districts 11A and 11B were closed to trolling all year. “Outside” waterswere closed to hand trolling.
1980 First of the annual management targets was established for the harvest of chinook salmon in Southeast Alaska by theAlaska Board of Fisheries and the North Pacific Fishery Management Council; a guideline harvest target of 286,000 to320,000 chinook salmon in the commercial fishery. Limited entry for hand trolling was implemented, 2,150 permitswere issued, 1,300 of them as non-transferable permits. The number of lines allowed to be fished in the FederalConservation Zone was limited to 4 lines per vessel south of Cape Spencer and 6 lines per vessel between CapeSpencer and Cape Suckling with a limit of 6 operational gurdies. A 10-day chinook non-retention period for the trollfishery from 6/15 to 6/24 was implemented and a 9/21 to 9/30 closure of the troll fishery was implemented.
1981 Guideline harvest of 272,000 to 285,000 chinook was established by Alaska Board of Fisheries; North Pacific FisheryManagement Council set guideline at 243,000 to 286,000 chinook. The troll fishery was closed from 4/15 to 5/15 forconservation of mature chinook salmon spawners of local origin. A 6/25 to 7/5 chinook non-retention period wasimplemented. A troll fishery closure from 8/10 to 8/19 was implemented. A 9/4 to 9/12 chinook non-retention periodwas implemented. The Federal Conservation Zone was closed from 8/10 to 9/20 except in Yakutat Bay. With theexception of Yakutat Bay, the troll fishery was closed from 9/21 to 9/30. A winter chinook troll fishing season wasestablished from 10/1 to 4/14, a summer troll fishing season was established from 4/15 to 9/20. Portions of District116 were included in waters open to the winter troll fishery. Hand troll gear was limited to 2 gurdies or 4 fishing polesand the hand troll closure in “outside” waters was repealed.
1982 Alaska Board of Fisheries and the North Pacific Fishery Management Council set a guideline harvest of 257,000chinook with a range from 243,000 to 286,000 chinook (including an estimated 1,500 chinook produced by Alaskanhatcheries). The troll fishery was closed from 5/15 to 6/14. A chinook non-retention period from 6/7 to 6/17 and from7/29 to 9/19 was implemented. Undersized chinook with adipose finclips were allowed to be retained by trollfishermen so long as the heads were submitted to ADFG.
-continued-

46
Table D4.–Page 2 of 3.
1983 Guideline harvest level was again set at 243,000 to 286,000 chinook salmon for the commercial fishery, including thewinter troll harvest from 10/1/83 to 4/14/84 by the Alaska Board of Fisheries and the North Pacific FisheryManagement Council. Troll fishery was closed from 4/15 to 6/5 and from 7/1 to 7/10. The troll fishery was closed tochinook retention from 7/30 to 9/20.
1984 Guideline harvest level of 243,000 to 272,000 chinook salmon was again set by the Alaska Board of Fisheries and theNorth Pacific Fishery Management Council for the commercial fishery, including the winter troll harvest. The trollfishery was closed from 5/15 to 6/5 and from 7/1 to 7/10. The troll fishery was closed to the retention of chinook from7/30 to 9/20.
1985 The U.S.-Canada Pacific Salmon Treaty set a ceiling for the harvest of chinook salmon in Southeast Alaska by all geargroups as 263,000. The summer season definition was extended to 9/30. The troll fishery was closed from 4/15 to 6/3and from 6/13 to 6/30. Troll fishery chinook non-retention was implemented from 7/23 to 8/24 and from 8/27 to 9/20.
1986 The U.S.-Canada Pacific Salmon Treaty set a ceiling for the harvest of chinook salmon in Southeast Alaska by all geargroups as 254,000 fish plus an Alaska hatchery add-on. The troll fishery was closed from 4/15 to 6/20. Selected areaswere closed from 7/9 to the end of the season to reduce chinook catch rates. Remaining areas were closed to chinookretention from 7/16 to 8/20. Troll fishery chinook non-retention was implemented from 8/27 to 8/31 and from 9/10 to9/20. Experimental troll fisheries were allowed in Wrangell Narrows and near Little Port Walter from 6/2 to 6/3, from6/9 to 6/10, and from 6/16 to 6/17 to harvest hatchery chinook. The 8-day “on” and 6-day “off” fishing periods inDistrict 14 and waters of District 12 south of Point Couverden were repealed. The prior regulation allowing theretention of under-sized chinook with missing adipose fins was repealed.
1987 The U.S.-Canada Pacific Salmon Treaty set a ceiling for the harvest of chinook salmon in Southeast Alaska by all geargroups as 263,000 fish plus an Alaska hatchery add-on. The general summer troll fishery was closed from 4/15 to6/20. Selected areas were closed from 7/4 to the end of the season to reduce chinook catch rates. Remaining areaswere closed to chinook retention from 7/13 to 8/2 and from 8/13 to 9/20. Experimental troll fisheries near fourAlaskan hatcheries were allowed during June prior to the 6/20 summer season opening.
1988 The Pacific Salmon Treaty set a ceiling for the harvest of chinook salmon in Southeast Alaska by all gear groups as263,000 fish plus an Alaska hatchery add-on. The general summer troll fishery was closed from 4/15 to 6/30.Chinook non-retention was implemented from 7/12 to 9/20. Experimental troll fisheries near five Alaskan hatcherieswere allowed during June and terminal troll fisheries were operated continuously during June in Wrangell Narrows andCarroll Inlet.
1989 The U.S.-Canada Pacific Salmon Treaty set a ceiling for the harvest of chinook salmon in Southeast Alaska by all geargroups as 263,000 fish plus an Alaska hatchery add-on. The general summer troll fishery was closed from 4/15 to6/30. Chinook non-retention was implemented from 7/13 to 9/20. Experimental troll fisheries in 9 areas near Alaskanhatcheries were allowed during June (6/12 to 6/13 and 6/26 to 6/28) and terminal troll fisheries were operated duringJune in Wrangell Narrows (6/12) and Carroll Inlet (6/11 to 6/29). Hatchery access troll fisheries were opened in mostof the “inside” waters for two 3-day periods in June during weeks without experimental troll fisheries.
1990 The U.S.-Canada Pacific Salmon Treaty set a ceiling for the harvest of chinook salmon in Southeast Alaska by all geargroups as 302,000 fish plus an Alaska hatchery add-on. The general summer troll fishery was closed from 4/15 to6/30. Chinook non-retention was implemented from 7/23 to 8/22 and from 8/25 to 9/20. Experimental and hatcheryaccess troll fisheries near Alaskan hatcheries were allowed during June. Additional terminal areas were opened to trollfishing in Earl West Cove. A quota of 30,000 chinook excluding Alaska hatchery add-on fish was implemented for thespring-time troll fisheries. A portion of District 111A, the backside of Douglas Island was opened to trolling duringthe winter season (10/1 to 4/15).
1991 The U.S.-Canada Pacific Salmon Treaty set a ceiling for the harvest of chinook salmon in Southeast Alaska by all geargroups as 273,000 fish plus an Alaska hatchery add-on that was projected at 57,800 chinook salmon. The generalsummer troll fishery was closed from 4/15 to 6/30. Chinook non-retention was implemented from 7/8 to 9/20.Experimental and hatchery access troll fisheries near Alaskan hatcheries were allowed during June. A quota of 40,000chinook excluding Alaska hatchery add-on fish was implemented for the spring-time troll fisheries.
1992 The U.S.-Canada Pacific Salmon Treaty set a ceiling for the harvest of chinook salmon in Southeast Alaska by all geargroups as 263,000 fish plus an Alaska hatchery add-on that was projected at 69,000 chinook salmon. The AlaskaBoard of Fisheries allocated 83% of the ceiling to the troll fishery after accounting for a 20,000 chinook allocation forcommercial net fisheries. Winter and spring-time troll fisheries occurred similar to 1991. The general summer trollfishery was closed from April 15 to June 30. The general summer season opening occurred from 7/1 to 7/6. The trollfishery was closed to chinook retention from 7/7 to 8/20 and areas of high chinook abundance were closed to fishingthrough 9/20. The troll fishery reopened to chinook retention from 8/21 to 8/25 and from 9/12 to 9/20. From 8/26-9/11 chinook non-retention was implemented. Snake River fall chinook salmon listed as “threatened” under the U.S.Endangered Species Act (ESA)
-continued-

47
Table D4.–Page 3 of 3.
1993 The Alaska Department of Fish and Game managed the chinook salmon harvest in Southeast Alaska for a ceiling of263,000 fish plus the Alaska hatchery add-on estimated to be 35,900 fish after receiving a Section 7 ESA consultationfrom the National Marine Fisheries Service. The U.S.-Canada Pacific Salmon Treaty Annex concerning chinooksalmon catch ceilings expired in 1992 and an annex has not since been successfully negotiated by the parties to thetreaty. The start of the winter troll fishery was delayed until 10/11 and operated until 4/14. As a result of the ESAconsultation, the spring-time hatchery access fishery did not occur. Experimental and terminal fisheries did occur.The general summer season opening was delayed until 7/1 and remained open until 7/6. The troll fishery was closedfrom 7/7 to 7/11. The troll fishery was reopened on 7/12 with chinook non-retention and with areas of high chinookabundance closed to fishing. The troll fishery reopened to chinook retention from 9/12 to 9/20.
1994 The Alaska Department of Fish and Game managed the chinook salmon harvest in Southeast Alaska for a ceiling of240,000 fish plus the Alaska hatchery add-on after receiving a Section 7 ESA consultation from the National MarineFisheries Service. The Alaska Board of Fisheries allocated 82% of the ceiling to the troll fishery after accounting for a20,000 chinook allocation for commercial net fisheries. The Alaska Board of Fisheries allocated 45,000 of the trollallocation to the winter troll fishery and 70% of remaining troll harvest to a summer fishery with an initial openingbeginning July 1. The winter troll fishery took place from 10/11 to 4/14. Spring-time troll fisheries consisting ofterminal and experimental fisheries were conducted between early May and 6/30. The general summer troll fisheryopened on 7/1 and closed on 7/8. From 7/8 to 9/20, areas of high chinook abundance were closed to troll fishing.Chinook non-retention in the troll fishery was implemented from 7/8 to 8/28. Chinook retention was allowed bytrollers from 8/29 to 9/2. Non-retention of chinook in the troll fishery was implemented from 9/3 to 9/20.
1995 The Alaska Department of Fish and Game initially managed the chinook salmon harvest in Southeast Alaska for aceiling of 230,000 fish plus the Alaska hatchery add-on after receiving a Section 7 ESA consultation from the NationalMarine Fisheries Service. Part way through the general summer season, a temporary restraining order issued by theU.S. District Court, Western District of Washington resulted in the fishery being closed well before reaching the targetharvest level. The Alaska Board of Fisheries allocated 81% of the ceiling to the troll fishery after accounting for a20,000 chinook allocation for commercial net fisheries. The winter troll fishery took place from 10/11 to 4/14.Spring-time troll fisheries consisting of terminal and experimental fisheries were conducted between early May and6/30. The general summer troll fishery opened on 7/1 and closed on 7/10. From 7/11 to 9/20, areas of high chinookabundance were closed to troll fishing. Chinook non-retention in the troll fishery was implemented from 7/11 to 7/30.Chinook retention was allowed by trollers from 7/31 to 8/5. Non-retention of chinook in the troll fishery wasimplemented from 8/6 to 9/20.
1996 The Alaska Department of Fish and Game managed the chinook fisheries in Southeast Alaska for a harvest of 140,000to 155,000 fish plus the Alaska hatchery add-on after receiving a Section 7 ESA consultation from the National MarineFisheries Service and upon the State of Alaska signing a 6/24/96 letter of agreement with southern U.S. representativesof the U.S.-Canada Treaty regarding an abundance-based approach to managing chinook salmon fisheries in SoutheastAlaska. The Alaska Board of Fisheries allocated 80% of the ceiling to the troll fishery after accounting for a 20,000chinook allocation for commercial net fisheries. The winter troll fishery took place from 10/11 to 4/14. Spring-timetroll fisheries consisting of terminal and experimental fisheries were conducted between early May and 6/30. Thegeneral summer troll fishery opened on 7/1 and closed on 7/10. From 7/11 to 9/20, areas of high chinook abundancewere closed to troll fishing. Chinook non-retention in the troll fishery was implemented from 7/11 to 7/30. Chinookretention was allowed by trollers from 8/19 to 8/20. Non-retention of chinook in the troll fishery was implementedfrom 8/21 to 9/20.
1997 The Alaska Department of Fish and Game managed the chinook salmon harvest in Southeast Alaska for a ceiling of302,000 fish plus the Alaska hatchery add-on after receiving a Section 7 ESA consultation from the National MarineFisheries Service and applying measures as called for in the 6/24/96 letter of agreement concerning management ofSEAK chinook fisheries. The winter troll fishery took place from 10/11 to 4/14. Spring-time troll fisheries consistingof terminal and experimental fisheries were conducted between early May and 6/30. The general summer troll fisheryopened on 7/1 and closed on 7/7. After 7/7 areas of high chinook abundance were closed to troll fishing. Chinooknon-retention in the troll fishery was implemented from 7/8 to 8/17. Chinook retention was allowed by trollers from8/18 to 8/24 and again from 8/30-9/5. Non-retention of chinook in the troll fishery was implemented from 8/25 to 8/29and again from 9/6-9/23.

48
Appendix E. Estimates of Smolt Abundance
Smolt abundance was estimated for several yearclasses, using a two-sample, mark-recaptureexperiment with Petersen’s estimator as modifiedby Chapman (1951):
( )( )1
111ˆ
,
,,, −
+++
=ye
yeycys m
nnN
[ ] ( )( )( )( )21
ˆˆ
,,
,,,,,, ++
−−=
yeye
yeyeyeycysys mm
mnmnNNv
where ysN ,ˆ is the number of smolt leaving the
Taku River from year class y, ycn , is the numberof smolt tagged from year class y, yen , is thenumber of adults sampled in the escapement insubsequent years from year class y, and yem , is thenumber of adults in that sample with missingadipose fins.
Young chinook salmon were captured andimplanted with coded-wire tags (CWTs) in theTaku River from the 1975-1981 and 1991-presentyear classes (Table E.1). Too few smolt weretagged for year classes 1977, 1978, 1980 and 1981to produce estimates of smolt abundance.Consequently, we estimated smolt abundance forthe 1975, 1976, 1979 and 1991-1995 year classes.Young fish were captured in the mainstem of theTaku River with baited minnow traps (Kissnerand Hubartt 1986) for the 1975-1981 year classesand with rotary screw traps and minnow traps inlater years. Numbers of smolt CWTd ranged fromapproximately 9,000 to 11,000 for the 1975, 1976,1979 and 1991-1993 year classes to about 38,000for the 1995 year class.
Adults were inspected on the spawning grounds orin fish wheels at Canyon Island (near theinternational border) to estimate the fraction ofyear class y tagged in year y+2 as smolt.
Adults were inspected in years y+3 (age 1.1), y+4(age 1.2), y+5 (age 1.3), y+6 (age 1.4) and y+7(age 1.5).
Table E1.—Numbers of smolt CWTd, adultsinspected and marked, and estimated smoltabundance and associated SEs for Taku Riverchinook salmon.
YearClass ycn , yen , yem , ysN ,
ˆSE
1975 9,912 5,397 44 1,189,118 174,1971976 9,550 2,594 15 1,549,052 374,2271979 8,961 3,245 43 661,150 97,6481991 10,015 10,267 48 2,098,862 295,3901992 9,858 3,792 18 1,968,167 438,5691993 11,121 455 3 1,267,907 564,4321994 21,588 799 12 1,328,553 352,0681995 37,869 400 7 1,898,233 626,335
Details
Escapement sampling for the returning adultsfrom the 1975-1981 year classes was limited tothe Nakina River (Figure 1). The Nakina Riverproduces more chinook than any other tributary inthe Taku River drainage (Pahlke & Bernard 1996;Eiler et al. In prep). It also has the longeststanding stock assessment program in the TakuRiver. A carcass weir has been operated on thistributary each year since 1973 and an average of1,000 fish have been sampled annually for age,sex and length. Additionally, all other chinookcaught at the weir (up to 4,500) have beensampled for sex and length. In order to estimatesmolt abundance (for the 1975, 1976 and 1979year classes) from recoveries in the Nakina River,samples from this subpopulation must berepresentative of the entire drainage.
Sampling for the 1991-1995 year classes indicatethat tagged smolt represented all subpopulationsin the Taku River in near equal proportions (TableE.2). For example, the marked fraction of fishsampled from the 1991 year class at CanyonIsland (0.0056) was not different than the markedfraction of fish sampled at Nakina River (0.0043)(P = 0.40, χ2 = 0.70). Similarly, the markedfraction of fish sampled from the 1992 year classat Canyon Island (0.0052) was not different that

49
the marked fraction of fish sampled at NakinaRiver (0.0044) (P=0.77, χ2 = 0.08). Thebenchmark for the entire run is Canyon Island. Atthis location, fish are sampled from fish wheelcatches throughout the duration of the adultmigration. Canyon Island is located in the lowerriver below all known chinook spawning areasand catches are composed of all subpopulations.
Our analysis included smolt estimates from the1993-1995 year classes, for which adult returnsare incomplete (Table E.2). Results from earlierbrood years indicate that estimates of smoltabundance are relatively invariant as the resultsaccumulate across a given brood. For example,the estimated smolt abundance varied from 1.2 to1.4 million across the five age classes for the 1975year class, from 1.4 to 1.6 million for the 1976year class and from 0.6 to 0.7 million for the 1979year class. Estimated smolt abundance rangedfrom 2.1 to 2.2 million for the 1991 year class
across the accumulated data for age-1.2 to age-1.4fish. Smolt estimates seldom varied after two ageclasses or five marked adults were recovered.
The narrow ranges of estimated smolt abundancethrough the course of accumulated data over eachyear class indicates that the marked fraction isconsistent across age classes. The markedfractions were virtually the same (P=0.96, χ2 =0.27) for age-1.1 fish (0.0050), age-1.2 fish(0.0042), age-1.3 fish (0.0048) and age-1.4 fish(0.0050) sampled from the 1991 year class. Themarked fractions were almost as consistent forthe other complete years classes, 1975 ((P=077,χ2 = 1.14), 1976 (P=0.89, χ2 = 0.59), and for 1979(P=0.46, χ2 = 2.56). Summarily, estimates ofsmolt production were consistent across ageclasses, but precision increased as informationaccumulated.
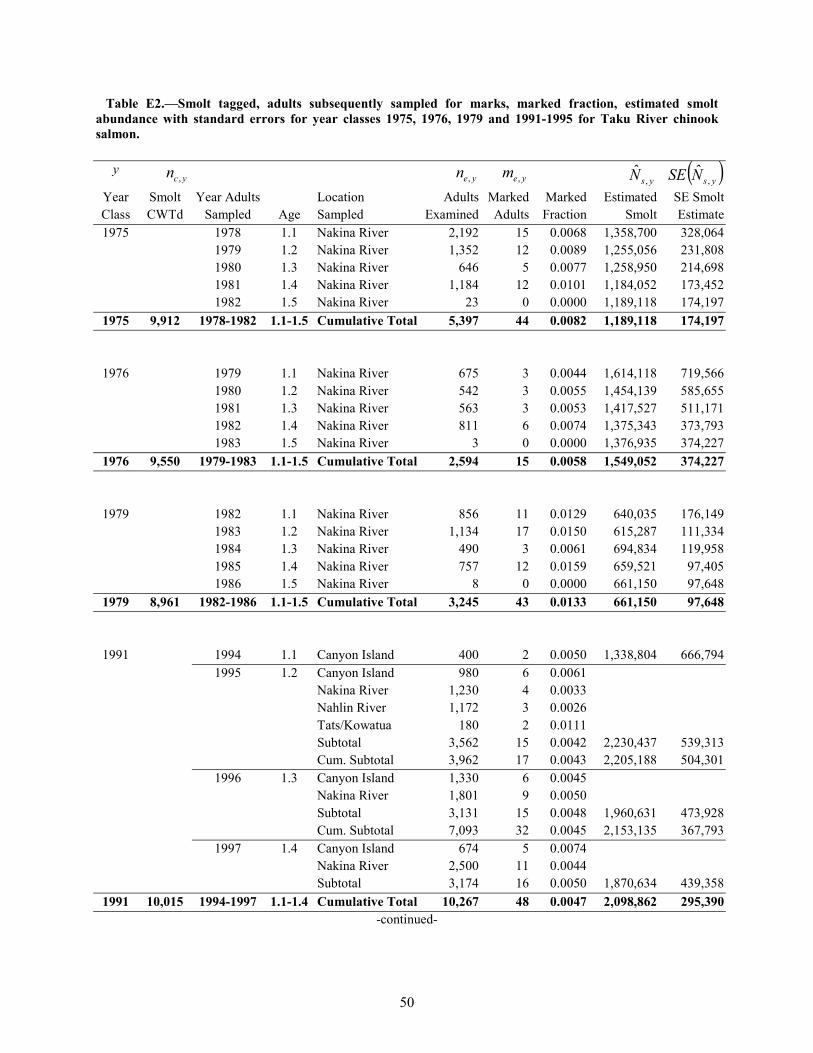
50
Table E2.—Smolt tagged, adults subsequently sampled for marks, marked fraction, estimated smoltabundance with standard errors for year classes 1975, 1976, 1979 and 1991-1995 for Taku River chinooksalmon.
yycn , yen , yem , ysN ,
ˆ ( )ysNSE ,ˆ
Year Smolt Year Adults Location Adults Marked Marked Estimated SE SmoltClass CWTd Sampled Age Sampled Examined Adults Fraction Smolt Estimate1975 1978 1.1 Nakina River 2,192 15 0.0068 1,358,700 328,064
1979 1.2 Nakina River 1,352 12 0.0089 1,255,056 231,8081980 1.3 Nakina River 646 5 0.0077 1,258,950 214,6981981 1.4 Nakina River 1,184 12 0.0101 1,184,052 173,4521982 1.5 Nakina River 23 0 0.0000 1,189,118 174,197
1975 9,912 1978-1982 1.1-1.5 Cumulative Total 5,397 44 0.0082 1,189,118 174,197
1976 1979 1.1 Nakina River 675 3 0.0044 1,614,118 719,5661980 1.2 Nakina River 542 3 0.0055 1,454,139 585,6551981 1.3 Nakina River 563 3 0.0053 1,417,527 511,1711982 1.4 Nakina River 811 6 0.0074 1,375,343 373,7931983 1.5 Nakina River 3 0 0.0000 1,376,935 374,227
1976 9,550 1979-1983 1.1-1.5 Cumulative Total 2,594 15 0.0058 1,549,052 374,227
1979 1982 1.1 Nakina River 856 11 0.0129 640,035 176,1491983 1.2 Nakina River 1,134 17 0.0150 615,287 111,3341984 1.3 Nakina River 490 3 0.0061 694,834 119,9581985 1.4 Nakina River 757 12 0.0159 659,521 97,4051986 1.5 Nakina River 8 0 0.0000 661,150 97,648
1979 8,961 1982-1986 1.1-1.5 Cumulative Total 3,245 43 0.0133 661,150 97,648
1991 1994 1.1 Canyon Island 400 2 0.0050 1,338,804 666,7941995 1.2 Canyon Island 980 6 0.0061
Nakina River 1,230 4 0.0033Nahlin River 1,172 3 0.0026Tats/Kowatua 180 2 0.0111Subtotal 3,562 15 0.0042 2,230,437 539,313Cum. Subtotal 3,962 17 0.0043 2,205,188 504,301
1996 1.3 Canyon Island 1,330 6 0.0045Nakina River 1,801 9 0.0050Subtotal 3,131 15 0.0048 1,960,631 473,928Cum. Subtotal 7,093 32 0.0045 2,153,135 367,793
1997 1.4 Canyon Island 674 5 0.0074Nakina River 2,500 11 0.0044Subtotal 3,174 16 0.0050 1,870,634 439,358
1991 10,015 1994-1997 1.1-1.4 Cumulative Total 10,267 48 0.0047 2,098,862 295,390-continued-

51
Table E2.—Page 2 of 2.
yycn , yen , yem , ysN ,
ˆ ( )ysNSE ,ˆ
Year Smolt Year Adults Location Adults Marked Marked Estimated SE SmoltClass CWTd Sampled Age Sampled Examined Adults Fraction Smolt Estimate1992 1995 1.1 Canyon Island 162 2 0.0123
Nakina River 122 0 0.0000Nahlin River 14 0 0.0000Tats/Kowatua 7 0 0.0000Subtotal 305 2 0.0066 1,005,617 500,262
1996 1.2 Canyon Island 390 1 0.0026Nakina River 487 2 0.0041Tatsamenie River 70 1 0.0143Subtotal 947 4 0.0042 1,869,265 760,916Cum. Subtotal 1,252 6 0.0048 1,764,760 621,971
1997 1.3 Canyon Island 376 1 0.0027Nakina River 1,212 5 0.0041Tatsamenie River 234 1 0.0043Subtotal 1,822 7 0.0038 2,246,619 746,925Cum. Subtotal 3,074 13 0.0042 2,165,458 557,449
1998 1.4 Canyon Island 237 2 0.0084Nakina River 214 2 0.0093Tatsamenie River 267 1 0.0037Subtotal 718 5 0.0070 1,181,436 444,539
1992 9,858 1995-1998 1.1-1.4 Cumulative Total 3,792 18 0.0047 1,968,167 438,569
1993 1996 1.1 Canyon Island 25 1 0.0400Nakina River 18 0 0.0000Subtotal 43 1 0.0233 244,683 138,008
1997 1.2 Canyon Island 73 1 0.0137Nakina River 110 0 0.0000Subtotal 183 1 0.0055 1,023,223 587,486
1998 1.3 Canyon Island 129 1 0.0078Nakina River 100 0 0.0000Subtotal 229 1 0.0044 1,279,029 735,164
1993 11,121 1996-1998 1.1-1.3 Cumulative Total 455 3 0.0066 1,267,907 564,432
1994 1997 1.1 Canyon Island 151 2 0.0132Nakina River 108 2 0.0185Subtotal 259 4 0.0154 1,122,627 453,830
1998 1.2 Canyon Island 251 4 0.0159Nakina River 200 3 0.0150Tats/Kowatua 89 1 0.0112Subtotal 540 8 0.0148 1,297,738 406,868
1994 21,588 1997-1998 1.1-1.2 Cumulative Total 799 12 0.0150 1,328,553 352,068
1995 1998 1.1 Canyon Island 263 5 0.0190Nakina River 137 2 0.0146
1995 37,869 1998 1.1 Cumulative Total 400 7 0.0175 1,898,233 626,335