Optimal Placement of Multiple-Type FACTS Devices to Maximize Power System Loadability Using a...
15
This article has been accepted for inclusion in a future issue of this journal. Content is final as presented, with the exception of pagination. IEEE TRANSACTIONS ON POWER SYSTEMS 1 Optimal Placement of Multiple-Type FACTS Devices to Maximize Power System Loadability Using a Generic Graphical User Interface Esmaeil Ghahremani and Innocent Kamwa, Fellow, IEEE Abstract—Flexible AC transmission systems, so-called FACTS devices, can help reduce power flow on overloaded lines, which would result in an increased loadability of the power system, fewer transmission line losses, improved stability and security and, ul- timately, a more energy-efficient transmission system. In order to find suitable FACTS locations more easily and with more flexibility, this paper presents a graphical user interface (GUI) based on a ge- netic algorithm (GA) which is shown able to find the optimal loca- tions and sizing parameters of multi-type FACTS devices in large power systems. This user-friendly tool, called the FACTS Place- ment Toolbox, allows the user to pick a power system network, de- termine the GA settings and select the number and types of FACTS devices to be allocated in the network. The GA-based optimization process is then applied to obtain optimal locations and ratings of the selected FACTS to maximize the system static loadability. Five different FACTS devices are implemented: SVC, TCSC, TCVR, TCPST and UPFC. The simulation results on IEEE test networks with up to 300 buses show that the FACTS placement toolbox is effective and flexible enough for analyzing a large number of sce- narios with mixed types of FACTS to be optimally sited at multiple locations simultaneously. Index Terms—Continuation power flow, FACTS devices, genetic algorithm, optimal FACTS placement, optimal power flow, power system loadability, power system security. I. INTRODUCTION T HE limitation of energy resources and, also, a number of economic constraints increasingly force the power system to operate near its stability and loadability margins. In order to use the maximum capacity of power transmission lines while avoiding overloaded lines, utilities have expensive and time- consuming solutions such as building new lines. Alternatively, there are operational measures aimed at the same goal, such as: 1) topological changes through line switching and 2) active and reactive power flow control [1]. FACTS devices fit in with the alternative approach as they im- prove the efficiency of existing networks by re-dispatching line flow patterns in such a way that the thermal limits are not ex- ceeded, while fulfilling contractual requirements between grid Manuscript received October 01, 2011; revised February 09, 2012 and May 24, 2012; accepted July 19, 2012. Paper no. TPWRS-00918-2011. E. Ghahremani is with the Department of Electrical and Computer Engi- neering, Laval University, Québec City, QC G1V 0A6, Canada (e-mail: es- [email protected]). I. Kamwa is with Hydro-Québec/IREQ, Power Systems and Mathematics, Varennes, QC J3X 1S1, Canada (e-mail: [email protected]). Color versions of one or more of the figures in this paper are available online at http://ieeexplore.ieee.org. Digital Object Identifier 10.1109/TPWRS.2012.2210253 stakeholders and increasing system loadability [2]. From the steady-state point of view, FACTS devices operate by supplying or absorbing reactive power, increasing or reducing voltage and controlling the series impedance of transmission lines or phase angle [3]. However, the benefits of these devices are severely depen- dent on their type, size, number and location in the transmis- sion system [4]. Many research projects and studies have been conducted in the area of FACTS device placement to improve power system operations. Considering the allocation technique or the optimization algorithm, we end up with the following two categories: A. Heuristic Optimization Algorithms [4]–[22] In this category, heuristic methods are used to find the best solution (best number, type, location and value) for a given fitness or objective function. Among those used specifically in FACTS placement studies, the most popular are: genetic algorithm (GA) [4]–[9], tabu search (TA) [10], [11], simu- lated annealing (SA) [11], particle swarm optimization (PSO) [12]–[14], evolutionary algorithm (EA) [15]–[18], bacterial swarming algorithm (BSA) [19], group search optimizer with multiple producer (GSOMP) [20], harmony search algorithm (HSA) [21], and bees algorithm (BA) [22]. B. Analytical Techniques [23]–[33] Contrasting with the previous heuristic approaches, analyt- ical methods are preferred by some authors to allocate FACTS devices in order to suit a given system need. For example, in [23] and [24], analyses of the power system Jacobian matrix singularity were used. Also, in [25]–[27] the authors used the line flow index (LFI) as their allocation criterion. In [28] the power-angle characteristic was used to locate the FACTS de- vices. The extended voltage phasors approach (EVPA) [29], mixed integer linear programming (MILP) [30]–[32], and lo- cational marginal price (LMP) [33] are yet other methods in the second category. Another categorization can be made as follows, based on the number and variety of devices involved: C. Single-Type FACTS Device Allocation The assumption here is that a single type of device is to be sited at a given number of optimally chosen locations. The FACTS placement procedure then starts to find the optimal locations and values for the selected device such as: SVC [6], 0885-8950/$31.00 © 2012 IEEE
Transcript of Optimal Placement of Multiple-Type FACTS Devices to Maximize Power System Loadability Using a...
This article has been accepted for inclusion in a future issue of this journal. Content is final as presented, with the exception of pagination.
IEEE TRANSACTIONS ON POWER SYSTEMS 1
Optimal Placement of Multiple-Type FACTSDevices to Maximize Power System LoadabilityUsing a Generic Graphical User Interface
Esmaeil Ghahremani and Innocent Kamwa, Fellow, IEEE
Abstract—Flexible AC transmission systems, so-called FACTSdevices, can help reduce power flow on overloaded lines, whichwould result in an increased loadability of the power system, fewertransmission line losses, improved stability and security and, ul-timately, a more energy-efficient transmission system. In order tofind suitable FACTS locationsmore easily andwithmore flexibility,this paper presents a graphical user interface (GUI) based on a ge-netic algorithm (GA) which is shown able to find the optimal loca-tions and sizing parameters of multi-type FACTS devices in largepower systems. This user-friendly tool, called the FACTS Place-ment Toolbox, allows the user to pick a power system network, de-termine the GA settings and select the number and types of FACTSdevices to be allocated in the network. The GA-based optimizationprocess is then applied to obtain optimal locations and ratings ofthe selected FACTS to maximize the system static loadability. Fivedifferent FACTS devices are implemented: SVC, TCSC, TCVR,TCPST and UPFC. The simulation results on IEEE test networkswith up to 300 buses show that the FACTS placement toolbox iseffective and flexible enough for analyzing a large number of sce-narios with mixed types of FACTS to be optimally sited at multiplelocations simultaneously.
Index Terms—Continuation power flow, FACTS devices, geneticalgorithm, optimal FACTS placement, optimal power flow, powersystem loadability, power system security.
I. INTRODUCTION
T HE limitation of energy resources and, also, a number ofeconomic constraints increasingly force the power system
to operate near its stability and loadability margins. In order touse the maximum capacity of power transmission lines whileavoiding overloaded lines, utilities have expensive and time-consuming solutions such as building new lines. Alternatively,there are operational measures aimed at the same goal, such as:1) topological changes through line switching and 2) active andreactive power flow control [1].FACTS devices fit in with the alternative approach as they im-
prove the efficiency of existing networks by re-dispatching lineflow patterns in such a way that the thermal limits are not ex-ceeded, while fulfilling contractual requirements between grid
Manuscript received October 01, 2011; revised February 09, 2012 and May24, 2012; accepted July 19, 2012. Paper no. TPWRS-00918-2011.E. Ghahremani is with the Department of Electrical and Computer Engi-
neering, Laval University, Québec City, QC G1V 0A6, Canada (e-mail: [email protected]).I. Kamwa is with Hydro-Québec/IREQ, Power Systems and Mathematics,
Varennes, QC J3X 1S1, Canada (e-mail: [email protected]).Color versions of one or more of the figures in this paper are available online
at http://ieeexplore.ieee.org.Digital Object Identifier 10.1109/TPWRS.2012.2210253
stakeholders and increasing system loadability [2]. From thesteady-state point of view, FACTS devices operate by supplyingor absorbing reactive power, increasing or reducing voltage andcontrolling the series impedance of transmission lines or phaseangle [3].However, the benefits of these devices are severely depen-
dent on their type, size, number and location in the transmis-sion system [4]. Many research projects and studies have beenconducted in the area of FACTS device placement to improvepower system operations. Considering the allocation techniqueor the optimization algorithm, we end up with the following twocategories:
A. Heuristic Optimization Algorithms [4]–[22]
In this category, heuristic methods are used to find the bestsolution (best number, type, location and value) for a givenfitness or objective function. Among those used specificallyin FACTS placement studies, the most popular are: geneticalgorithm (GA) [4]–[9], tabu search (TA) [10], [11], simu-lated annealing (SA) [11], particle swarm optimization (PSO)[12]–[14], evolutionary algorithm (EA) [15]–[18], bacterialswarming algorithm (BSA) [19], group search optimizer withmultiple producer (GSOMP) [20], harmony search algorithm(HSA) [21], and bees algorithm (BA) [22].
B. Analytical Techniques [23]–[33]
Contrasting with the previous heuristic approaches, analyt-ical methods are preferred by some authors to allocate FACTSdevices in order to suit a given system need. For example, in[23] and [24], analyses of the power system Jacobian matrixsingularity were used. Also, in [25]–[27] the authors used theline flow index (LFI) as their allocation criterion. In [28] thepower-angle characteristic was used to locate the FACTS de-vices. The extended voltage phasors approach (EVPA) [29],mixed integer linear programming (MILP) [30]–[32], and lo-cational marginal price (LMP) [33] are yet other methods in thesecond category.Another categorization can be made as follows, based on the
number and variety of devices involved:
C. Single-Type FACTS Device Allocation
The assumption here is that a single type of device is to besited at a given number of optimally chosen locations. TheFACTS placement procedure then starts to find the optimallocations and values for the selected device such as: SVC [6],
0885-8950/$31.00 © 2012 IEEE

This article has been accepted for inclusion in a future issue of this journal. Content is final as presented, with the exception of pagination.
2 IEEE TRANSACTIONS ON POWER SYSTEMS
[24], [31], STATCOM [14], [28], TCSC [7], [34], and UPFC[8], [9], [13], [16], [18], [23], [27], [36].
D. Multiple-Type FACTS Devices Allocation
Adopting a mix of different types of FACTS devices allowsthe benefits of each singular type to be included. For example,in some papers, three or four types of FACTS device such asTCSC, TCVR, TCPST, SVC [5], [15], [19], [20] were usedtogether. In [10] and [11] the UPFC added to the other fourFACTS above. In this context, the optimization procedure usu-ally finds the optimal types, locations and values of the variousFACTS devices simultaneously. All FACTS devices except theUPFC have one optimal location and one optimal rating number.Based on the UPFCmodeling, which will be recapitulated in theAppendix, this device has three operating values. In contrast toprevious multiple-type research [10], [11], this paper includesthe UPFC with three operating values together with other de-vices that have one operating value only. Some papers also dis-cussed the optimal number of FACTS devices in addition to theabove variables [4], [5], [34], [35].After these introductory remarks, we will now proceed
to give an overall description of this paper. A Matlab-basedgraphical user interface (GUI), called the FACTS PlacementToolbox, which uses the genetic algorithm as its optimizationmethod, is presented. The tunable parameters of the geneticalgorithm should be determined by the user. Using GA putsthis paper in the first category of allocation methods discussedabove. Regarding the second categorization, we will performthe placement procedure for five types of FACTS devicessimultaneously: SVC, TCSC, TCVR, TCPST and UPFC. Theuser has the opportunity to select the desired number and typesamong them. The power network also should be selected bythe user from a large number of IEEE test networks. The opti-mization process will then find the optimal locations and valuesof the given number of FACTS in the selected power systemnetwork in order to maximize the power system loadability [5],[6], [14], [31].The paper is organized as follows. The FACTS device
influences on power flow equation is given in Section II. InSection III, the general concepts of the genetic algorithm,a definition of the objective function and, also, the detailsof the optimization process will be presented. Section IVdescribes the concept implementation using a generic GUIwhich facilitates assessment of a wide-range of situations. Todemonstrate the performance of the FACTS Placement Toolboxand then to verify it, detailed simulation studies are presentedin Section V. Section VI presents the allocation results for oneSVC in Hydro-Québec network. Section VII discusses aboutthe obtained results and Section VIII concludes the paper.
II. FACTS DEVICES INFLUENCES ON POWER FLOW
Based on the type of compensation, we could have three dif-ferent categories for different types of FACTS devices:• Shunt controllers such as SVC and STATCOM.• Series controllers such as TCSC, TCPST and TCVR.• Combined shunt-series controllers such as UPFC.
Fig. 1. FACTS devices: (a) SVC. (b) TCVR. (c) TCSC. (d) TCPST. (e) UPFC.
Fig. 2. Impacts of FACTS devices on the variables involved in the active powerflow equation.
Each of the above FACTS devices has its own properties andcould be used for a specific goal [38]. The modeling of theFACTS devices presented in Fig. 1, which would be used for ourpower flow calculations in Matpower [37], is explained brieflyin the Appendix.Here, we just consider the influence of FACTS devices pre-
sented in Fig. 1, separately, on the power transmitted on a linebetween two buses and . The active and reactive power flowequations transmitted on a line can be presented as (1) and (2)respectively:
(1)
(2)
where and are the voltage magnitudes of buses and ,is the line reactance and is the difference anglebetween phasors and . In normal power system operation,is small and the voltage magnitudes are typically 1.0 p.u. We
can therefore easily decouple the active and reactive power con-trols from each other. While the active power flow is influencedby and , the reactive power flow is related to the value of
and . Fig. 2 shows the active power flow equationbetween two buses and and it is the variables that can becontrolled by each FACTS device [38].

This article has been accepted for inclusion in a future issue of this journal. Content is final as presented, with the exception of pagination.
GHAHREMANI AND KAMWA: OPTIMAL PLACEMENT OF MULTIPLE-TYPE FACTS DEVICES 3
Fig. 3. (a) Original individuals. (b) Mutation on each single individual.(c) Crossover between two original individuals.
III. OPTIMIZATION PROCESS
A. Genetic Algorithm
The genetic algorithm is a kind of stochastic method forsolving both constrained and unconstrained optimization prob-lems based on the mechanism of natural selection. The geneticalgorithm repeatedly modifies a population of individual so-lutions. At each step, some individuals are randomly selectedfrom the current population to be parents for the next gen-eration. Over successive generations, the population evolvestoward an optimal solution [39], [40].The genetic algorithm begins by creating a random initial
population. To take an example, assume the two individuals inFig. 3(a) as an initial population. The algorithm then creates asequence of new populations. This is done by ranking the mem-bers of the current population according to their fitness values.Some of the individuals in the current population that have thebest fitness value are chosen as elite children. These elite indi-viduals are passed on to the next population. In addition to elitechildren, there are two other methods for generating a new childpopulation: Mutation and Crossover.Mutation children are generated by randomly changing the
genes of a single individual parent [see Fig. 3(b)] and thecrossover children created by combining pairs of parents in thecurrent population as the third type of children [see Fig. 3(c)].Finally, the current population will be replaced with selected
children to form the next generation. The algorithm stops whenone of the stopping criteria, such as the number of generations,time limit, and fitness limit, is met [40].
B. Objective Function of Optimization Process
The goal of our optimization process is to maximize thesystem loadability (transmitted power) on the network withoutany bus voltage violation or branch loading.
In order to achieve this objective, the load factor of thenetwork will be increased in an iterative optimization processas follows. At initial condition is equal to 1 .First of all, the generating powers in generation buses (PG
buses) are modified as in (3):
(3)
where is the initial power generation at bus and isthe modified power generation.Then, for the load buses (PQ buses) the active and reactive
demands ( and ) are modified as (4):
(4)
where and are the initial active and reactive loadpower at bus and and are the modified values.At each iteration, according to (3) and (4), the load factor
is increased and the optimization constraints, which are busvoltage violation and branch loading, are verified. When it isno longer possible to satisfy the constraints, it is concluded thatthe maximum loadability has been reached. This is in fact amulti-stage greedy algorithm that follows the solving heuristicof making the locally optimal choice at each stage in the hope offinding a global optimum. On some problems, a greedy sequen-tial strategy need not produce an optimal solution, but nonethe-less a greedy heuristic may yield locally optimal solutions thatapproximate a global optimal solution.The corresponding objective function which maximizes the
power system loadability could be formalized as follows:
(5)
subject to the following security constraints:
(6)
(7)
(8)
where is the maximum value for the apparent power ofthe line , is the current apparent power of the line andis the difference between the nominal voltage at bus and thecurrent voltage, is the generation at bus , andare minimum and maximum bounds on , respectively.In order to simplify enforcement of the process constraints
while placing FACTS at random locations, let us define a fitnessfunction (Fit) such as to include two terms targeting separately,branch overloading (OVL) and second term is related to busvoltage violations (VLB):
(9)
This article has been accepted for inclusion in a future issue of this journal. Content is final as presented, with the exception of pagination.
4 IEEE TRANSACTIONS ON POWER SYSTEMS
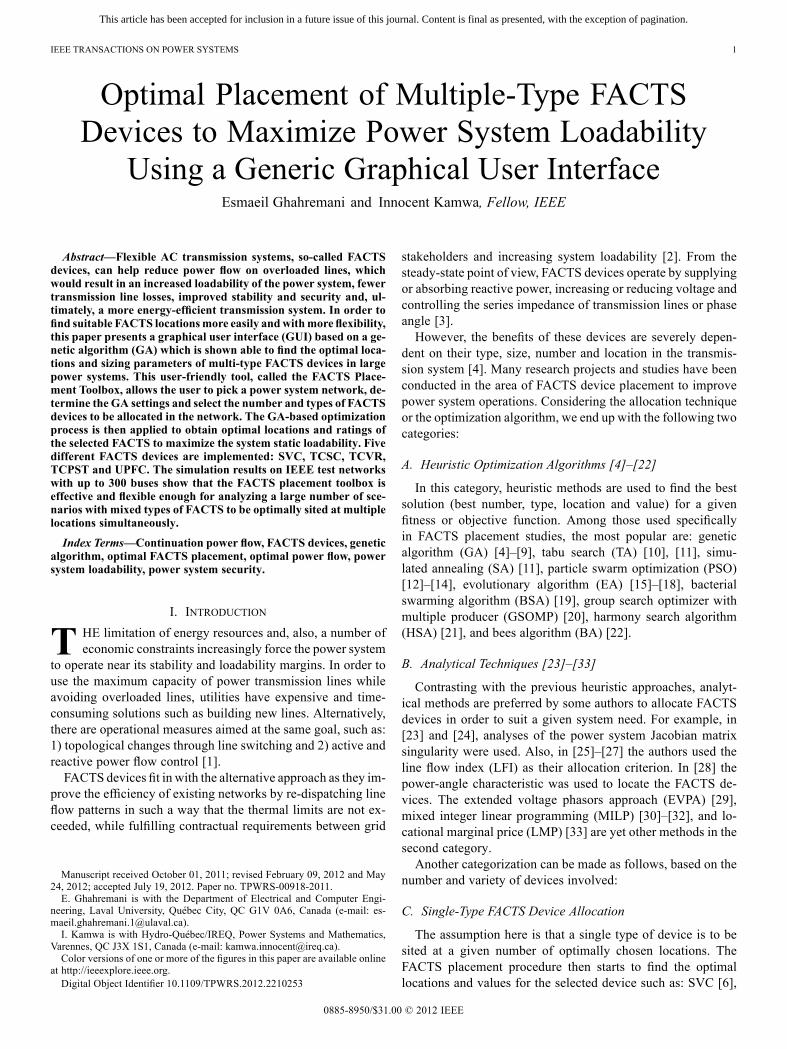
Fig. 4. Main graphical user interface of FACTS placement toolbox.
with
;if
;if
;if;if
(10)
where , and were defined in (6)–(8) and the pa-rameters and are constant coefficients.This means that, if the constraints are fulfilled, each term of
the fitness function in (10) (OVL and VBL) will be equal to 1and the value of the fitness function (Fit) in (9) will be equalto zero. On the other hand, if the constraints are not met, theabove-defined fitness function penalizes overloaded branchesand over- or under-voltage buses. In summary, the optimizationprocess of the GUI implemented to find the maximum loadingfactor (maximum system loadability) could be presentedas follows:1) Step 1: Initialize , select the number and types ofFACTS device and load selected network.
2) Step 2: Increase , create an initial populationof genetic algorithms and then verify the constraint satis-faction for each individual by means of the fitness func-tion (Fit) presented in (9). If there is any individual with
, it means that at current load factor we have aconfiguration that satisfies the security constraints and as aresults we should increase the load factor.
3) Step 3: If there is any individual with fitness function (Fit)equal to zero repeat step 2. This loop continues until wereach to a load factor for which there is no individualwith a fitness function equal to zero. This means that at
this load factor, there is no configuration of FACTS de-vice which can bring the network voltage level and loadingconstraints into acceptable ranges. At this point, we shouldreport the previous load factor corresponding to maximumload factor and previous individual with zero valueof (Fit) which includes optimal locations and values of se-lected FACTS device. (see Fig. 5)
In summary, the global optimization (5) is a complex,possibly untrackable problem which is converted into severalsimpler sequential optimization problems. In fact, the globalproblem solving requires a continuation power flow to find theobjective function while the greedy problem solving only relieson ordinary power flows to enforce security constraints (6)–(8)at each stress level. The pitfall is that there is no guaranty ofglobal optimum, only the certainty to obtain one solution, at agiving stress level.
IV. GRAPHICAL USER INTERFACE DESCRIPTION:FACTS PLACEMENT TOOLBOX
A. Main GUI
The overall view of the implemented GUI is presented inFig. 4. To start, the user should choose between single and mul-tiple type FACTS device allocation, followed by the type andnumber of FACTS to be allocated (SVC, TCSC, etc.). The nextstep is to determine the genetic algorithm settings which are:number of generations, initial population size, number of elitechildren, ratio of crossover fraction, fitness limit and time limit.Finally, the user can pick a network among several IEEE test
systems whose complexity at present ranges from four to 300buses. However, more test systems are being added and, also,

This article has been accepted for inclusion in a future issue of this journal. Content is final as presented, with the exception of pagination.
GHAHREMANI AND KAMWA: OPTIMAL PLACEMENT OF MULTIPLE-TYPE FACTS DEVICES 5
Fig. 5. Flowchart of overall procedure of FACTS placement toolbox.
integration of a full Hydro-Québec PSS/E based network is alsodeveloped.
B. Running FACTS Placement Procedure
The flowchart of the FACTS placement procedure using theimplemented GUI is depicted in Fig. 5. Since the UFPC de-vice has three controllable variables while the other FACTS de-vices have just one; we should classify the coding program intofour different categories based on selecting or not selecting theUPFC:1) Single-type allocation except UPFC.2) Single UPFC allocation.3) Multiple-type allocation without UPFC.4) Multiple-type allocation including UPFC.Based on the four above categories, we will have different
types of individual for the genetic algorithm optimizationprocess. For example, typical individuals for the third andfourth categories are shown in Fig. 6(a) and (b), respectively.As is clear from Fig. 6, the first part of each individual’s string
is related to the FACTS type. For each specific FACTS devicethere is a specific code, namely: 1 for SVC, 2 for TCSC, 3 forTCVR, 4 for TCPST and 5 for UPFC. In the examples of Fig. 6,since we have five FACTS devices , the FACTStypes slot shown in the individual’s string has five columns. Thenumber of total columns of each individual’s stringcan be calculated by: .The second slot of each individual’s string corresponds to the
locations associated with the first slot in the string. Each specificFACTS device has its own location. Repeated locations are not
Fig. 6. Typical example of an individual of multi-type FACTS device alloca-tion: (a) without UPFC and (b) including UPFC.
allowed in our optimization process and each line or bus shouldappear only once in the string.The third and last part of the individual’s string includes the
rating values of the FACTS devices, which are normalized be-tween 0 and 1 with 0 corresponding to the minimum value ofthe device and 1 to the maximum.To use these normalized values in the power flow calcula-
tions, we need to convert them to physical real values of thedevice as follows in (11) [5]:
(11)
where and are the minimum and maximum valuesfor each specific device, which were presented in (12)–(19).The optimization algorithm (GA) randomly selects the loca-
tions and values for all given FACTS devices after setting theminto the power system at each generation. The fitness function(Fit) is then calculated for each individual. If the constraints aremet, the value of the fitness function (Fit) in (9) will be equal to0; otherwise it will be greater than 0.Based on the fitness function value, the genetic algorithm
performs the GA operations such as elite generation, mutationand crossover for creating the next generation. These opera-tions continue based on the algorithm presented in Section III-B.Then in a specific generation, the maximum system loadability
will be determined while the security constraints arefulfilled.In [5] it is shown that for each specific network there is a max-
imum number of FACTS devices and that, with more FACTSthan the maximum, the network loadability cannot be furtherimproved.
V. RESULTS OF FACTS PLACEMENT ON IEEE TEST NETWORKS
In order to verify the performance of the implemented GUI,several combinations of FACTS devices were sited optimally ondifferent IEEE test networks. The allocation results of a selectedsubset of the many scenarios studied are presented in Table I.
A. 57-Bus Test System
The third scenario in Table I, the 57-bus test system, ischosen for a detailed presentation to demonstrate how thedifferent modules of the GUI work. In this simulation, thefollowing combination was selected by the GUI user as the
This article has been accepted for inclusion in a future issue of this journal. Content is final as presented, with the exception of pagination.
6 IEEE TRANSACTIONS ON POWER SYSTEMS
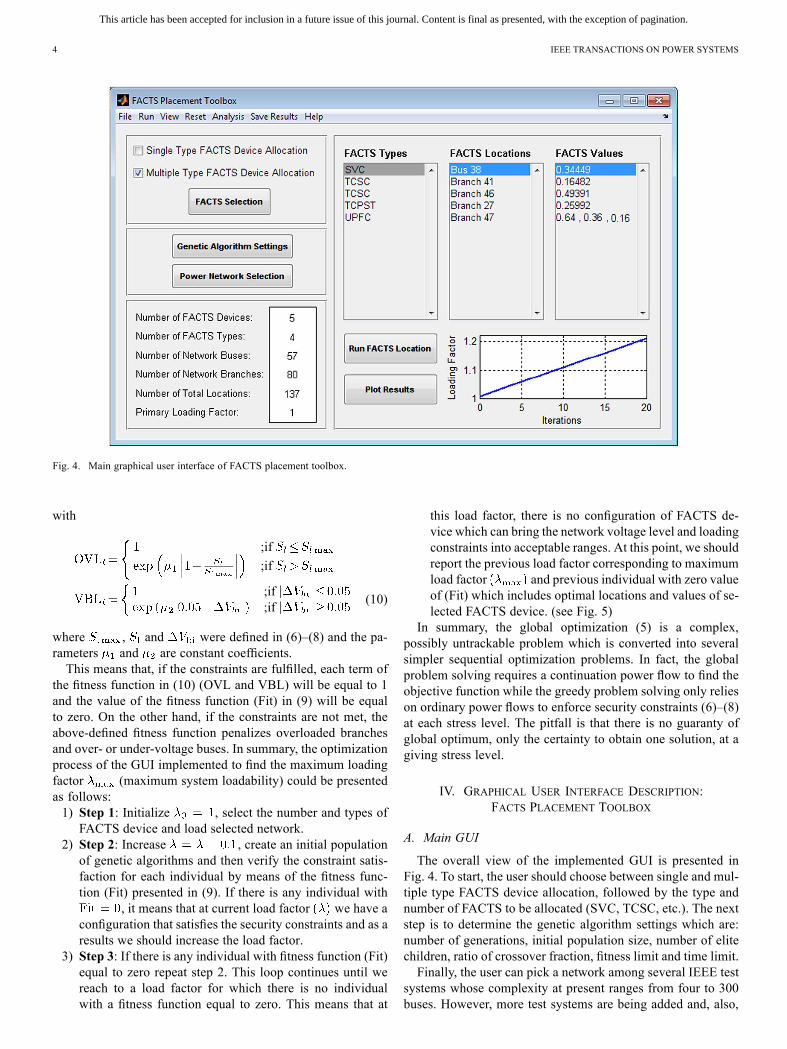
TABLE IFACTS PLACEMENT TOOLBOX RESULTS
input FACTS device types with corresponding numbers: SVC(1), TCSC (2), TCPST (1), and UPFC (1).After selection of the FACTS combination, the pa-
rameters of the genetic algorithm are set as follows:, ,, and ,
1e-6 which is the limit for (Fit) in (9) and.
As mentioned before, the SVC is the only device that can beallocated in both buses and branches. While we have the SVCin our selection, the total locations would be 137 (57 buses plus80 branches), which is presented in the table in Fig. 4.Pushing the “Run FACST Location” button starts the allo-
cation process and we would see the FACTS placement resultspresented in Fig. 4. The physical meanings of the normalizedvalues in this figure are presented in Table I (57-bus test systemsection). Also, the maximum loading factor for this given setof FACTS devices in the 57-bus test system was determined as
, which means that by installing the above set ofdevices at those optimal locations with those rated values, wewill have a 21% improvement in the system loadability whilefulfilling all the security constraints (6)–(8).Finally, pushing the “Plot Results” button in Fig. 4, produces
comparative figures. To save space, we present just four typicalresults. First, let consider the bus voltages of the networks with
and without FACTS devices at the maximum load factorand for a load factor specified by user .For the 57-bus system case study, these graphs are presented
for and in in Fig. 7(a) and (b), respec-tively. As is clear from these plots, under the same loadabilitycondition, the network without FACTS devices has a greatervoltage drop in the buses. This confirms the significant influenceof FACTS devices on keeping the bus voltage in the acceptableranges.Another plot is the V-P graph for one specific bus which
should be the PQ bus (load bus), to check the system loadabilityimprovement. Here, the bus number 40 is selected for the V-Pgraph as presented in Fig. 8.The reduction of transmission line losses in the network with
FACTS devices is also presented in the last column of Table I.For each network, there is a load threshold factor (LRI:loss reduction improvement) above which we observe a reduc-tion in transmission line losses. This means that there is no guar-antee to always reduce power system losses using FACTS de-vices if the main target of FACTS placement is to increase load-ability.Fig. 9 presents the total loss associated with the 57-bus test
system as a function of the load factor, with andwithout FACTS.The LRI load factor for the 57-bus test system is ,which is the first indication that we have an improvement in

This article has been accepted for inclusion in a future issue of this journal. Content is final as presented, with the exception of pagination.
GHAHREMANI AND KAMWA: OPTIMAL PLACEMENT OF MULTIPLE-TYPE FACTS DEVICES 7
Fig. 7. Comparison of voltage magnitudes of all buses in 57-bus test systemfor: (a) maximum load factor and (b) for user-selected load factor
. The “Nominal bus voltages” curve corresponds to the voltageprofile without FACTS at .
Fig. 8. Comparing the graph for the selected bus by the user bus 40 intwo conditions: the network with and without FACTS.
system losses. For example, in the 57-bus test system, at, we will have 10 MW (0.71%) loss reduction on the trans-
mission lines.Fig. 10(a) and (b) illustrates the influence of the FACTS de-
vices on the VBL and OVL terms of the fitness function, re-spectively. At , the value of VBL for all buses is 1 in thenetwork with FACTS, while in the network without FACTS we
Fig. 9. Total loss of transmission lines in 57-bus test system as a function ofthe load factor.
Fig. 10. Influence of FACTS device on fitness function (Fit) terms: (a) TheVBL term. (b) The OVL term.
have many over- or under-voltage buses. These graphs help usto identify the overloaded lines as well as the over- or under-voltage buses at the maximum load factor.
B. 300-Bus Test System
For the second case study, the 300-bus test system is chosento verify the performance of the FACTS Placement Toolbox.

This article has been accepted for inclusion in a future issue of this journal. Content is final as presented, with the exception of pagination.
8 IEEE TRANSACTIONS ON POWER SYSTEMS
Fig. 11. Comparison of voltage magnitudes of all buses in 300-bus test system for maximum load factor .
Fig. 12. Total loss of transmission lines in 300-bus test system as a function ofload factor.
The following combination of the FACTS devices with thecorresponding numbers was selected for this case study: SVC(2), TCSC (2), TCVR (1), TCPST (1), and UPFC (1). Theresults obtained for the allocation process are presented inTable I.The maximum load factor for this set of FACTS devices in
the 300-bus test system was determined as , whichmeans that by installing the above set of devices at those op-timal locations with those rated values, we will have 13% im-provement in the system loadability while fulfilling all the secu-rity constraints (6)–(8). The bus voltages for the networks withand without FACTS devices for are presented inFig. 11 where it is seen that the total absolute voltage deviationis higher for the network without FACTS than for the networkwith FACTS.The total loss of the network for different load factors is pre-
sented in Fig. 12 from which we determine the value ofwith the given set of FACTS devices as equal to 1.08. The lossreduction in the 300-bus test system for is 7 MW andfor is 23 MW.
Fig. 13. New England (39 buses and 10 generators) test system.
The results presented in Table I show that the user can ana-lyze different combinations of FACTS devices on different net-works using the implemented FACTS placement toolbox. Ac-tually, this toolbox presents a generic method which could helpthe user do more studies for a specific goal.For example, we can analyze the influence of any configura-
tion of FACTS devices (single or multiple) on the power systemloadability for a specific power system network. Here we haveperformed one such study for the 39-bus test system (Fig. 13) inSection V-C. We can also analyze the influence of one FACTSdevice combination on different power system networks, as isdone in Section V-D.
C. 39-Bus Test System With Different FACTS Selection
In this section, the influence of different combinations ofFACTS devices, multiple type or single type, with different
This article has been accepted for inclusion in a future issue of this journal. Content is final as presented, with the exception of pagination.
GHAHREMANI AND KAMWA: OPTIMAL PLACEMENT OF MULTIPLE-TYPE FACTS DEVICES 9
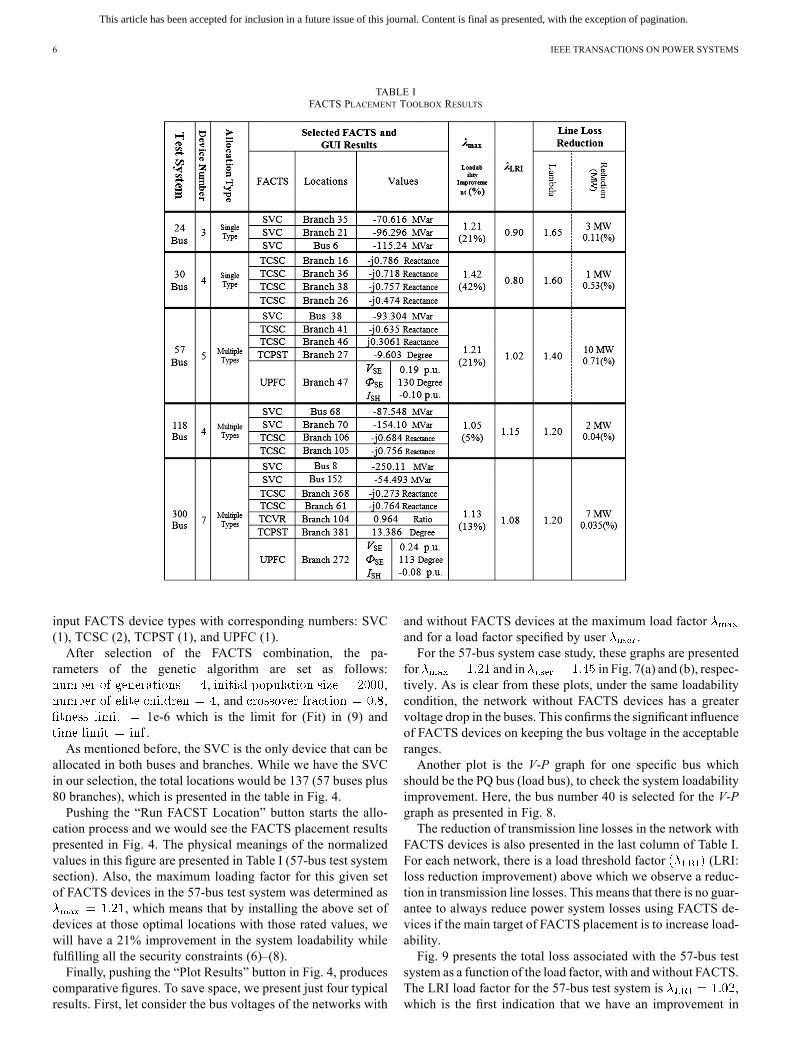
TABLE II39-BUS TEST SYSTEM WITH DIFFERENT CONFIGURATIONS OF FACTS DEVICES
numbers of each, is verified using the toolbox. The NewEngland (39-bus) test system is chosen as the base case forthe study. The same analysis could have been done on othernetworks using the implemented toolbox. The results arepresented in Table II. The loss reduction values in Table IIas a percentage of total load, for five of the configurationsstudied, are: , , and
.By analyzing the selected FACTS device and the corre-
sponding results in Table II, we can better understand theinfluence of each device on the network. For example, 2 SVCcompared to 1 SVC cannot improve the system loadabilitysignificantly. This means that, even if we increase the number(or the size) of the SVC, it is technically impossible to furtherimprove the system loadability.Comparing the results for one TCVR and one TCPST, it can
be seen that the TCVRwould be more effective than the TCPSTin this situation. Another fact observed is that increasing thenumber of TCPSTs (or TCVRs) cannot improve the loadability.In addition, based on the last column of Table II, we can con-clude that the impact of TCPST and TCVR on loss reduction isless than other devices.Also, we notice that increasing the number of UPFCs from
1 to 2 results in no further improvement in system loadability.Considering the loss reduction, 1 UPFC is the most effective de-vice compared to other FACTS devices. Finally, we should men-tion that for the 39-bus test system the maximum load factor,achievable through FACTS device placement with the physicalranges presented in (12)–(19), is 8%. This means that, even if
TABLE IIIINFLUENCE OF ONE CONFIGURATION OF FACTS
DEVICES ON DIFFERENT NETWORKS
we increase the number of FACTS devices, we cannot improvethe loadability by more than 8%.
D. One FACTS Device Combination and Different Networks
In this section, the influence of one multiple-type combina-tion of FACTS device including: SVC (1), TCSC (1), TCVR(1), TCPST (1), and UPFC (1) is verified for different powersystem networks. The results are presented in Table III. To savespace, the locations and values are not presented. By consid-ering the data in this table, it can be concluded that for the largernetworks we need more devices to have significant loadabilityimprovement.For example, if we compare Tables I and III for the 300-bus
network, we see that by using seven FACTS devices we have13% loadability improvement while with five devices the rateis 9%. A similar observation holds for the 118-bus test system.Using the GUI, the simulations of this table can be repeated fordifferent sets of FACTS devices.
VI. SVC PLACEMENT ON HYDRO-QUÉBEC NETWORK
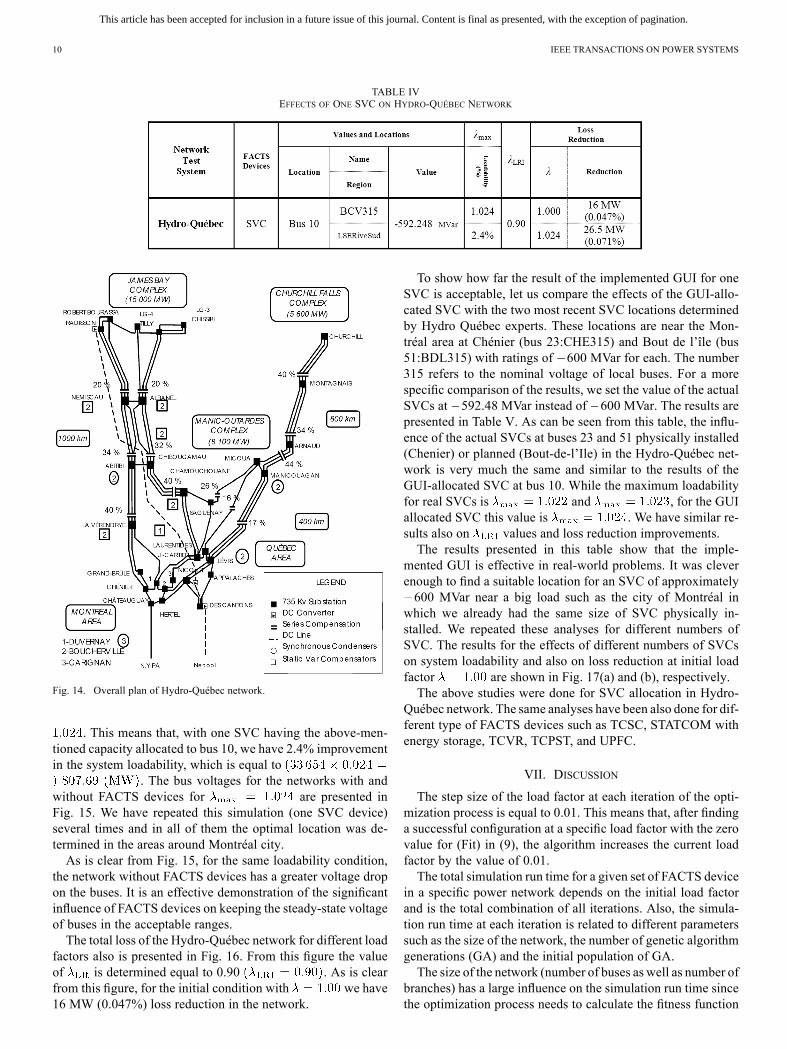
To demonstrate the capability of the implemented GUI inpractical real-world networks, we selected Hydro-Québec (HQ)network with 884 buses and 650 branches as our final casestudy. The MatPower format of this network, which was usedfor power flow calculations, was obtained from the PSS/Eversion of the Hydro-Québec network dated January 29, 2010.The total load of this network is 33 654 (MW) and the totalpower production is 35 474 (MW). An overall view of theHydro-Québec network is schematized in Fig. 14.We studied the influence of all five FACTS devices with dif-
ferent numbers on the Hydro-Québec network using the imple-mented GUI. However, since the SVC is the FACTS devicecommonly used in reality and as well in the Hydro-Québec net-work, in this paper we will present the analysis for the effectsof just one SVC on our network.For this analysis, we modified the step size of the load factorfrom 0.1 to 0.01 and also increased the size of the SVC in
(12) from to .Using the implemented GUI, the result of the allocation of
one SVC is presented in Table IV. As can be seen from this table,for the Hydro-Québec network, with one SVC of 592.248MVar allocated to bus number 10 (BCV315), which is locatedat Boucherville city (see Fig. 14) in the LSERiveSud area (nearMontréal), the maximum load factor was determined as
This article has been accepted for inclusion in a future issue of this journal. Content is final as presented, with the exception of pagination.
10 IEEE TRANSACTIONS ON POWER SYSTEMS
TABLE IVEFFECTS OF ONE SVC ON HYDRO-QUÉBEC NETWORK
Fig. 14. Overall plan of Hydro-Québec network.
. This means that, with one SVC having the above-men-tioned capacity allocated to bus 10, we have 2.4% improvementin the system loadability, which is equal to
. The bus voltages for the networks with andwithout FACTS devices for are presented inFig. 15. We have repeated this simulation (one SVC device)several times and in all of them the optimal location was de-termined in the areas around Montréal city.As is clear from Fig. 15, for the same loadability condition,
the network without FACTS devices has a greater voltage dropon the buses. It is an effective demonstration of the significantinfluence of FACTS devices on keeping the steady-state voltageof buses in the acceptable ranges.The total loss of the Hydro-Québec network for different load
factors also is presented in Fig. 16. From this figure the valueof is determined equal to 0.90 . As is clearfrom this figure, for the initial condition with we have16 MW (0.047%) loss reduction in the network.
To show how far the result of the implemented GUI for oneSVC is acceptable, let us compare the effects of the GUI-allo-cated SVC with the two most recent SVC locations determinedby Hydro Québec experts. These locations are near the Mon-tréal area at Chénier (bus 23:CHE315) and Bout de l’île (bus51:BDL315) with ratings of 600 MVar for each. The number315 refers to the nominal voltage of local buses. For a morespecific comparison of the results, we set the value of the actualSVCs at 592.48 MVar instead of 600 MVar. The results arepresented in Table V. As can be seen from this table, the influ-ence of the actual SVCs at buses 23 and 51 physically installed(Chenier) or planned (Bout-de-l’Ile) in the Hydro-Québec net-work is very much the same and similar to the results of theGUI-allocated SVC at bus 10. While the maximum loadabilityfor real SVCs is and , for the GUIallocated SVC this value is . We have similar re-sults also on values and loss reduction improvements.The results presented in this table show that the imple-
mented GUI is effective in real-world problems. It was cleverenough to find a suitable location for an SVC of approximately600 MVar near a big load such as the city of Montréal in
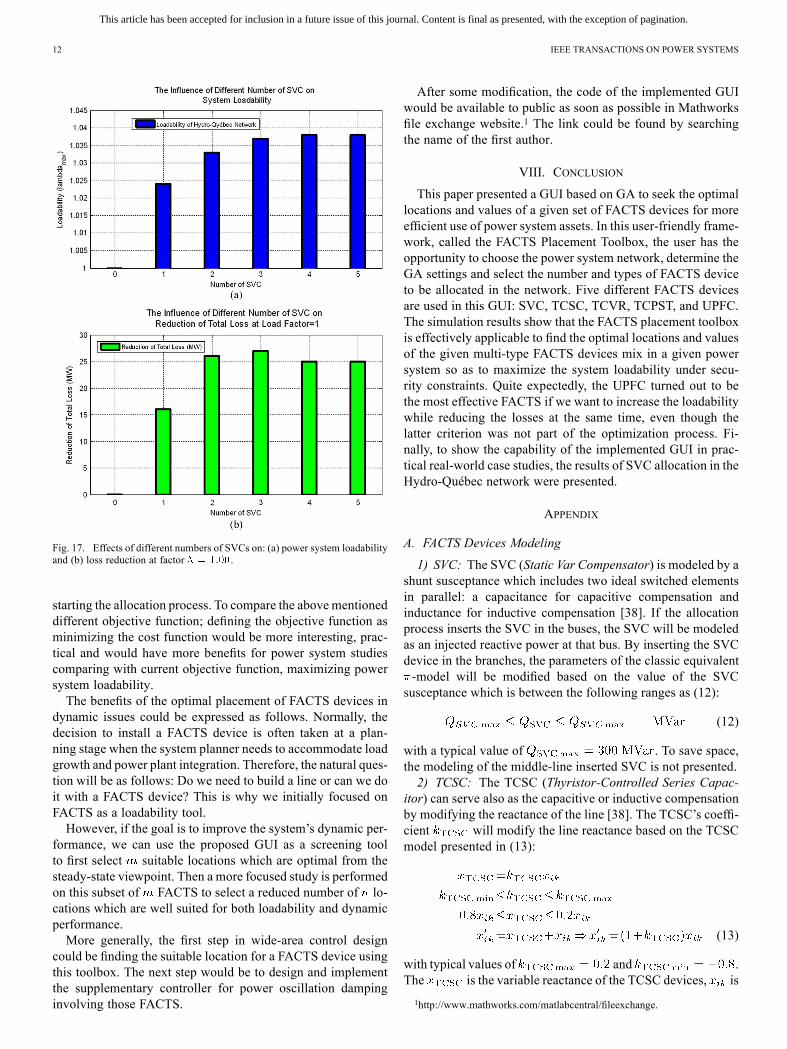
which we already had the same size of SVC physically in-stalled. We repeated these analyses for different numbers ofSVC. The results for the effects of different numbers of SVCson system loadability and also on loss reduction at initial loadfactor are shown in Fig. 17(a) and (b), respectively.The above studies were done for SVC allocation in Hydro-
Québec network. The same analyses have been also done for dif-ferent type of FACTS devices such as TCSC, STATCOM withenergy storage, TCVR, TCPST, and UPFC.
VII. DISCUSSION
The step size of the load factor at each iteration of the opti-mization process is equal to 0.01. This means that, after findinga successful configuration at a specific load factor with the zerovalue for (Fit) in (9), the algorithm increases the current loadfactor by the value of 0.01.The total simulation run time for a given set of FACTS device
in a specific power network depends on the initial load factorand is the total combination of all iterations. Also, the simula-tion run time at each iteration is related to different parameterssuch as the size of the network, the number of genetic algorithmgenerations (GA) and the initial population of GA.The size of the network (number of buses as well as number of
branches) has a large influence on the simulation run time sincethe optimization process needs to calculate the fitness function

This article has been accepted for inclusion in a future issue of this journal. Content is final as presented, with the exception of pagination.
GHAHREMANI AND KAMWA: OPTIMAL PLACEMENT OF MULTIPLE-TYPE FACTS DEVICES 11
Fig. 15. Comparison of voltage magnitudes of all buses in Hydro-Québec network for maximum load factor .
TABLE VCOMPARISON BETWEEN REAL INSTALLED SVC ON HYDRO-QUÉBEC NETWORK WITH SVC ALLOCATED BY GUI
Fig. 16. Total loss of transmission lines in Hydro-Québec system as a functionof load factor.
for each individual at each generation. This is particularly truesince the size of the matrix (Fit) defined in (9) is related to thenumber of buses and branches. At each iteration of the allocation
process, the fitness value should be calculated for all individualsof the current generations.As an example, let us compare two case studies presented in
the paper. With an initial GA population equal to 1000, for the57-bus test system, the simulation running time takes around 5min while for the 300-bus test system, it is 24 min. All the sim-ulations were done on a two-core Intel Toshiba laptop runningat 2.53 GHz with 4.00 GB of RAM memory.Regarding the objective function, we should mention that in
the first version of GUI, we only considered maximizing powersystem loadability as our objective function. However, as pre-sented in the results of this paper, we observed loss reduction insome cases even when the objective function was maximizingloadability. But for the next version of GUI, we could considerother objective functions such as minimizing the transmissionline losses or minimizing the cost of FACTS devices at a givenload factor or under a maximum loadability condition. In thiscase, the implemented GUI could be modified in such a waythat the user can select the desired objective function before
This article has been accepted for inclusion in a future issue of this journal. Content is final as presented, with the exception of pagination.
12 IEEE TRANSACTIONS ON POWER SYSTEMS
Fig. 17. Effects of different numbers of SVCs on: (a) power system loadabilityand (b) loss reduction at factor .
starting the allocation process. To compare the abovementioneddifferent objective function; defining the objective function asminimizing the cost function would be more interesting, prac-tical and would have more benefits for power system studiescomparing with current objective function, maximizing powersystem loadability.The benefits of the optimal placement of FACTS devices in
dynamic issues could be expressed as follows. Normally, thedecision to install a FACTS device is often taken at a plan-ning stage when the system planner needs to accommodate loadgrowth and power plant integration. Therefore, the natural ques-tion will be as follows: Do we need to build a line or can we doit with a FACTS device? This is why we initially focused onFACTS as a loadability tool.However, if the goal is to improve the system’s dynamic per-
formance, we can use the proposed GUI as a screening toolto first select suitable locations which are optimal from thesteady-state viewpoint. Then a more focused study is performedon this subset of FACTS to select a reduced number of lo-cations which are well suited for both loadability and dynamicperformance.More generally, the first step in wide-area control design
could be finding the suitable location for a FACTS device usingthis toolbox. The next step would be to design and implementthe supplementary controller for power oscillation dampinginvolving those FACTS.
After some modification, the code of the implemented GUIwould be available to public as soon as possible in Mathworksfile exchange website.1 The link could be found by searchingthe name of the first author.
VIII. CONCLUSION
This paper presented a GUI based on GA to seek the optimallocations and values of a given set of FACTS devices for moreefficient use of power system assets. In this user-friendly frame-work, called the FACTS Placement Toolbox, the user has theopportunity to choose the power system network, determine theGA settings and select the number and types of FACTS deviceto be allocated in the network. Five different FACTS devicesare used in this GUI: SVC, TCSC, TCVR, TCPST, and UPFC.The simulation results show that the FACTS placement toolboxis effectively applicable to find the optimal locations and valuesof the given multi-type FACTS devices mix in a given powersystem so as to maximize the system loadability under secu-rity constraints. Quite expectedly, the UPFC turned out to bethe most effective FACTS if we want to increase the loadabilitywhile reducing the losses at the same time, even though thelatter criterion was not part of the optimization process. Fi-nally, to show the capability of the implemented GUI in prac-tical real-world case studies, the results of SVC allocation in theHydro-Québec network were presented.
APPENDIX
A. FACTS Devices Modeling
1) SVC: The SVC (Static Var Compensator) is modeled by ashunt susceptance which includes two ideal switched elementsin parallel: a capacitance for capacitive compensation andinductance for inductive compensation [38]. If the allocationprocess inserts the SVC in the buses, the SVC will be modeledas an injected reactive power at that bus. By inserting the SVCdevice in the branches, the parameters of the classic equivalent-model will be modified based on the value of the SVCsusceptance which is between the following ranges as (12):
(12)
with a typical value of . To save space,the modeling of the middle-line inserted SVC is not presented.2) TCSC: The TCSC (Thyristor-Controlled Series Capac-
itor) can serve also as the capacitive or inductive compensationby modifying the reactance of the line [38]. The TCSC’s coeffi-cient will modify the line reactance based on the TCSCmodel presented in (13):
(13)
with typical values of and .The is the variable reactance of the TCSC devices, is
1http://www.mathworks.com/matlabcentral/fileexchange.

This article has been accepted for inclusion in a future issue of this journal. Content is final as presented, with the exception of pagination.
GHAHREMANI AND KAMWA: OPTIMAL PLACEMENT OF MULTIPLE-TYPE FACTS DEVICES 13
the line reactance between buses and and is the updatedvalue for in the presence of TCSC.3) TCVR: The TCVR (Thyristor Controlled Voltage Regu-
lators) is used to change the magnitude of the bus voltage. Wecan represent this device by an ideal tap changer transformerwithout series impedance as follows [38]:
(14)
with a typical value of . The is theequivalent voltage of the TCVR, is the voltage of bus andis the updated value of bus . The zero value for coefficient
means no transformation on voltage.4) TCPST: The TCPST (Thyristor-Controlled Phase
Shifting Transformer), which is modeled by an ideal phaseshifter, is used to regulate the voltage angle between thesending end and receiving end of a transmission line [38]. Theranges for the angles of TCPST in this paper are as (15):
(15)
with a typical value of . The isthe phase of TCPST and would be used to increase or decreasethe angle between two buses and .5) UPFC: The UPFC (Unified Power Flow Controller) is a
device from the third type of FACTS devices, i.e., a combinedshunt-series device. UPFC is a combination of a static com-pensator (STATCOM) and static series compensation (SSSC)as presented in Fig. 1(e) [38]. It is therefore possible to controlsimultaneously all the parameters affecting the power flow inthe transmission line, i.e. voltage, impedance and phase angle.Stated otherwise, it can independently control both the real andthe reactive power flow in the line and voltage magnitude at theUPFC terminals.A simplified schematic representation of the UPFC is given
in Fig. 1(e). The active power required by the series converteris drawn by the shunt converter from the AC network and sup-plied to the bus through the DC link. The output voltage ofthe series converter is added to the nodal voltage of bus toboost the nodal voltage at bus . So, neglecting the loss, the totalpower exchanged between the UPFC and the power system iszero [36], [41], [42].The equivalent circuit of UPFC is presented in Fig. 18. As is
clear from this figure, the series part of UPFC could be mod-eled by a controllable voltage source , the shunt part by acontrollable current source . The voltage magnitude of theoutput provides voltage regulation and the angle is used forphase regulation. The three controllable parameters of the UPFCare , , and where denotes the magnitude ofthe voltage injected in series with the transmission line with theranges [0, ], is the phase angle of this voltage withthe ranges [0, ], and is the shunt reactive current sourceof UPFC with the ranges [3], [36], [43].The computational results indicate that when the UPFC pa-
rameters and/or are set with too large values, load flowconvergence is difficult due to the flat voltage starting method
Fig. 18. Equivalent circuit of UPFC.
chosen. From a practical point of view, other physical limita-tions, such as the insulation level of the power system apparatusand the cost of the UPFC itself, and make it im-possible to assume too large values. In the studies that follow,we have set and [43].Based on the equivalent circuit presented in Fig. 18, the two
power injection in buses and forload flow analysis can be calculated according to the followingexpressions in (16)–(19) [3], [36], [43]:
(16)
(17)
(18)
(19)
where , and .Also, in (17) the value of represents the reactive powerinjected by shunt current source in bus . In our case,since we have used the Matpower branch model, as presentedin the Appendix, the value of is equal to zero, which makes
equal to . Thus, using (16)–(19), it is possible to calculatethe power flow when the allocation process includes the UPFC.
B. Using MatPower Package
In this paper, MatPower software is used for power flowcalculation. Every time the optimization process allocates aFACTS device to a network location (branch or line), we haveto modify the admittance matrix accordingly, based on theFACTS value and its analytical model given in the Appendix.This means that we have to modify the branch structure inthe Matpower software and then use the modified network forpower flow calculation.The admittance matrix convention in MatPower software is
better explained using the corresponding network schematicpresented in Fig. 19.Based on this figure, the admittance matrix in MatPower soft-
ware could be expressed as (20):
(20)
where
(21)

This article has been accepted for inclusion in a future issue of this journal. Content is final as presented, with the exception of pagination.
14 IEEE TRANSACTIONS ON POWER SYSTEMS
Fig. 19. Branch model in Matpower software for power flow analysis [37].
in which is the line resistance, is the line reactance,is shunt susceptance, is tap ratio and is the phase shiftangle. Based on the analytical modeling of the FACTS device,each branch parameter will be modified as well.By way of example, for an SVC allocated in the middle of a
line , and , for TCSC , for TCVR , and for TCPSTwill be modified. For modeling an SVC allocated at the
bus and for modeling a UPFC, we used the injected equivalentactive and reactive power at the buses (16)–(19). Thereupon,we can calculate the power flow of the network using the ap-propriate commands.
ACKNOWLEDGMENT
The authors would like to thank Hydro-Québec Research In-stitute for offering an internship to the first author in order toperform this work. The authors also would like to thank themanager of the Power Systems and Mathematics Departmentfor granted access to the data required for this study.
REFERENCES[1] S. Bruno andM. La Scala, “Unified power flow controllers for security-
constrained transmission management,” IEEE Trans. Power Syst., vol.19, no. 1, pp. 418–426, Feb. 2004.
[2] N. Hingorani, “Flexible AC transmission,” IEEE Spectrum, vol. 30, no.4, pp. 40–45, Apr. 1993.
[3] X. P. Zhang, C. Rehtanz, and B. Pal, Flexible AC Transmission Sys-tems: Modelling and Control. New York: Springer, 2006.
[4] S. Rahimzadeh, M. Tavakoli Bina, and A. Viki, “Simultaneous appli-cation of multi-type FACTS devices to the restructured environment:Achieving both optimal number and location,” IET Gener. Transm.Distrib., vol. 4, no. 3, pp. 349–362, Sep. 2009.
[5] S. Gerbex, R. Cherkaoui, and A. J. Germond, “Optimal placement ofmulti-type FACTS devices in a power system by means of genetic al-gorithms,” IEEE Trans. Power Syst., vol. 16, no. 3, pp. 537–544, Aug.2001.
[6] S. R. Najafi, M. Abedi, and S. H. Hosseinian, “A novel approach tooptimal allocation of SVC using genetic algorithms and continuationpower flow,” in Proc. 2006 IEEE Int. Power and Energy Conf., Nov.28–29, 2006, pp. 202–206.
[7] G. I. Rashed, H. I. Shaheen, and S. J. Cheng, “Optimal location and pa-rameter setting of multiple TCSCs for increasing power system load-ability based on GA and PSO techniques,” in Proc. 2007 IEEE Int.Natural Computation Conf. (ICNC’07), Aug. 24–27, 2007, vol. 4, pp.335–344.
[8] A. Kazemi, D. Arabkhabori, M. Yari, and J. Aghaei, “Optimal locationof UPFC in power systems for increasing loadability by genetic algo-rithm,” in Proc. 2006 IEEE Univ. Power Eng. Conf., Sep. 6–8, 2006,vol. 2, pp. 774–779.
[9] M. Behshad, A. Lashkarara, and A. H. Rahmani, “Optimal location ofUPFC devices considering system loadability, total fuel cost, powerlosses and cost of installation,” in Proc. 2009 IEEE Int. Conf. PowerElectronics and Intelligent Transp. Syst., Dec. 19–20, 2009, vol. 2, pp.1–7.
[10] P. Bhasaputra and W. Ongsakul, “Optimal placement of multi-typeFACTS devices by hybrid TS/SA approach,” in Proc. 2003 IEEE Cir-cuits and Systems (ISCAS’03), May 25–28, 2003, vol. 3, pp. 375–378.
[11] S. Gerbex, R. Cherkaoui, and A. J. Germond, “Optimal placement ofFACTS devices to enhance power system security,” in Proc. 2003 IEEEPower Tech Conf., Jun. 23–26, 2003, vol. 3, pp. 1–6.
[12] M. Saravanan, S. M. R. Slochanal, P. Venkatesh, and P. S. Abraham,“Application of PSO technique for optimal location of FACTS devicesconsidering cost of installation and system loadability,” ELSEVIERElectr. Power Syst. Res., vol. 77, pp. 276–283, Apr. 2007.
[13] S. T. J. Christa and P. Venkatesh, “Application of particle swarm op-timization for optimal placement of unified power flow controllers inelectrical systems with line outages,” in Proc. 2007 IEEE Int. Conf.Computational Intelligence, Dec. 13–15, 2007, vol. 1, pp. 119–124.
[14] E. N. Azadani, S. H. Hosseinian, M. Janati, and P. Hasanpor, “Op-timal placement of multiple STATCOM,” in Proc. 2008 IEEE Int.Middle-East Conf. Power Syst. (MEPCON’08), Mar. 12–15, 2008, pp.523–528.
[15] M. Santiago-Luna and J. R. Cedeno-Maldonado, “Optimal placementof FACTS controllers in power systems via evolution strategies,” inProc. 2006 IEEE Trans. and Dist. Conf. Expo. (TDC 2006), Aug.15–18, 2006, pp. 1–6.
[16] R. P. Kalyani, M. L. Crow, and D. R. Tauritz, “Optimal placementand control of unified power flow control devices using evolutionarycomputing and sequential quadratic programming,” in Proc. 2006IEEE Power Systems Conf. Expo. (PSCE’06), Nov. 29–30, 2006, pp.959–964.
[17] I. Marouani, T. Guesmi, H. H. Abdallah, and A. Quali, “Applicationof a multi-objective evolutionary algorithm for optimal location andparameters of FACTS devices considering the real power loss in trans-mission lines and voltage deviation buses,” in Proc. 2009 IEEE System,Signals and Devices (SSD’09), pp. 1–6.
[18] H. I. Shaheen, G. I. Rashed, and S. J. Cheng, “Application of evolu-tionary optimization techniques for optimal location and parameterssetting of multiple UPFC devices,” in Proc. 2007 IEEE Int. Nat-ural Computation Conf. (ICNC’07), Aug. 24–27, 2007, vol. 4, pp.688–697.
[19] Z. Lu, M. S. Li, W. J. Tang, and Q. H.Wu, “Optimal location of FACTSdevices by a bacterial swarming algorithm for reactive power plan-ning,” in Proc. ’07 IEEE Evolutionary Computing, Sep. 25–28, 2007,pp. 2344–2349.
[20] Q. H. Wu, Z. Lu, M. S. Li, and T. Y. Ji, “Optimal placement of FACTSdevices by a group search optimizer with multiple producer,” in Proc.2007 IEEE Evolutionary Computing (CEC 2008), Jun. 1–6, 2008, pp.1033–1039.
[21] A. Kazemi, A. Parizad, and H. R. Baghaee, “On the use of harmonysearch algorithm in optimal placement of FACTS devices to improvepower system security,” in Proc. 2009 IEEE EURO Conf., May 18–23,2009, pp. 540–576.
[22] R. M. Idris, A. Kharuddin, and M. W. Mustafa, “Optimal choice ofFACCTS devices for ATC enhancement using bees algorithm,” inProc. 2009 IEEE Power Engineering Conf. (AUPEC’09), Sep. 27–30,2009, pp. 1–6.
[23] A. Z. Gamm and I. I. Gloub, “Determination of locations for FACTSand energy storage by the singular analysis,” inProc. 1998 IEEEPowerSystem Technology (POWERCON ’98), Aug. 18–21, 1998, vol. 1, pp.411–414.
[24] A. D. Shakib and G. Balzer, “Optimal location and control of shuntFACTS for transmission of renewable energy in large power sys-tems,” in Proc. 2010 IEEE Mediterranean Electrotechnical Conf.(MELECON 2010), Apr. 26–28, 1998, pp. 890–895.
[25] S. N. Singh and A. K. David, “Optimal location of FACTS devices forcongestion management,” ELSEVIER Electr. Power Syst. Res., vol. 58,no. 2, pp. 71–79, 2001.
[26] S. N. Singh and A. K. David, “Placement of FACTS device in openpower market,” in Proc. 2000 IEEE Power System Control, Operationand Management (APSCOM-2000), Oct. 30–Nov. 1, 2000, vol. 1, pp.173–177.
[27] S. N. Singh and I. Erlich, “Locating unified power flow controller forenhancing power system loadability,” in Proc. 2005 IEEE Int. Conf.Future Power Systems, Nov. 18–21, 2005, pp. 1–5.
[28] M. H. Haque, “Optimal location of shunt FACTS devices in longtransmission lines,” ET Gener. Transm. Distrib., vol. 147, no. 4, pp.218–222, Jul. 2000.
[29] N. K. Sharma, A. Ghosh, and R. K. Varma, “A novel placement strategyfor FACTS controllers,” IEEE Trans. Power Del., vol. 18, no. 3, pp.982–987, Jul. 2003.
This article has been accepted for inclusion in a future issue of this journal. Content is final as presented, with the exception of pagination.
GHAHREMANI AND KAMWA: OPTIMAL PLACEMENT OF MULTIPLE-TYPE FACTS DEVICES 15
[30] A. Sharma, S. Chanana, and S. Parida, “Combined optimal locationof FACTS controllers and loadability enhancement in competitiveelectricity markets using MILP,” in Proc. 2005 IEEE Power Engi-neering Society General Meeting (PES’05), Jul. 12–16, 2005, vol. 1,pp. 670–677.
[31] R.W. Chang and T. K. Saha, “Maximizing power system loadability byoptimal allocation of SVC using mixed integer linear programming,”in Proc. 2010 IEEE Power and Energy Society General Meeting, Jul.25–29, 2010, pp. 1–7.
[32] F. G. M. Lima, F. D. Galiana, I. Kockar, and J. Munoz, “Phase shifterplacement in large-scale systems via mixed integer linear program-ming,” IEEE Trans. Power Syst., vol. 18, no. 3, pp. 1029–1034, Aug.2003.
[33] N. Acharya and N. Mithulananthan, “Locating series FACTS devicesfor congestion management in deregulated electricity markets,” ELSE-VIER Electr. Power Syst. Res., vol. 77, pp. 352–360, May 2006.
[34] L. J. Cai, I. Erlich, and G. Stamtsis, “Optimal choice and allocation ofFACTS devices in deregulated electricity market using GA,” in Proc.2004 IEEE Power Syst. Conf. Expo., Oct. 10–13, 2004, vol. 1, pp.201–207.
[35] S. Rahimzadeh and M. Tavakoli Bina, “Looking for optimal numberand placement of FACTS devices to manage the transmission con-gestion,” ELSEVIER Energy Convers. Manage., vol. 52, no. 1, pp.437–446, Jan. 2010.
[36] M. Noroozian, Angquist, M. Ghandhari, and G. Andersson, “Use ofUPFC for optimal power flow control,” IEEE Trans. Power Del., vol.12, no. 4, pp. 1629–1634, Oct. 1997.
[37] R. D. Zimmermann, C. E. M. Sanchez, and R. J. Thomas, “Matpower:Steady-state operations, planning and analysis tools for power systemsresearch and education,” IEEE Trans. Power Syst., vol. 26, no. 1, pp.12–19, Feb. 2011.
[38] N. G. Hingorani and L. Gyugyi, Understanding FACTS Concepts andTechnology of Flexible AC Transmission Systems. New York: IEEEPress, 1999.
[39] D. E. Golderberg, Genetic Algorithm in Search Optimization and Ma-chine Learning. Reading, MA: Addison-Wesley, 1989.
[40] Matlab Help Documentation, Global Optimization Toolbox User’sGuide, The MathWorks, Inc., 2010.
[41] A. Nabavi-Niaki and M. R. Iravani, “Steady-state and dynamic modelsof Unified Power Flow Controller (UPFC) for power system studies,”IEEE Trans. Power Syst., vol. 11, no. 4, pp. 1937–1943, Nov. 1996.
[42] E. Acha, C. R. Fuerte-Esquivel, H. Ambriz-Perez, and C. Angeles-Camacho, FACTS: Modelling and Simulation in Power Networks.Chichester, U.K.: Wiley, 2004.
[43] W. L. Fang and H. Ngan, “A robust load flow technique for use inpower systems with unified power flow controllers,” Electr. PowerSyst. Res. J., no. 53, pp. 181–186, 2005.
Esmaeil Ghahremani received the B.Sc. and M.Sc.degrees from Amirkabir University of Technology(Teheran Polytechnic), Tehran, Iran, in 2003 and2007, respectively. Then, he received the Ph.D.degree from Laval University, Québec City, QC,Canada, in August 2012 in the area of power systemstability under Prof. Kamwa’s supervision.His research interests include power system
stability studies, dynamic state estimation of powersystem, FACTS placement, and wide area control ofpower system.
Innocent Kamwa (S’83–M’88–SM’98–F’05)received the Ph.D. degree in electrical engineeringfrom Laval University, Québec City, QC, Canada, in1988.Since then, he has been with the Hydro-Québec
Research Institute (IREQ), Power System Analysis,Operation, and Control, Varennes, QC, Canada,where he is currently a Principal Researcher inbulk system dynamic performance. He has beenan Associate Professor of electrical engineering atLaval University since 1990.
Dr. Kamwa has been active for the last 13 years on the IEEE Electric Ma-chinery Committee, where he is presently the Standards Coordinator. Amemberof CIGRÉ and a registered professional engineer, he is a recipient of the 1998,2003, and 2009 IEEE Power Engineering Society Prize Paper Awards and is cur-rently serving on the Adcom of the IEEE System Dynamic Performance Com-mittee.