Optimal Layout Design by Line Balancing Using …ieomsociety.org/bogota2017/papers/56.pdf ·...
18
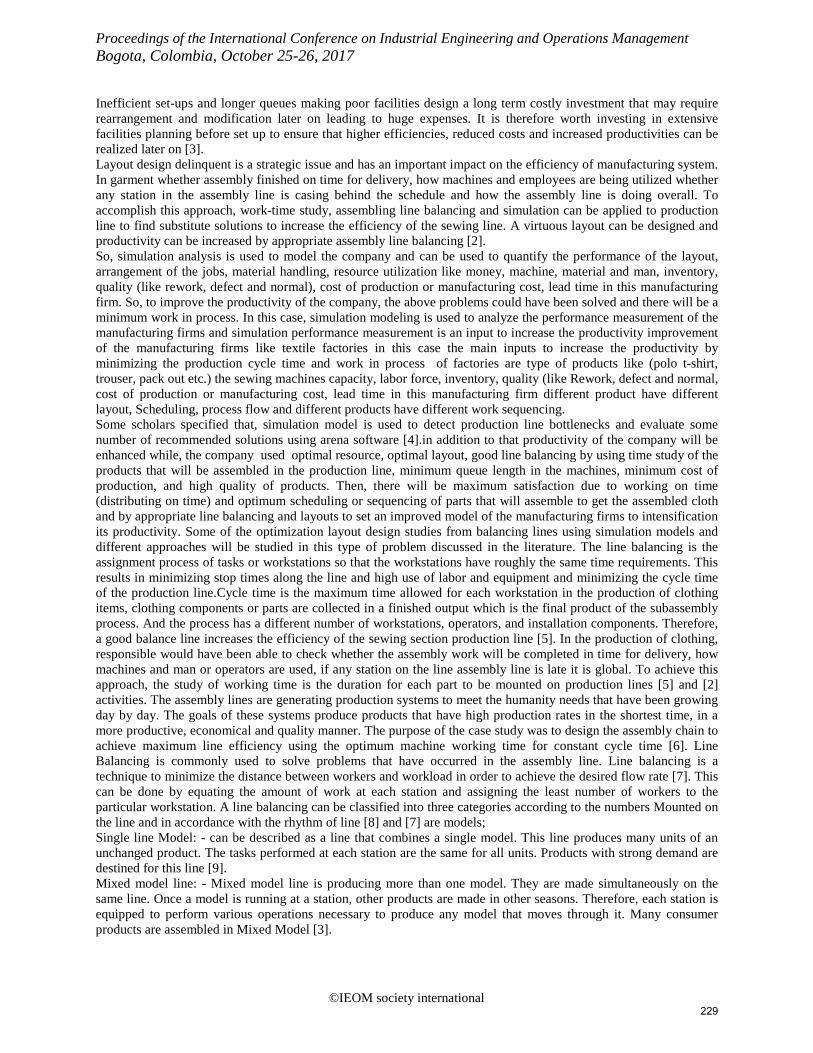
Proceedings of the International Conference on Industrial Engineering and Operations Management Bogota, Colombia, October 25-26, 2017 Optimal Layout Design by Line Balancing Using Simulation Modeling (Case Study on MAA Garment and Textile Factory) Aregawi yemane 1 Bahir dar institute of technology, industrial engineering, Bahir Dar, Ethiopia [email protected], Serajul haque 2 Bahir dar institute of technology, industrial engineering, Bahir Dar, Ethiopia [email protected] Iván Santelices Malfanti 3 Universidad del Bío-Bío, Departamen to Ingeniería Industrial, Concepción, Chile [email protected] Abstract This study deals with optimal layout design by line balancing using simulation modeling. Modeling and simulation are potential tools for analysis of the assembly lines like apparel of a garment manufacturing. The experiment controls the resources of the assembly line process without affecting the real production system. In this study the Arena software, AutoCAD and POM software are employed to model and measure the performance of the existing sewing line of the Ronny t-shirt model. The t-shirt has 12 major parts to be assembled. For each activity, the researcher has taken 15 sampling observations using stopwatch. All the collected data are statistically analyzed using arena input analyzer for statistically significance and determination of expressions to be used to the simulation modeling. Standard simulation model was developed and run for 160 replications. The result shows the line is operating with a line balance efficiency of 72.56%. In the course of action using Opt Quest different types of scenarios had been developed and line balance efficiency increase to 75.3% and the company saves 518,400 birr per year that spent for salary. This arena simulation model has considered the production resources, processing time of each activity and testing different scenarios. Keywords: - Layout, Line Balance, Opt Quest, Optimization, simulation modeling INTRODUCTION Ethiopian clothing industries face many problems that have not become competitive globally. These problems include; the poor performance of products in the export market, poor quality and inadequate supply of raw materials, low productivity and poor resource utilization. Because of those, most of the country's textile companies are not lucrative and most are in great loss [1]. Layout design is key concern to organize operations in such a way as to maximize resource usage and overall system throughput. The level of layout facility determines the efficiency of the entire delivery operation in the system. Improper layout of facilities is detrimental to operations. Any existing bottleneck in the system results in long queues, long waiting times, stock outs, high operating costs, low throughput and overall system inefficiency. Such a system would operate below capacity. Properly planned and arranged workstations on available facility space, with optimal assignment of available resources, are expedient for the maximization of resource capacity and the level of efficiency of operations [2]. Several studies have focused on the facility layout problem, a segment of facility layout that focuses on the arrangement of departments, work stations and storage areas for an existing or proposed facility such that the most efficient use of all resources involved is realized. Poor layout designs lead to accumulation of work-in-process (WIP), ©IEOM society international 228
Transcript of Optimal Layout Design by Line Balancing Using …ieomsociety.org/bogota2017/papers/56.pdf ·...
Proceedings of the International Conference on Industrial Engineering and Operations Management Bogota, Colombia, October 25-26, 2017
Optimal Layout Design by Line Balancing Using Simulation Modeling
(Case Study on MAA Garment and Textile Factory)
Aregawi yemane1 Bahir dar institute of technology, industrial engineering, Bahir Dar, Ethiopia
Serajul haque2 Bahir dar institute of technology, industrial engineering, Bahir Dar, Ethiopia
Iván Santelices Malfanti3
Universidad del Bío-Bío, Departamen to Ingeniería Industrial, Concepción, Chile [email protected]
Abstract
This study deals with optimal layout design by line balancing using simulation modeling. Modeling and simulation are potential tools for analysis of the assembly lines like apparel of a garment manufacturing. The experiment controls the resources of the assembly line process without affecting the real production system. In this study the Arena software, AutoCAD and POM software are employed to model and measure the performance of the existing sewing line of the Ronny t-shirt model. The t-shirt has 12 major parts to be assembled. For each activity, the researcher has taken 15 sampling observations using stopwatch. All the collected data are statistically analyzed using arena input analyzer for statistically significance and determination of expressions to be used to the simulation modeling. Standard simulation model was developed and run for 160 replications. The result shows the line is operating with a line balance efficiency of 72.56%. In the course of action using Opt Quest different types of scenarios had been developed and line balance efficiency increase to 75.3% and the company saves 518,400 birr per year that spent for salary. This arena simulation model has considered the production resources, processing time of each activity and testing different scenarios.
Keywords: - Layout, Line Balance, Opt Quest, Optimization, simulation modeling
INTRODUCTION Ethiopian clothing industries face many problems that have not become competitive globally. These problems include; the poor performance of products in the export market, poor quality and inadequate supply of raw materials, low productivity and poor resource utilization. Because of those, most of the country's textile companies are not lucrative and most are in great loss [1]. Layout design is key concern to organize operations in such a way as to maximize resource usage and overall system throughput. The level of layout facility determines the efficiency of the entire delivery operation in the system. Improper layout of facilities is detrimental to operations. Any existing bottleneck in the system results in long queues, long waiting times, stock outs, high operating costs, low throughput and overall system inefficiency. Such a system would operate below capacity. Properly planned and arranged workstations on available facility space, with optimal assignment of available resources, are expedient for the maximization of resource capacity and the level of efficiency of operations [2]. Several studies have focused on the facility layout problem, a segment of facility layout that focuses on the arrangement of departments, work stations and storage areas for an existing or proposed facility such that the most efficient use of all resources involved is realized. Poor layout designs lead to accumulation of work-in-process (WIP),
©IEOM society international 228
Proceedings of the International Conference on Industrial Engineering and Operations Management Bogota, Colombia, October 25-26, 2017
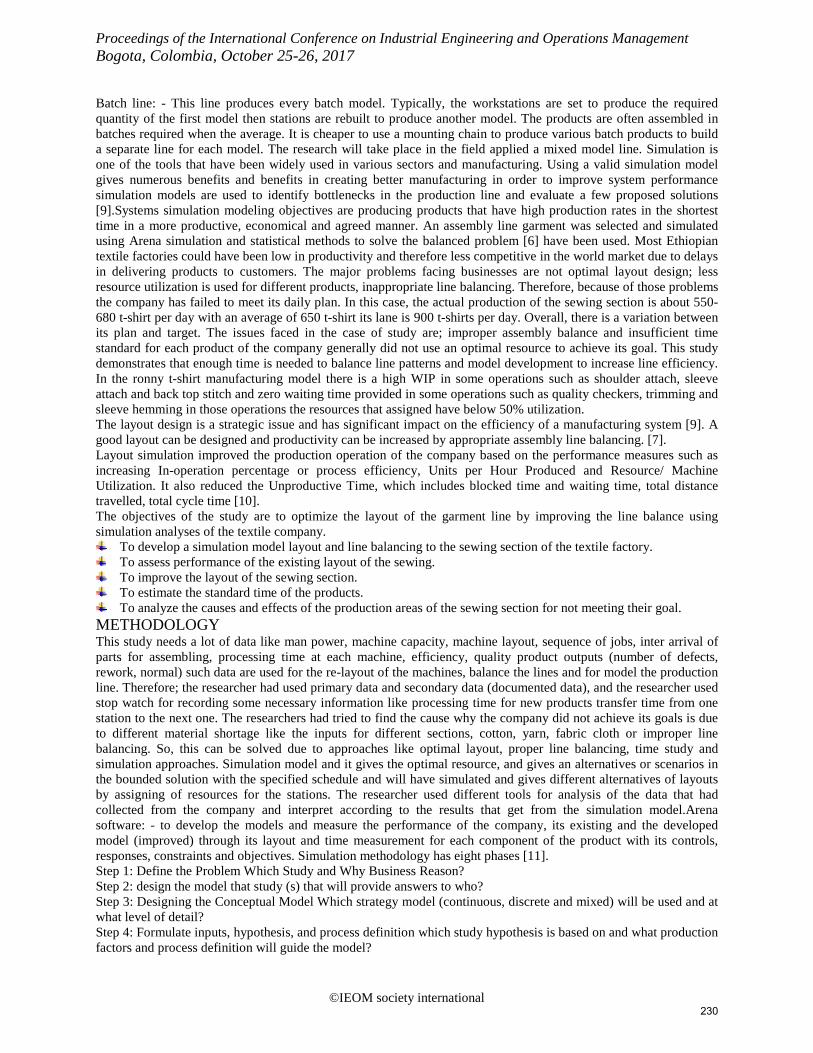
Inefficient set-ups and longer queues making poor facilities design a long term costly investment that may require rearrangement and modification later on leading to huge expenses. It is therefore worth investing in extensive facilities planning before set up to ensure that higher efficiencies, reduced costs and increased productivities can be realized later on [3]. Layout design delinquent is a strategic issue and has an important impact on the efficiency of manufacturing system. In garment whether assembly finished on time for delivery, how machines and employees are being utilized whether any station in the assembly line is casing behind the schedule and how the assembly line is doing overall. To accomplish this approach, work-time study, assembling line balancing and simulation can be applied to production line to find substitute solutions to increase the efficiency of the sewing line. A virtuous layout can be designed and productivity can be increased by appropriate assembly line balancing [2]. So, simulation analysis is used to model the company and can be used to quantify the performance of the layout, arrangement of the jobs, material handling, resource utilization like money, machine, material and man, inventory, quality (like rework, defect and normal), cost of production or manufacturing cost, lead time in this manufacturing firm. So, to improve the productivity of the company, the above problems could have been solved and there will be a minimum work in process. In this case, simulation modeling is used to analyze the performance measurement of the manufacturing firms and simulation performance measurement is an input to increase the productivity improvement of the manufacturing firms like textile factories in this case the main inputs to increase the productivity by minimizing the production cycle time and work in process of factories are type of products like (polo t-shirt, trouser, pack out etc.) the sewing machines capacity, labor force, inventory, quality (like Rework, defect and normal, cost of production or manufacturing cost, lead time in this manufacturing firm different product have different layout, Scheduling, process flow and different products have different work sequencing. Some scholars specified that, simulation model is used to detect production line bottlenecks and evaluate some number of recommended solutions using arena software [4].in addition to that productivity of the company will be enhanced while, the company used optimal resource, optimal layout, good line balancing by using time study of the products that will be assembled in the production line, minimum queue length in the machines, minimum cost of production, and high quality of products. Then, there will be maximum satisfaction due to working on time (distributing on time) and optimum scheduling or sequencing of parts that will assemble to get the assembled cloth and by appropriate line balancing and layouts to set an improved model of the manufacturing firms to intensification its productivity. Some of the optimization layout design studies from balancing lines using simulation models and different approaches will be studied in this type of problem discussed in the literature. The line balancing is the assignment process of tasks or workstations so that the workstations have roughly the same time requirements. This results in minimizing stop times along the line and high use of labor and equipment and minimizing the cycle time of the production line.Cycle time is the maximum time allowed for each workstation in the production of clothing items, clothing components or parts are collected in a finished output which is the final product of the subassembly process. And the process has a different number of workstations, operators, and installation components. Therefore, a good balance line increases the efficiency of the sewing section production line [5]. In the production of clothing, responsible would have been able to check whether the assembly work will be completed in time for delivery, how machines and man or operators are used, if any station on the line assembly line is late it is global. To achieve this approach, the study of working time is the duration for each part to be mounted on production lines [5] and [2] activities. The assembly lines are generating production systems to meet the humanity needs that have been growing day by day. The goals of these systems produce products that have high production rates in the shortest time, in a more productive, economical and quality manner. The purpose of the case study was to design the assembly chain to achieve maximum line efficiency using the optimum machine working time for constant cycle time [6]. Line Balancing is commonly used to solve problems that have occurred in the assembly line. Line balancing is a technique to minimize the distance between workers and workload in order to achieve the desired flow rate [7]. This can be done by equating the amount of work at each station and assigning the least number of workers to the particular workstation. A line balancing can be classified into three categories according to the numbers Mounted on the line and in accordance with the rhythm of line [8] and [7] are models; Single line Model: - can be described as a line that combines a single model. This line produces many units of an unchanged product. The tasks performed at each station are the same for all units. Products with strong demand are destined for this line [9]. Mixed model line: - Mixed model line is producing more than one model. They are made simultaneously on the same line. Once a model is running at a station, other products are made in other seasons. Therefore, each station is equipped to perform various operations necessary to produce any model that moves through it. Many consumer products are assembled in Mixed Model [3].
©IEOM society international 229
Proceedings of the International Conference on Industrial Engineering and Operations Management Bogota, Colombia, October 25-26, 2017
Batch line: - This line produces every batch model. Typically, the workstations are set to produce the required quantity of the first model then stations are rebuilt to produce another model. The products are often assembled in batches required when the average. It is cheaper to use a mounting chain to produce various batch products to build a separate line for each model. The research will take place in the field applied a mixed model line. Simulation is one of the tools that have been widely used in various sectors and manufacturing. Using a valid simulation model gives numerous benefits and benefits in creating better manufacturing in order to improve system performance simulation models are used to identify bottlenecks in the production line and evaluate a few proposed solutions [9].Systems simulation modeling objectives are producing products that have high production rates in the shortest time in a more productive, economical and agreed manner. An assembly line garment was selected and simulated using Arena simulation and statistical methods to solve the balanced problem [6] have been used. Most Ethiopian textile factories could have been low in productivity and therefore less competitive in the world market due to delays in delivering products to customers. The major problems facing businesses are not optimal layout design; less resource utilization is used for different products, inappropriate line balancing. Therefore, because of those problems the company has failed to meet its daily plan. In this case, the actual production of the sewing section is about 550-680 t-shirt per day with an average of 650 t-shirt its lane is 900 t-shirts per day. Overall, there is a variation between its plan and target. The issues faced in the case of study are; improper assembly balance and insufficient time standard for each product of the company generally did not use an optimal resource to achieve its goal. This study demonstrates that enough time is needed to balance line patterns and model development to increase line efficiency. In the ronny t-shirt manufacturing model there is a high WIP in some operations such as shoulder attach, sleeve attach and back top stitch and zero waiting time provided in some operations such as quality checkers, trimming and sleeve hemming in those operations the resources that assigned have below 50% utilization. The layout design is a strategic issue and has significant impact on the efficiency of a manufacturing system [9]. A good layout can be designed and productivity can be increased by appropriate assembly line balancing. [7]. Layout simulation improved the production operation of the company based on the performance measures such as increasing In-operation percentage or process efficiency, Units per Hour Produced and Resource/ Machine Utilization. It also reduced the Unproductive Time, which includes blocked time and waiting time, total distance travelled, total cycle time [10]. The objectives of the study are to optimize the layout of the garment line by improving the line balance using simulation analyses of the textile company.
To develop a simulation model layout and line balancing to the sewing section of the textile factory. To assess performance of the existing layout of the sewing. To improve the layout of the sewing section. To estimate the standard time of the products. To analyze the causes and effects of the production areas of the sewing section for not meeting their goal.
METHODOLOGY This study needs a lot of data like man power, machine capacity, machine layout, sequence of jobs, inter arrival of parts for assembling, processing time at each machine, efficiency, quality product outputs (number of defects, rework, normal) such data are used for the re-layout of the machines, balance the lines and for model the production line. Therefore; the researcher had used primary data and secondary data (documented data), and the researcher used stop watch for recording some necessary information like processing time for new products transfer time from one station to the next one. The researchers had tried to find the cause why the company did not achieve its goals is due to different material shortage like the inputs for different sections, cotton, yarn, fabric cloth or improper line balancing. So, this can be solved due to approaches like optimal layout, proper line balancing, time study and simulation approaches. Simulation model and it gives the optimal resource, and gives an alternatives or scenarios in the bounded solution with the specified schedule and will have simulated and gives different alternatives of layouts by assigning of resources for the stations. The researcher used different tools for analysis of the data that had collected from the company and interpret according to the results that get from the simulation model.Arena software: - to develop the models and measure the performance of the company, its existing and the developed model (improved) through its layout and time measurement for each component of the product with its controls, responses, constraints and objectives. Simulation methodology has eight phases [11]. Step 1: Define the Problem Which Study and Why Business Reason? Step 2: design the model that study (s) that will provide answers to who? Step 3: Designing the Conceptual Model Which strategy model (continuous, discrete and mixed) will be used and at what level of detail? Step 4: Formulate inputs, hypothesis, and process definition which study hypothesis is based on and what production factors and process definition will guide the model?
©IEOM society international 230
Proceedings of the International Conference on Industrial Engineering and Operations Management Bogota, Colombia, October 25-26, 2017
Step 5: Build, verify, and validate the model is the model properly built (check)? Is the correct model built (validation)? Step 6: Experimenting with the Model What Do Think of Modeling? Step 7: Document and Present the Precious Experience Results What is the Basis for Future Work? Step 8: Define the Lifecycle Model Can the model provide long-term benefits, throughout or throughout training, programming, system redesign, and system launch?
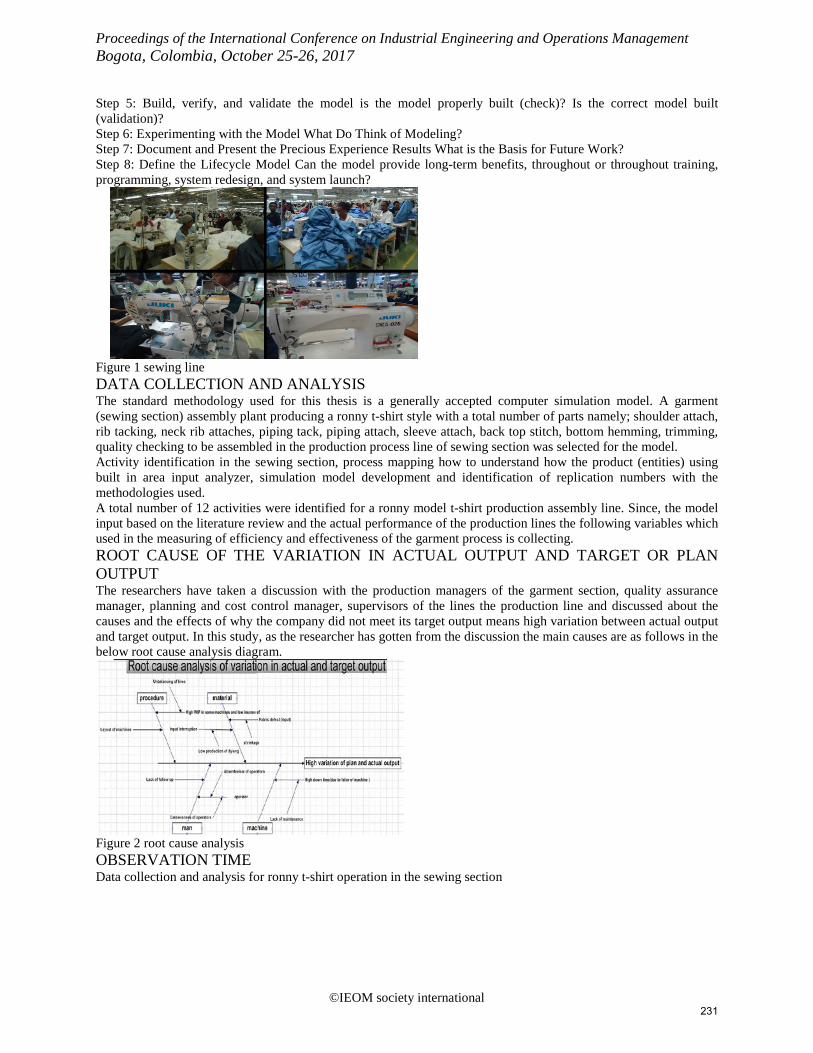
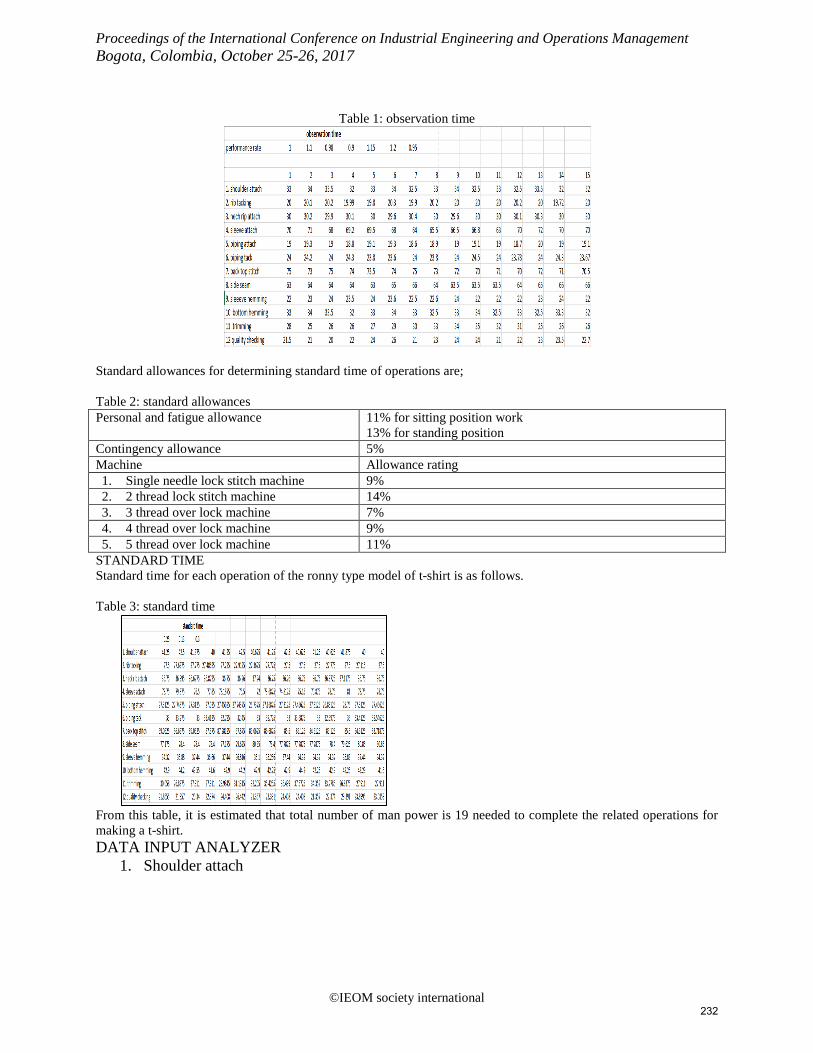
Figure 1 sewing line DATA COLLECTION AND ANALYSIS The standard methodology used for this thesis is a generally accepted computer simulation model. A garment (sewing section) assembly plant producing a ronny t-shirt style with a total number of parts namely; shoulder attach, rib tacking, neck rib attaches, piping tack, piping attach, sleeve attach, back top stitch, bottom hemming, trimming, quality checking to be assembled in the production process line of sewing section was selected for the model. Activity identification in the sewing section, process mapping how to understand how the product (entities) using built in area input analyzer, simulation model development and identification of replication numbers with the methodologies used. A total number of 12 activities were identified for a ronny model t-shirt production assembly line. Since, the model input based on the literature review and the actual performance of the production lines the following variables which used in the measuring of efficiency and effectiveness of the garment process is collecting. ROOT CAUSE OF THE VARIATION IN ACTUAL OUTPUT AND TARGET OR PLAN OUTPUT The researchers have taken a discussion with the production managers of the garment section, quality assurance manager, planning and cost control manager, supervisors of the lines the production line and discussed about the causes and the effects of why the company did not meet its target output means high variation between actual output and target output. In this study, as the researcher has gotten from the discussion the main causes are as follows in the below root cause analysis diagram.
Figure 2 root cause analysis OBSERVATION TIME Data collection and analysis for ronny t-shirt operation in the sewing section
©IEOM society international 231
Proceedings of the International Conference on Industrial Engineering and Operations Management Bogota, Colombia, October 25-26, 2017
Table 1: observation time
Standard allowances for determining standard time of operations are; Table 2: standard allowances Personal and fatigue allowance 11% for sitting position work
13% for standing position Contingency allowance 5% Machine Allowance rating 1. Single needle lock stitch machine 9% 2. 2 thread lock stitch machine 14% 3. 3 thread over lock machine 7% 4. 4 thread over lock machine 9% 5. 5 thread over lock machine 11%
STANDARD TIME Standard time for each operation of the ronny type model of t-shirt is as follows. Table 3: standard time
From this table, it is estimated that total number of man power is 19 needed to complete the related operations for making a t-shirt. DATA INPUT ANALYZER
1. Shoulder attach
©IEOM society international 232
Proceedings of the International Conference on Industrial Engineering and Operations Management Bogota, Colombia, October 25-26, 2017
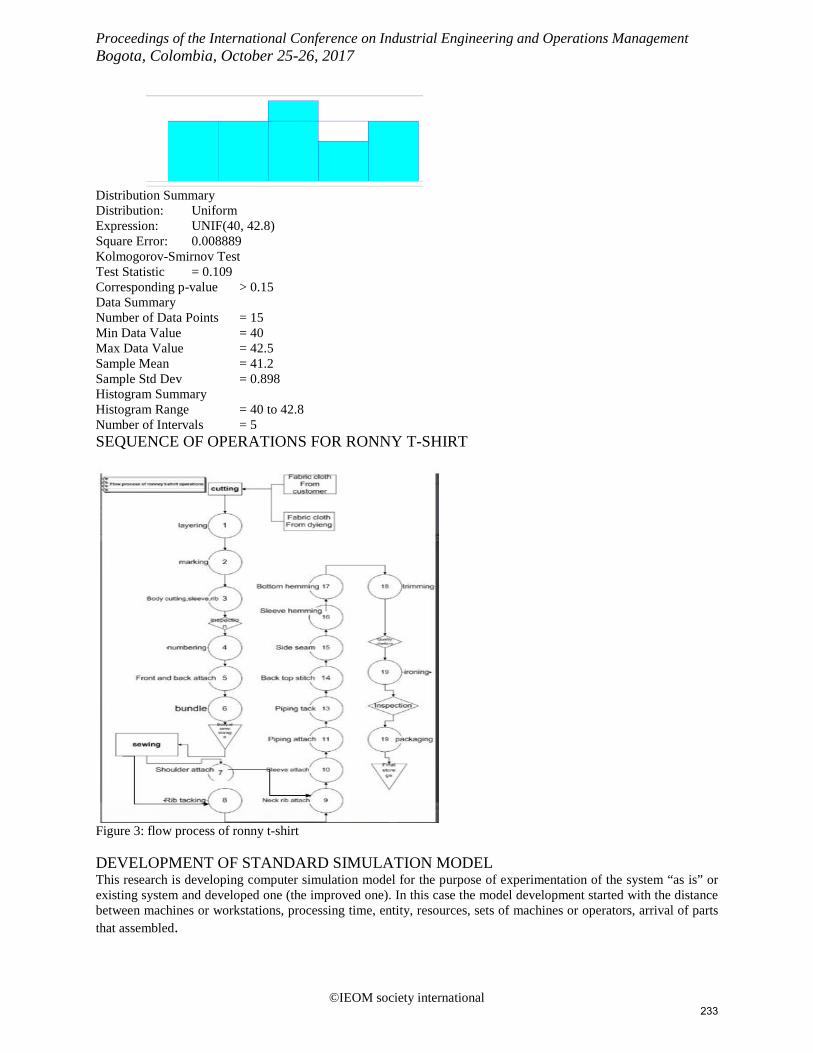
Distribution Summary Distribution: Uniform Expression: UNIF(40, 42.8) Square Error: 0.008889 Kolmogorov-Smirnov Test Test Statistic = 0.109 Corresponding p-value > 0.15 Data Summary Number of Data Points = 15 Min Data Value = 40 Max Data Value = 42.5 Sample Mean = 41.2 Sample Std Dev = 0.898 Histogram Summary Histogram Range = 40 to 42.8 Number of Intervals = 5 SEQUENCE OF OPERATIONS FOR RONNY T-SHIRT
Figure 3: flow process of ronny t-shirt DEVELOPMENT OF STANDARD SIMULATION MODEL This research is developing computer simulation model for the purpose of experimentation of the system “as is” or existing system and developed one (the improved one). In this case the model development started with the distance between machines or workstations, processing time, entity, resources, sets of machines or operators, arrival of parts that assembled.
©IEOM society international 233
Proceedings of the International Conference on Industrial Engineering and Operations Management Bogota, Colombia, October 25-26, 2017
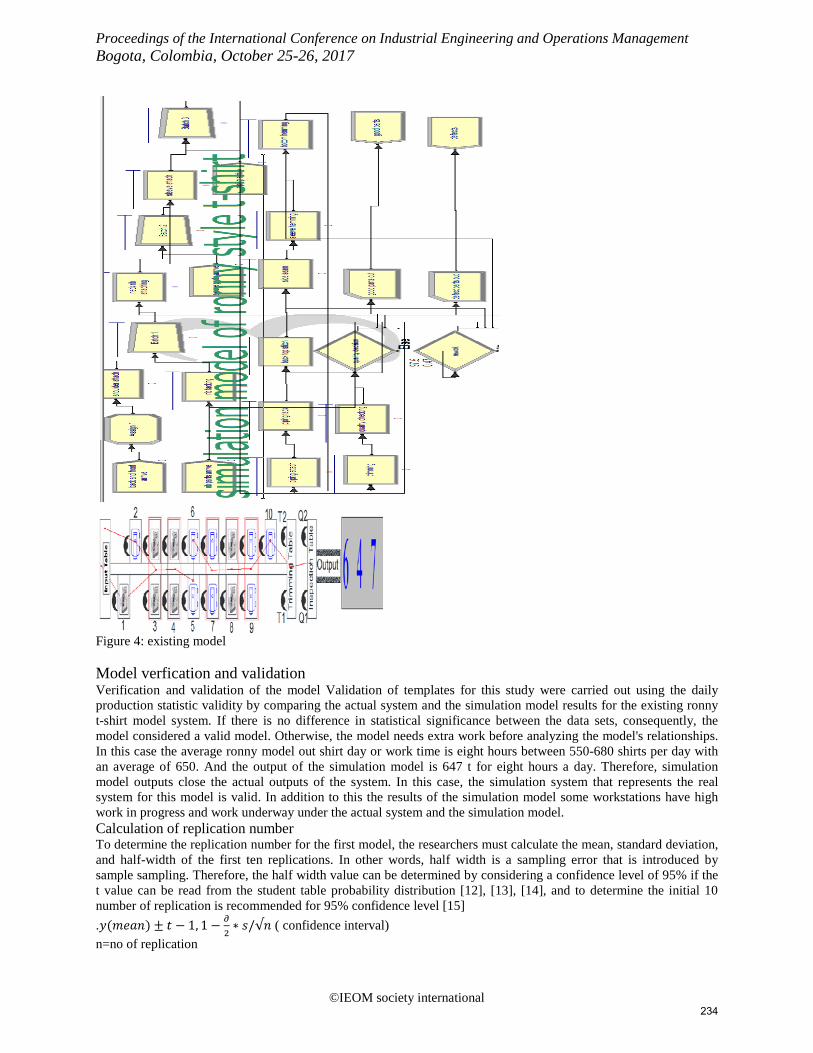
Figure 4: existing model Model verfication and validation Verification and validation of the model Validation of templates for this study were carried out using the daily production statistic validity by comparing the actual system and the simulation model results for the existing ronny t-shirt model system. If there is no difference in statistical significance between the data sets, consequently, the model considered a valid model. Otherwise, the model needs extra work before analyzing the model's relationships. In this case the average ronny model out shirt day or work time is eight hours between 550-680 shirts per day with an average of 650. And the output of the simulation model is 647 t for eight hours a day. Therefore, simulation model outputs close the actual outputs of the system. In this case, the simulation system that represents the real system for this model is valid. In addition to this the results of the simulation model some workstations have high work in progress and work underway under the actual system and the simulation model. Calculation of replication number To determine the replication number for the first model, the researchers must calculate the mean, standard deviation, and half-width of the first ten replications. In other words, half width is a sampling error that is introduced by sample sampling. Therefore, the half width value can be determined by considering a confidence level of 95% if the t value can be read from the student table probability distribution [12], [13], [14], and to determine the initial 10 number of replication is recommended for 95% confidence level [15] .𝑦𝑦(𝑚𝑚𝑚𝑚𝑚𝑚𝑚𝑚) ± 𝑡𝑡 − 1, 1 − 𝜕𝜕
2∗ 𝑠𝑠/√𝑚𝑚 ( confidence interval)
n=no of replication
©IEOM society international 234
Proceedings of the International Conference on Industrial Engineering and Operations Management Bogota, Colombia, October 25-26, 2017
y mean= sample mean s=sample standard deviation half width= tn-1,1 − 𝜕𝜕
2∗ 𝑠𝑠/√𝑚𝑚
set half width =h, solve for n=t2n-1
,1-𝜕𝜕2∗ 𝑠𝑠2/ℎ2
replace t by z , crosponding normal critical value n≅z2
1-𝜕𝜕2∗ Rs2/h2
easier but different approximation n≅noho
2/h2
s2=� �(yi−𝑦𝑦(𝑚𝑚𝑚𝑚𝑚𝑚𝑚𝑚))2𝑚𝑚−1 �
𝑛𝑛
𝑛𝑛=1
ho= half width from initial number of replication t0.975 from the table of students t distribution is 2.262. table :- mean, standard deviation and half width for initial 10 replication. ho= t10-1,(1-0.05/2)*( 4.351245/√10) =3.112477 Therefore, the percentage error for the sewing section line of the the garment section is equal to (647.4+3.112477)/647.4 =1.0048076568=0.48076568% Therefore, by using the replication number calculations n≅z2
1-𝜕𝜕2∗s2/h2 andn≅noho
2/h2 n≅noho
2/h2 n≅10*3.1124772/0.782 n≅159.229≅160 n≅z2
1-𝜕𝜕2∗s2/h2
n≅1.962* 4.3512452/0.782
n≅119.55≅120 therefore, from the two alternatives the researcher has selected the maximum number of replication that is 160. SIMULATION MODEL RUN RESULTS AND INTERPRETATION The objective of this thesis is to model the sewing line layout and balancing the activities that assebled, analyze its porformance and the finally propose an improved model to that.problems identified in this section are low throughput, high work in progress, high waiting time, which are due to low capacity utilization of resources that are machine utilization and operators utilization, unorganized flow process etc.in this case, the performance selected to analize are entitiy, process, queue and resource of the sewing section. entity performance the following points are identified from the entity performance; the wip is higher for rib parts, back and front parts, lower for piping parts. Almost all of the entities that come into the department are out due to the small mumber of processing stations
in the department The time required for qantities to wait is higher due to the large number of of queues there and additional
resource can be assigned in those stations. Processperformance from the model run results of process performance, the following points are identified. the accumulated waiting time for process like back top stitch, piping attach, piping tack, rib tacking, sleeve attach is higher their value added time. It also higher than waiting time of any other process.this means that entities at this station spend more time waiting than being processed.The accumulated waiting time in quality cheeking ,trimming , sleeve hemming are zero, therefore some resources from this station can be shared.All of quality checking,sleeve hemming, trimming stations that come to those stations are always processed fully. The least number of entities are processed in sleeve hemming station compaired to others. queue performance from the model run results of the of queue performance, the waiting time and number waiting in back top stitch, shoulder attach and sleeve attach is highest and the number waiting in of quality cheecking, sleeve hemming and trimming is zero. this result shows that, there is unbalanced allocations of resources to each station.
©IEOM society international 235
Proceedings of the International Conference on Industrial Engineering and Operations Management Bogota, Colombia, October 25-26, 2017
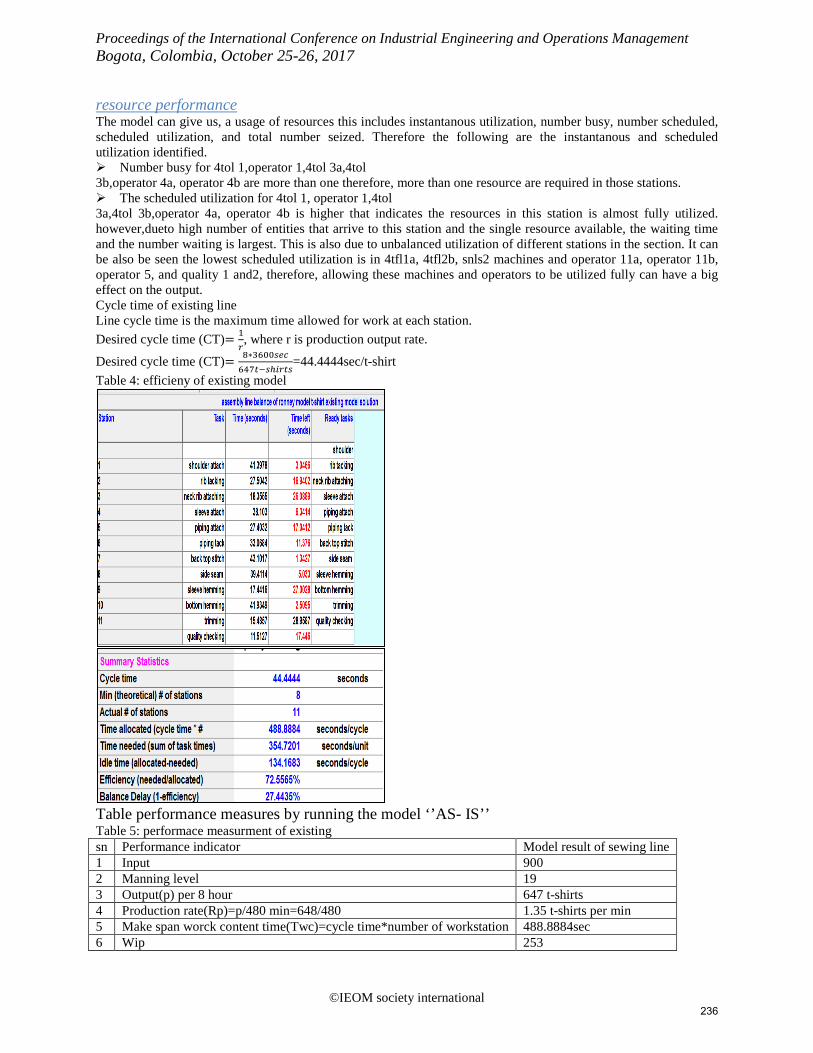
resource performance The model can give us, a usage of resources this includes instantanous utilization, number busy, number scheduled, scheduled utilization, and total number seized. Therefore the following are the instantanous and scheduled utilization identified. Number busy for 4tol 1,operator 1,4tol 3a,4tol 3b,operator 4a, operator 4b are more than one therefore, more than one resource are required in those stations. The scheduled utilization for 4tol 1, operator 1,4tol 3a,4tol 3b,operator 4a, operator 4b is higher that indicates the resources in this station is almost fully utilized. however,dueto high number of entities that arrive to this station and the single resource available, the waiting time and the number waiting is largest. This is also due to unbalanced utilization of different stations in the section. It can be also be seen the lowest scheduled utilization is in 4tfl1a, 4tfl2b, snls2 machines and operator 11a, operator 11b, operator 5, and quality 1 and2, therefore, allowing these machines and operators to be utilized fully can have a big effect on the output. Cycle time of existing line Line cycle time is the maximum time allowed for work at each station. Desired cycle time (CT)= 1
𝑟𝑟, where r is production output rate.
Desired cycle time (CT)= 8∗3600𝑠𝑠𝑠𝑠𝑠𝑠647𝑡𝑡−𝑠𝑠ℎ𝑖𝑖𝑟𝑟𝑡𝑡𝑠𝑠
=44.4444sec/t-shirt Table 4: efficieny of existing model
Table performance measures by running the model ‘’AS- IS’’ Table 5: performace measurment of existing sn Performance indicator Model result of sewing line 1 Input 900 2 Manning level 19 3 Output(p) per 8 hour 647 t-shirts 4 Production rate(Rp)=p/480 min=648/480 1.35 t-shirts per min 5 Make span worck content time(Twc)=cycle time*number of workstation 488.8884sec 6 Wip 253
©IEOM society international 236
Proceedings of the International Conference on Industrial Engineering and Operations Management Bogota, Colombia, October 25-26, 2017
7 Production efficiency(Ep)=output/input=647/900 71.89% 8 line balance efficiency=Twc/n*ct=488.8884/11*44.444 72.556% PROPOSED MODEL DEVELOPMENT In this paper, the researchers have selected one product that is the ronny model t-shirt in the garment of textile factory. The model is built based on the existing model and have analysis its performance. During the analysis, the bottlenecks were identified. The bottlenecks have identified based on resource utilization, number waiting in queue. The main bottlenecks are that resources with low utilization that is below 50% utilizations like 2nfl1a, 2nfl1b, operator11a, operator11b, operator 11a, operator11b, quality checker 1and quality checker2 and some of stations have also high waiting queue like shoulder attach, sleeve attach. In developing alternative solutions researchers have proposed and experimented with different scenarios and come up with the following optimum solutions. In today's highly competitive global situation, people are faced with many difficult decisions, such as allocating financial resources, building facilities, managing inventories, determining product mix strategies, and more. Modeling a decision problem in Arena tells you what performance measures you can expect using a certain strategy [16]. OPT QUEST A strategy can be defined as a convinced set of values for the controls. Others words for strategy include state and solution. refers to the control values (inputs to the Arena simulation), not to the resulting values of the performance measures ( responses, or outputs from the Arena simulation).If your goal were to find the best strategy (without using Opt Quest), you would have to enter the control values for one strategy you are considering into the Arena model, run the Arena simulation, analyze the results, then enter a new set of control values, run the simulation again, and so on. Often it is not clear how to adjust the controls from one simulation to the next. This type of search is tedious and, in problems with thousands or millions of potential alternatives, impractical. Opt Quest enhances Arena by programming the search for an optimal strategy. When Opt Quest is thrown, it checks the Arena model and loads information from the model, including the defined controls and responses, into its own database. The user then proceeds to express the optimization problem using Opt Quest’s boundary. Opt Quest reiterations this process, running multiple simulations. Its ultimate goal is to find the solution that optimizes (maximizes or minimizes) the value of the model’s objective. An optimization model in Opt Quest for Arena has three major fundamentals constraints, controls and objective. Controls: - Are variables or resources that can be meaningfully operated to affect the performance of a simulated system. Constraints: - Are relationships among controls and/or responses. For example, a constraint might confirm that the total amount of money allocated among various investments cannot outdo a specified amount, or at most one machine from a certain group can be selected. Objective: - Is a response or an expression used to represent the model's objective, such as minimizing queues or maximizing outputs.
©IEOM society international 237
Proceedings of the International Conference on Industrial Engineering and Operations Management Bogota, Colombia, October 25-26, 2017
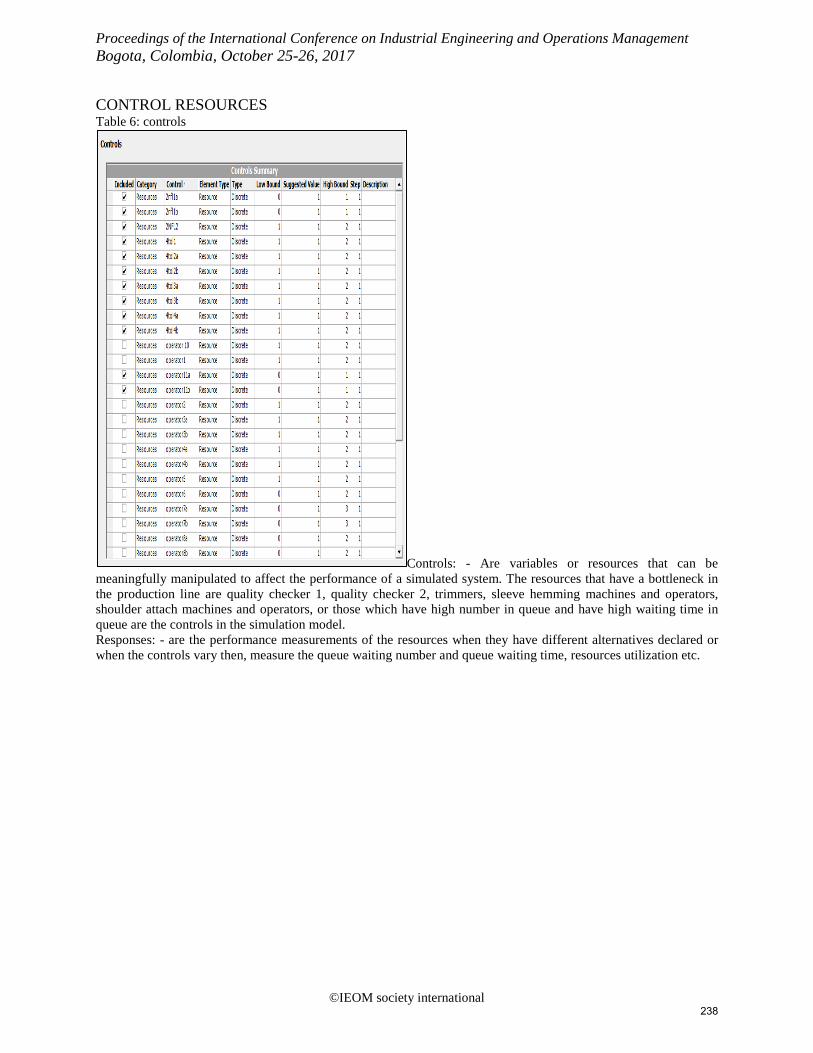
CONTROL RESOURCES Table 6: controls
Controls: - Are variables or resources that can be meaningfully manipulated to affect the performance of a simulated system. The resources that have a bottleneck in the production line are quality checker 1, quality checker 2, trimmers, sleeve hemming machines and operators, shoulder attach machines and operators, or those which have high number in queue and have high waiting time in queue are the controls in the simulation model. Responses: - are the performance measurements of the resources when they have different alternatives declared or when the controls vary then, measure the queue waiting number and queue waiting time, resources utilization etc.
©IEOM society international 238

Proceedings of the International Conference on Industrial Engineering and Operations Management Bogota, Colombia, October 25-26, 2017
CONSTRAINTS Table 7: constraints
Constraints: - Are relationships among controls and/or responses. For example, a constraint might ensure that, the total number of machines which allocated among various operations exceeds a specified amount, or at most one machine from a certain group can be selected. So, from these constraints table the sleeve hemming operation needs at least one machine to perform the operation and the number of machines that in the line must be below fifteen machines and the operators assigned for the line a maximum of nineteen in each of the production lines. OBJECTIVES Table 8: objectives
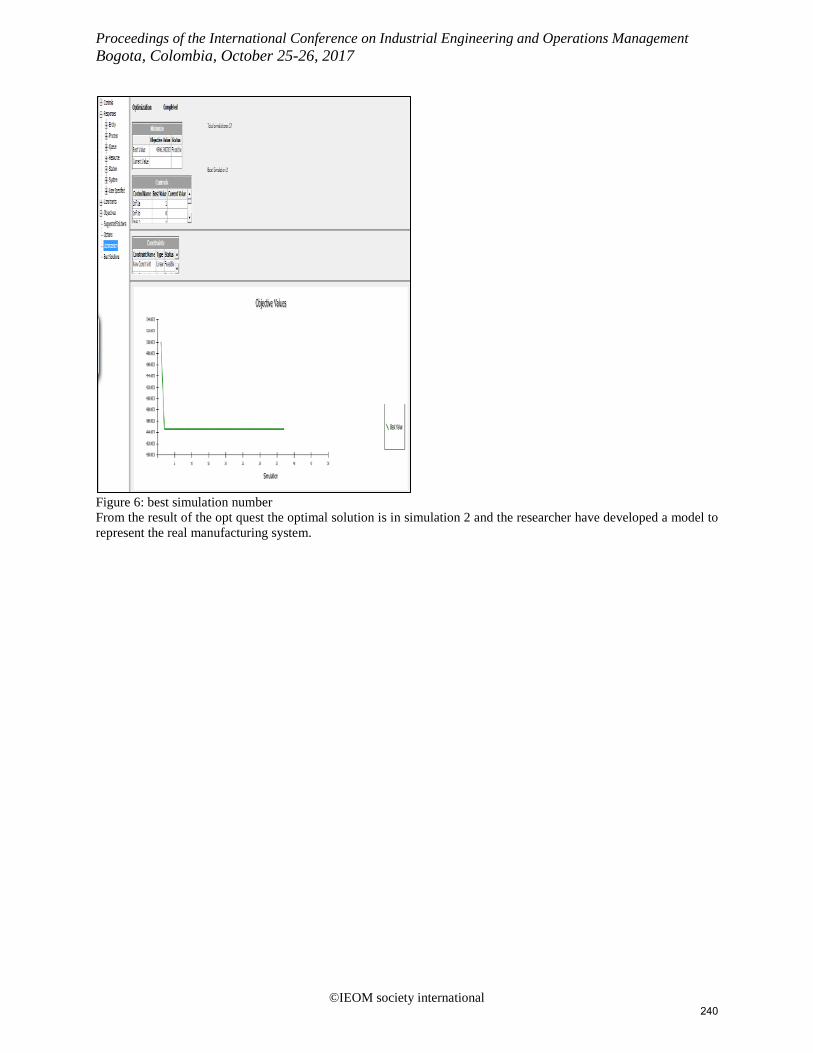
Objective: - Is a reply or an expression used to characterize the model's objective, such as minimizing queues waiting time, queue waiting number in the bottlenecks or maximizing outputs. According to [16] the number of simulations for the opt quest are 500 because there are 19 controls and the best solution is set at the first row in the grid-iron will be the best solution, the second row the second best, etc. The simulation column identifies the simulation that generated that solution. For this research, the first row shows simulation 2, the best solution is found at the 2nd simulation. The number of controls critically affects Opt Quest’s routine. Opt Quest has no bodily limit on the number of controls you can use in any given problem. However, the performance might depreciate if you use more than 100 controls. Also, as the number of controls increases, you need more simulations to find high-quality solutions.
©IEOM society international 239
Proceedings of the International Conference on Industrial Engineering and Operations Management Bogota, Colombia, October 25-26, 2017
Figure 6: best simulation number From the result of the opt quest the optimal solution is in simulation 2 and the researcher have developed a model to represent the real manufacturing system.
©IEOM society international 240
Proceedings of the International Conference on Industrial Engineering and Operations Management Bogota, Colombia, October 25-26, 2017
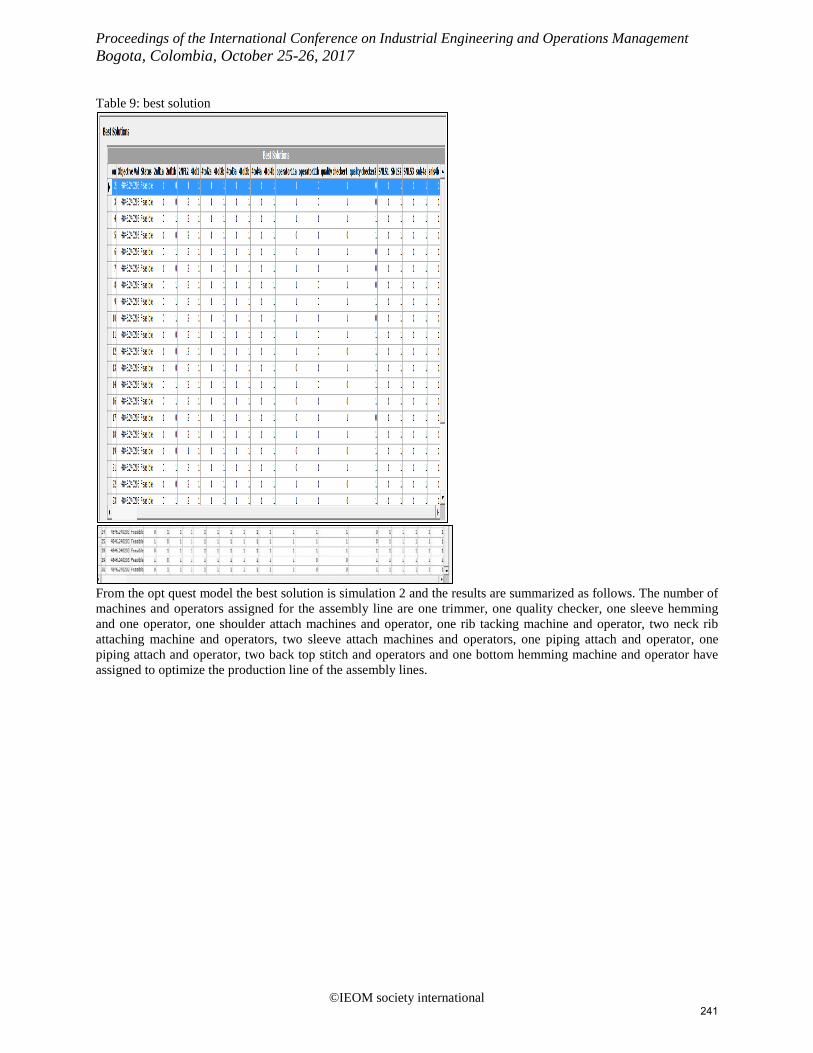
Table 9: best solution
From the opt quest model the best solution is simulation 2 and the results are summarized as follows. The number of machines and operators assigned for the assembly line are one trimmer, one quality checker, one sleeve hemming and one operator, one shoulder attach machines and operator, one rib tacking machine and operator, two neck rib attaching machine and operators, two sleeve attach machines and operators, one piping attach and operator, one piping attach and operator, two back top stitch and operators and one bottom hemming machine and operator have assigned to optimize the production line of the assembly lines.
©IEOM society international 241

Proceedings of the International Conference on Industrial Engineering and Operations Management Bogota, Colombia, October 25-26, 2017
Table 10: proposed model efficiency
Comparison of the existing and proposed model Table 11: performance measurement comparison Performance indicator Existing Proposed 1. manpower 19 16 2. number of machines 15 14 3.output (p) per 8 hour 647t-shirts 650t-shirts 4.production rate(Rp)=P/480min 1.35t-shirts/min 1.354t-shirts/min 5.make span work content time 488.8884 sec 531.6 sec 6.line balance efficiency 72.56% 75.3% 7.balance delay 27.44 24.7 8.cycle time 44.444sec 44.3sec
©IEOM society international 242
Proceedings of the International Conference on Industrial Engineering and Operations Management Bogota, Colombia, October 25-26, 2017
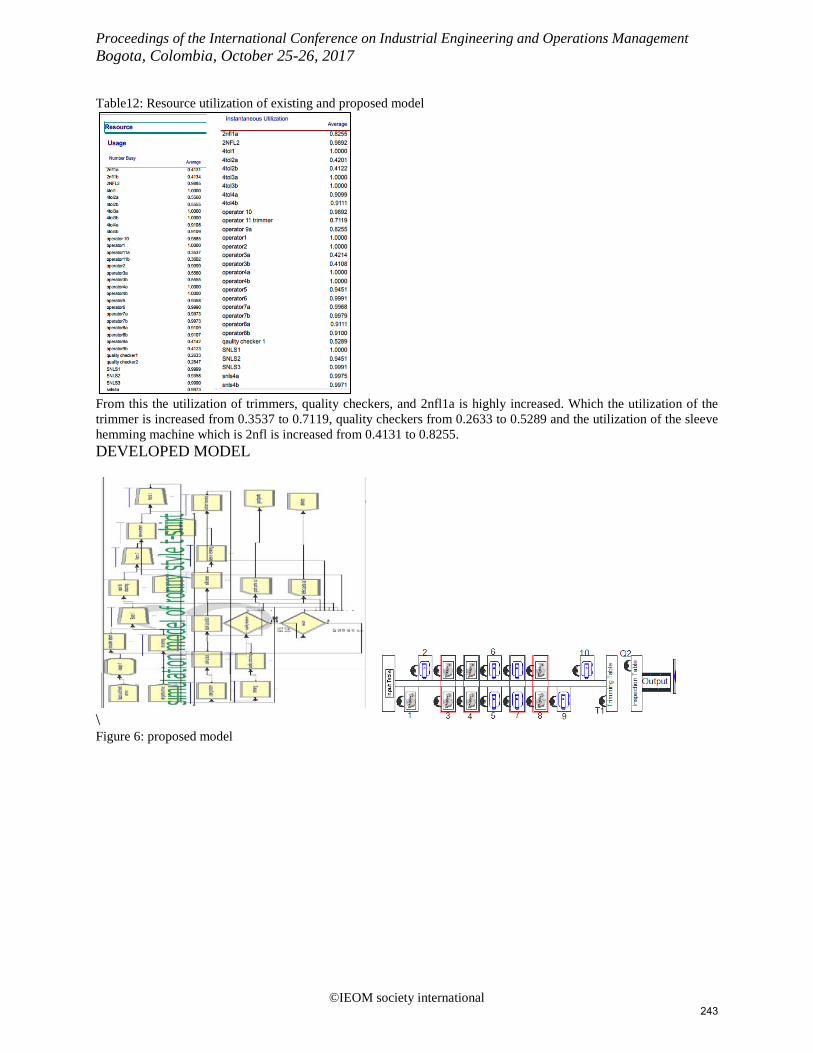
Table12: Resource utilization of existing and proposed model
From this the utilization of trimmers, quality checkers, and 2nfl1a is highly increased. Which the utilization of the trimmer is increased from 0.3537 to 0.7119, quality checkers from 0.2633 to 0.5289 and the utilization of the sleeve hemming machine which is 2nfl is increased from 0.4131 to 0.8255. DEVELOPED MODEL
\ Figure 6: proposed model
©IEOM society international 243
Proceedings of the International Conference on Industrial Engineering and Operations Management Bogota, Colombia, October 25-26, 2017
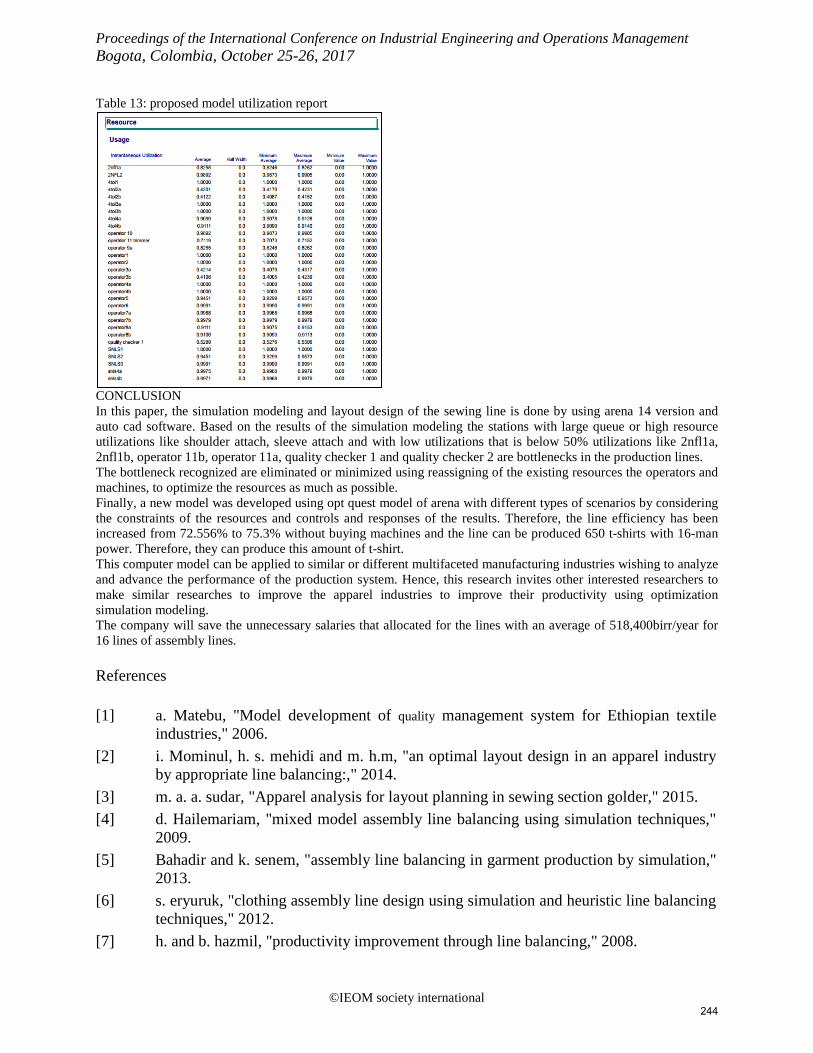
Table 13: proposed model utilization report
CONCLUSION In this paper, the simulation modeling and layout design of the sewing line is done by using arena 14 version and auto cad software. Based on the results of the simulation modeling the stations with large queue or high resource utilizations like shoulder attach, sleeve attach and with low utilizations that is below 50% utilizations like 2nfl1a, 2nfl1b, operator 11b, operator 11a, quality checker 1 and quality checker 2 are bottlenecks in the production lines. The bottleneck recognized are eliminated or minimized using reassigning of the existing resources the operators and machines, to optimize the resources as much as possible. Finally, a new model was developed using opt quest model of arena with different types of scenarios by considering the constraints of the resources and controls and responses of the results. Therefore, the line efficiency has been increased from 72.556% to 75.3% without buying machines and the line can be produced 650 t-shirts with 16-man power. Therefore, they can produce this amount of t-shirt. This computer model can be applied to similar or different multifaceted manufacturing industries wishing to analyze and advance the performance of the production system. Hence, this research invites other interested researchers to make similar researches to improve the apparel industries to improve their productivity using optimization simulation modeling. The company will save the unnecessary salaries that allocated for the lines with an average of 518,400birr/year for 16 lines of assembly lines. References [1] a. Matebu, "Model development of quality management system for Ethiopian textile
industries," 2006. [2] i. Mominul, h. s. mehidi and m. h.m, "an optimal layout design in an apparel industry
by appropriate line balancing:," 2014. [3] m. a. a. sudar, "Apparel analysis for layout planning in sewing section golder," 2015. [4] d. Hailemariam, "mixed model assembly line balancing using simulation techniques,"
2009. [5] Bahadir and k. senem, "assembly line balancing in garment production by simulation,"
2013. [6] s. eryuruk, "clothing assembly line design using simulation and heuristic line balancing
techniques," 2012. [7] h. and b. hazmil, "productivity improvement through line balancing," 2008.
©IEOM society international 244
Proceedings of the International Conference on Industrial Engineering and Operations Management Bogota, Colombia, October 25-26, 2017
[8] m. and b. azizul, "line balancing and optimization for single model assembly line at a small medium industry," 2007.
[9] k. maheshr and j. v.s., "process flow analysis of diesel engine crankshaft machining line layout," 2014.
[10] c. d. e. jocelyn and c. ma, "facility layout improvement model using ergonomics and layout simulation," 2015.
[11] m. onur and e. j.williams, "Simulation methodology, tools and applications," 2002. [12] a. yemane, "manufacturing system modeling and performance analysis using
simulation," 2013. [13] t. gorema and n. mulugeta, "Modeling and performance analysis of manufacturing
sysystems in footwear industry," 2014. [14] h. g. and B. , Simulation using promodel, second edition (herell,ghosh,Bowden, 2004,
2004. [15] k. w.david kelton, . r. p.sadowski and D. a., Simulation with arena, 2000. [16] B. allen, optquest for arena, 2012. [17] s. and b. shahfiran, "productivity improvement through line balancing technique in a
small medium enterprise (sme) manufacturing plant," 2007. [18] h. b. fredric and m. , "production system design and optimization," 2008. [19] groover, work systems: the methods, measurement and management of work, 2007. [20] m. asmelash, "modeling and simulation analysis of manufacturing systems using arena
simulation software," 2008. [21] p. k. r. k. b. habibur rahman, "Effective way to estimate the standard minute value
(SMV) of a t-shirt by work study," 2014. [22] h. ashkan, k. hamid and r. hesam, "line balancing the production line by the simulation
and statistics techniques," 2014. [23] p. prasad and r. , "design and selection of facility layout using simulation and design of
experiments," 2010. [24] h. b. fredric and m. , "production system design and optimization," 2008. [25] j. bobby and j. jenson, "analysis and simulation of factory layout using arena," 2013. Biography of the authors My name is Aregawi yemane meresa. I received my BSC degree in industrial engineering from Mekelle University, Ethiopian institute of technology- mekelle in 2013, MSC degree production engineering and management from Bahir Dar University in 2017. I am a lecturer in Bahir dar University since 2013 till now in the department of industrial engineering. My research interests are simulation, productivity, and operation research.
©IEOM society international 245